Affinity of Electrochemically Deposited Sol–Gel Silica Films towards Catecholamine Neurotransmitters


Abstract
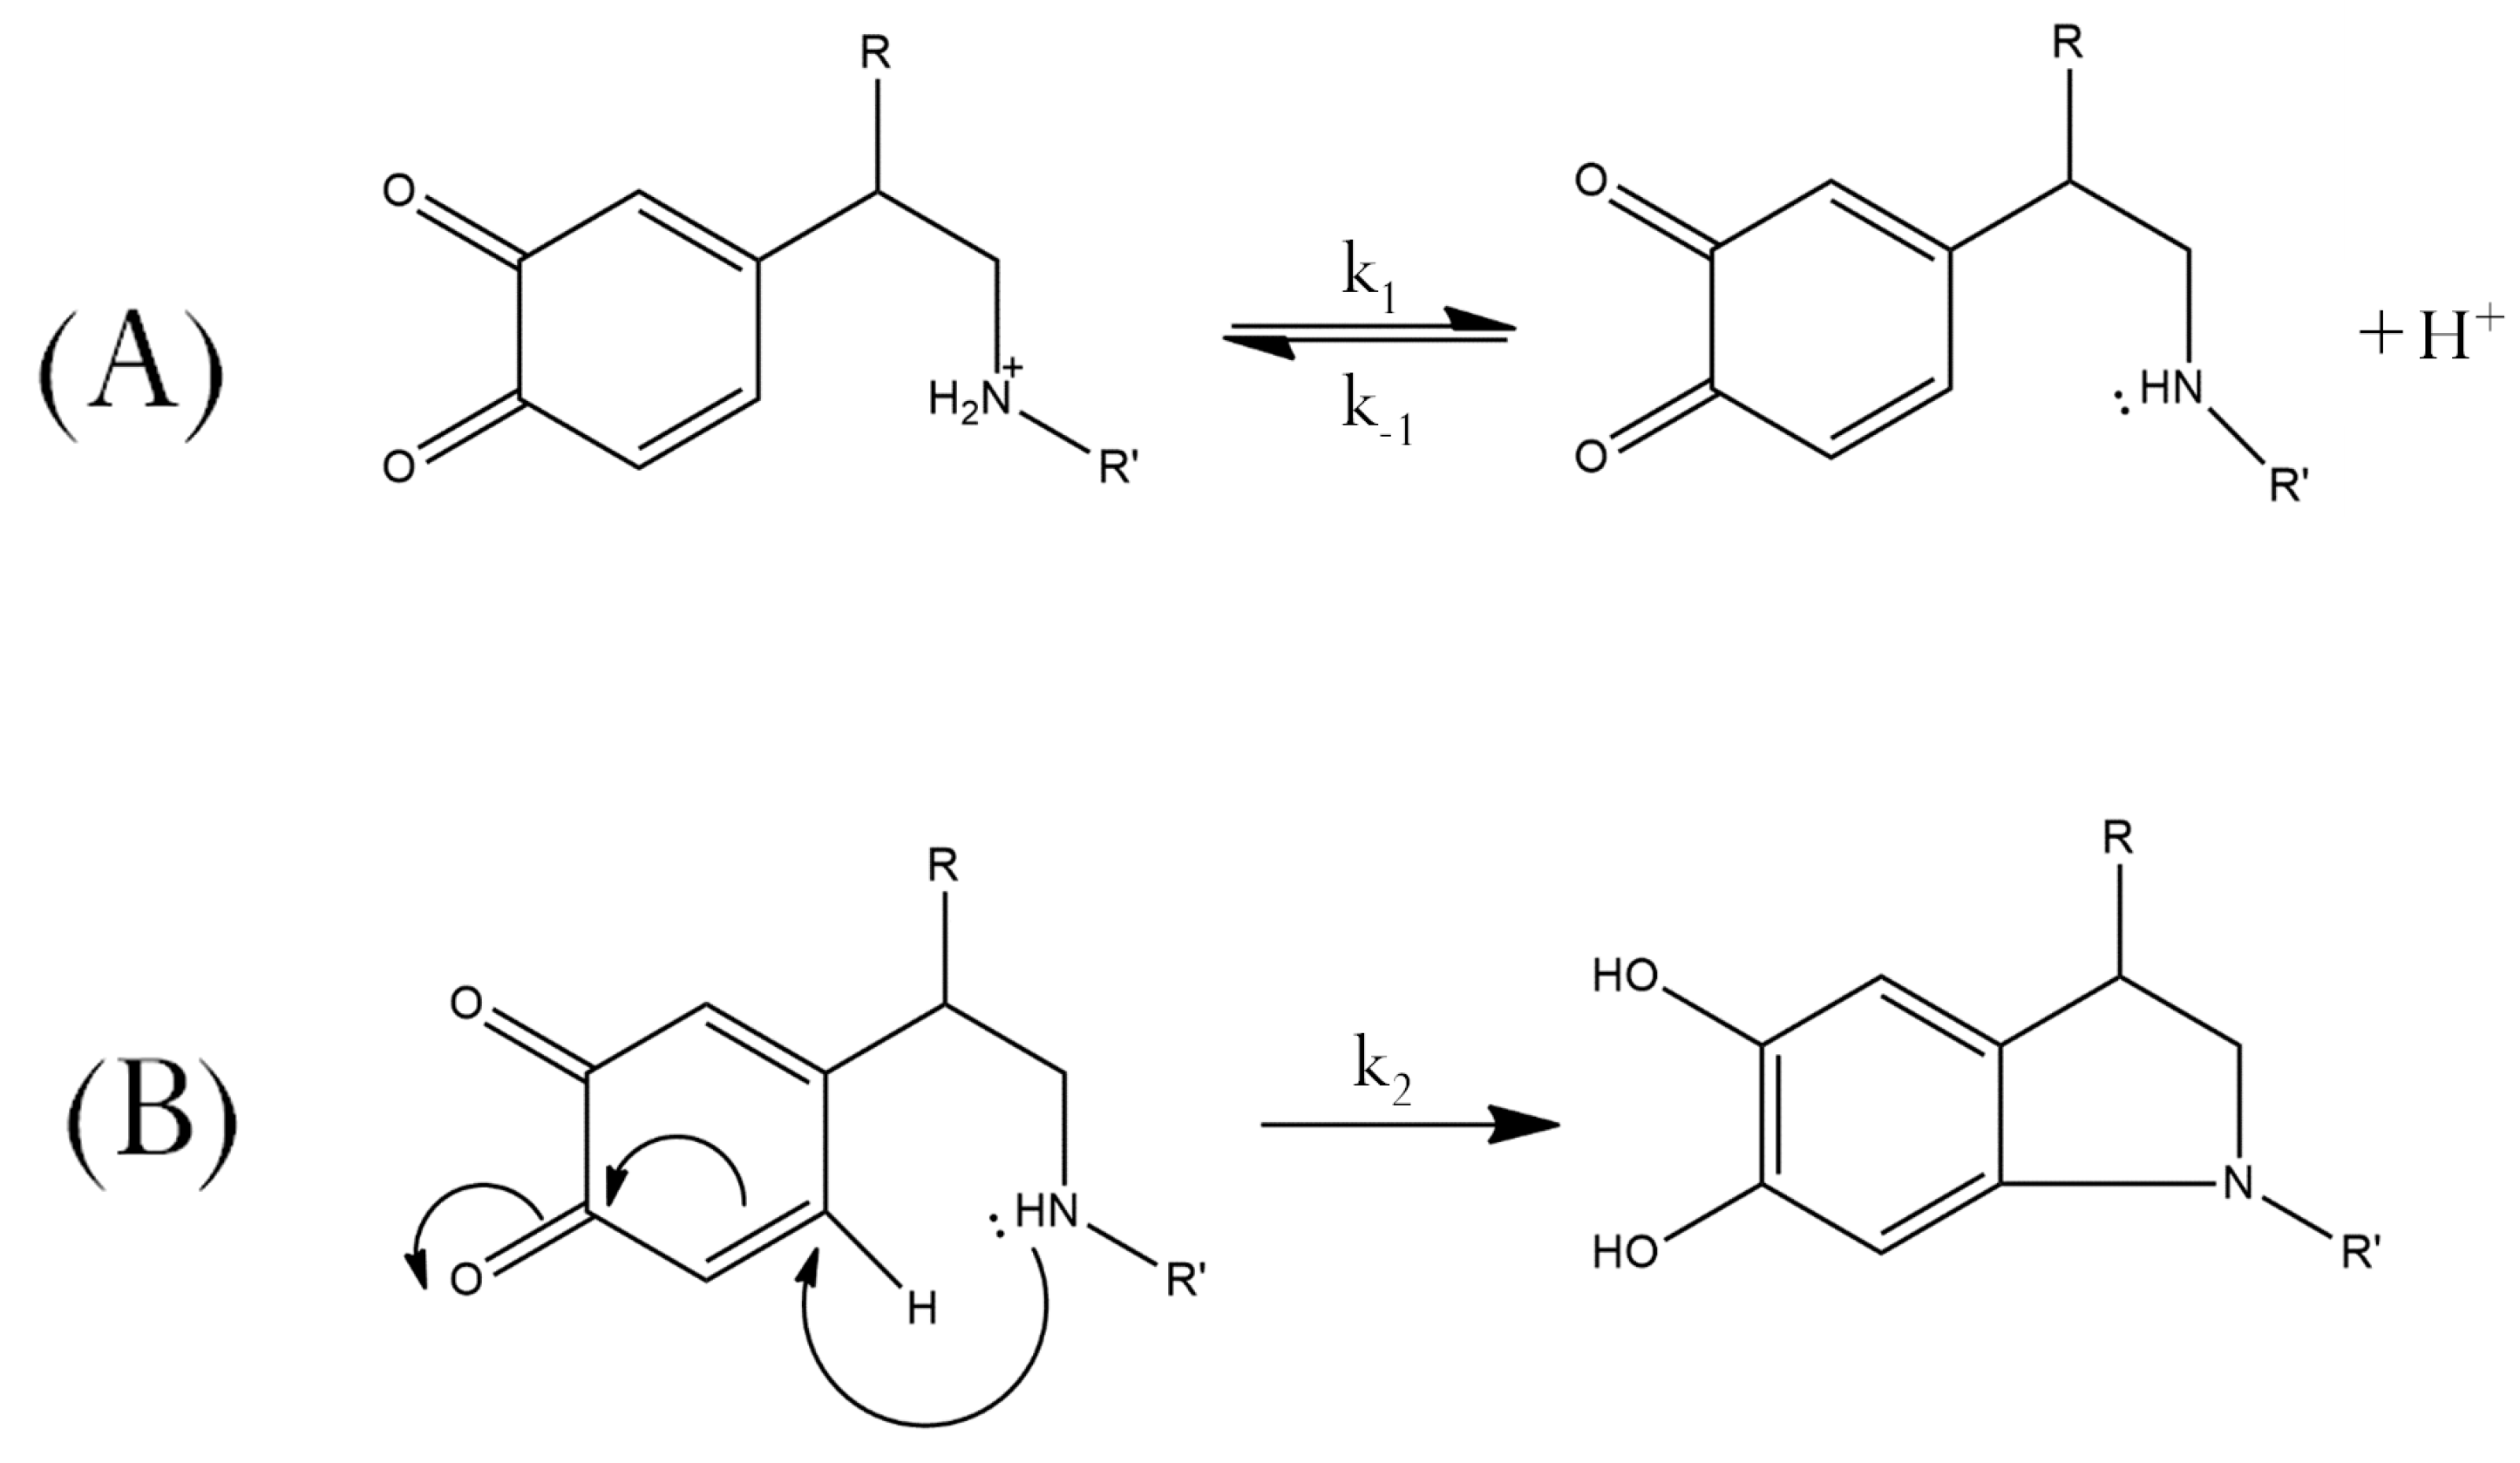
1. Introduction
2. Experimental
3. Results and Discussion
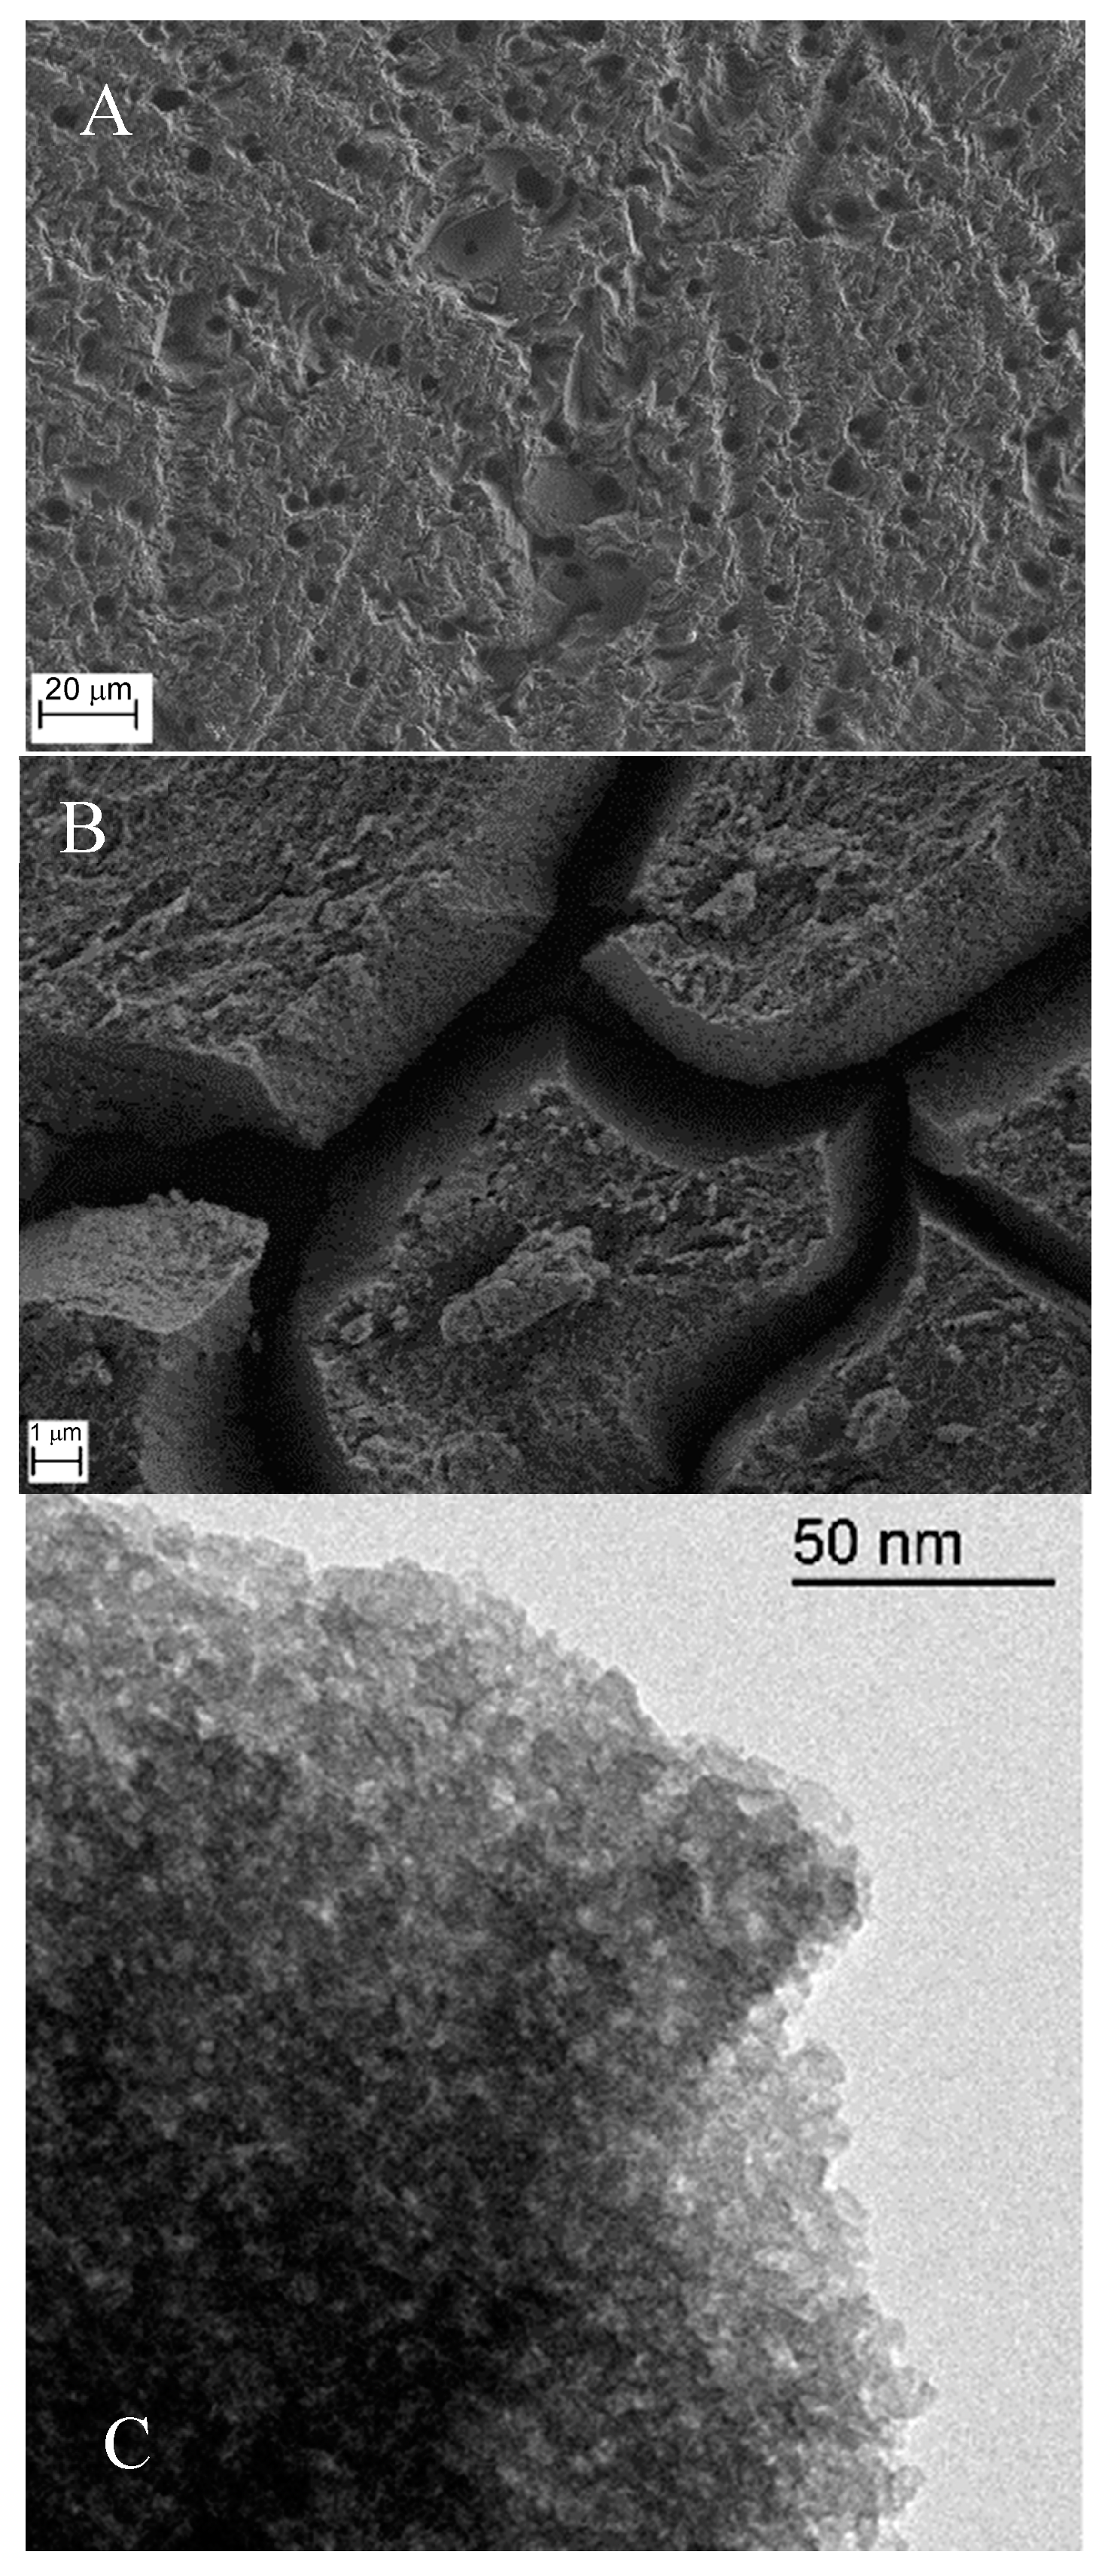
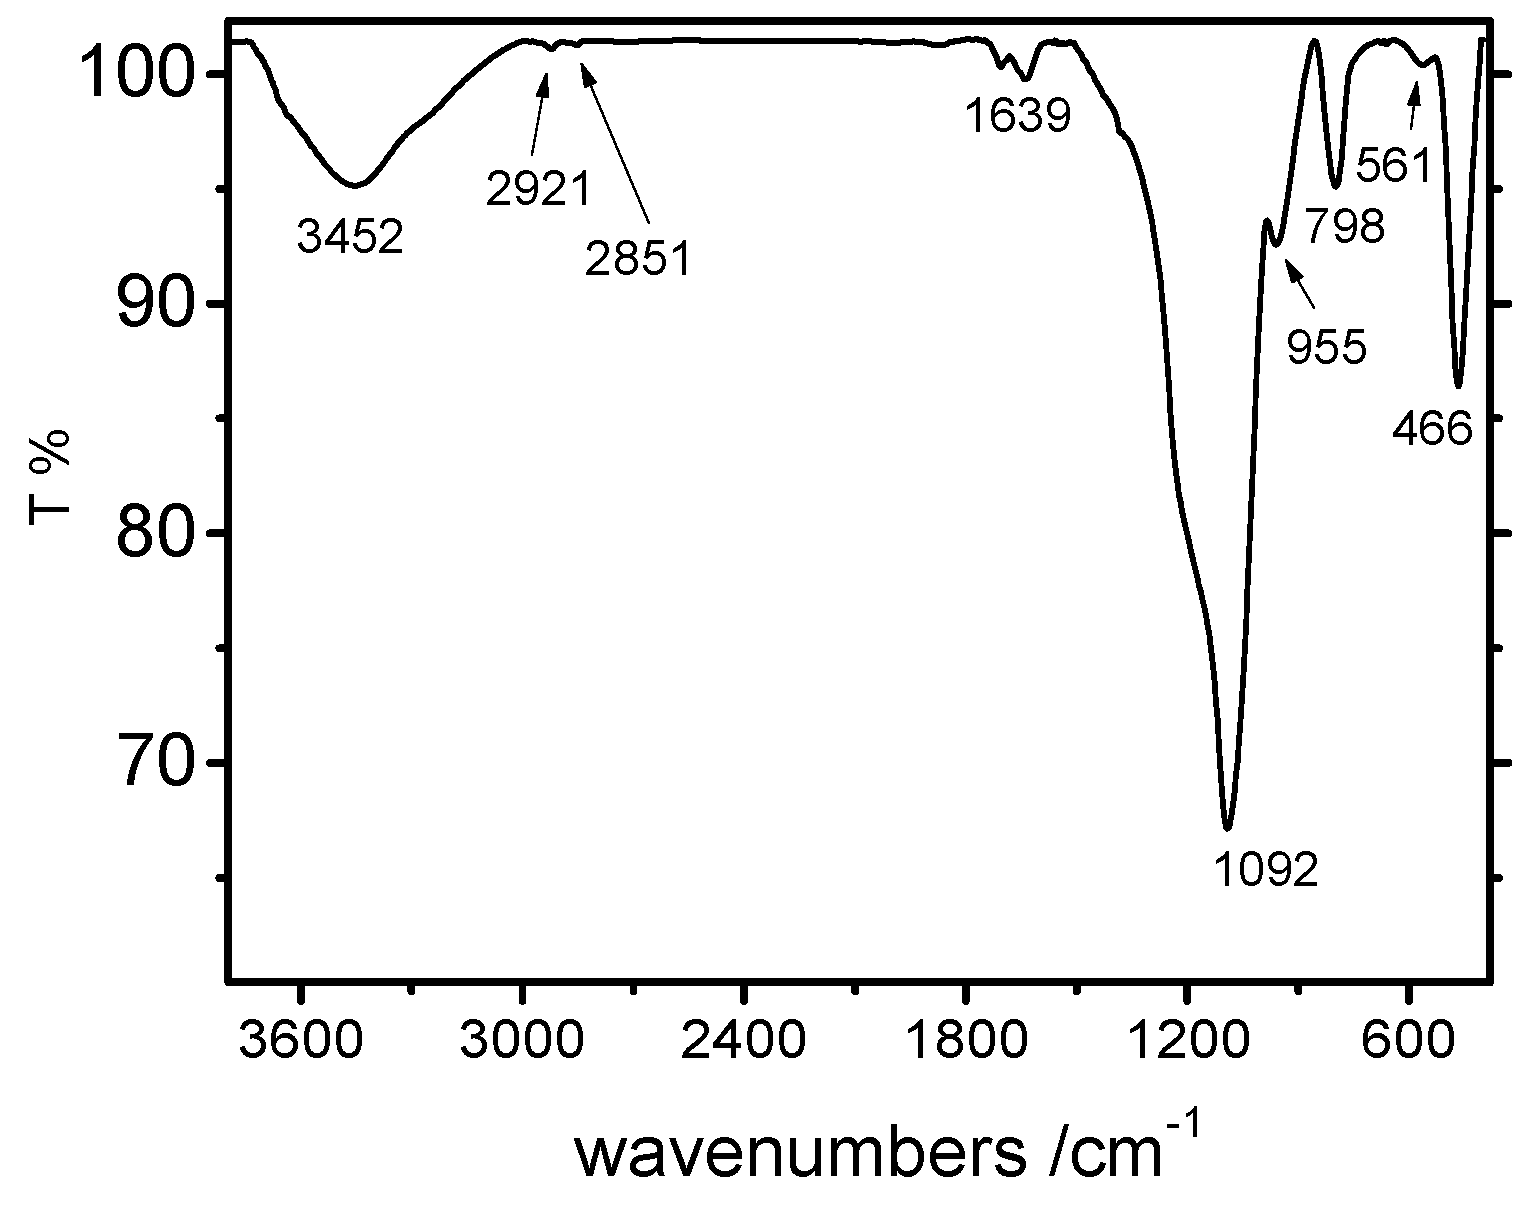
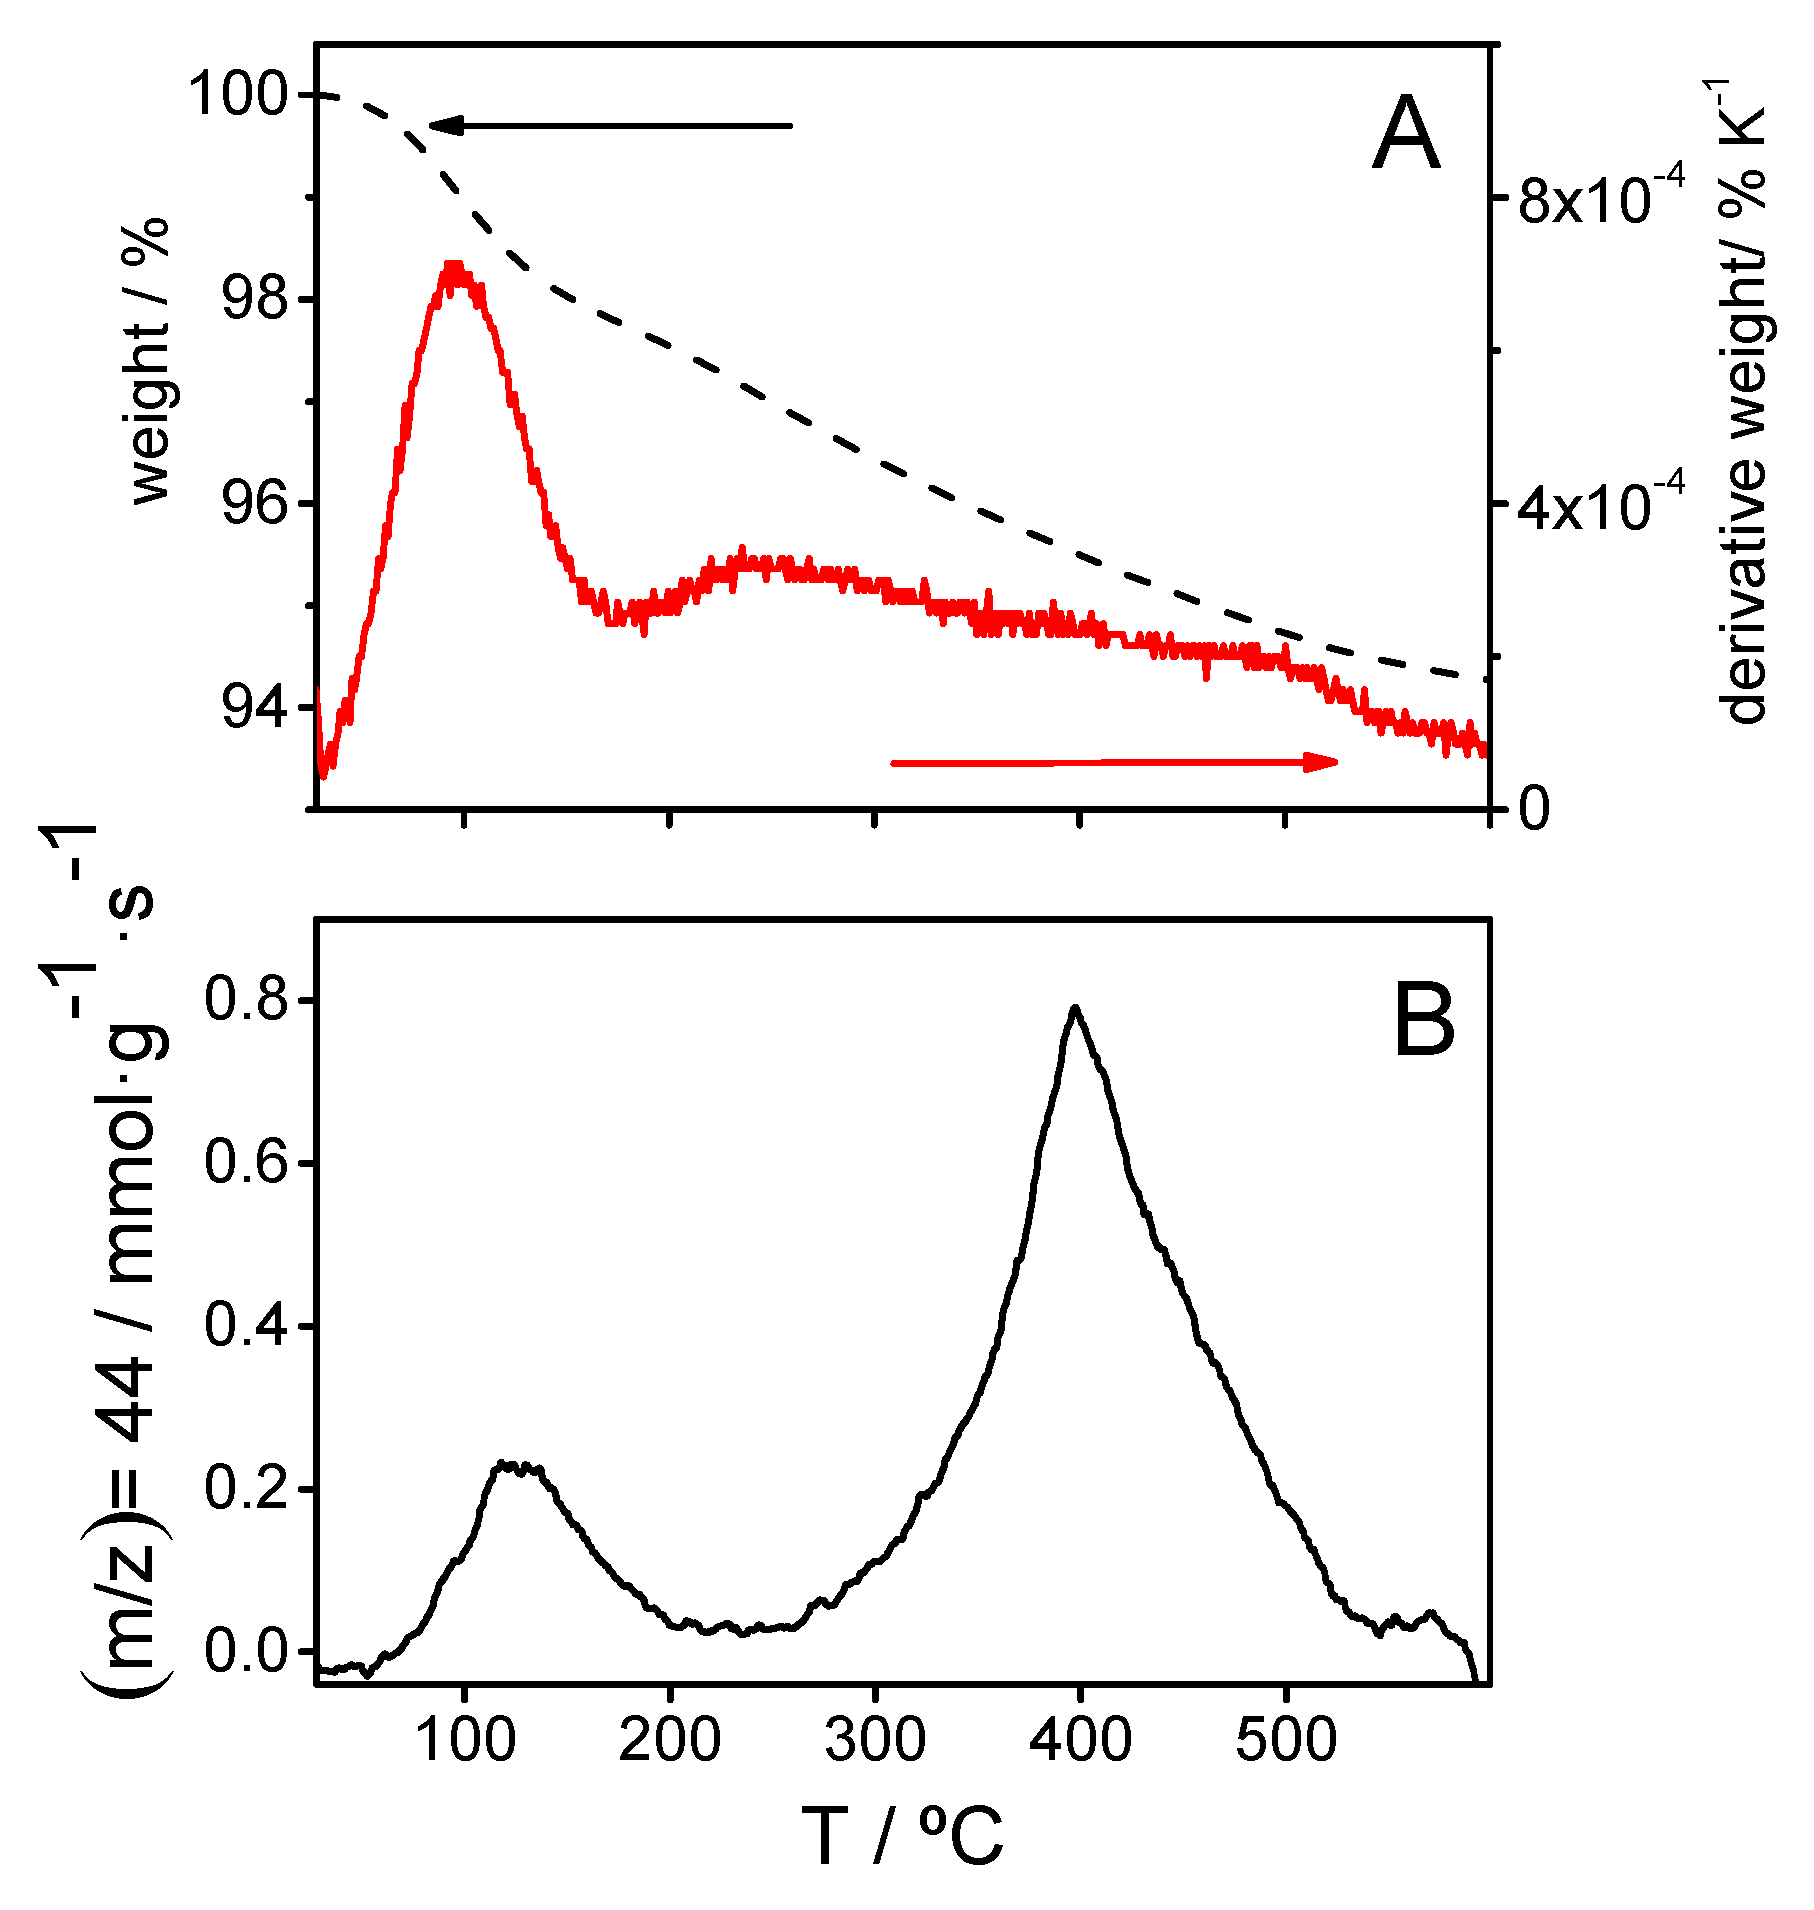
3.1. Characterization of Silica Films
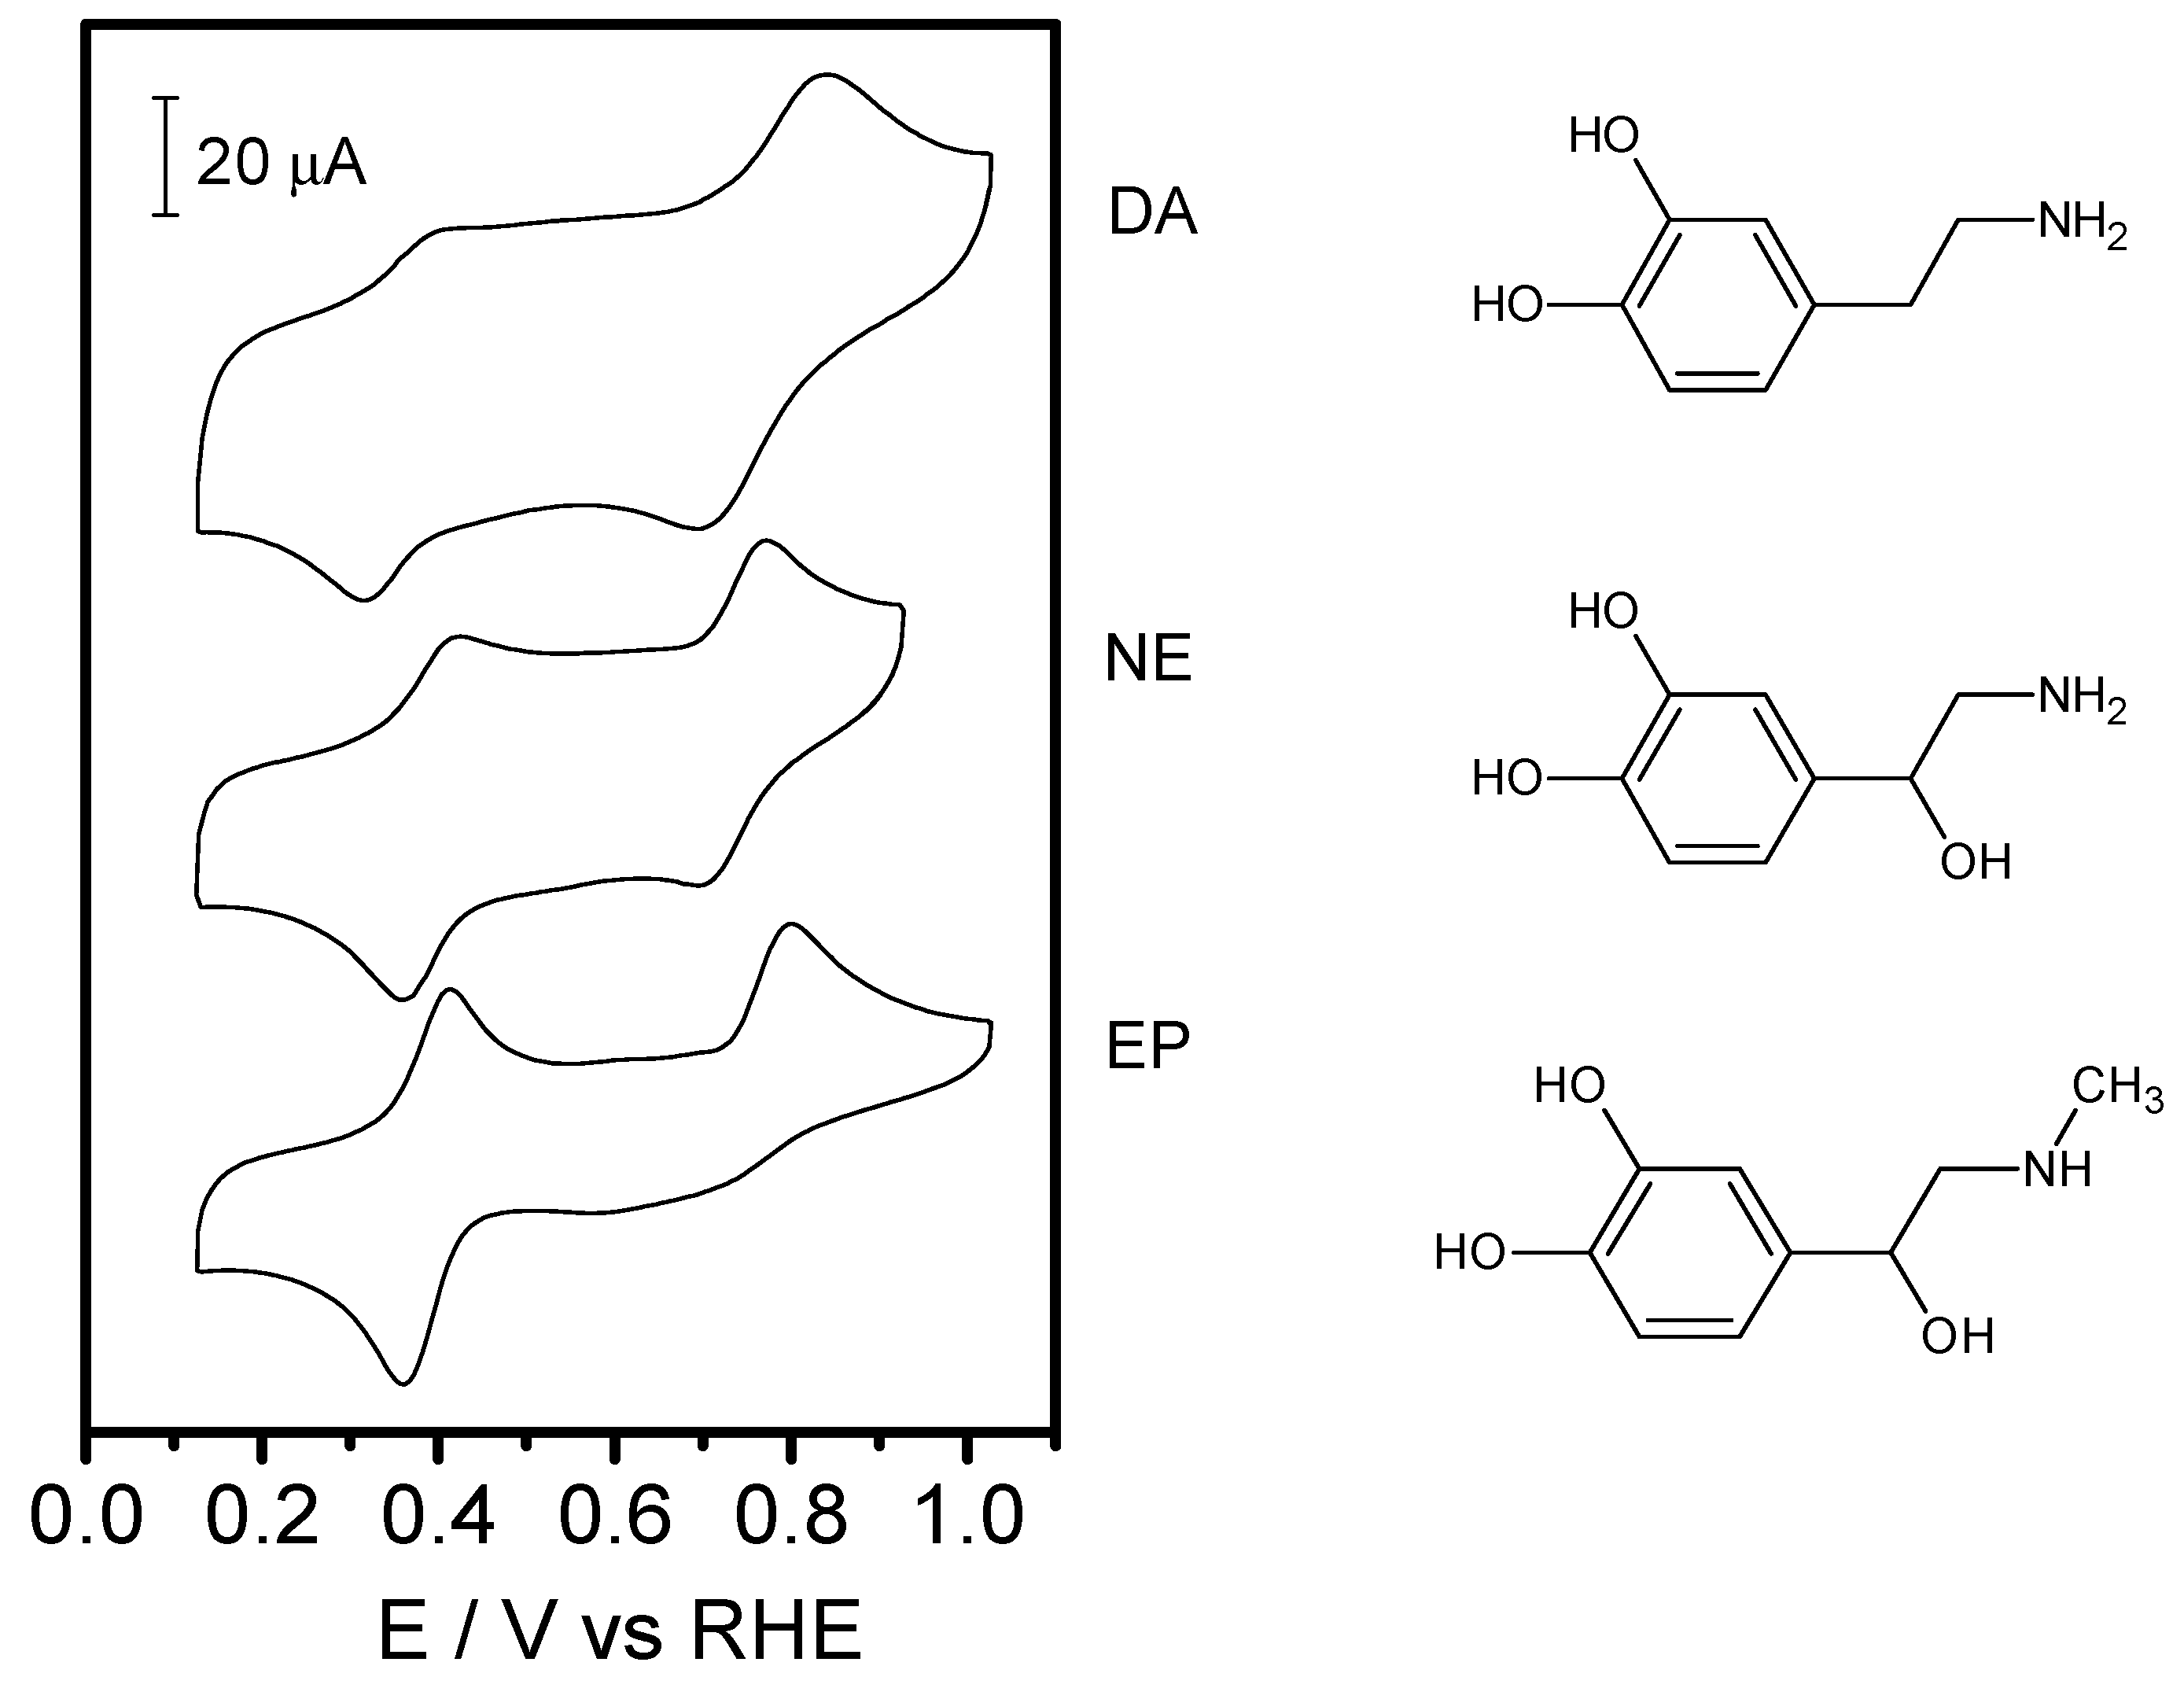
3.2. Electrochemical Behavior of Neurotransmitters on Bare GC Surfaces
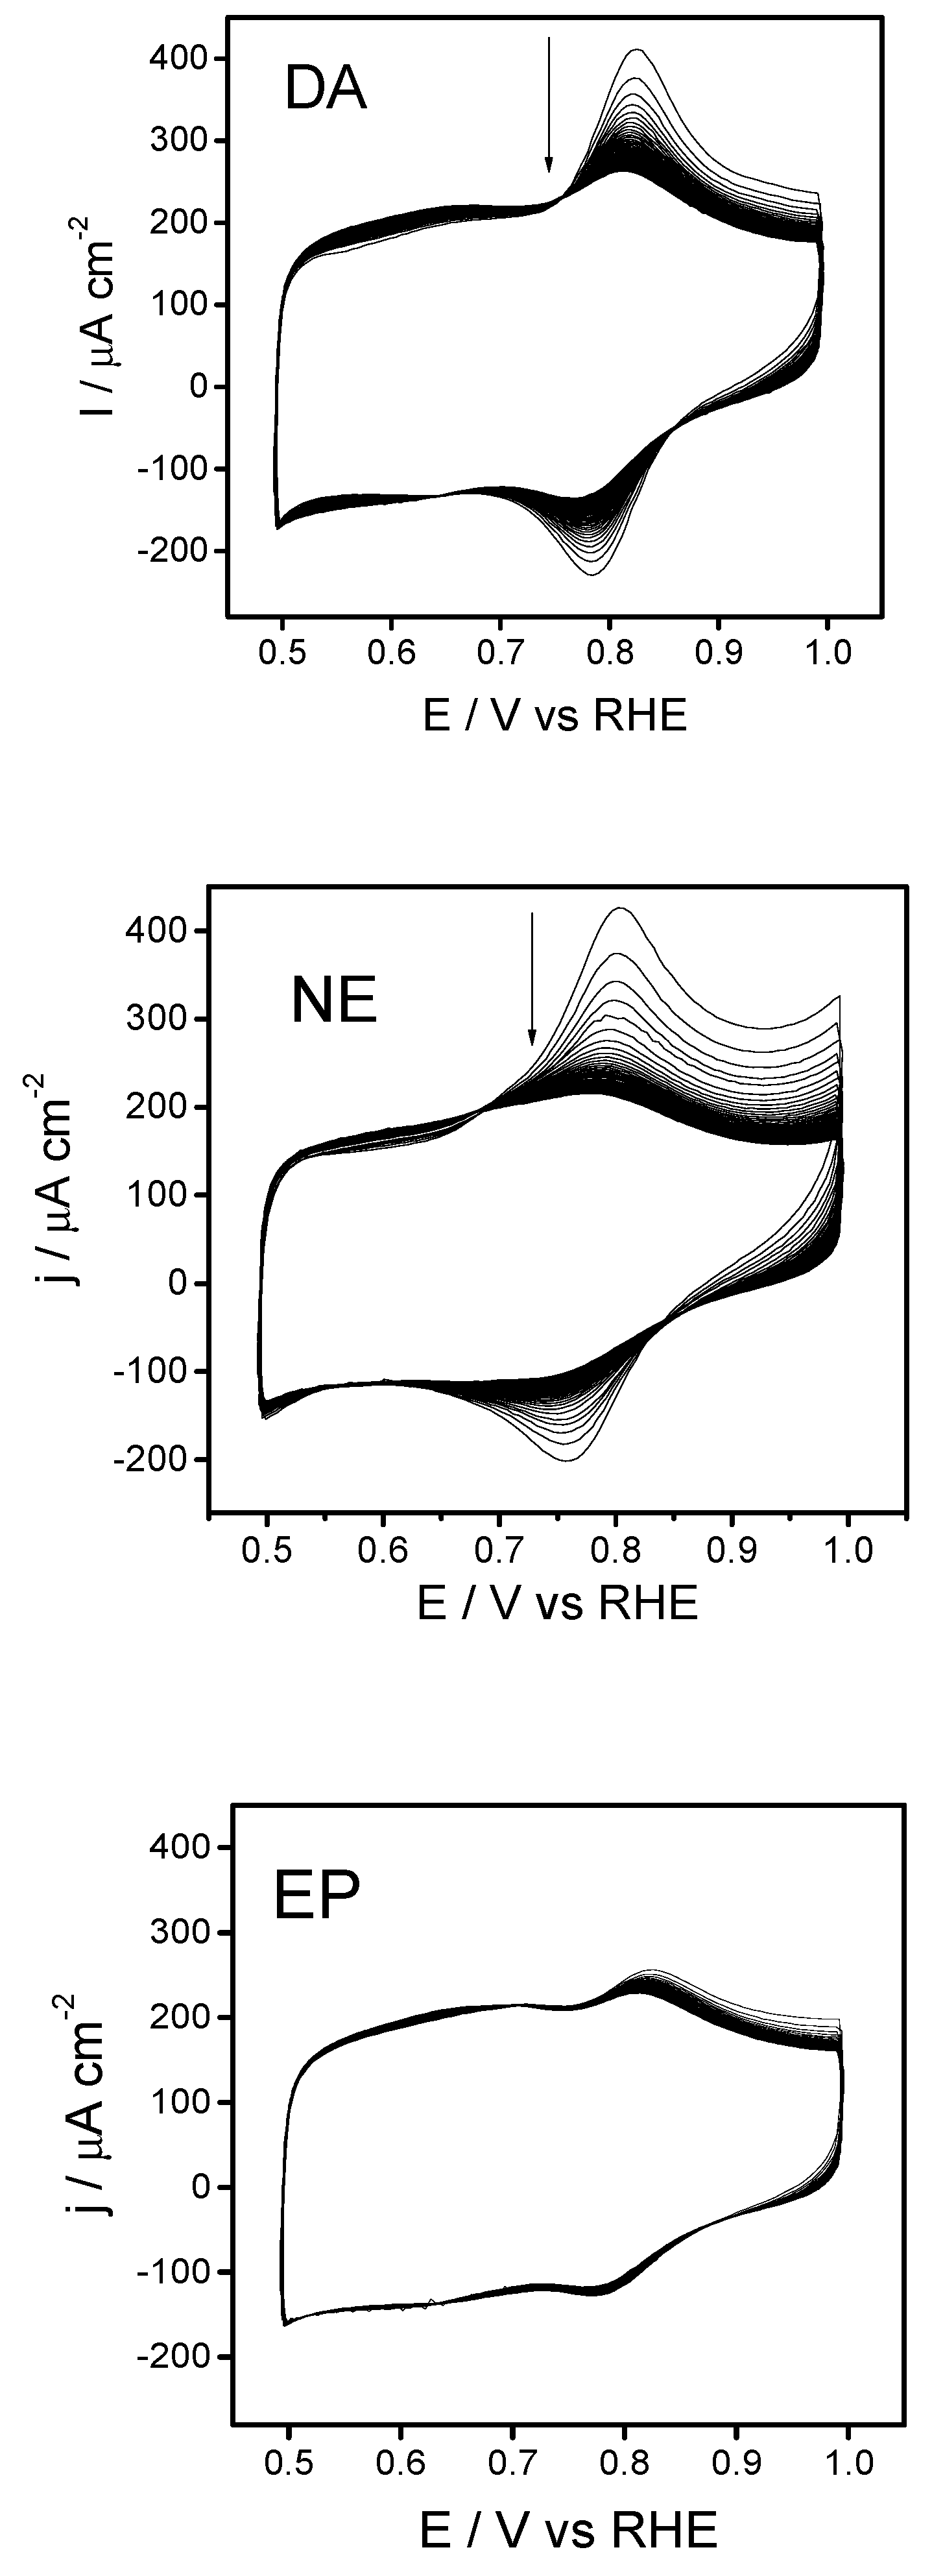
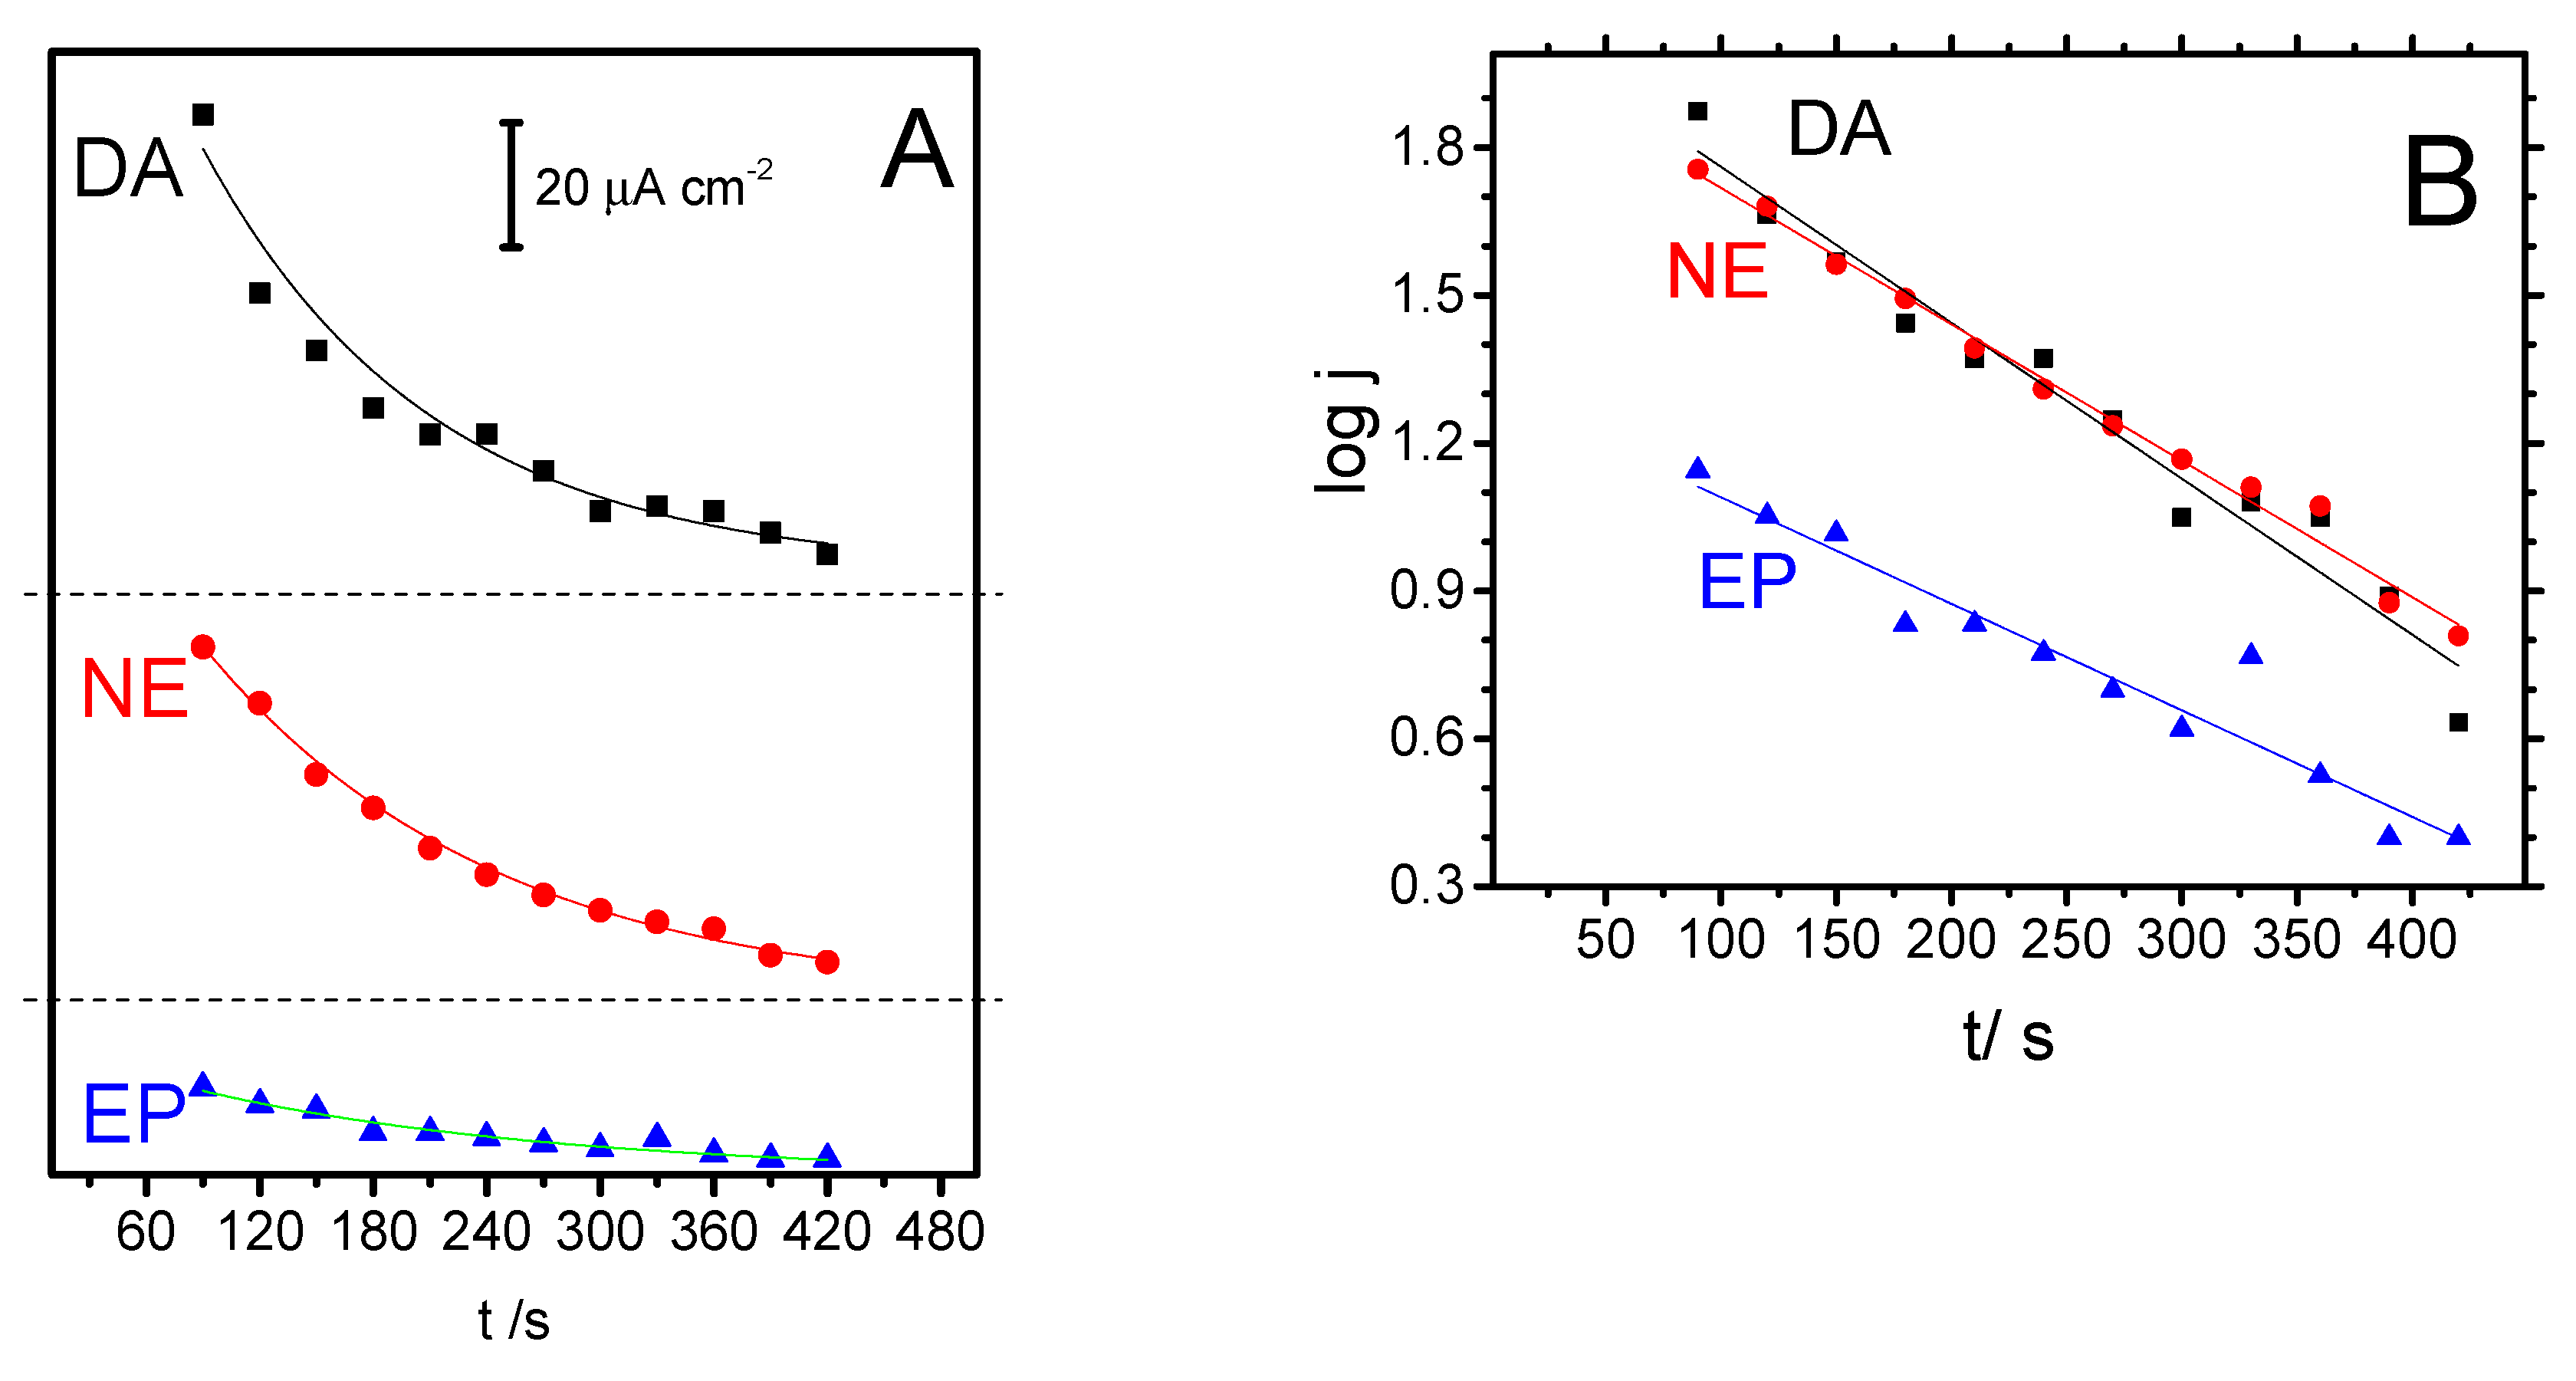
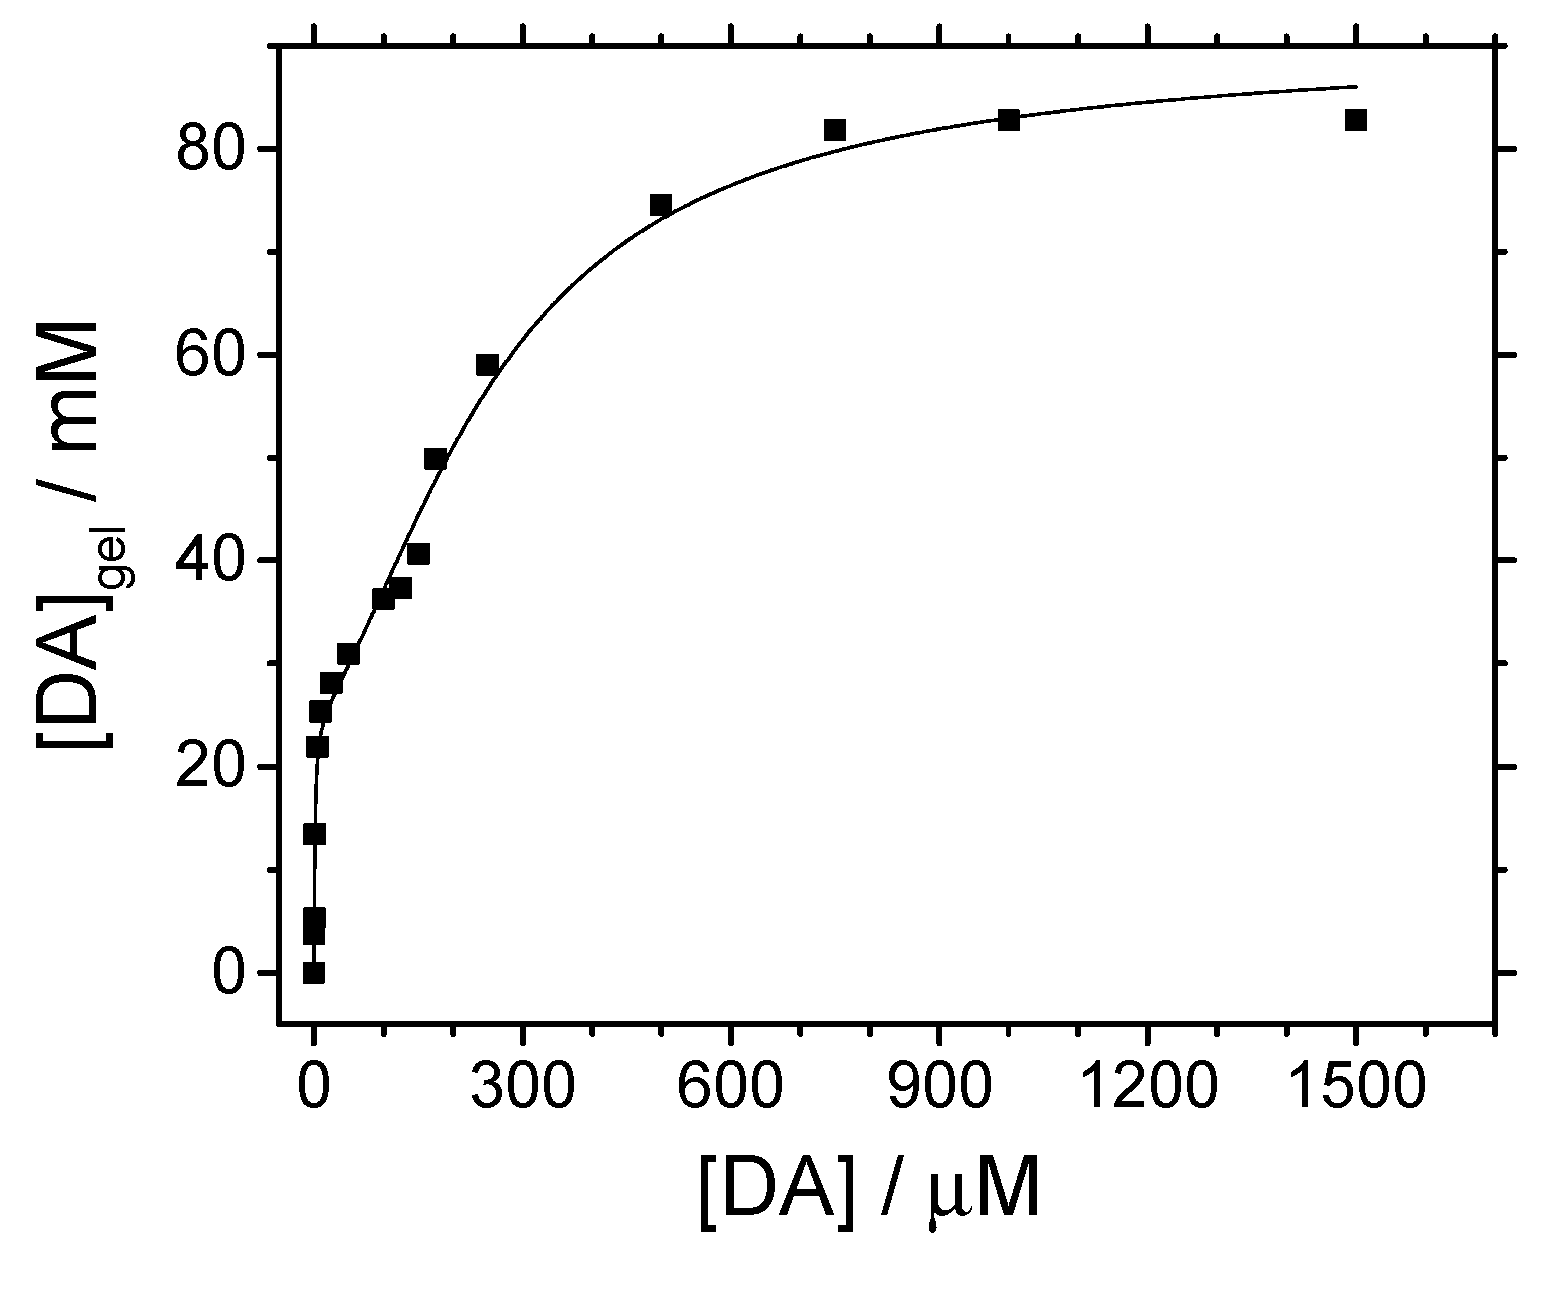
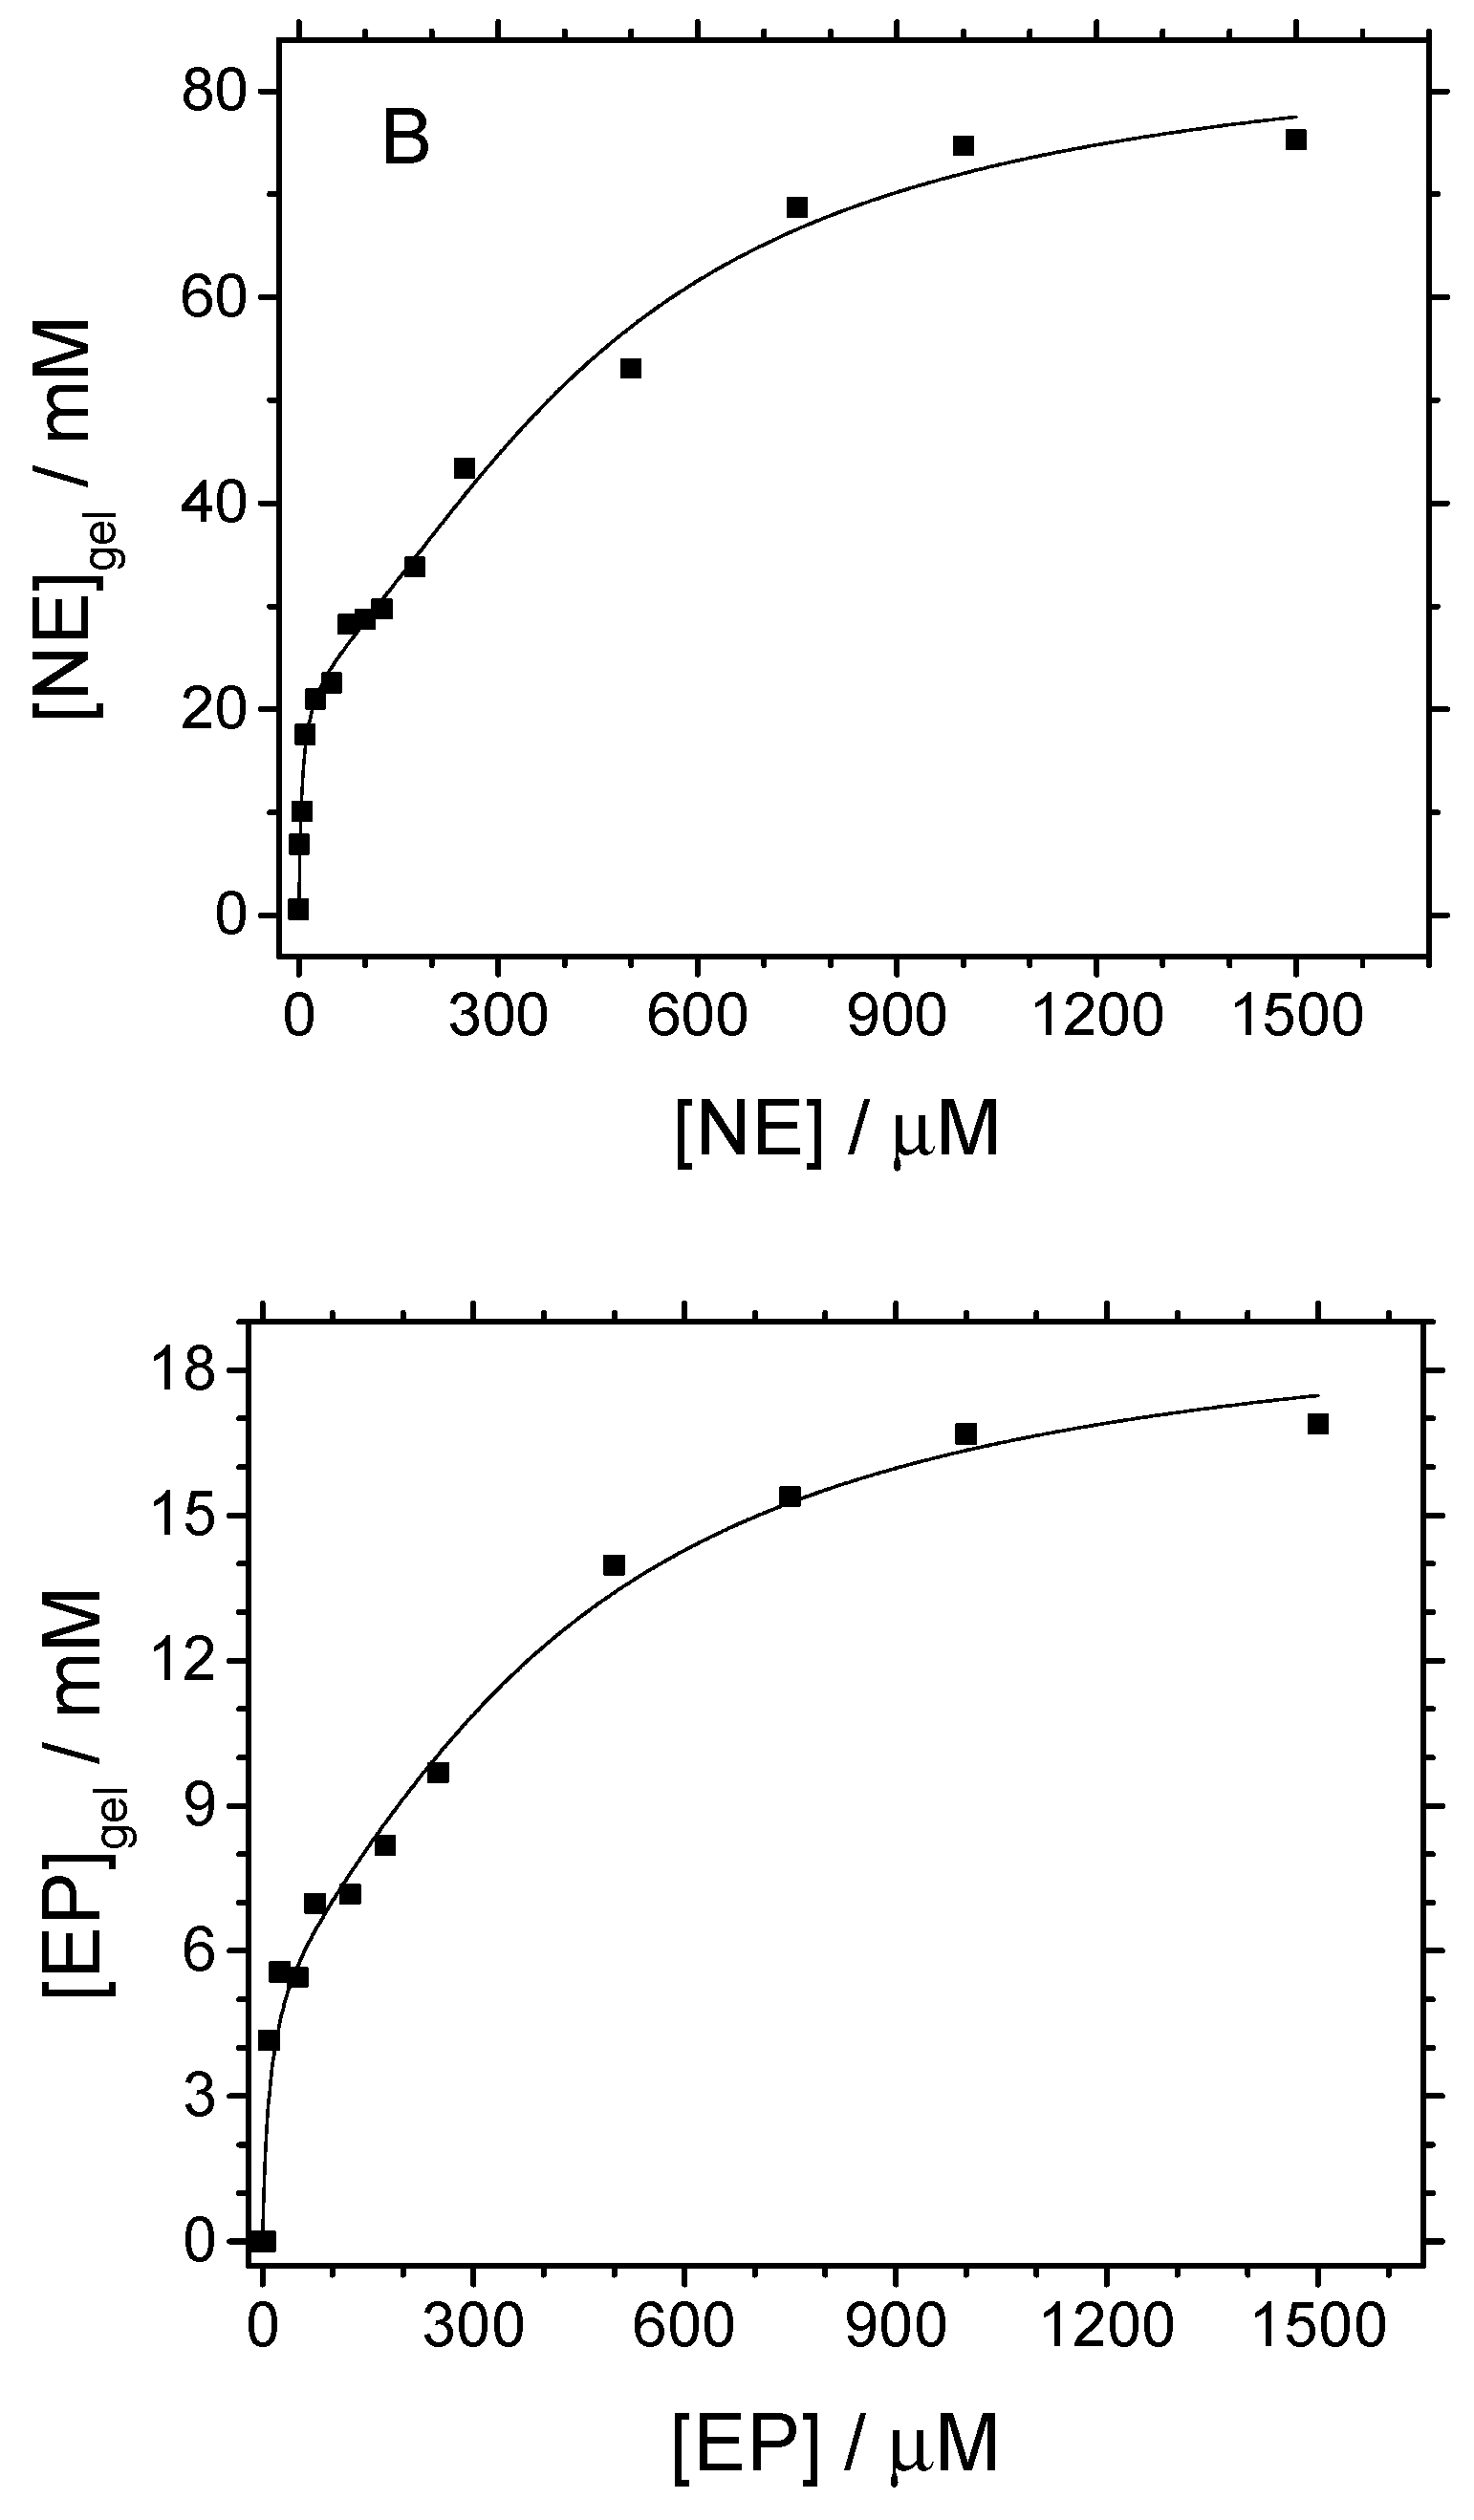
3.3. Characterization of the Adsorption of Neurotransmitters at Silica Films
4. Conclusions
Supplementary Materials
Author Contributions
Funding
Conflicts of Interest
References
- Peaston, R.T.; Weinkove, C. Measurement of catecholamines and their metabolites. Ann. Clin. Biochem. 2004, 41, 17–38. [Google Scholar] [CrossRef] [PubMed]
- Tobler, P.N.; Fiorillo, C.D.; Schultz, W. Adaptive coding of reward value by dopamine neurons. Science 2005, 307, 1642–1645. [Google Scholar] [CrossRef] [PubMed]
- Burghardt, P.; Love, T.; Stohler, C.; Hodgkinson, C.; Shen, P.; Enoch, M.; Goldman, D.; Zubieta, J. Leptin regulates dopamine responses to sustained stress in humans. J. Neurosci. 2012, 32, 15369–15376. [Google Scholar] [CrossRef] [PubMed]
- Robinson, D.L.; Hermans, A.; Seipel, A.T.; Wightman, R.M. Monitoring rapid chemical communication in the brain. Chem. Rev. 2008, 108, 2554–2584. [Google Scholar] [CrossRef] [PubMed]
- Causon, R.C.; Brown, M.J. Catecholamine measurements in phaeochromocytoma: A review. Ann. Clin. Biochem. 1982, 19, 396–404. [Google Scholar] [CrossRef] [PubMed]
- Rosano, T.G.; Swift, T.A.; Hayes, L.W. Advances in catecholamine and metabolite measurements for diagnosis of pheochromocytoma. Clin. Chem. 1991, 37, 1854–1867. [Google Scholar] [PubMed]
- Tufi, S.; Lamoree, M.; de Boer, J.; Leonards, P. Simultaneous analysis of multiple neurotransmitters by hydrophilic interaction liquid chromatography coupled to tandem mass spectrometry. J. Chromatogr. A 2015, 1395, 79–87. [Google Scholar] [CrossRef]
- Chirita, R.; West, C.; Finaru, A.; Elfakir, C. Approach to hydrophilic interaction chromatography column selection: Application to neurotransmitters analysis. J. Chromatogr. A 2010, 1217, 3091–3104. [Google Scholar] [CrossRef]
- Kumar, A.; Hart, J.P.; McCalley, D.V. Determination of catecholamines in urine using hydrophilic interaction chromatography with electrochemical detection. J. Chromatogr. A 2011, 1218, 3854–3861. [Google Scholar] [CrossRef]
- Kang, T.-F.; Shen, G.-L.; Yu, R.-Q. Permselectivity of neurotransmitters at overoxidized polypyrrole-film-coated glassy carbon electrodes. Talanta 1996, 43, 2007–2013. [Google Scholar] [CrossRef]
- Figueiredo-Filho, L.C.S.; Silva, T.A.; Vicentini, F.C.; Fatibello-Filho, O. Simultaneous voltammetric determination of dopamine and epinephrine in human body fluid samples using a glassy carbon electrode modified with nickel oxide nanoparticles and carbon nanotubes within a dihexadecylphosphate film. Analyst 2014, 139, 2842–2849. [Google Scholar] [CrossRef] [PubMed]
- Jacobs, C.B.; Peairs, M.J.; Venton, B.J. Review: Carbon nanotube based electrochemical sensors for biomolecules. Anal. Chim. Acta 2010, 662, 105–127. [Google Scholar] [CrossRef] [PubMed]
- Álvarez-Martos, I.; Ferapontova, E.E. Electrocatalytic Discrimination between Dopamine and Norepinephrine at Graphite and Basal Plane HOPG Electrodes. Electroanalysis 2018, 30, 1082–1090. [Google Scholar] [CrossRef]
- Celebanska, A.; Tomaszewska, D.; Lesniewski, A.; Opallo, M. Film electrode prepared from oppositely charged silicate submicroparticles and carbon nanoparticles for selective dopamine sensing. Biosens. Bioelectron. 2011, 26, 4417–4422. [Google Scholar] [CrossRef] [PubMed]
- Walcarius, A. Electroanalysis with pure, chemically modified, and sol-gel-derived silica-based materials. Electroanalysis 2001, 13, 701–718. [Google Scholar] [CrossRef]
- Walcarius, A.; Sibottier, E.; Etienne, M.; Ghanbaja, J. Electrochemically assisted self-assembly of mesoporous silica thin films. Nat. Mater. 2007, 6, 602–608. [Google Scholar] [CrossRef] [PubMed]
- Walcarius, A.; Mandler, D.; Cox, J.A.; Collinson, M.; Lev, O. Exciting new directions in the intersection of functionalized sol-gel materials with electrochemistry. J. Mater. Chem. 2005, 15, 3663–3689. [Google Scholar] [CrossRef]
- Gamero-Quijano, A.; Huerta, F.; Salinas-Torres, D.; Morallón, E.; Montilla, F. Electrochemical Behaviour of PSS-Functionalized Silica Films Prepared by Electroassisted Deposition of Sol–Gel Precursors. Electrocatalysis 2014, 33–41. [Google Scholar] [CrossRef]
- Porcel-Valenzuela, M.; Salinas-Castillo, A.; Morallón, E.; Montilla, F. Molecularly Imprinted Silica Films Prepared by Electroassisted Deposition for the Selective Detection of Dopamine. Sens. Actuators B Chem. 2015, 222, 63–70. [Google Scholar] [CrossRef]
- Socrates, G. Infrared and Raman Characteristic Group Frequencies: Tables and Charts, 3rd. ed; Wiley: West Sussex, UK, 2001. [Google Scholar]
- C.Brinker, G.S.; Brinker, C.J.; Scherer, G.; Press, A. Sol-Gel Science: The Physics and Chemistry of Sol-Gel Processing, 1st ed.; Elsevier: Boston, MA, USA, 1990; ISBN 978-0121349707. [Google Scholar]
- BNariyal, R.K.; Kothari, P.; Bisht, B. FTIR Measurements of SiO2 Glass Prepared by Sol-Gel Technique. Chem. Sci. Trans. 2014, 3, 1064–1066. [Google Scholar]
- Innocenzi, P. Infrared spectroscopy of sol–gel derived silica-based films: A spectra-microstructure overview. J. Non. Cryst. Solids 2003, 316, 309–319. [Google Scholar] [CrossRef]
- Bertoluzza, A.; Fagnano, C.; Antonietta Morelli, M.; Gottardi, V.; Guglielmi, M. Raman and infrared spectra on silica gel evolving toward glass. J. Non. Cryst. Solids 1982, 48, 117–128. [Google Scholar] [CrossRef]
- Zaharescu, M.; Jitianu, A.; Brãileanu, A.; Madarász, J.; Novák, C.; Pokol, G. Composition and thermal stability of SiO2-based hybrid materials TEOS-MTEOS system. J. Therm. Anal. Calorim. 2002, 71, 421–428. [Google Scholar] [CrossRef]
- Zaharescu, M.; Jitianu, A.; Brãileanu, A.; Bãdescu, V.; Pokol, G.; Madarász, J.; Novák, C. Thermal stability of SiO2-based inorganic-organic hybrid materials. J. Therm. Anal. Calorim. 1999, 56, 191–198. [Google Scholar] [CrossRef]
- Gamero-Quijano, A.; Huerta, F.; Salinas-Torres, D.; Morallón, E.; Montilla, F. Electrocatalytic Performance of SiO2-SWCNT Nanocomposites Prepared by Electroassisted Deposition. Electrocatalysis 2013, 4, 259–266. [Google Scholar] [CrossRef]
- Zhao, Z.-G.; Zhang, L.-H.; Lin, Y. Thermodynamics of adsorption of organic compounds at the silica gel/nonpolar solvent interfaces. J. Colloid Interface Sci. 1994, 166, 23–28. [Google Scholar] [CrossRef]
- Tse, D.C.S.; McCreery, R.L.; Adams, R.N. Potential Oxidative Pathways of Brain Catecholamines. J. Med. Chem. 1976, 19, 37–40. [Google Scholar] [CrossRef] [PubMed]
- Hawley, M.D.; Tatawawadi, S.V.; Piekarski, S.; Adams, R.N. Electrochemical studies of the oxidation pathways of catecholamines. J. Am. Chem. Soc. 1967, 89, 447–450. [Google Scholar] [CrossRef]
- Shahrokhian, S.; Bozorgzadeh, S. Electrochemical oxidation of dopamine in the presence of sulfhydryl compounds: Application to the square-wave voltammetric detection of penicillamine and cysteine. Electrochim. Acta 2006, 51, 4271–4276. [Google Scholar] [CrossRef]
- Ciolkowski, E.L.; Maness, K.M.; Cahill, P.S.; Wightman, R.M.; Evans, D.H.; Fosset, B.; Amatore, C. Disproportionation during electrooxidation of catecholamines at carbon-fiber microelectrodes. Anal. Chem. 1994, 66, 3611–3617. [Google Scholar] [CrossRef]
- Bard, A.J.; Faulkner, L.R. Electrochemical Methods: Fundamentals and Applications; JOHN WILEY & SONS, INC.: New York, NY, USA, 2001. [Google Scholar]
- Smith, T.J.; Stevenson, K.J.; Zoski, C.G. Handbook of Electrochemistry, 1st ed.; Elsevier: Amsterdam, The Netherlands, 2007; ISBN 9780444519580. [Google Scholar]
- Giles, C.H.; MacEwan, T.H.; Nakhwa, S.N.; Smith, D. Studies in adsorption. Part XI. A system of classification of solution adsorption isotherms, and its use in diagnosis of adsorption mechanisms and in measurement of specific surface areas of solids. J. Chem. Soc. 1960, 111, 3973–3993. [Google Scholar] [CrossRef]
- Parida, S.K.; Dash, S.; Patel, S.; Mishra, B.K. Adsorption of organic molecules on silica surface. Adv. Colloid Interface Sci. 2006, 121, 77–110. [Google Scholar] [CrossRef] [PubMed]
- Ebadi, A.; Soltan Mohammadzadeh, J.S.; Khudiev, A. What is the correct form of BET isotherm for modeling liquid phase adsorption? Adsorption 2009, 15, 65–73. [Google Scholar] [CrossRef]
- Brinker, C.J.; Scherer, G.W. Sol → gel → glass: I. Gelation and gel structure. J. Non. Cryst. Solids 1985, 70, 301–322. [Google Scholar] [CrossRef]
- Spencer, J.N.; Wolbach, W.S.; Hovick, J.W.; Ansel, L.; Modarress, K.J. Hydrogen bonding by alcohols and amines. J. Solution Chem. 1985, 14, 805–814. [Google Scholar] [CrossRef]
- Zaitseva, K.V.; Varfolomeev, M.A.; Solomonov, B.N. Hydrogen bonding of aliphatic and aromatic amines in aqueous solution: Thermochemistry of solvation. Russ. J. Gen. Chem. 2012, 82, 1669–1674. [Google Scholar] [CrossRef]


| Parameter | DA | NE | EP |
|---|---|---|---|
| /s−1 | 7.30 × 10⁻³ | 6.38 × 10⁻³ | 4.97 × 10⁻³ |
| /μA cm−2 | 120 | 98.8 | 20.3 |
| D/cm2 s−1 | 6.0 × 10⁻⁶ | 5.2 × 10⁻⁶ | 5.5 × 10⁻⁶ |
| /mM | 82.8 | 74.7 | 16.7 |
| Parameter | DA | NE | EP |
|---|---|---|---|
| / mM | 24.8 | 23.4 | 6.0 |
| / mM−1 | 863 | 209 | 94 |
| / mM−1 | 3.8 | 2.2 | 2.3 |
| 4 | 4 | 3 | |
| / % | 1.4 | 1.3 | 0.3 |
© 2019 by the authors. Licensee MDPI, Basel, Switzerland. This article is an open access article distributed under the terms and conditions of the Creative Commons Attribution (CC BY) license (http://creativecommons.org/licenses/by/4.0/).
Share and Cite
Porcel-Valenzuela, M.; Huerta, F.; Morallón, E.; Montilla, F. Affinity of Electrochemically Deposited Sol–Gel Silica Films towards Catecholamine Neurotransmitters. Sensors 2019, 19, 868. https://doi.org/10.3390/s19040868
Porcel-Valenzuela M, Huerta F, Morallón E, Montilla F. Affinity of Electrochemically Deposited Sol–Gel Silica Films towards Catecholamine Neurotransmitters. Sensors. 2019; 19(4):868. https://doi.org/10.3390/s19040868
Chicago/Turabian StylePorcel-Valenzuela, María, Francisco Huerta, Emilia Morallón, and Francisco Montilla. 2019. "Affinity of Electrochemically Deposited Sol–Gel Silica Films towards Catecholamine Neurotransmitters" Sensors 19, no. 4: 868. https://doi.org/10.3390/s19040868
APA StylePorcel-Valenzuela, M., Huerta, F., Morallón, E., & Montilla, F. (2019). Affinity of Electrochemically Deposited Sol–Gel Silica Films towards Catecholamine Neurotransmitters. Sensors, 19(4), 868. https://doi.org/10.3390/s19040868