Monitoring the Risk of the Electric Component Imposed on a Pilot During Light Aircraft Operations in a High-Frequency Electromagnetic Field †

 , ,
, ,  , ,
, ,  , and
, and 
Abstract
:1. Introduction
2. Materials and Methods
2.1. Measuring Method
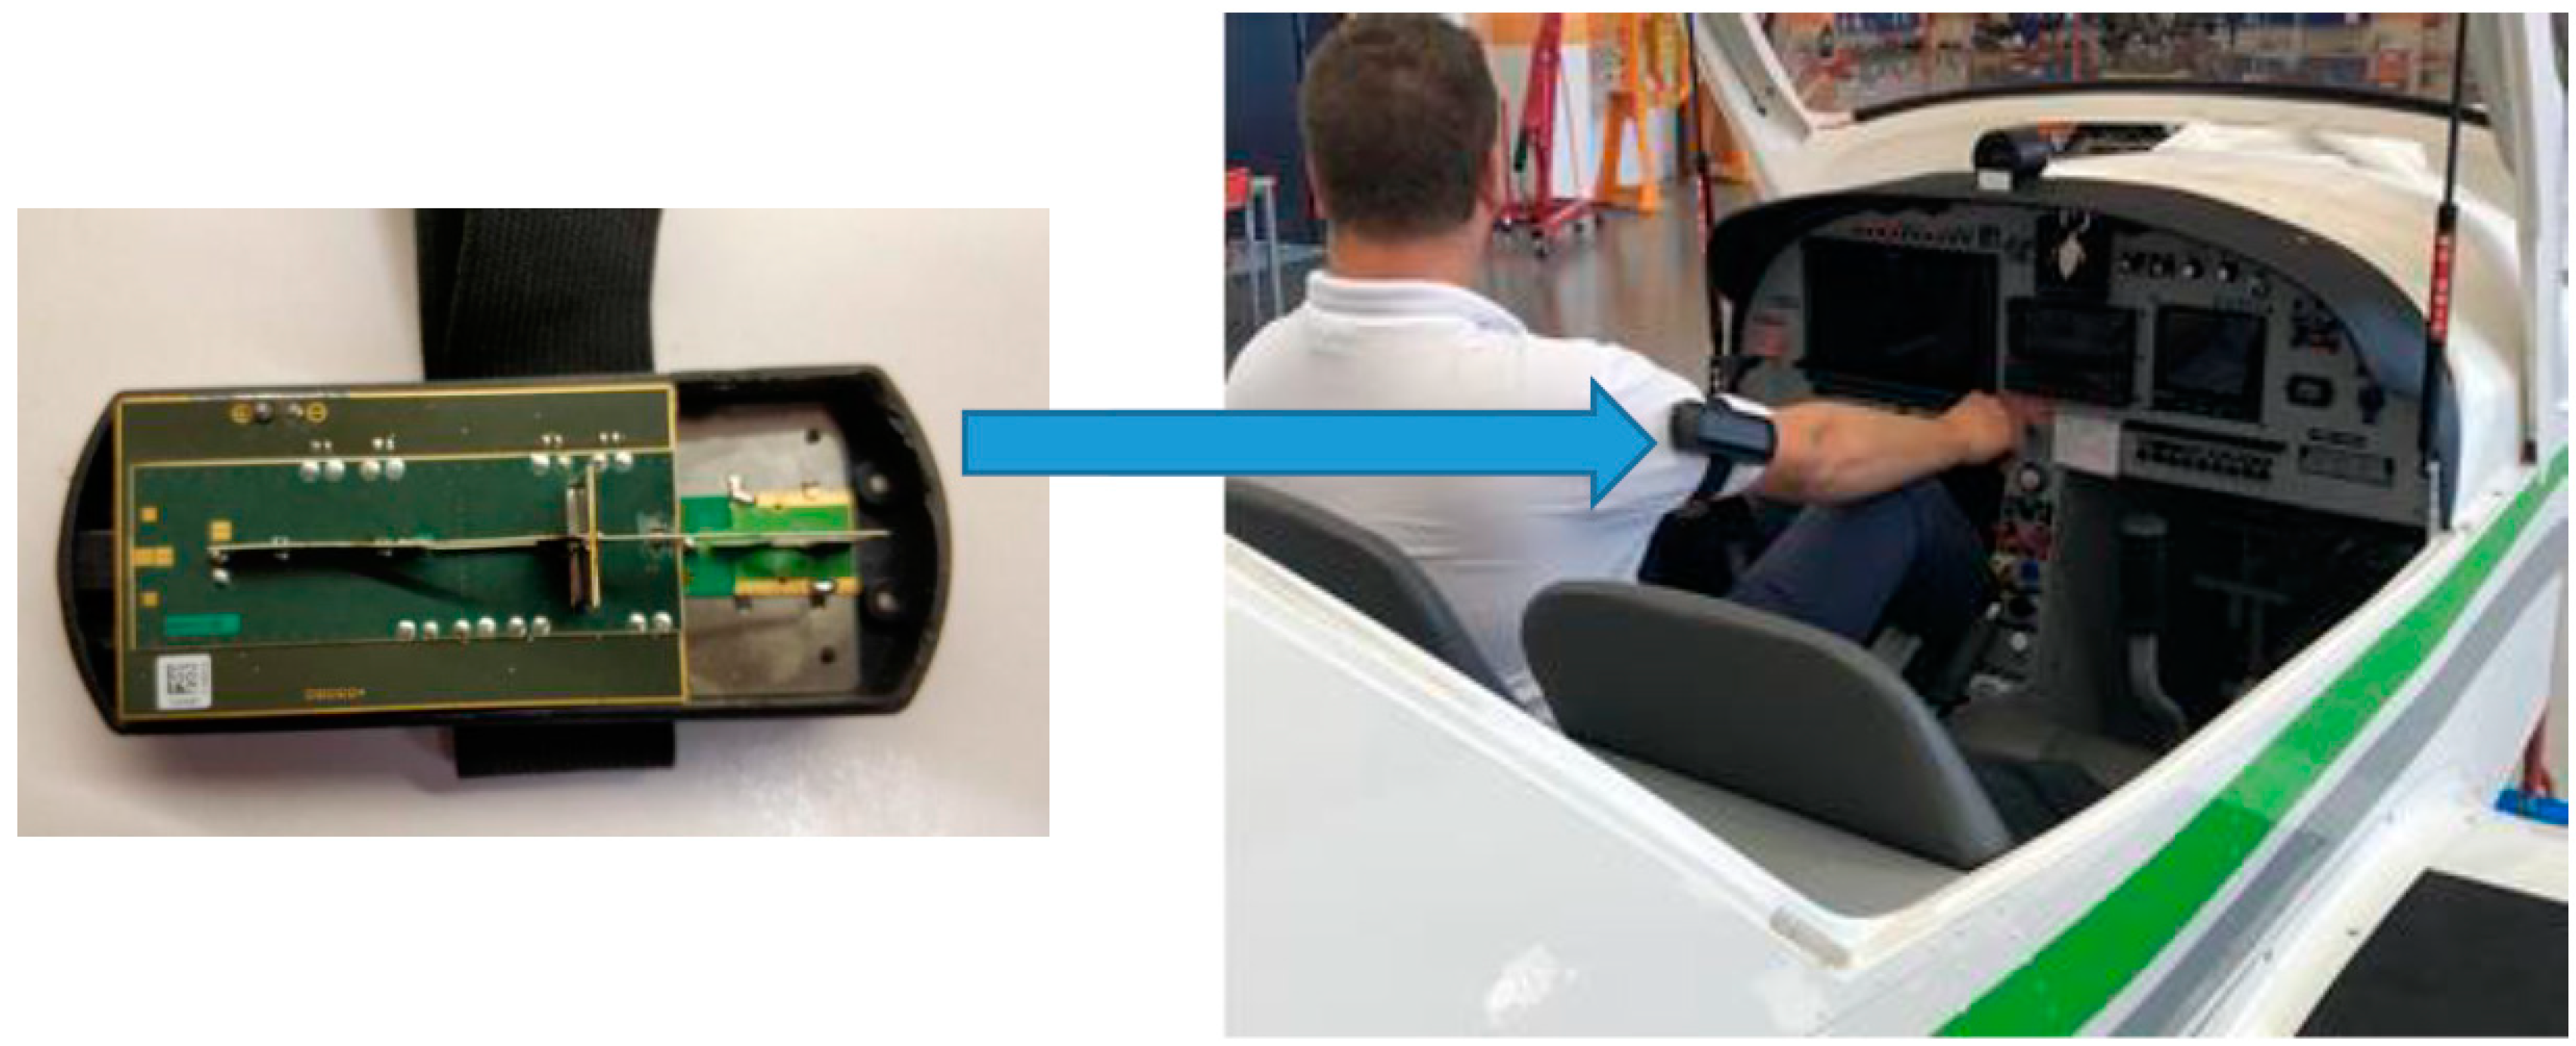
2.2. The Device Used for the Measurements
3. Results and Discussion
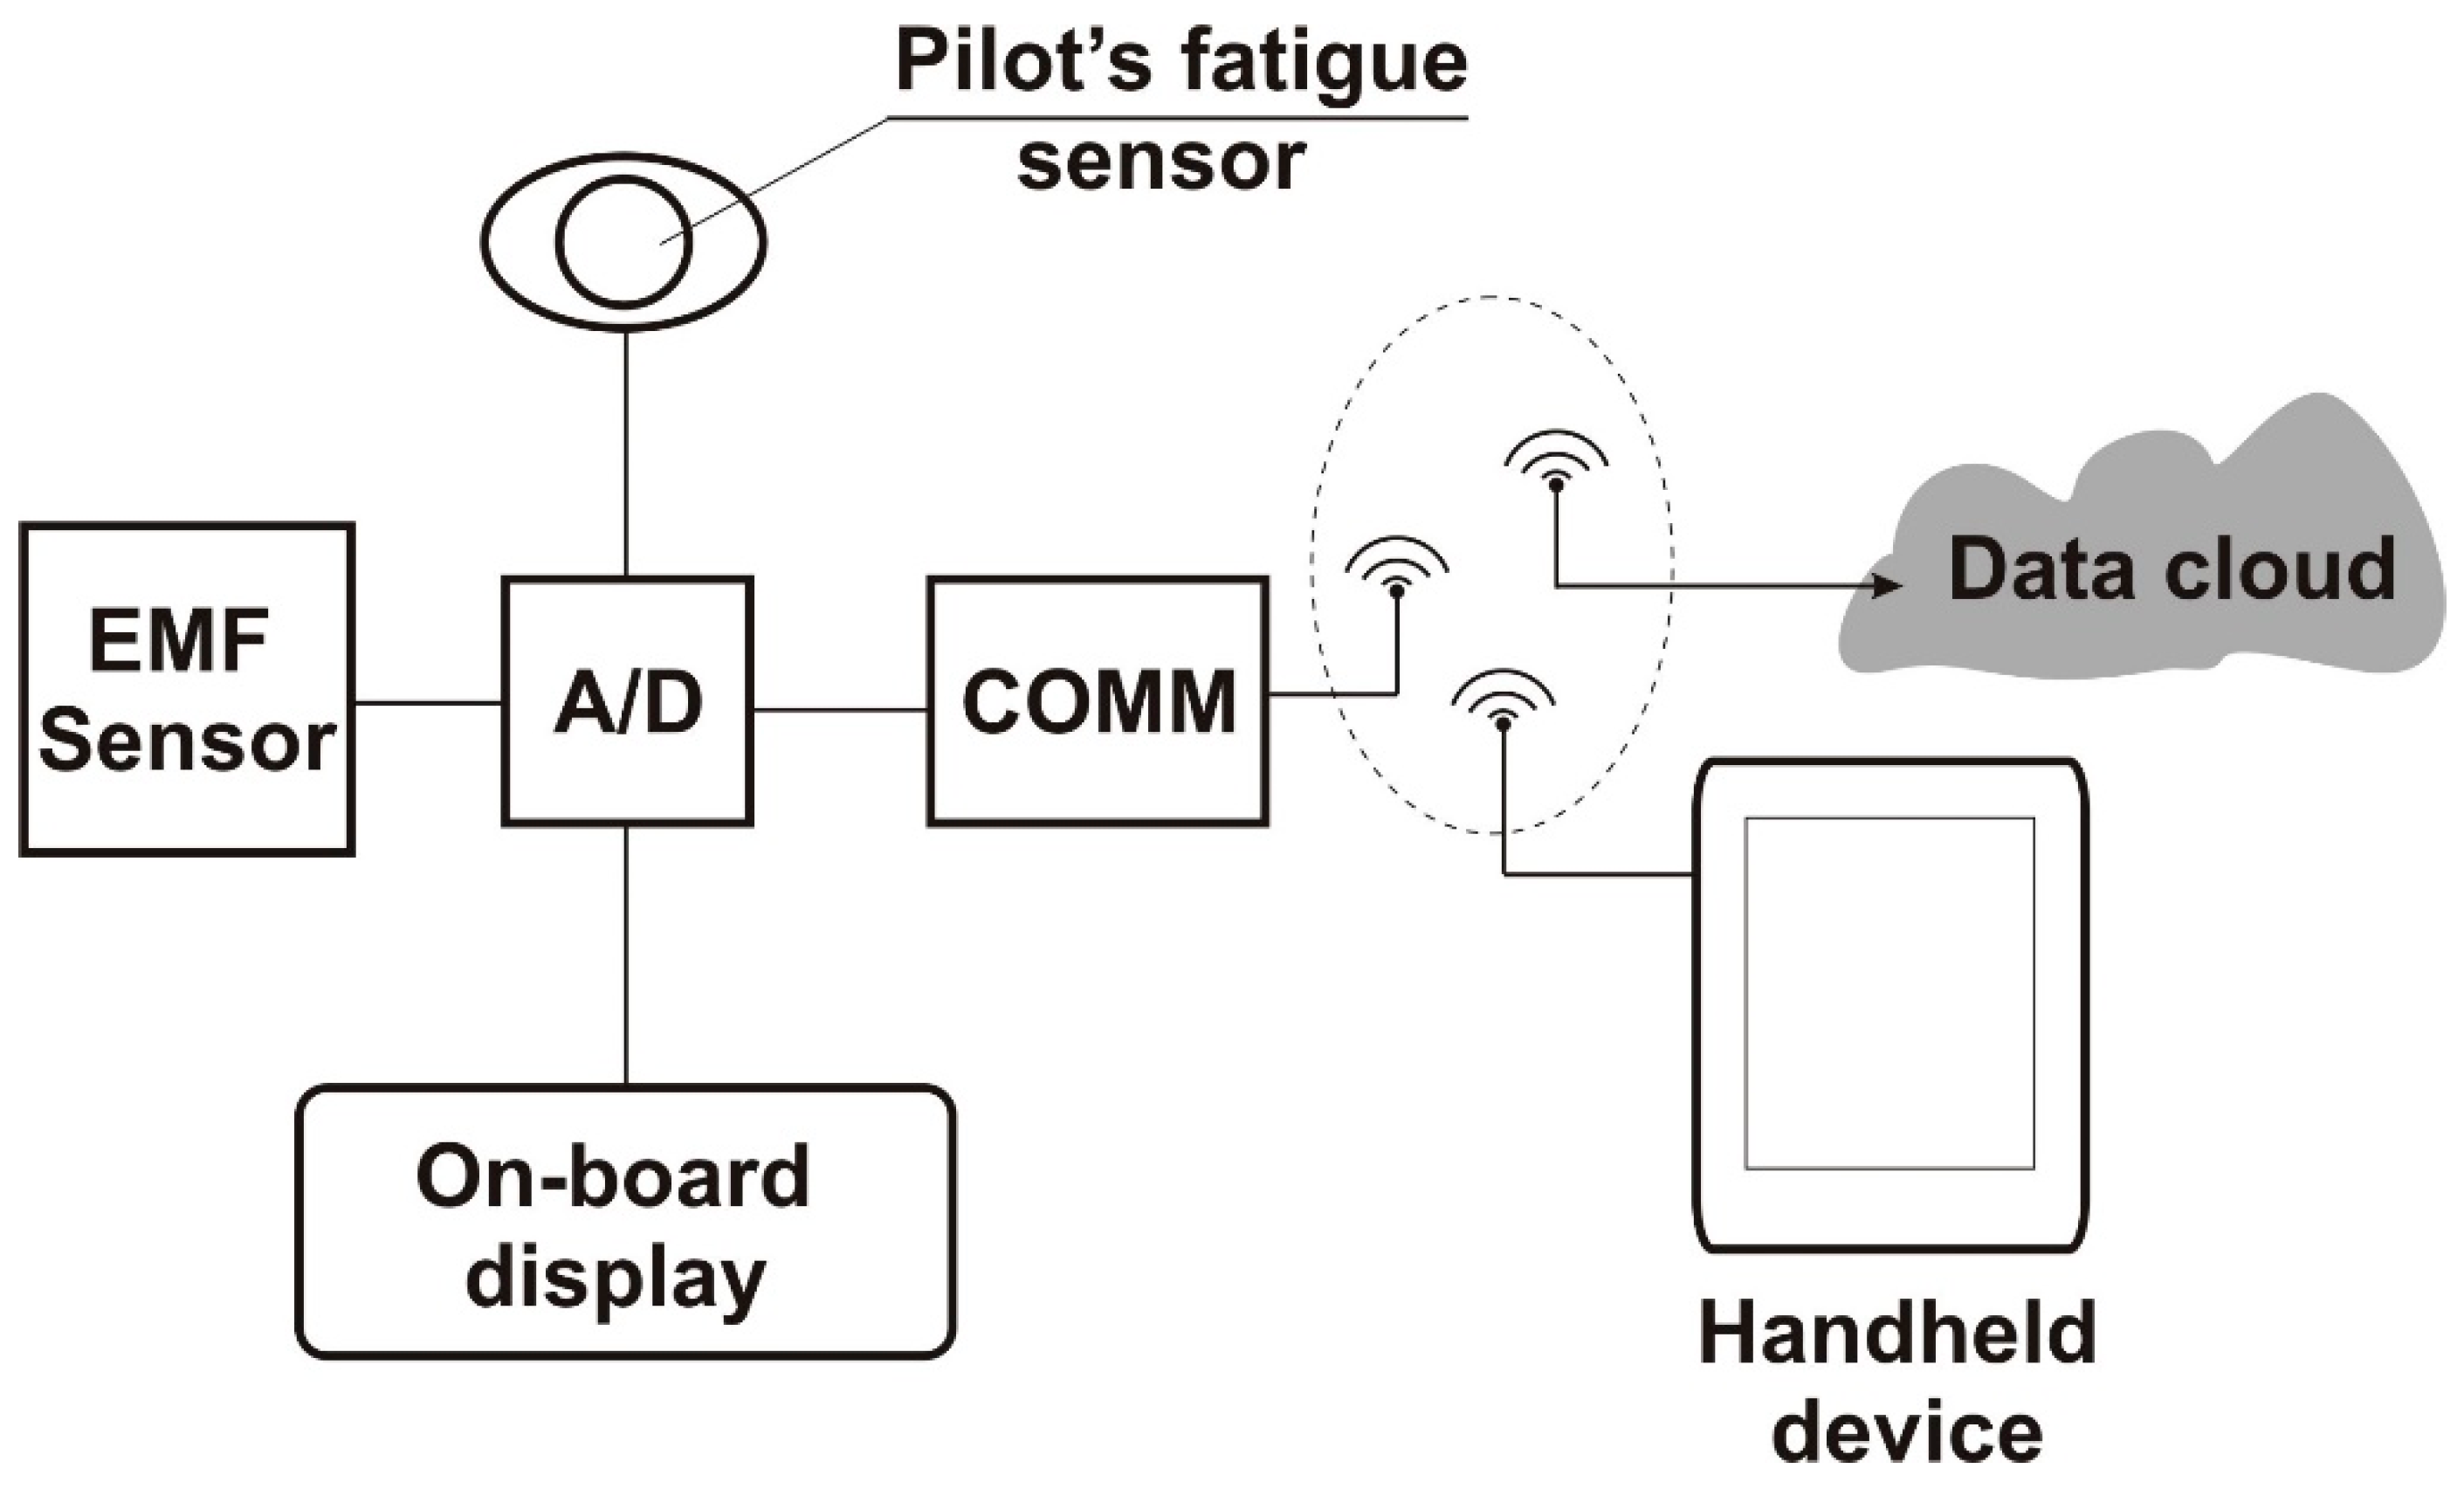
4. Design of an Onboard EMF Monitoring Sensor System
5. Conclusions
Author Contributions
Funding
Conflicts of Interest
References
- Michalowska, J.; Tofil, A.; Józwik, J. Analysis of the radiated interferences emission of small household appliances. In Proceedings of the 2019 Applications of Electromagnetics in Modern Engineering and Medicine (PTZE), Janow Podlaski, Poland, 9–12 June 2019; pp. 117–120. [Google Scholar]
- Michałowska, J.; Tofil, A.; Józwik, J.; Pytka, J.; Budzyński, P.; Korzeniewska, E. Measurement of high–frequency electromagnetic fields in CNC machine tools area. In Proceedings of the 2018 IEEE 4th International Symposium on Wireless Systems within the International Conferences on Intelligent Data Acquisition and Advanced Computing Systems (IDAACS-SWS), Lviv, Ukraine, 20–21 September 2018; pp. 162–165. [Google Scholar]
- Michalowska, J.; Józwik, J.; Tofil, A. Monitoring of the intensity of the electromagnetic field during the aircraft operation in the field of high frequencies. In Proceedings of the 2019 IEEE 5th International Workshop on Metrology for AeroSpace (MetroAeroSpace), Torino, Italy, 19–21 June 2019; pp. 366–370. [Google Scholar]
- Michałowska, J.; Mazurek, P.; Gad, R.; Chudy, A.; Kozieł, J. Identification of the Electromagnetic Field Strength in Public Spaces and During Travel. In Proceedings of the 2019 Applications of Electromagnetics in Modern Engineering and Medicine (PTZE), Janow Podlaski, Poland, 9–12 June 2019; pp. 121–124. [Google Scholar]
- Gas, P.; Wyszkowska, J. Influence of multi–tine electrode configuration in realistic hepatic RF ablative heating. Arch. Electr. Eng. 2019, 68, 521–533. [Google Scholar]
- Kurgan, E.; Gas, P. Treatment of tumors located in the human thigh using RF hyperthermia. Prz. Elektrotechniczn. 2011, 87, 103–106. [Google Scholar]
- Balal, N.; Gad, A.; Yosef Pinhasi, Y. Atmospheric and fog effects on ultra–wide band radar operating at extremely high frequencies. Sensors 2016, 16, 751. [Google Scholar] [CrossRef] [PubMed]
- Bieńkowski, P.; Zubrzak, B.; Cała, P. Mitigation measures of electromagnetic field exposure in the vicinity of high frequency welders. Med. Pr. 2017, 68, 693–703. [Google Scholar]
- Grodzki, W.; Łukaszewicz, A. Design and manufacture of unmanned aerial vehicles (UAV) wing structure using composite materials. Materialwiss. Werkst. 2015, 46, 269–278. [Google Scholar] [CrossRef]
- Kruk, A.; Wusatowska-Sarnek, A.M.; Zietara, M.; Jemielniak, K.; Siemiatkowski, Z.; Czyrska-Filemonowicz, A. Characterization on white etching layer formed during ceramic milling of inconel 718. Met. Mater. Int. 2018, 24, 1033–1045. [Google Scholar] [CrossRef]
- Leccese, F.; Cagnetti, M.; Ferrone, A.; Pecora, A.; Maiolo, L. An infrared sensor Tx/Rx electronic card for aerospace applications. In Proceedings of the 2014 IEEE Metrology for Aerospace (MetroAeroSpace), Benevento, Italy, 29–30 May 2014; pp. 353–357. [Google Scholar]
- Leccese, F.; Cagnetti, M.; Sciuto, S.; Scorza, A.; Torokhtii, K.; Silva, E. Analysis, design, realization and test of a sensor network for aerospace applications. In Proceedings of the 2017 IEEE International Instrumentation and Measurement Technology Conference (I2MTC), Turin, Italy, 22–25 May 2017; pp. 1–6. [Google Scholar]
- Józwik, J.; Pytka, J.; Tofil, A. Dynamic analysis of aircraft landing gear wheel. In Proceedings of the 2018 5th IEEE International Workshop on Metrology for AeroSpace (MetroAeroSpace), Rome, Italy, 20–22 June 2018; pp. 462–467. [Google Scholar]
- Siemiatkowski, Z.; Rucki, M.; Lavrynenko, S. Investigations of the shrink–fitted joints in assembled crankshafts. In Proceedings of the 7th International Conference on Mechanics and Materials in Design (M2D), Albufeira, Portugal, 11–15 June 2017; pp. 1155–1158. [Google Scholar]
- Sidun, P.; Łukaszewicz, A. Verification of ram–press pipe bending process using elasto–plastic FEM model. Acta. Mech. Autom. 2017, 11, 47–52. [Google Scholar] [CrossRef] [Green Version]
- Pytka, J.; Tarkowski, P.; Budzyński, P.; Józwik, J. Method for testing and evaluating grassy runway surface. J. Aircr. 2017, 54, 229–234. [Google Scholar] [CrossRef]
- Łukaszewicz, A. Nonlinear numerical model of friction heating during rotary friction welding. J. Frict. Wear 2018, 39, 476–482. [Google Scholar] [CrossRef]
- Mazurek, P.; Michalowska, J.; Koziel, J.; Gad, R. The intensity of the electromagnetic fields in the coverage of GSM 900, GSM 1800 DECT, UMTS, WLAN in built–up areas. In Proceedings of the 2018 Applications of Electromagnetics in Modern Techniques and Medicine (PTZE), Racławice, Poland, 9–12 September 2018; pp. 159–162. [Google Scholar]
- Wang, J.; Kochan, O.; Przystupa, K.; Su, J. Information–measuring system to study the thermocouple with controlled temperature field. Meas. Sci. Rev. 2019, 19, 161–169. [Google Scholar] [CrossRef] [Green Version]
- Kozieł, J.; Przystupa, K. Using the FTA method to analyze the quality of an uninterruptible power supply unitreparation UPS. Prz. Elektrotechniczn. 2019, 95, 65–68. [Google Scholar] [CrossRef] [Green Version]
- Przystupa, K. The methods analysis of hazards and product defects in food processing. Czech. J. Food Sci. 2019, 37, 44–50. [Google Scholar] [CrossRef]
- Przystupa, K. Reliability assessment method of device under incomplete observation of failure. In Proceedings of the 2018 18th International Conference on Mechatronics–Mechatronika (ME), Brno, Czech Republic, 5–7 December 2018; pp. 1–6. [Google Scholar]
- Pongsakornsathien, N.; Lim, Y.; Gardi, A.; Hilton, S.; Planke, L.; Sabatini, R.; Kistan, T.; Ezer, N. Sensor networks for aerospace human–machine systems. Sensors 2019, 19, 3465. [Google Scholar] [CrossRef] [PubMed] [Green Version]
- Siemiatkowski, Z.; Gzik–Szumiata, M.; Szumiata, T.; Rucki, M.; Martynowski, R. Metallurgical quality evaluation of the wind turbine main shaft 42CrMo4 steel: Microscopic and mssbauer studies. Nukleonika 2017, 62, 171–176. [Google Scholar] [CrossRef] [Green Version]
- Michalowska, J.; Tofil, A.; Józwik, J. Prognosis of the electromagnetic field parameters of numerically controlled machine tools in industrial conditions. In Proceedings of the 2018 Applications of Electromagnetics in Modern Techniques and Medicine (PTZE), Racławice, Poland, 9–12 September 2018; pp. 167–170. [Google Scholar]
- Michalowska, J.; Józwik, J. Prediction of the parameters of magnetic field of CNC machines tools. Przegląad Elektrotechniczny 2019, 1, 136–138. [Google Scholar] [CrossRef] [Green Version]


| Type | No. of Seats | Wingspan/Rotor Diameter (m) | Engine (kW) | Avionics | Other |
|---|---|---|---|---|---|
| Fixed-Wing Aircrafts | |||||
| Cessna 152 | 2 | 10.11 | 86 | Garmin G5 | |
| Cessna 172 | 4 | 11.00 | 125 | GarminG1000 | |
| AERO AT3 | 2 | 7.55 | 75 | Garmin G500TXI | VLA—Very Light Aircraft Class |
| Rotary-Wing Aircraft | |||||
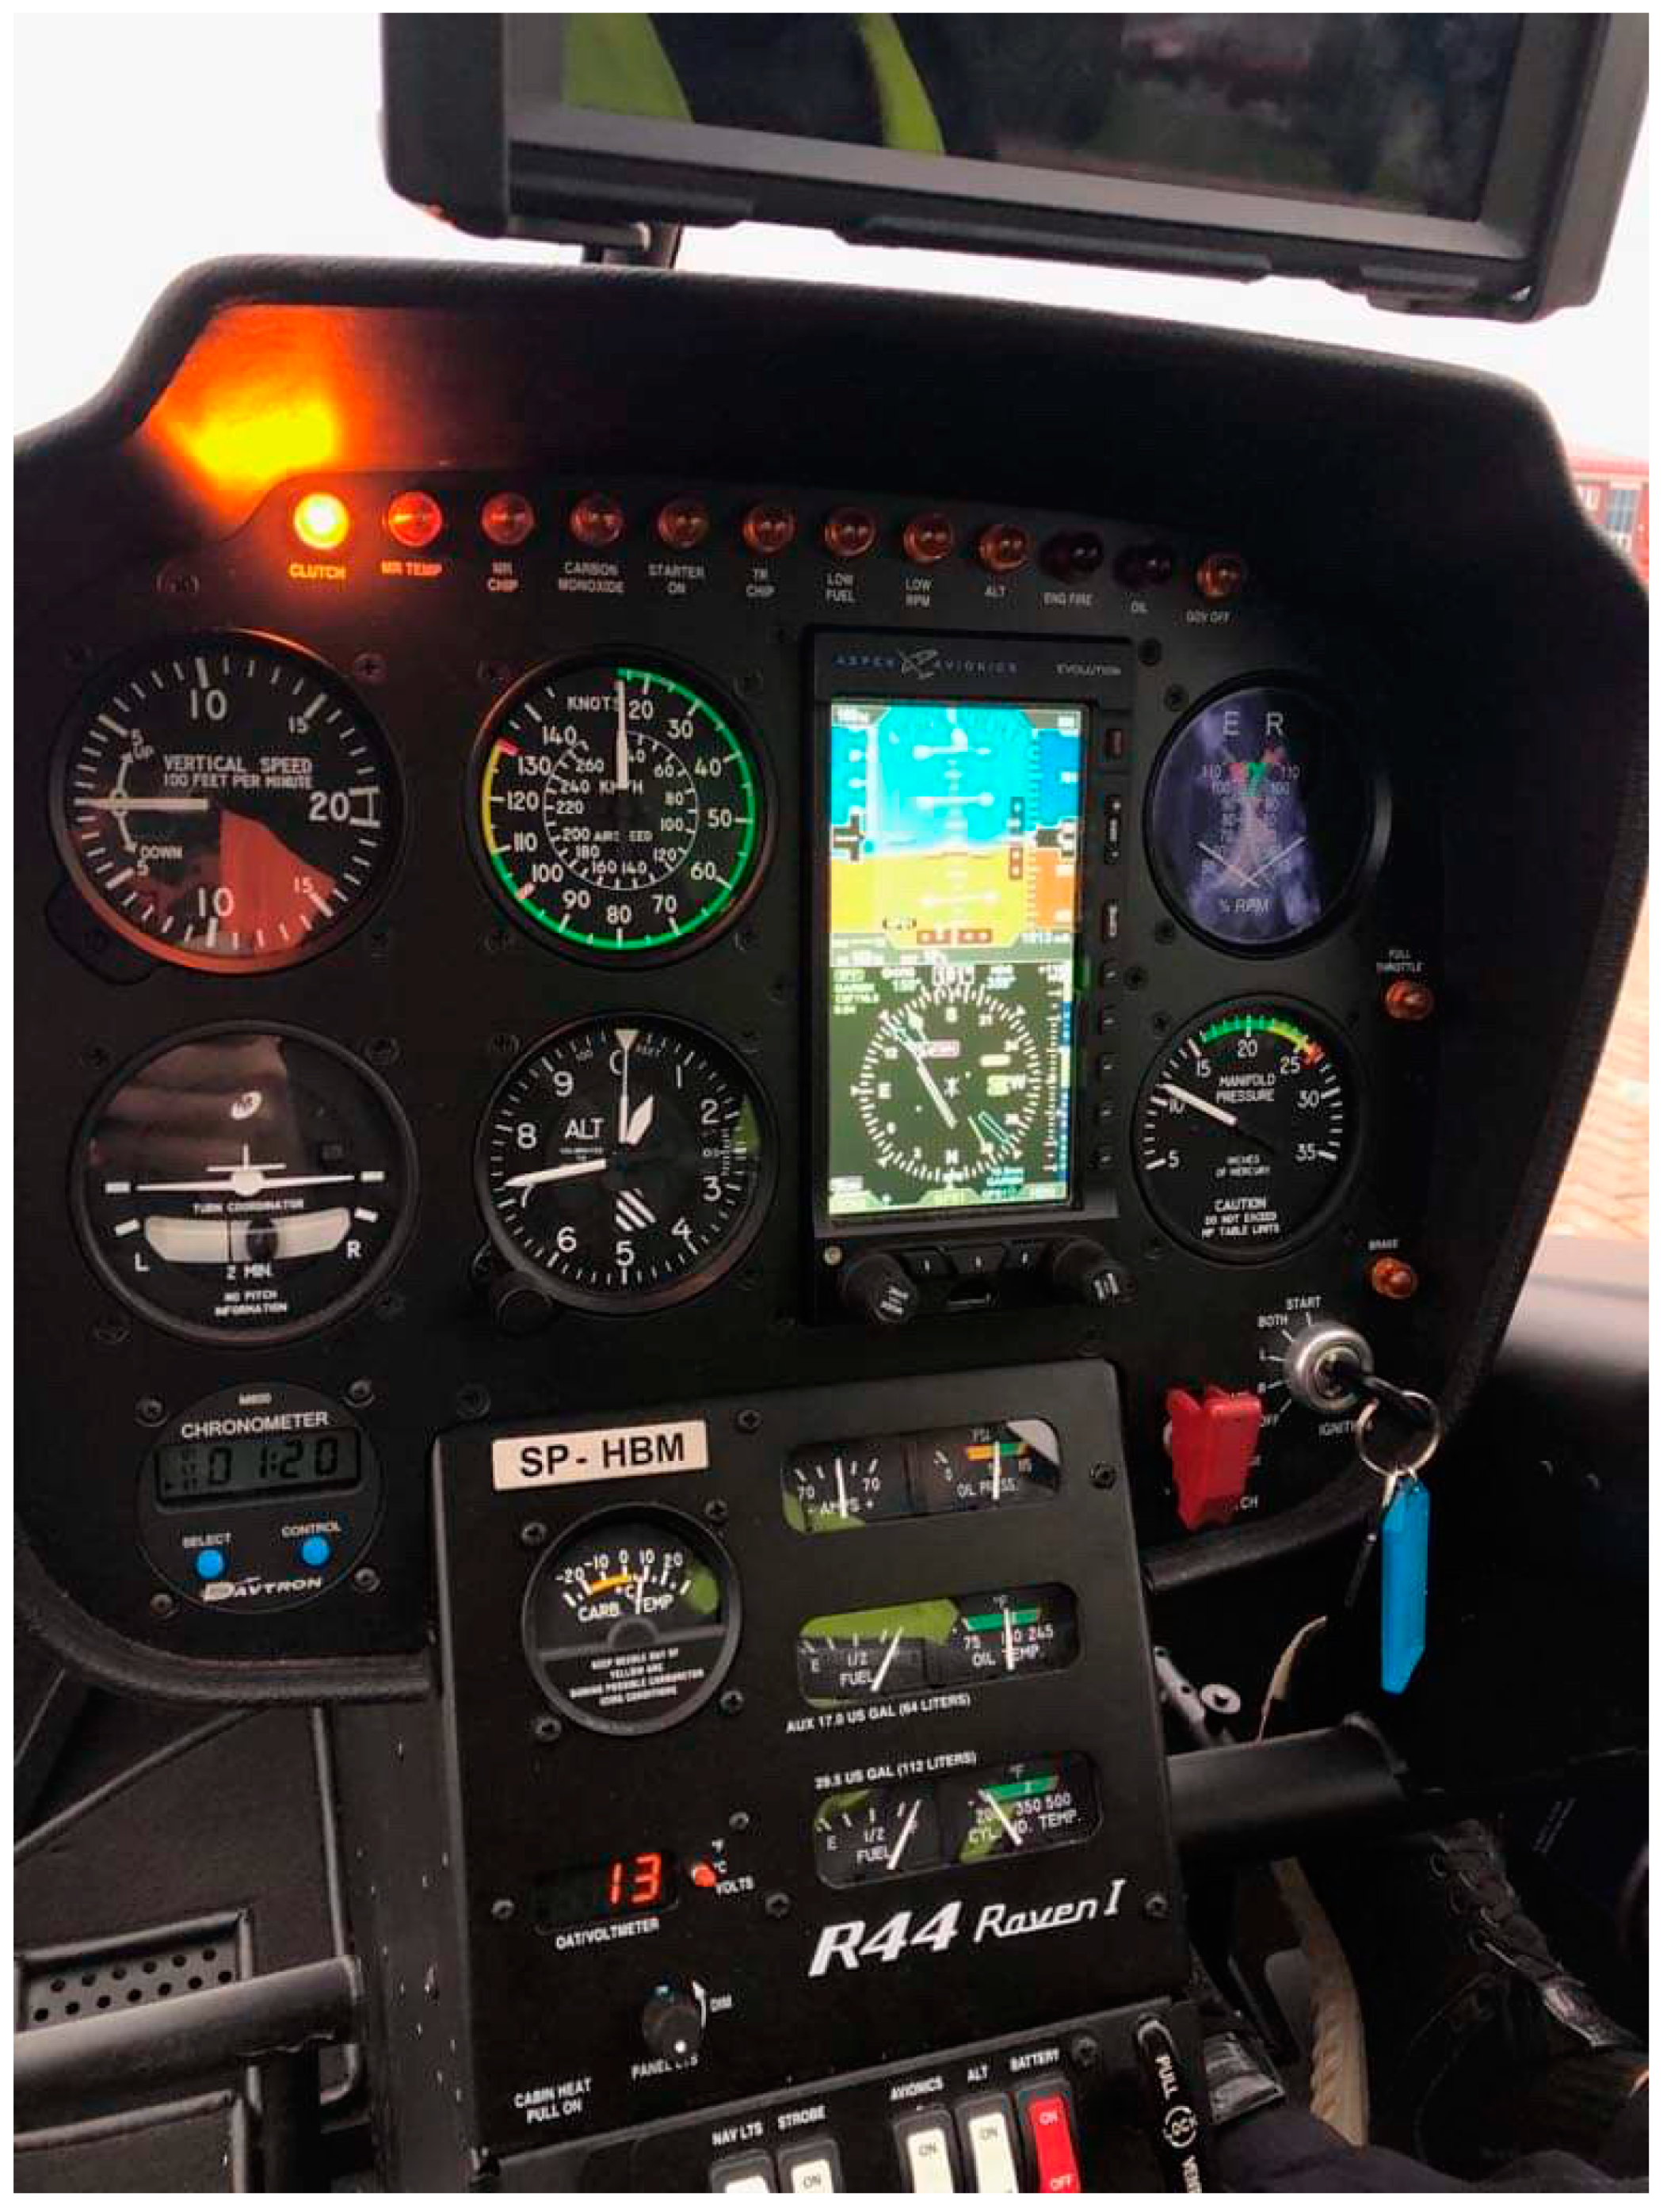
| R44 Raven | 4 | 9.00 | 183 | Mixed: Analog/Aspen electronic flight instrument system (EFIS) | |
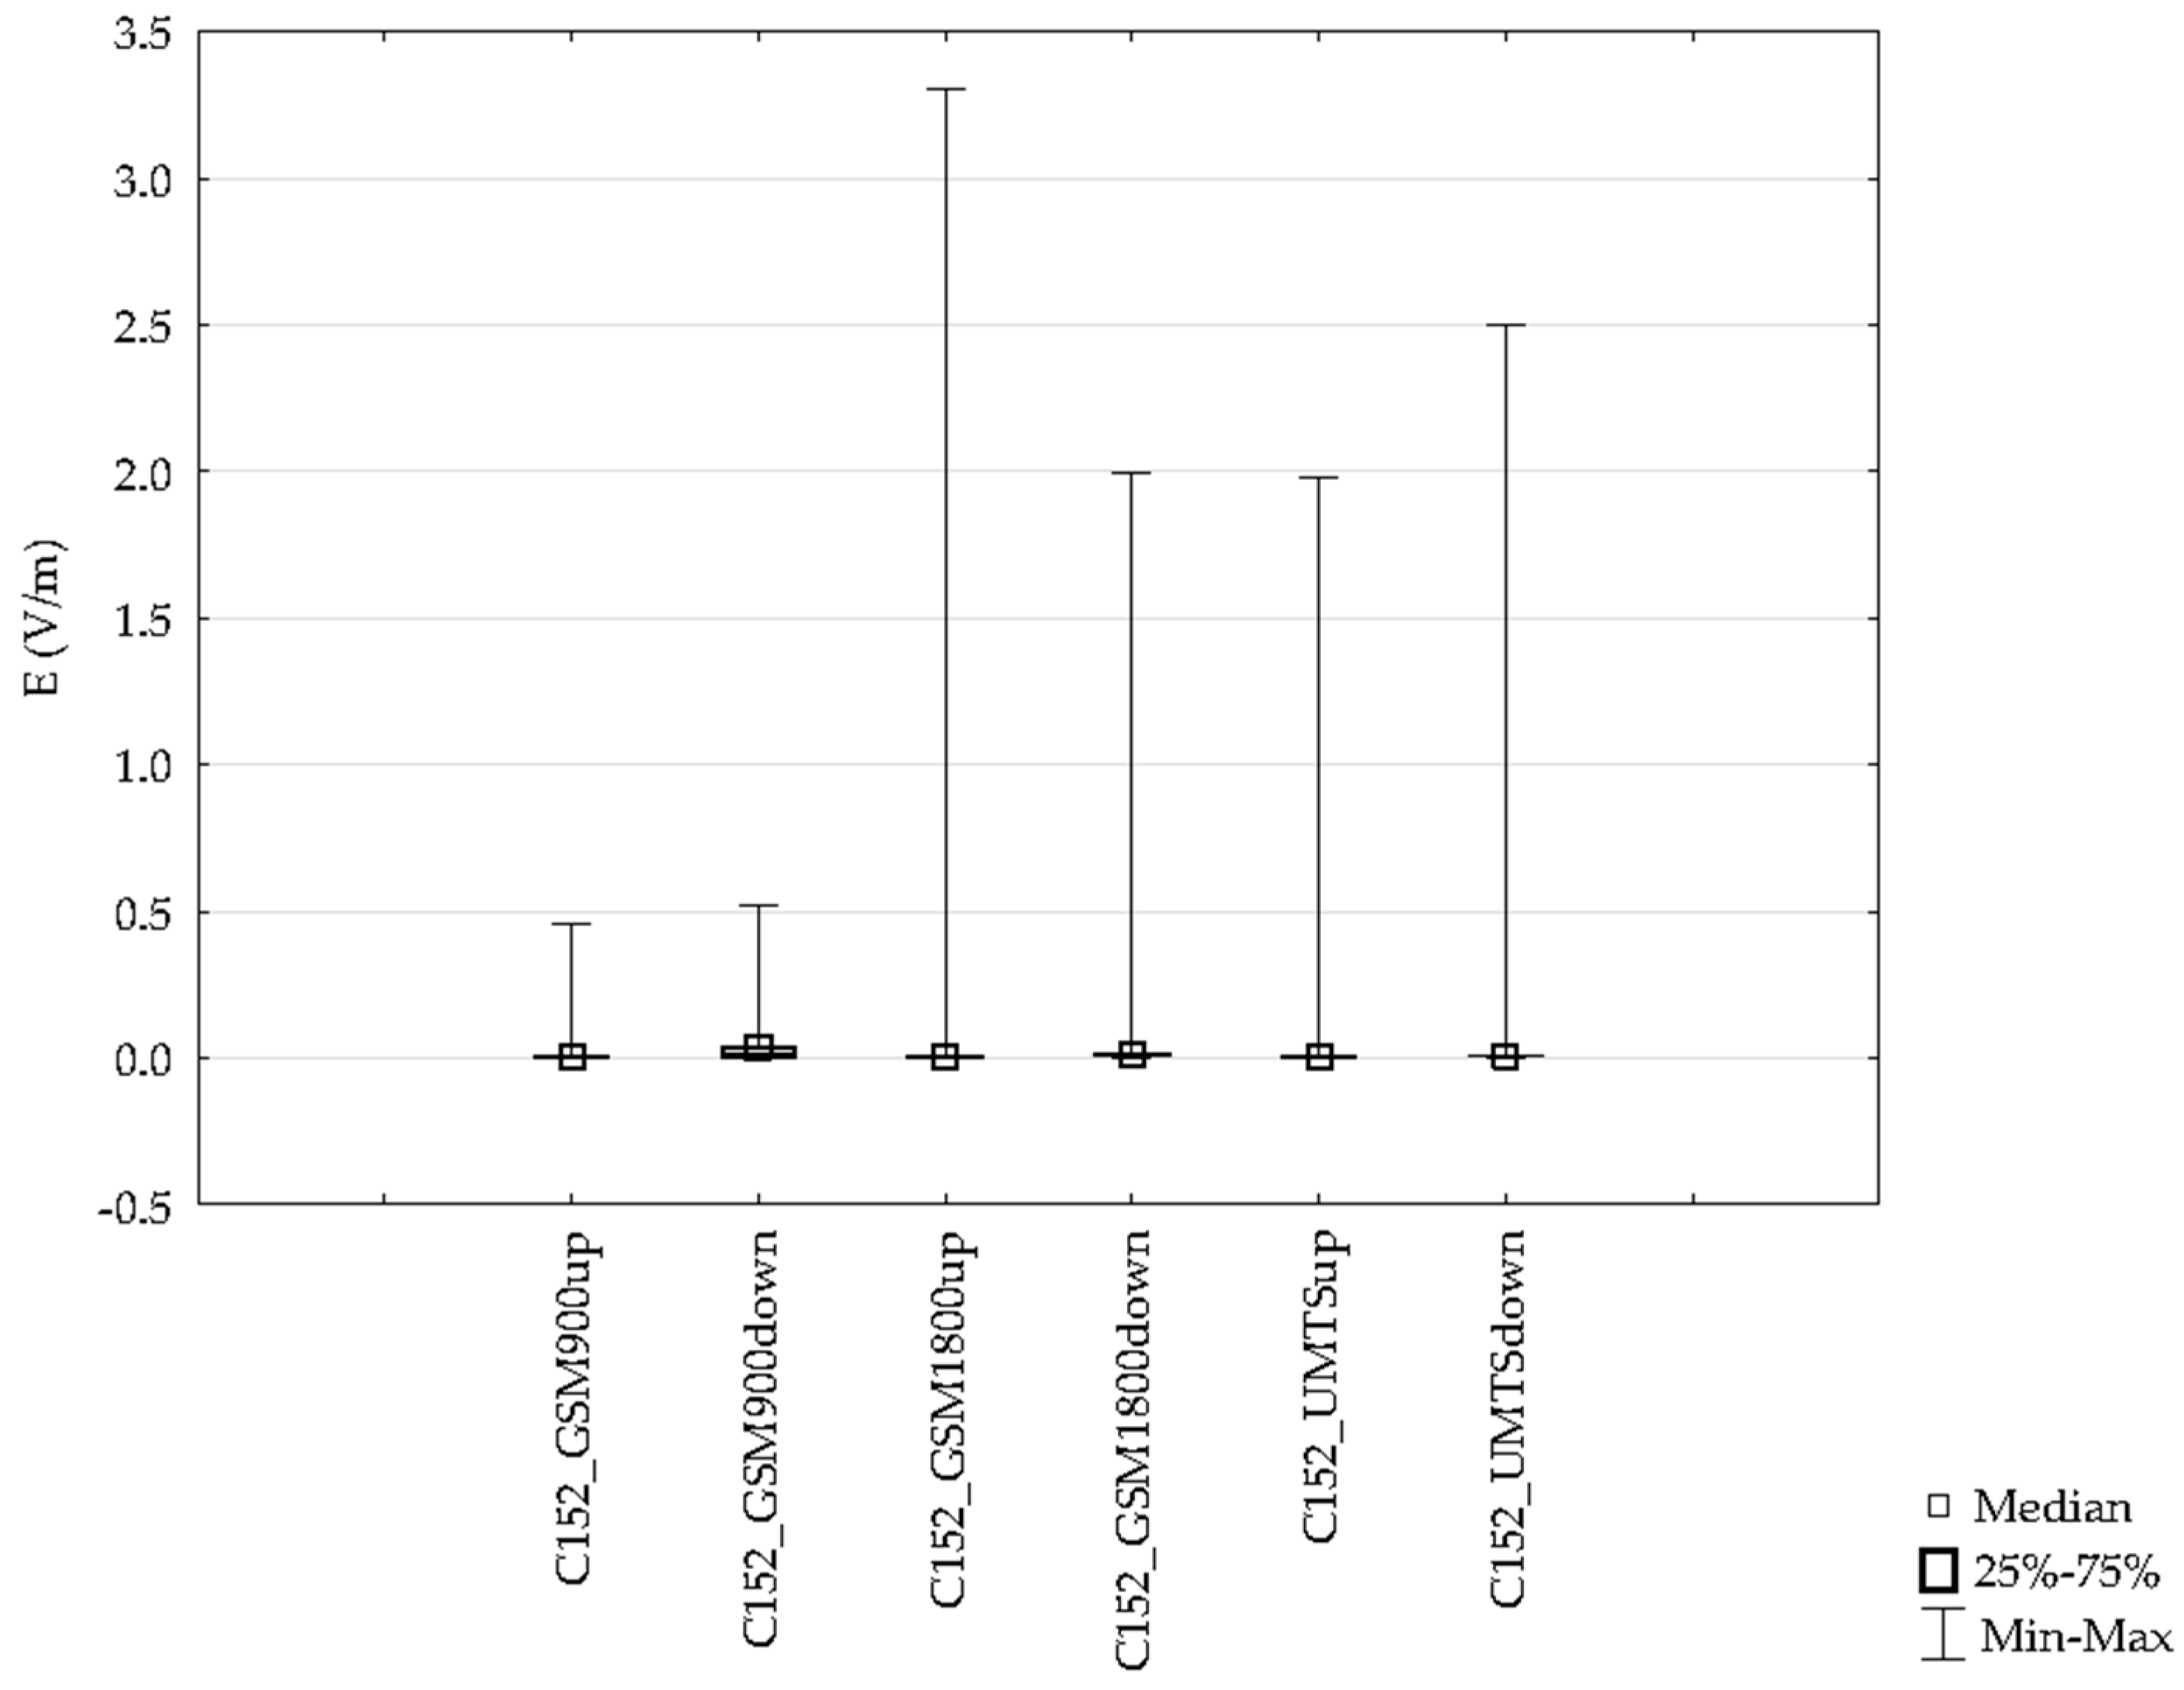
| Variable | Mean | Minimum | Maximum | SD |
|---|---|---|---|---|
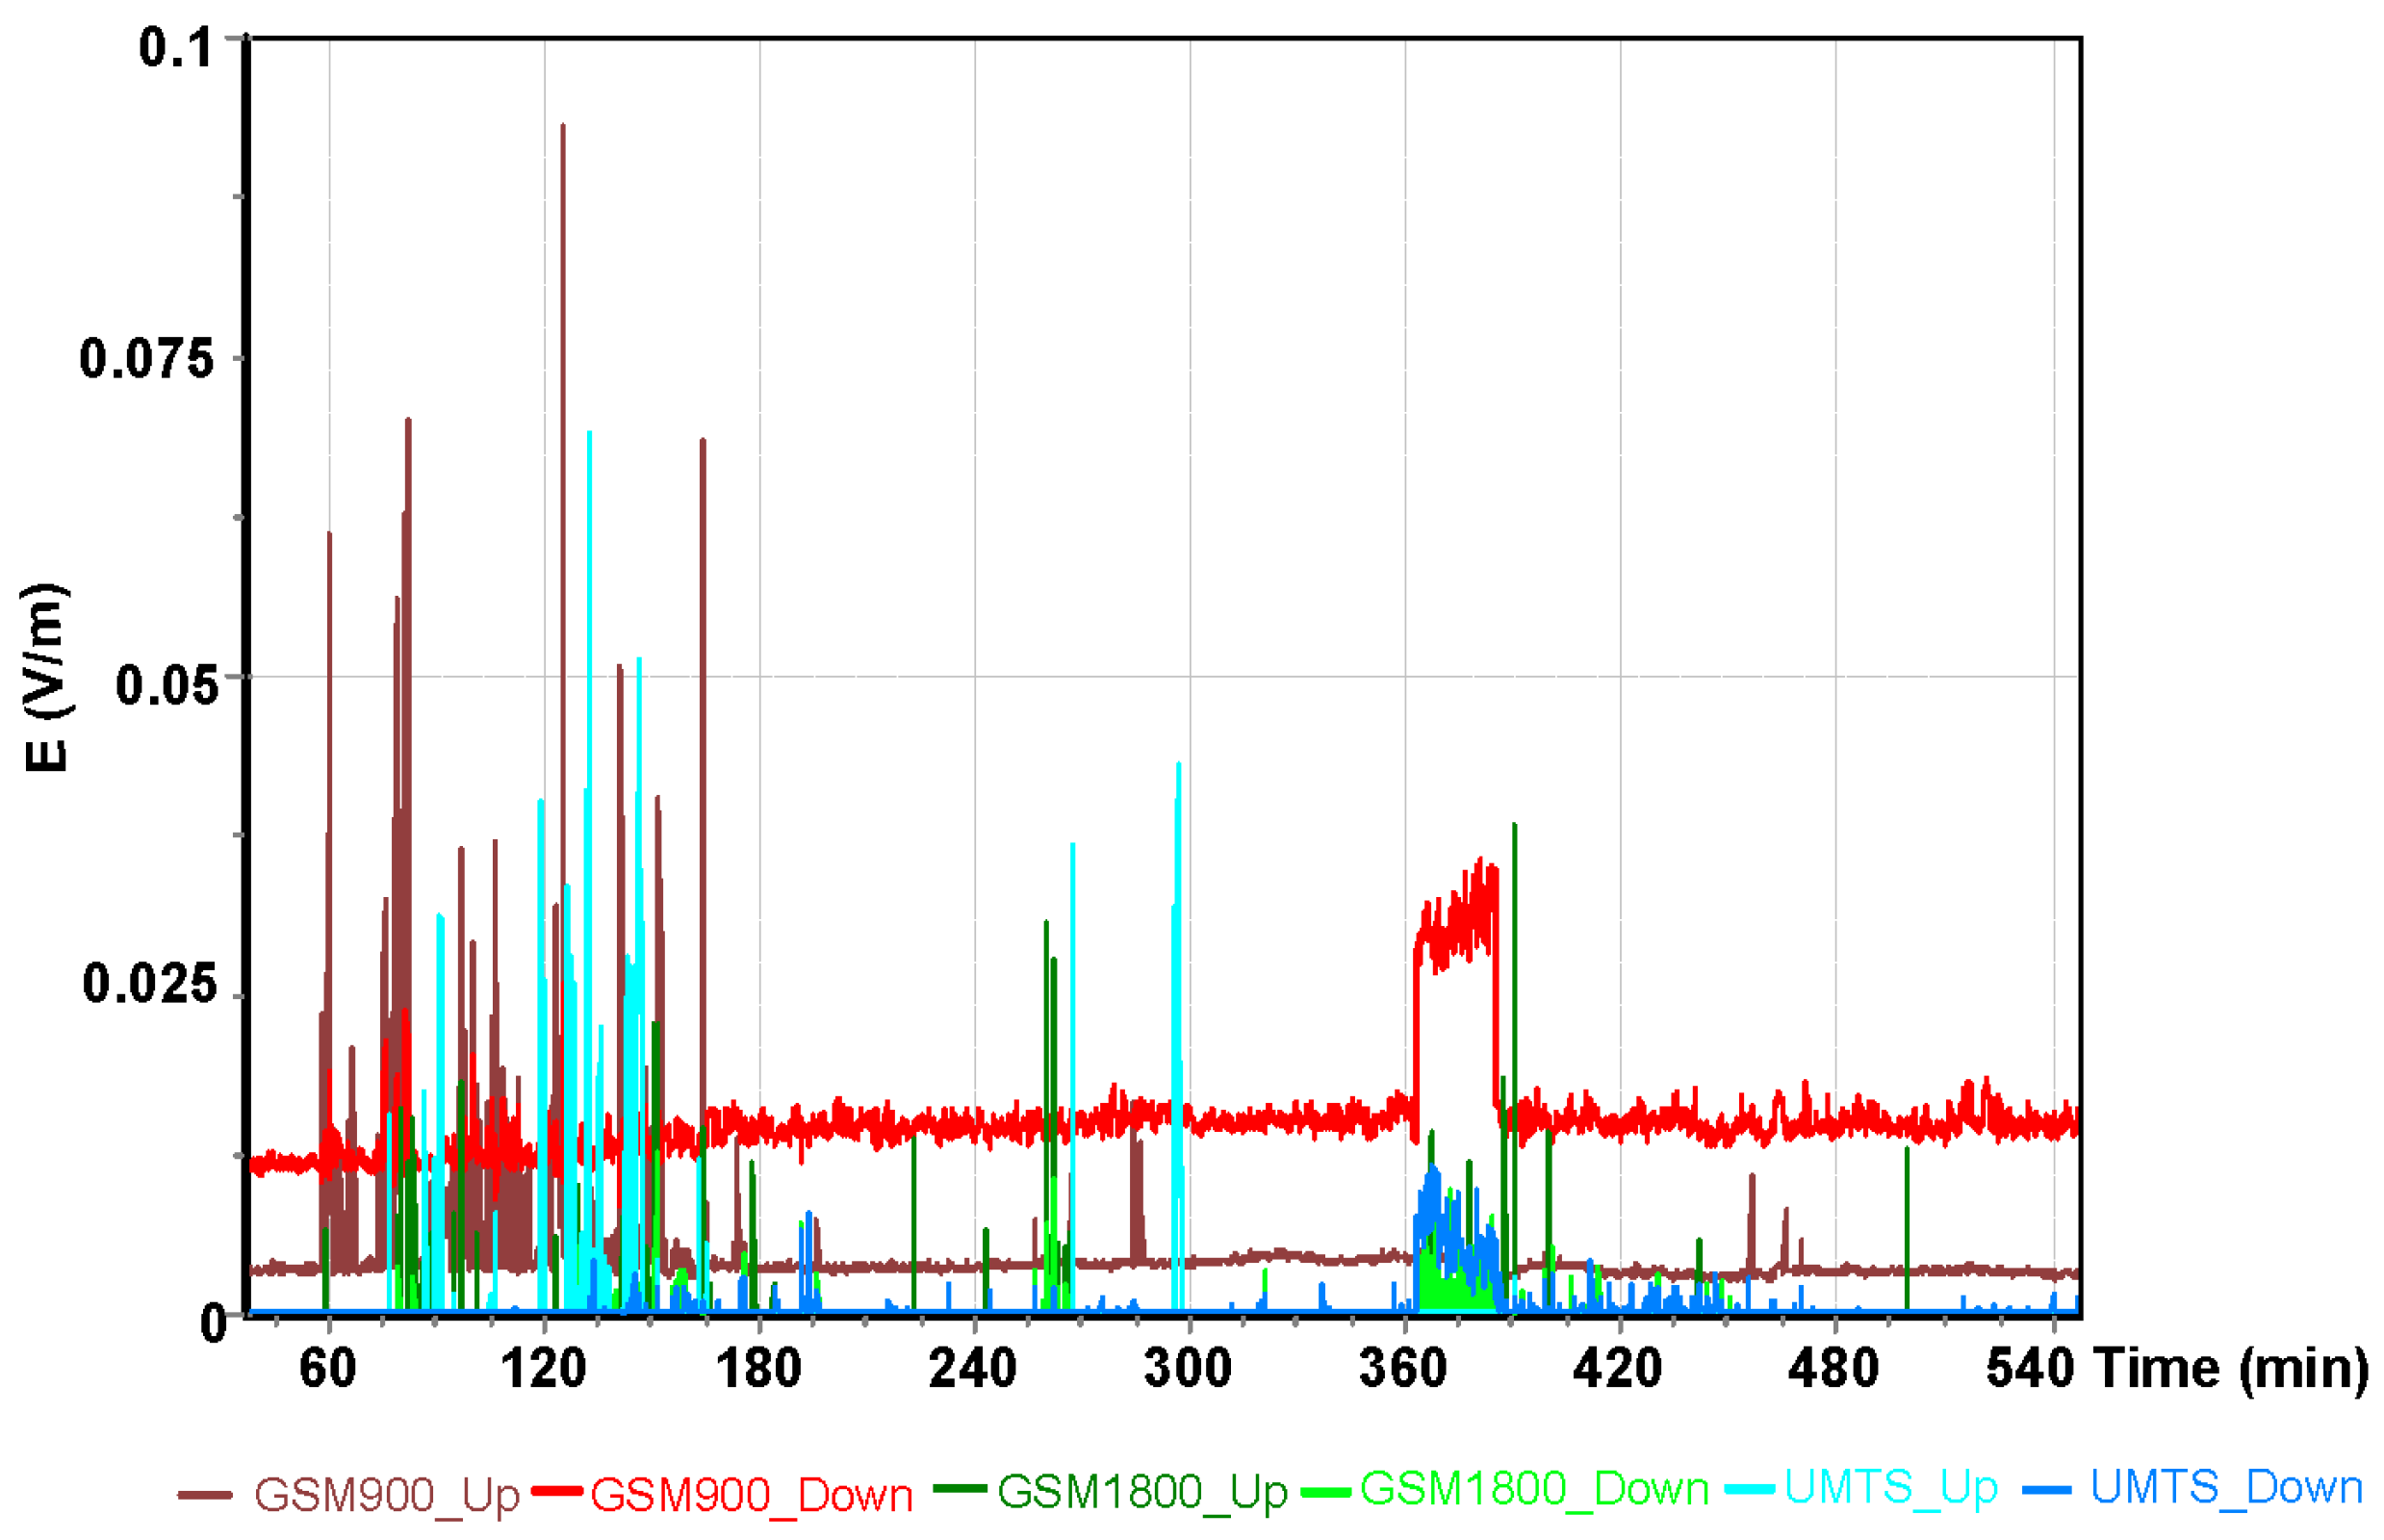
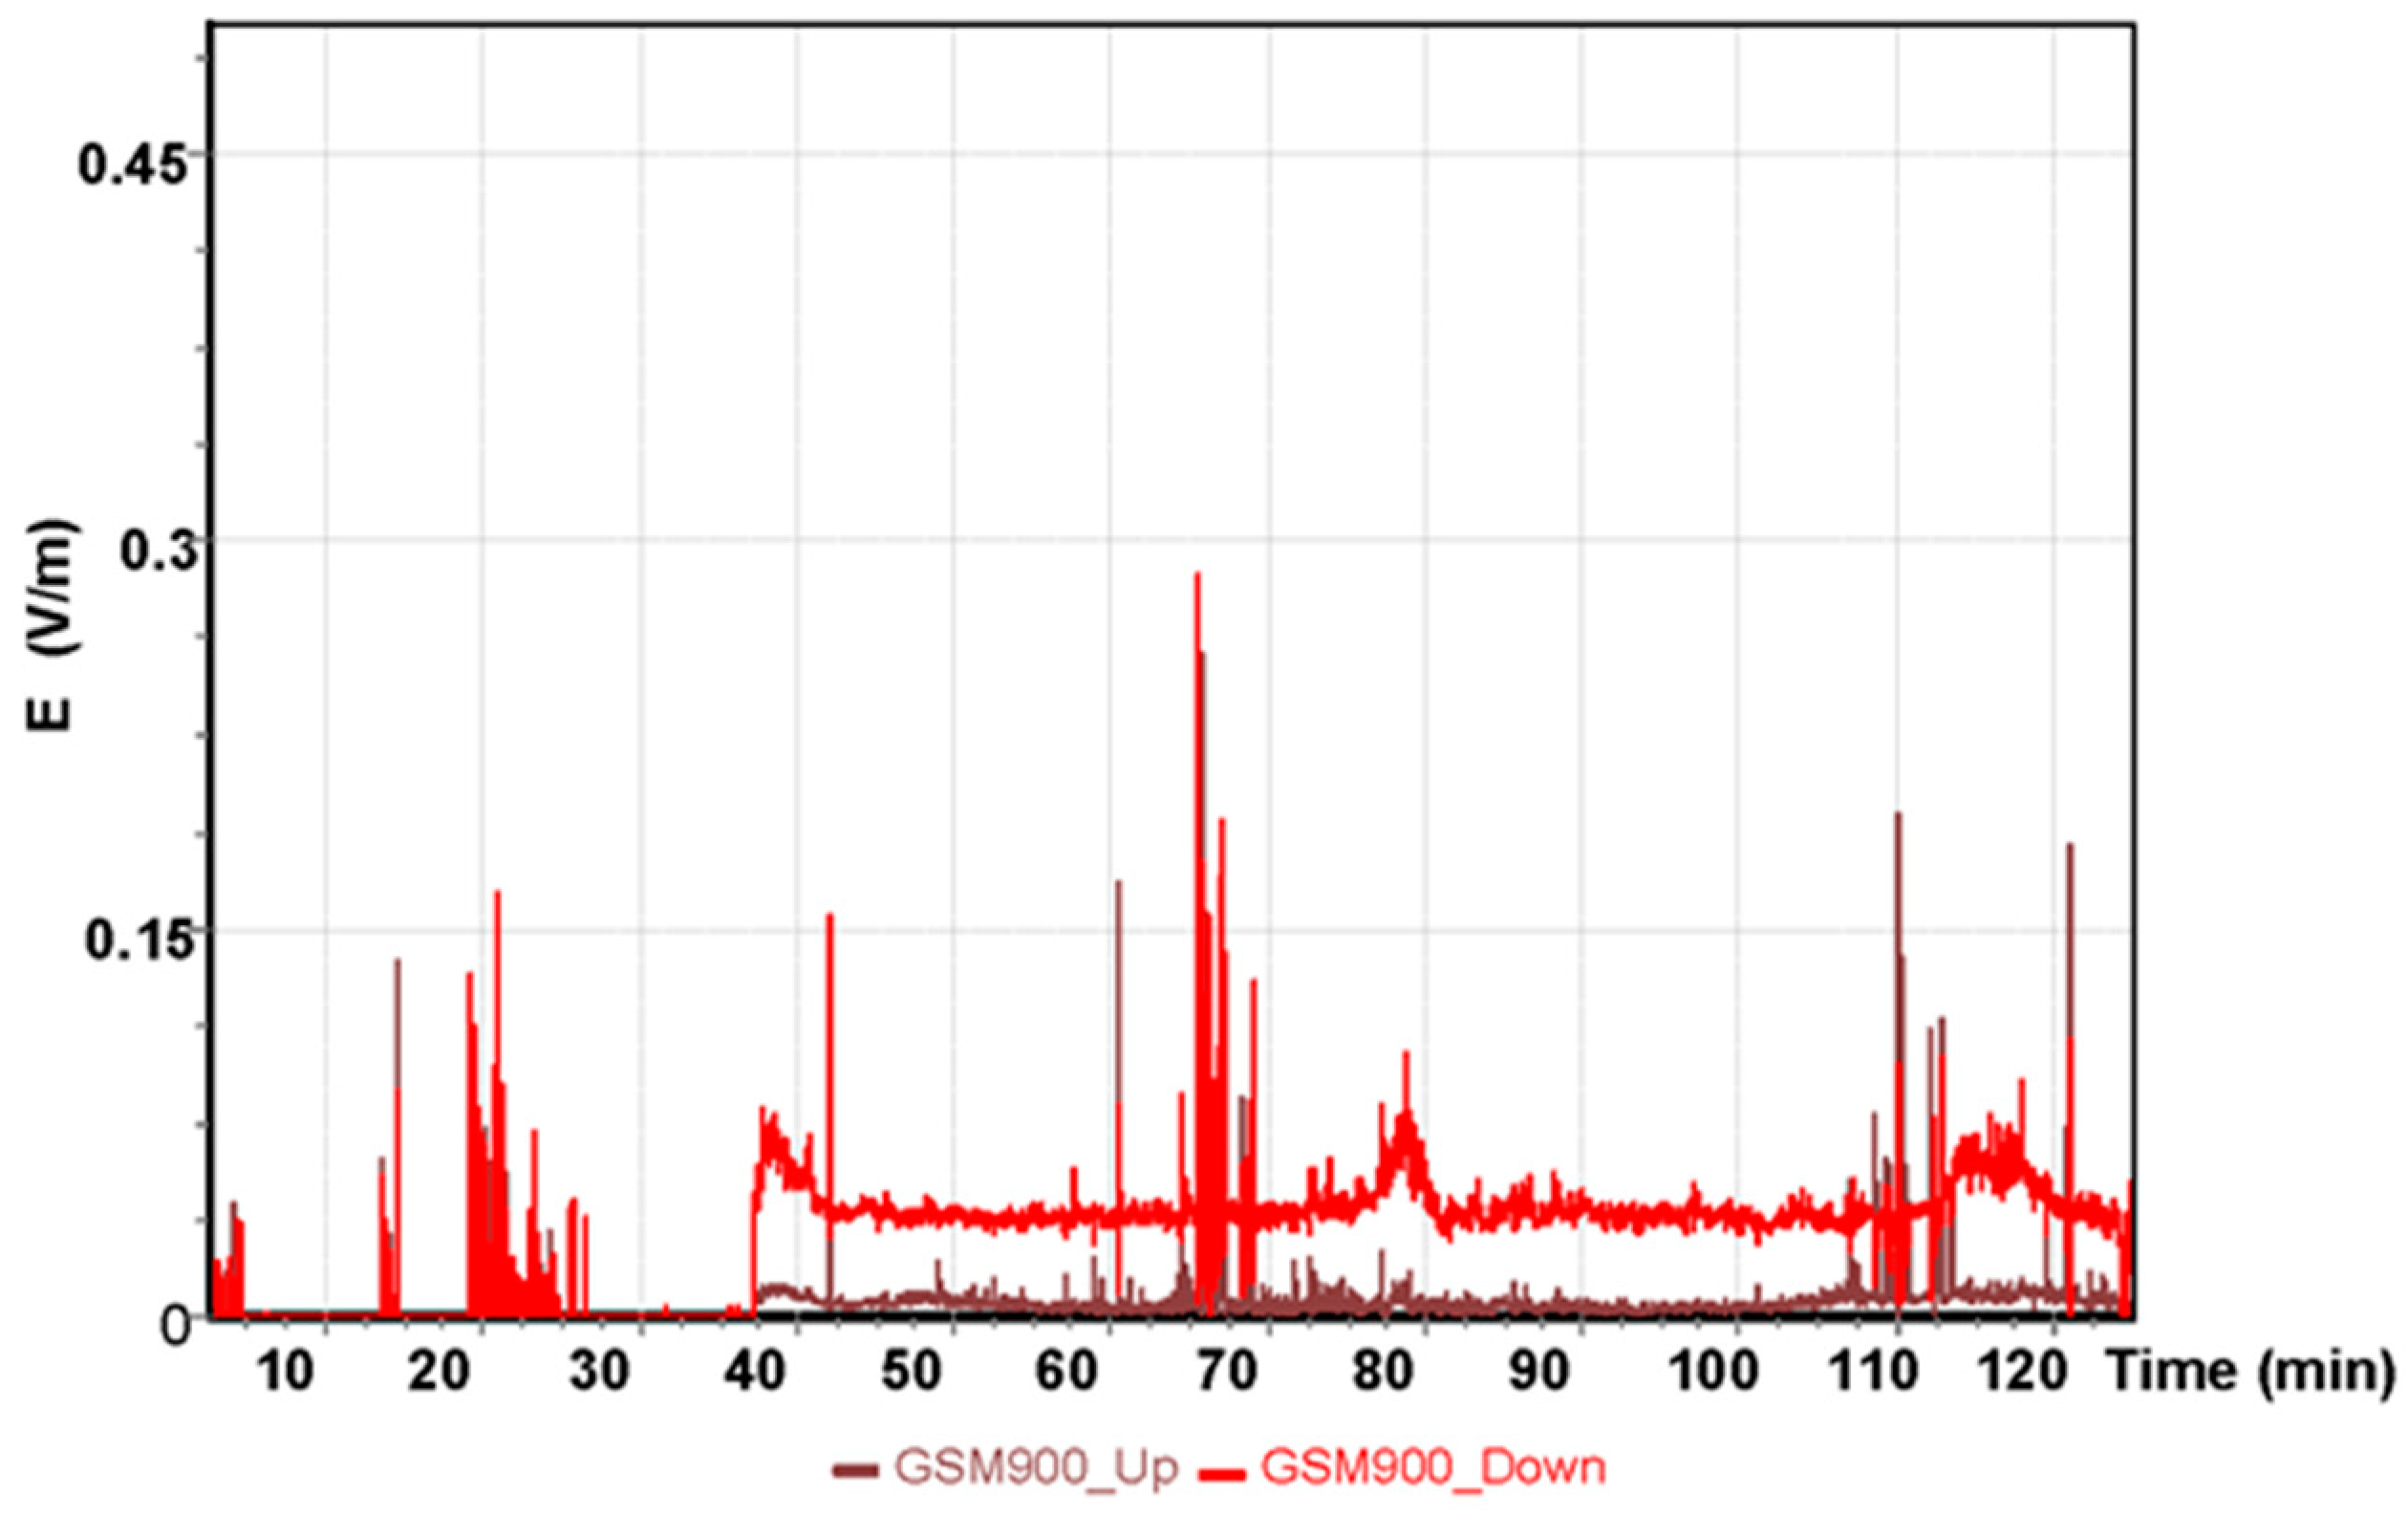
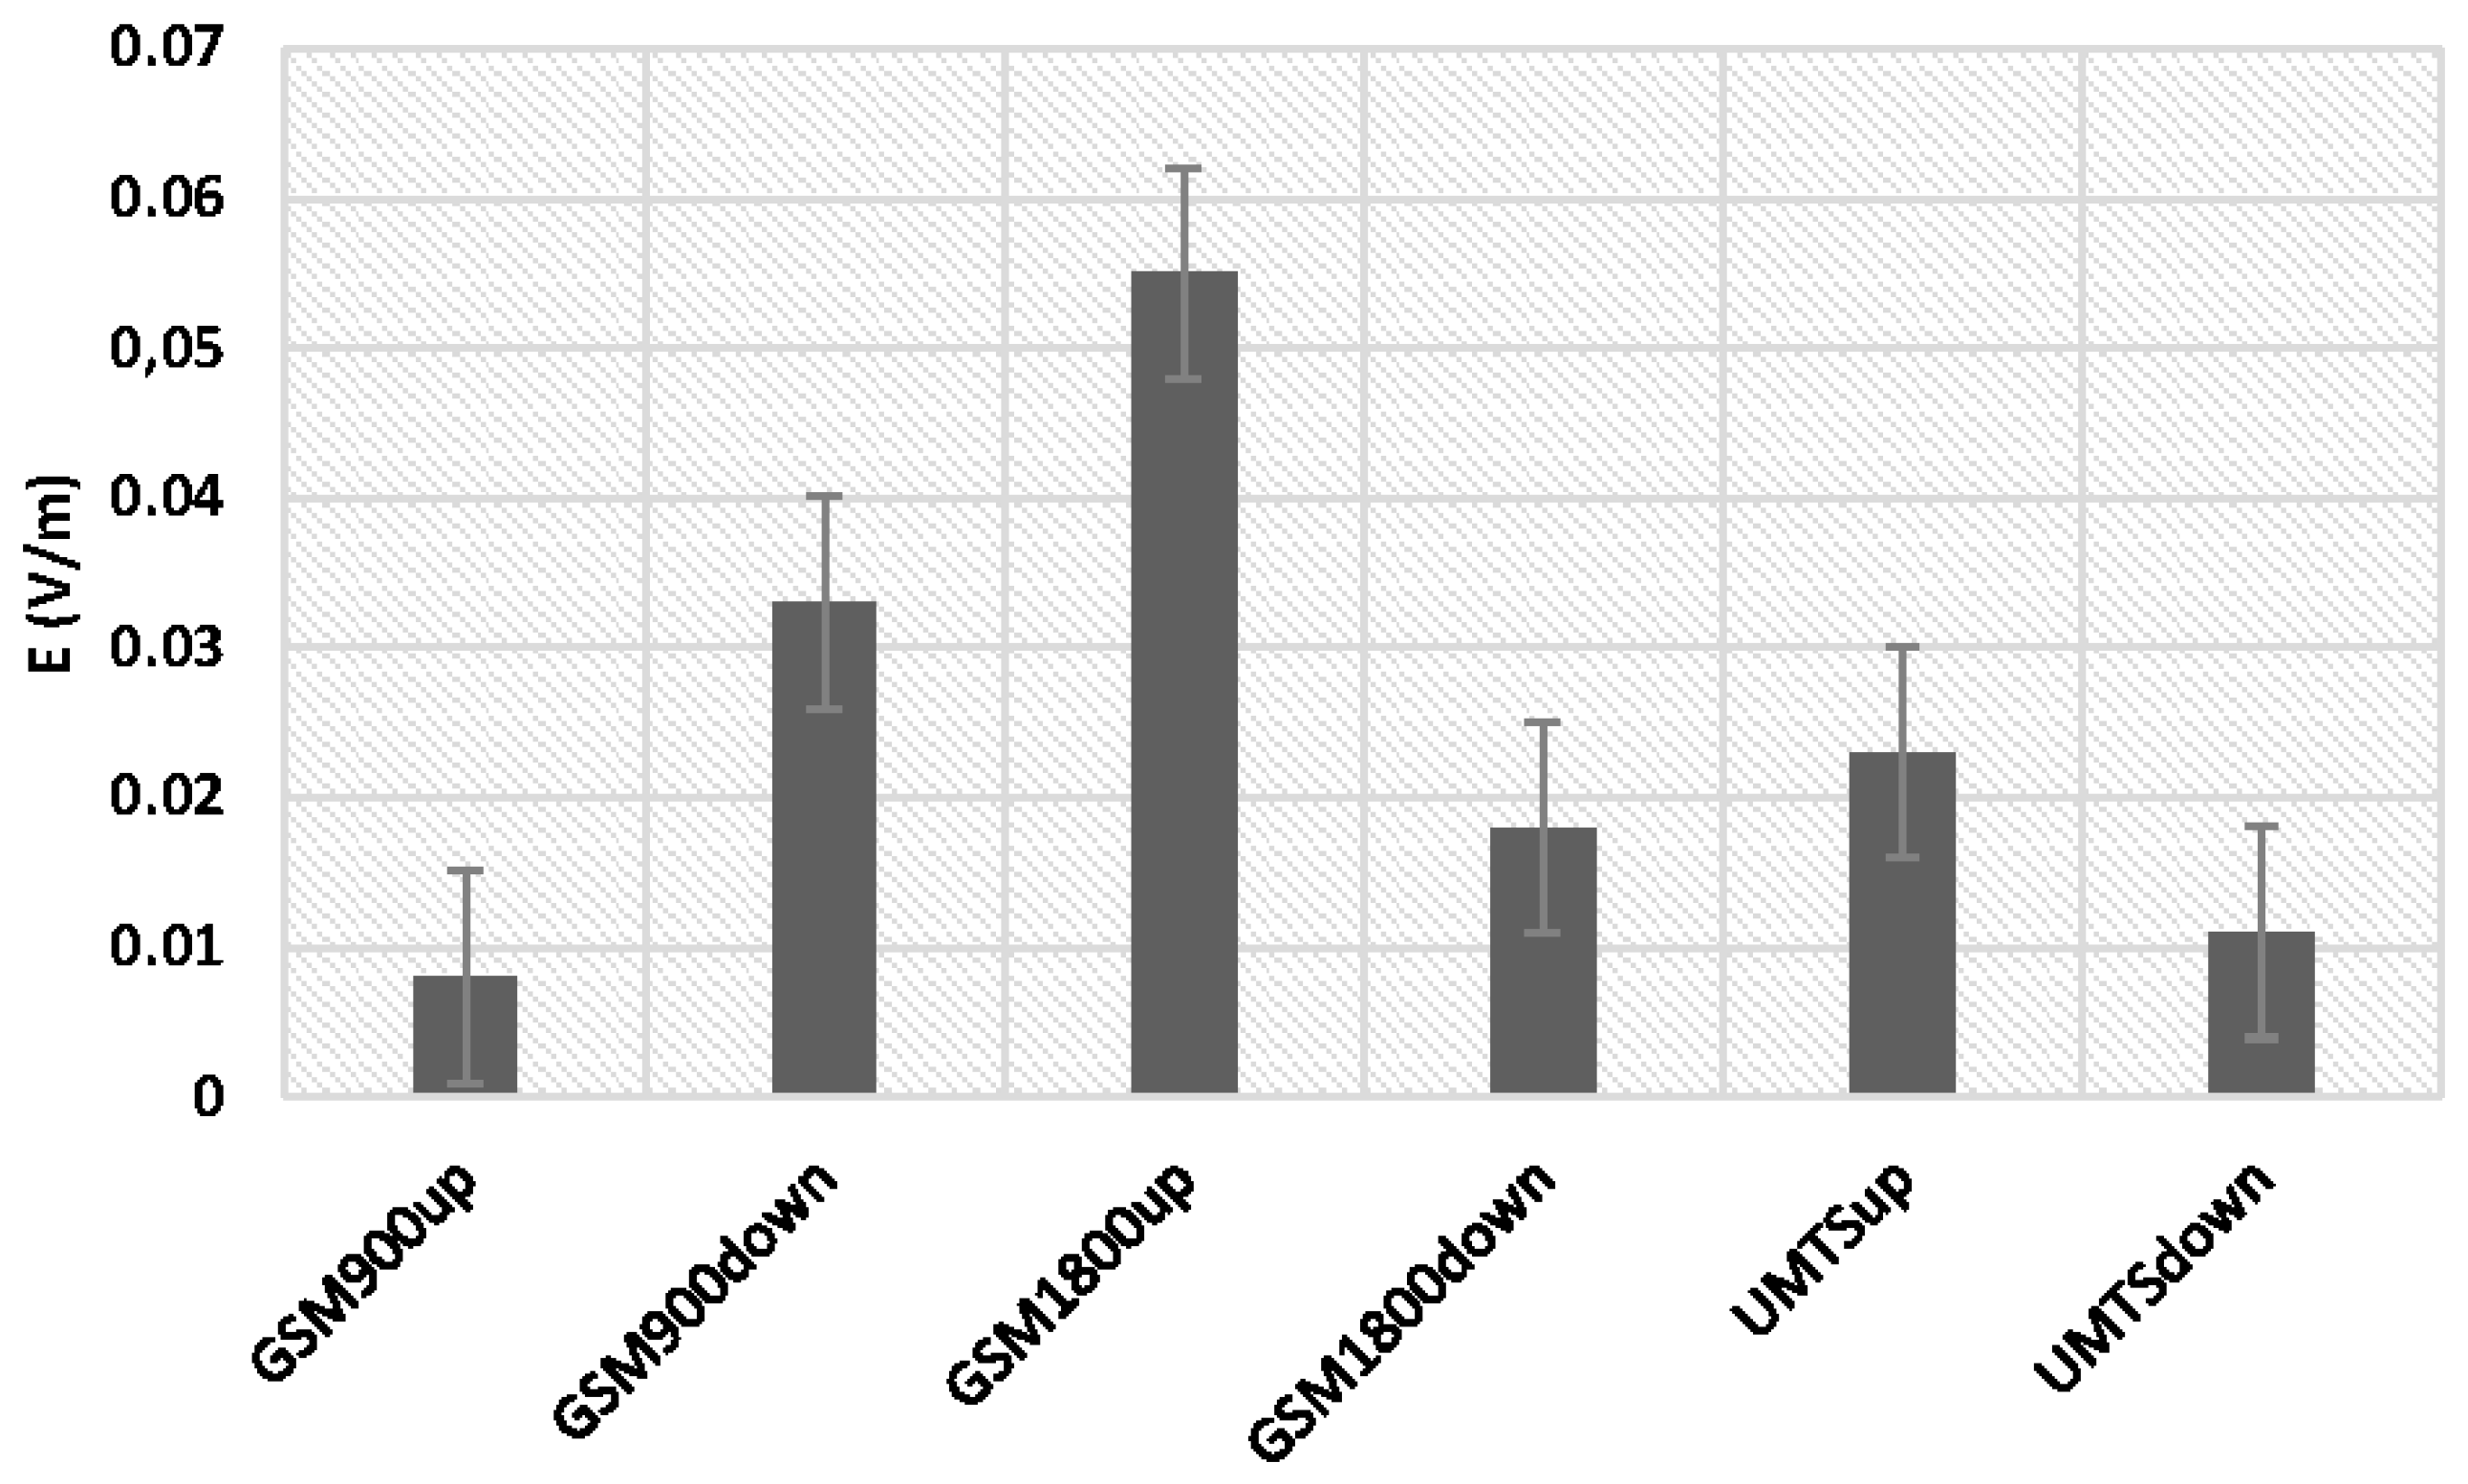
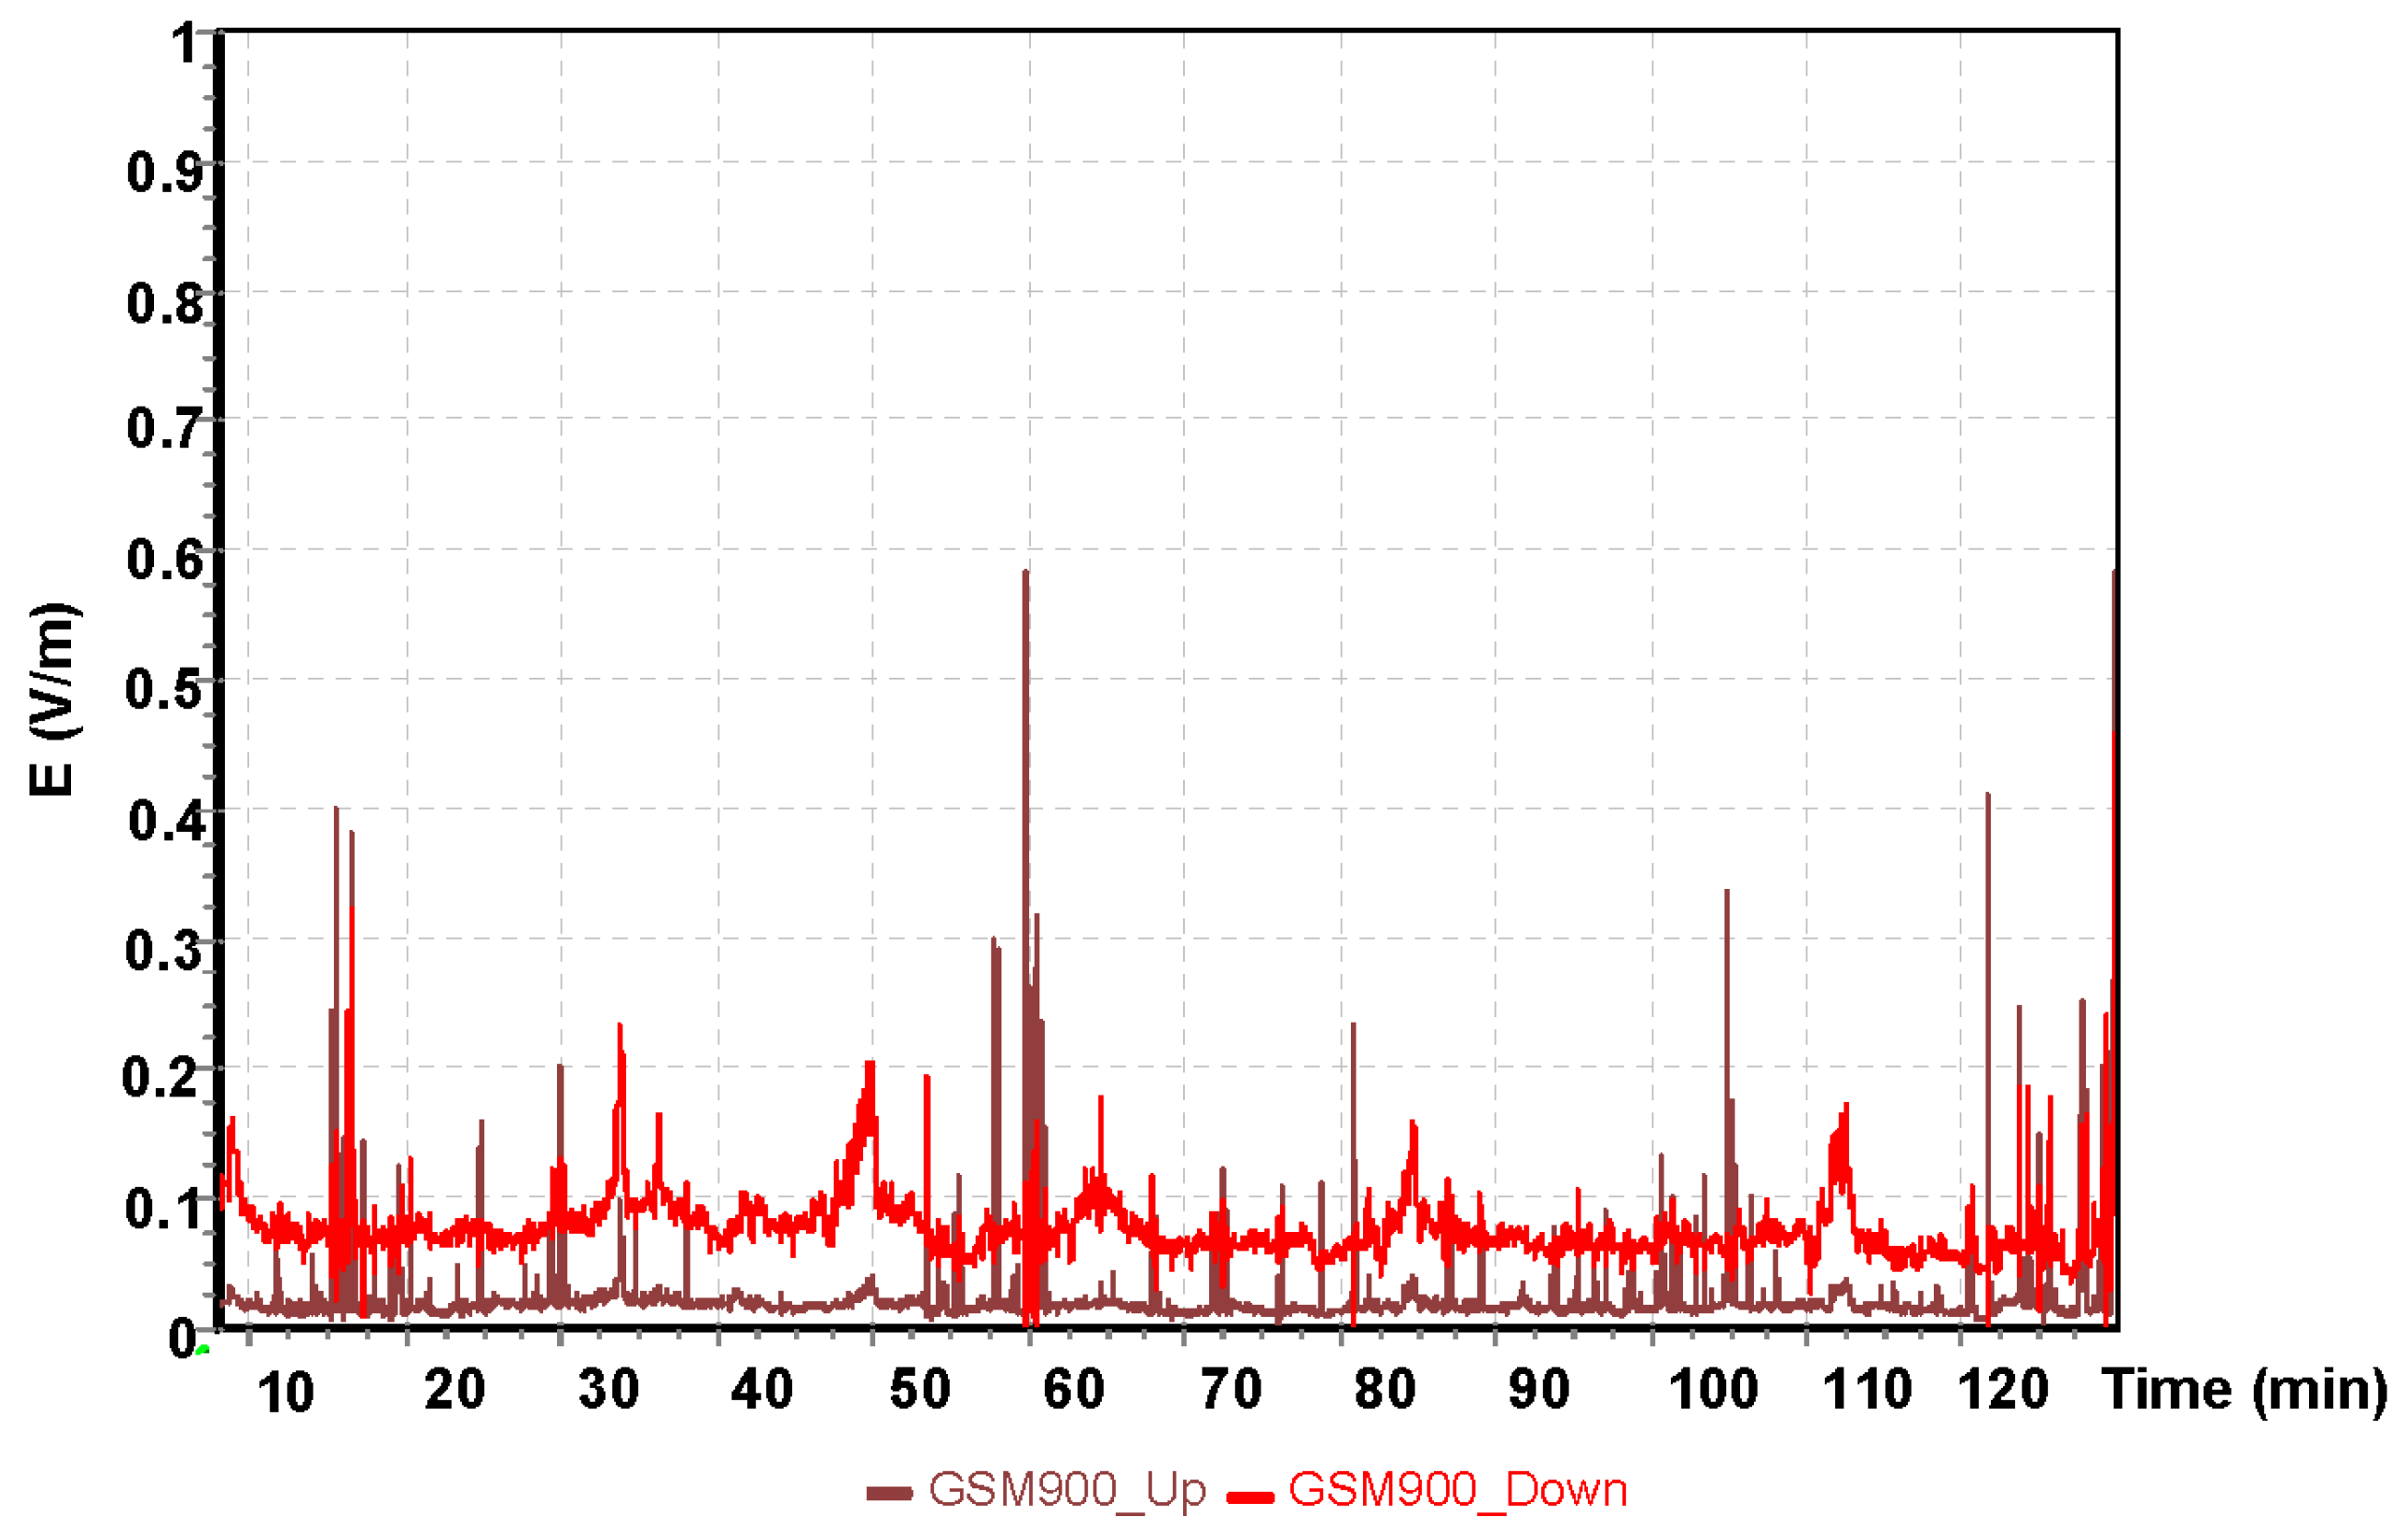
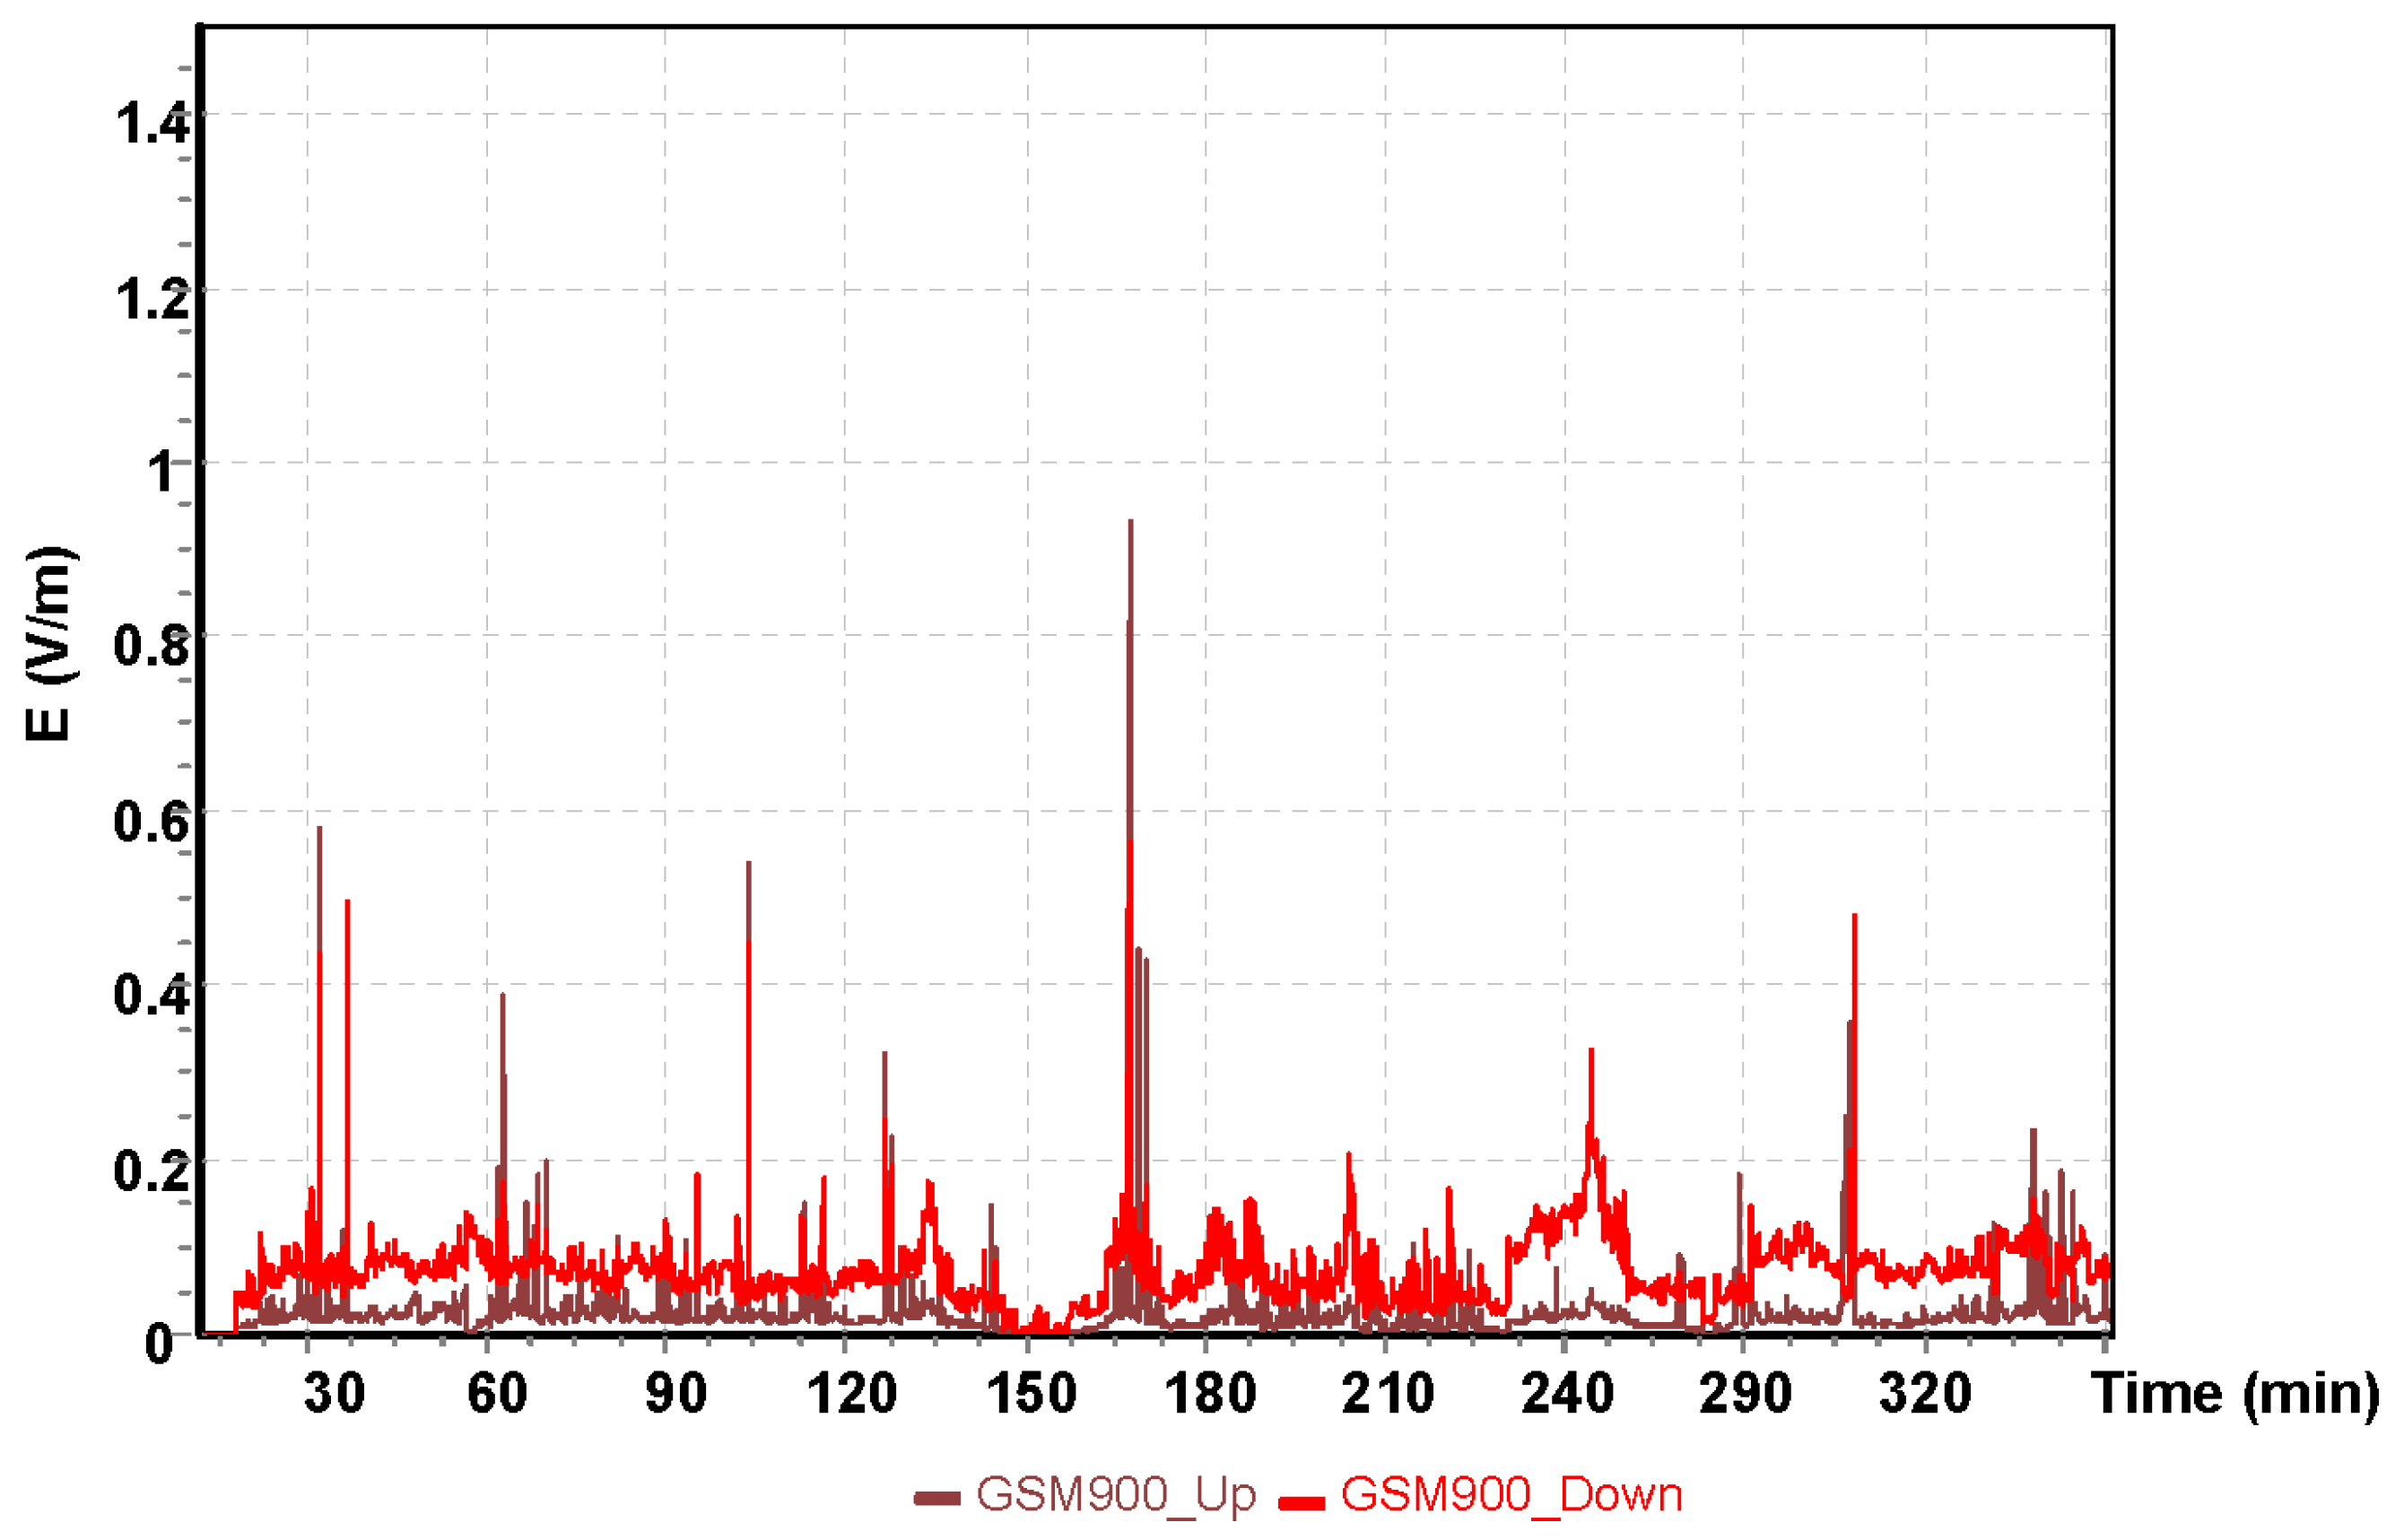
| GSM900up | 0.0072 | 0.000 | 0.4539 | 0.0194 |
| GSM900down | 0.0315 | 0.000 | 0.5178 | 0.0260 |
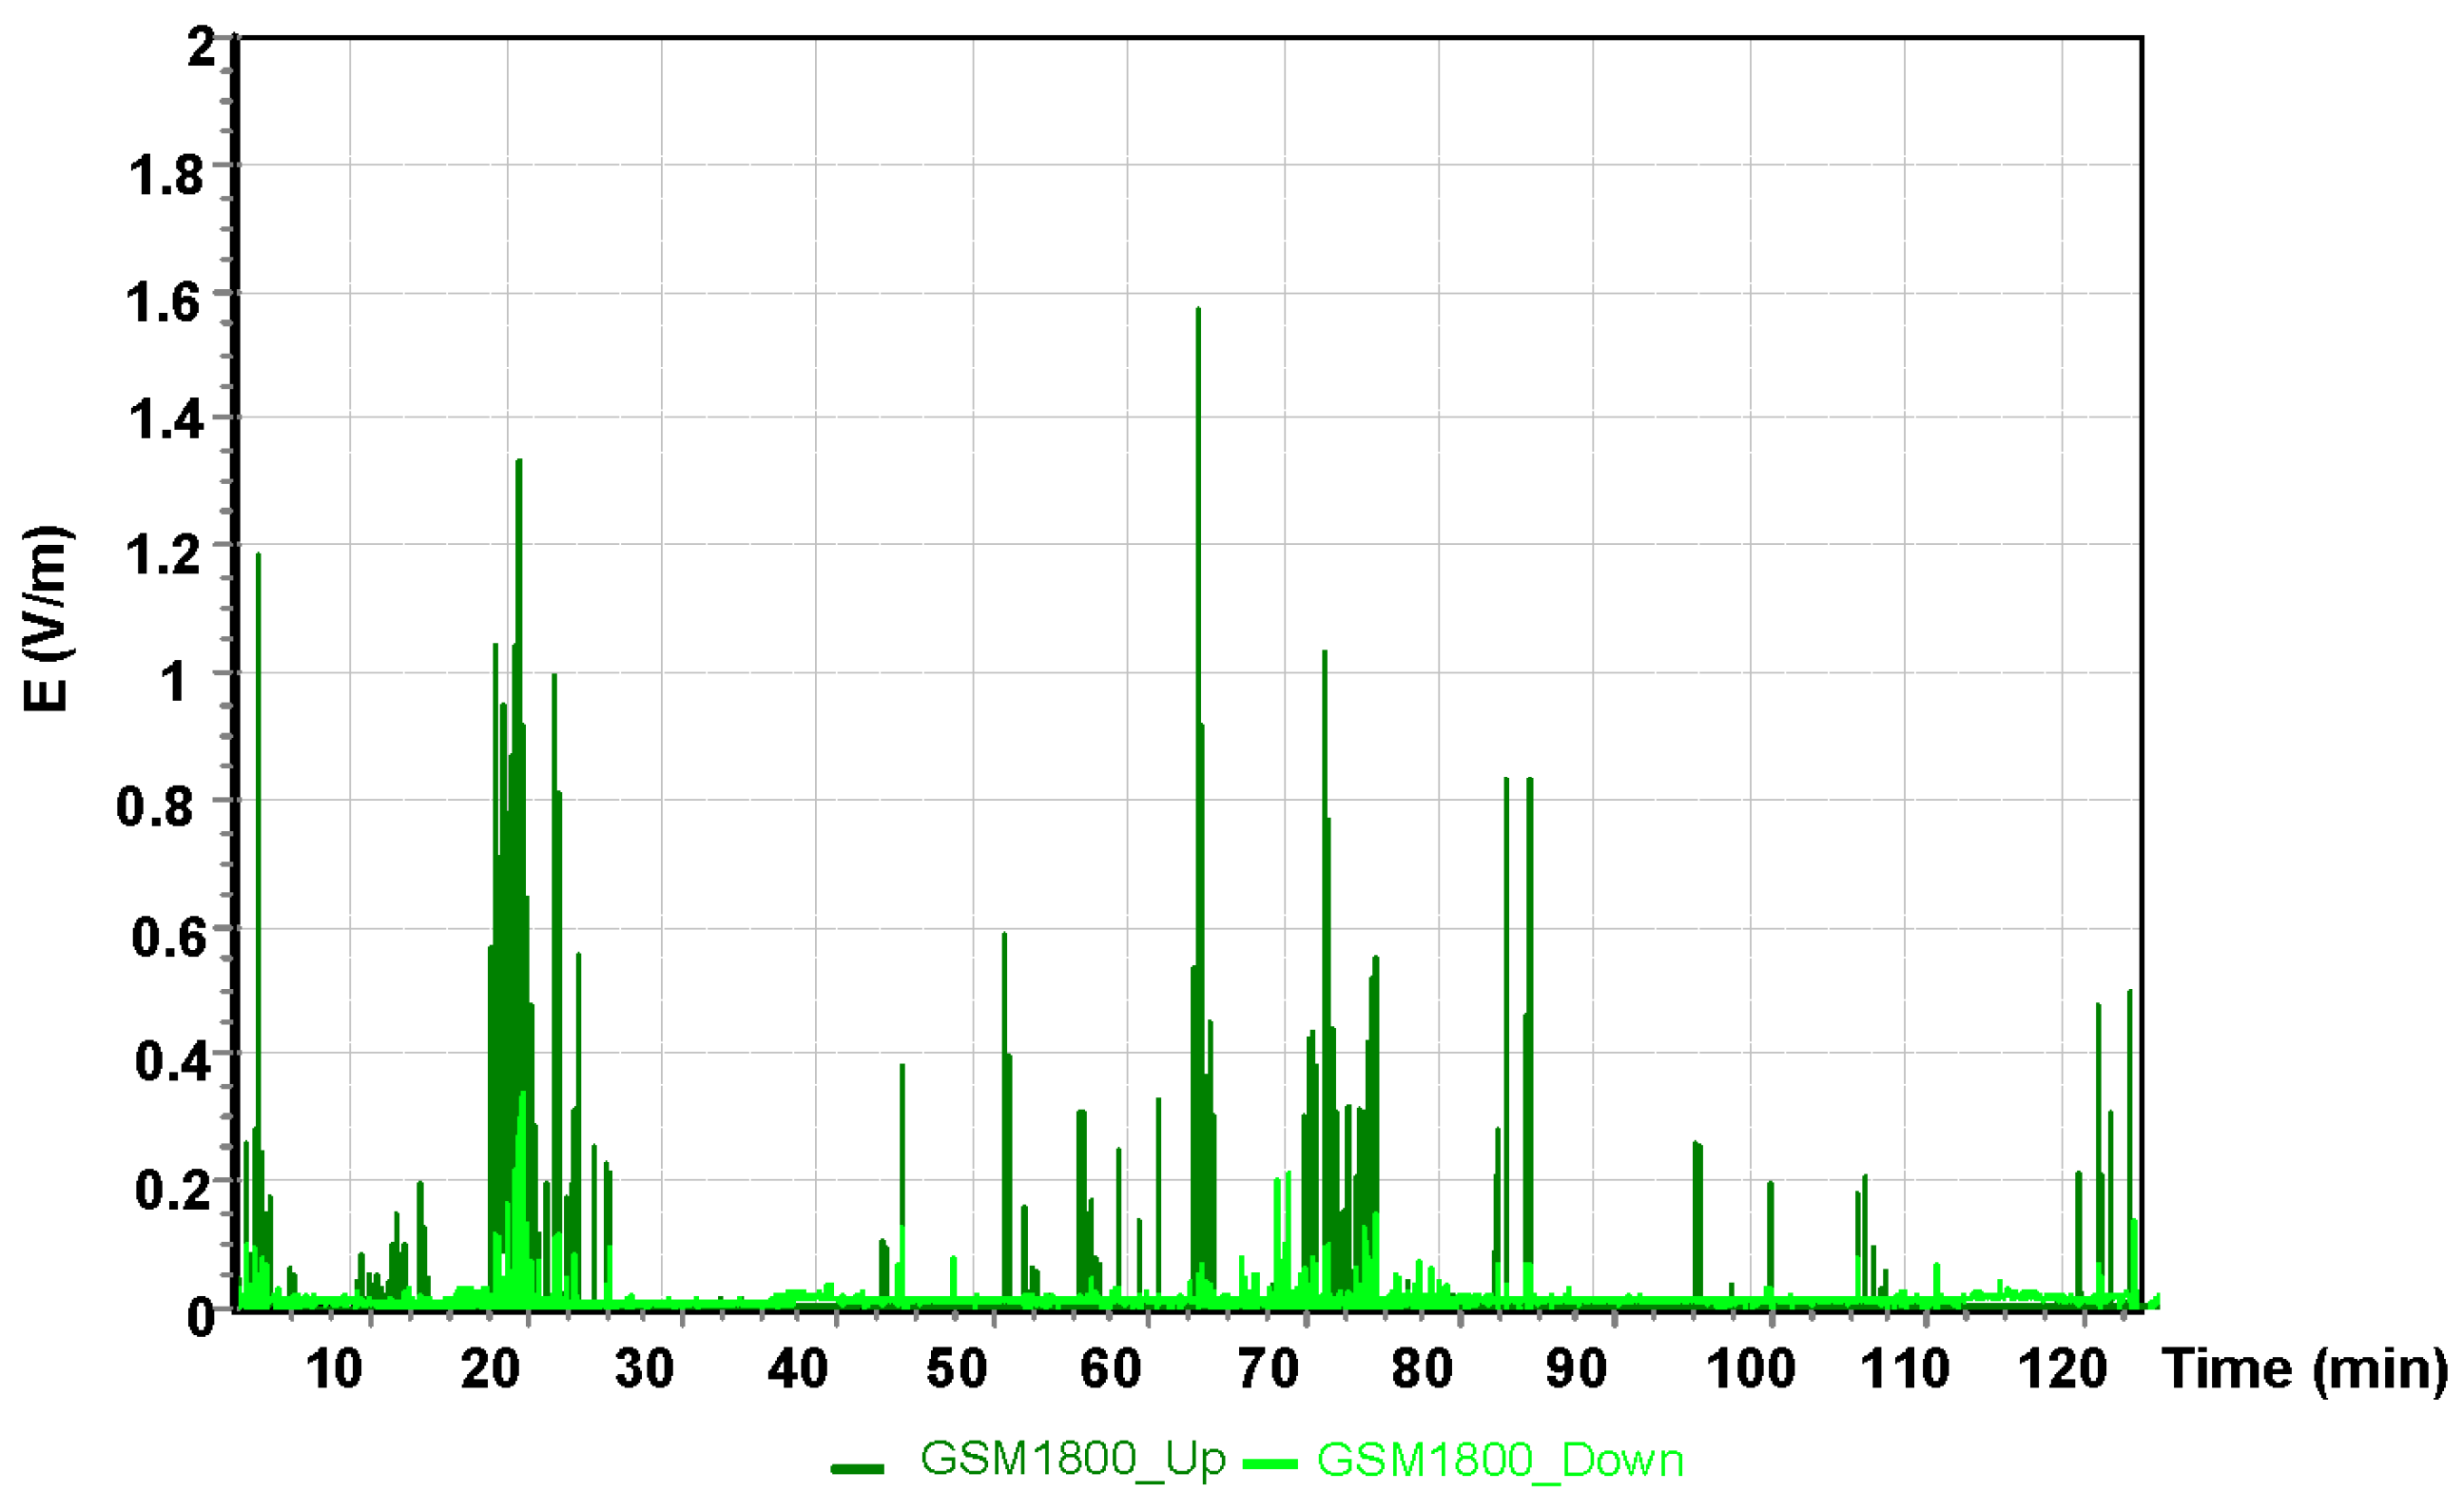
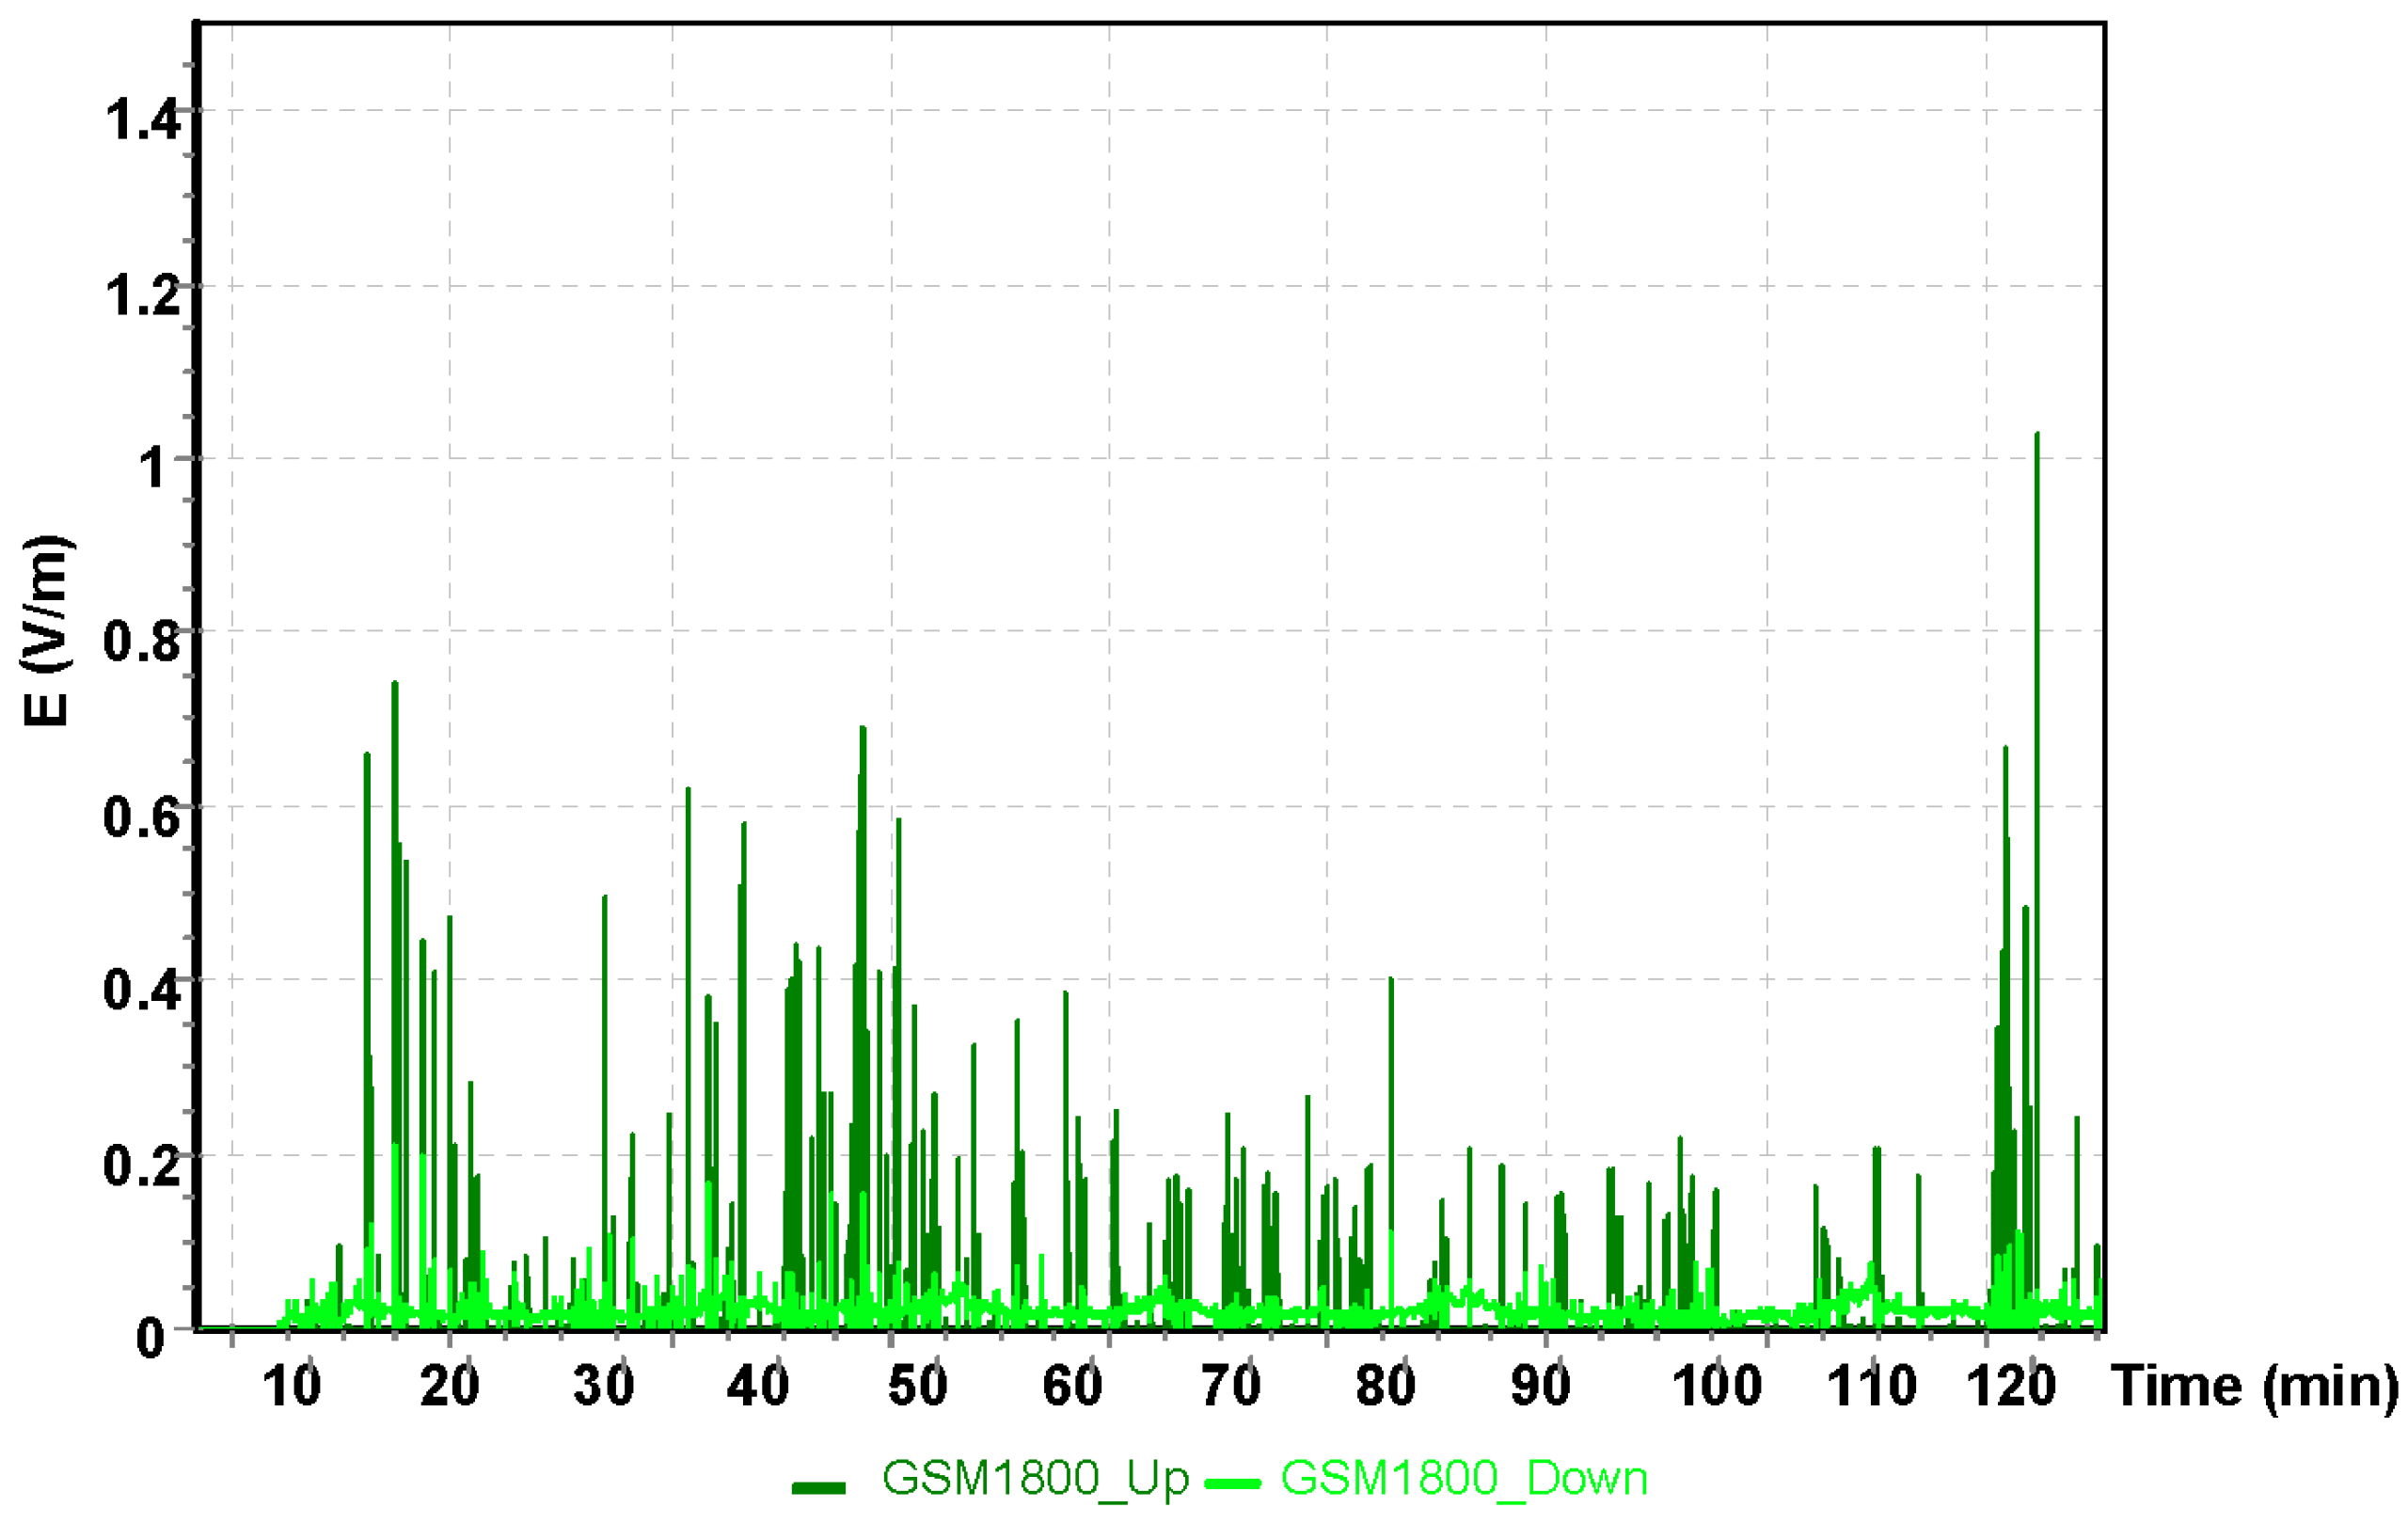
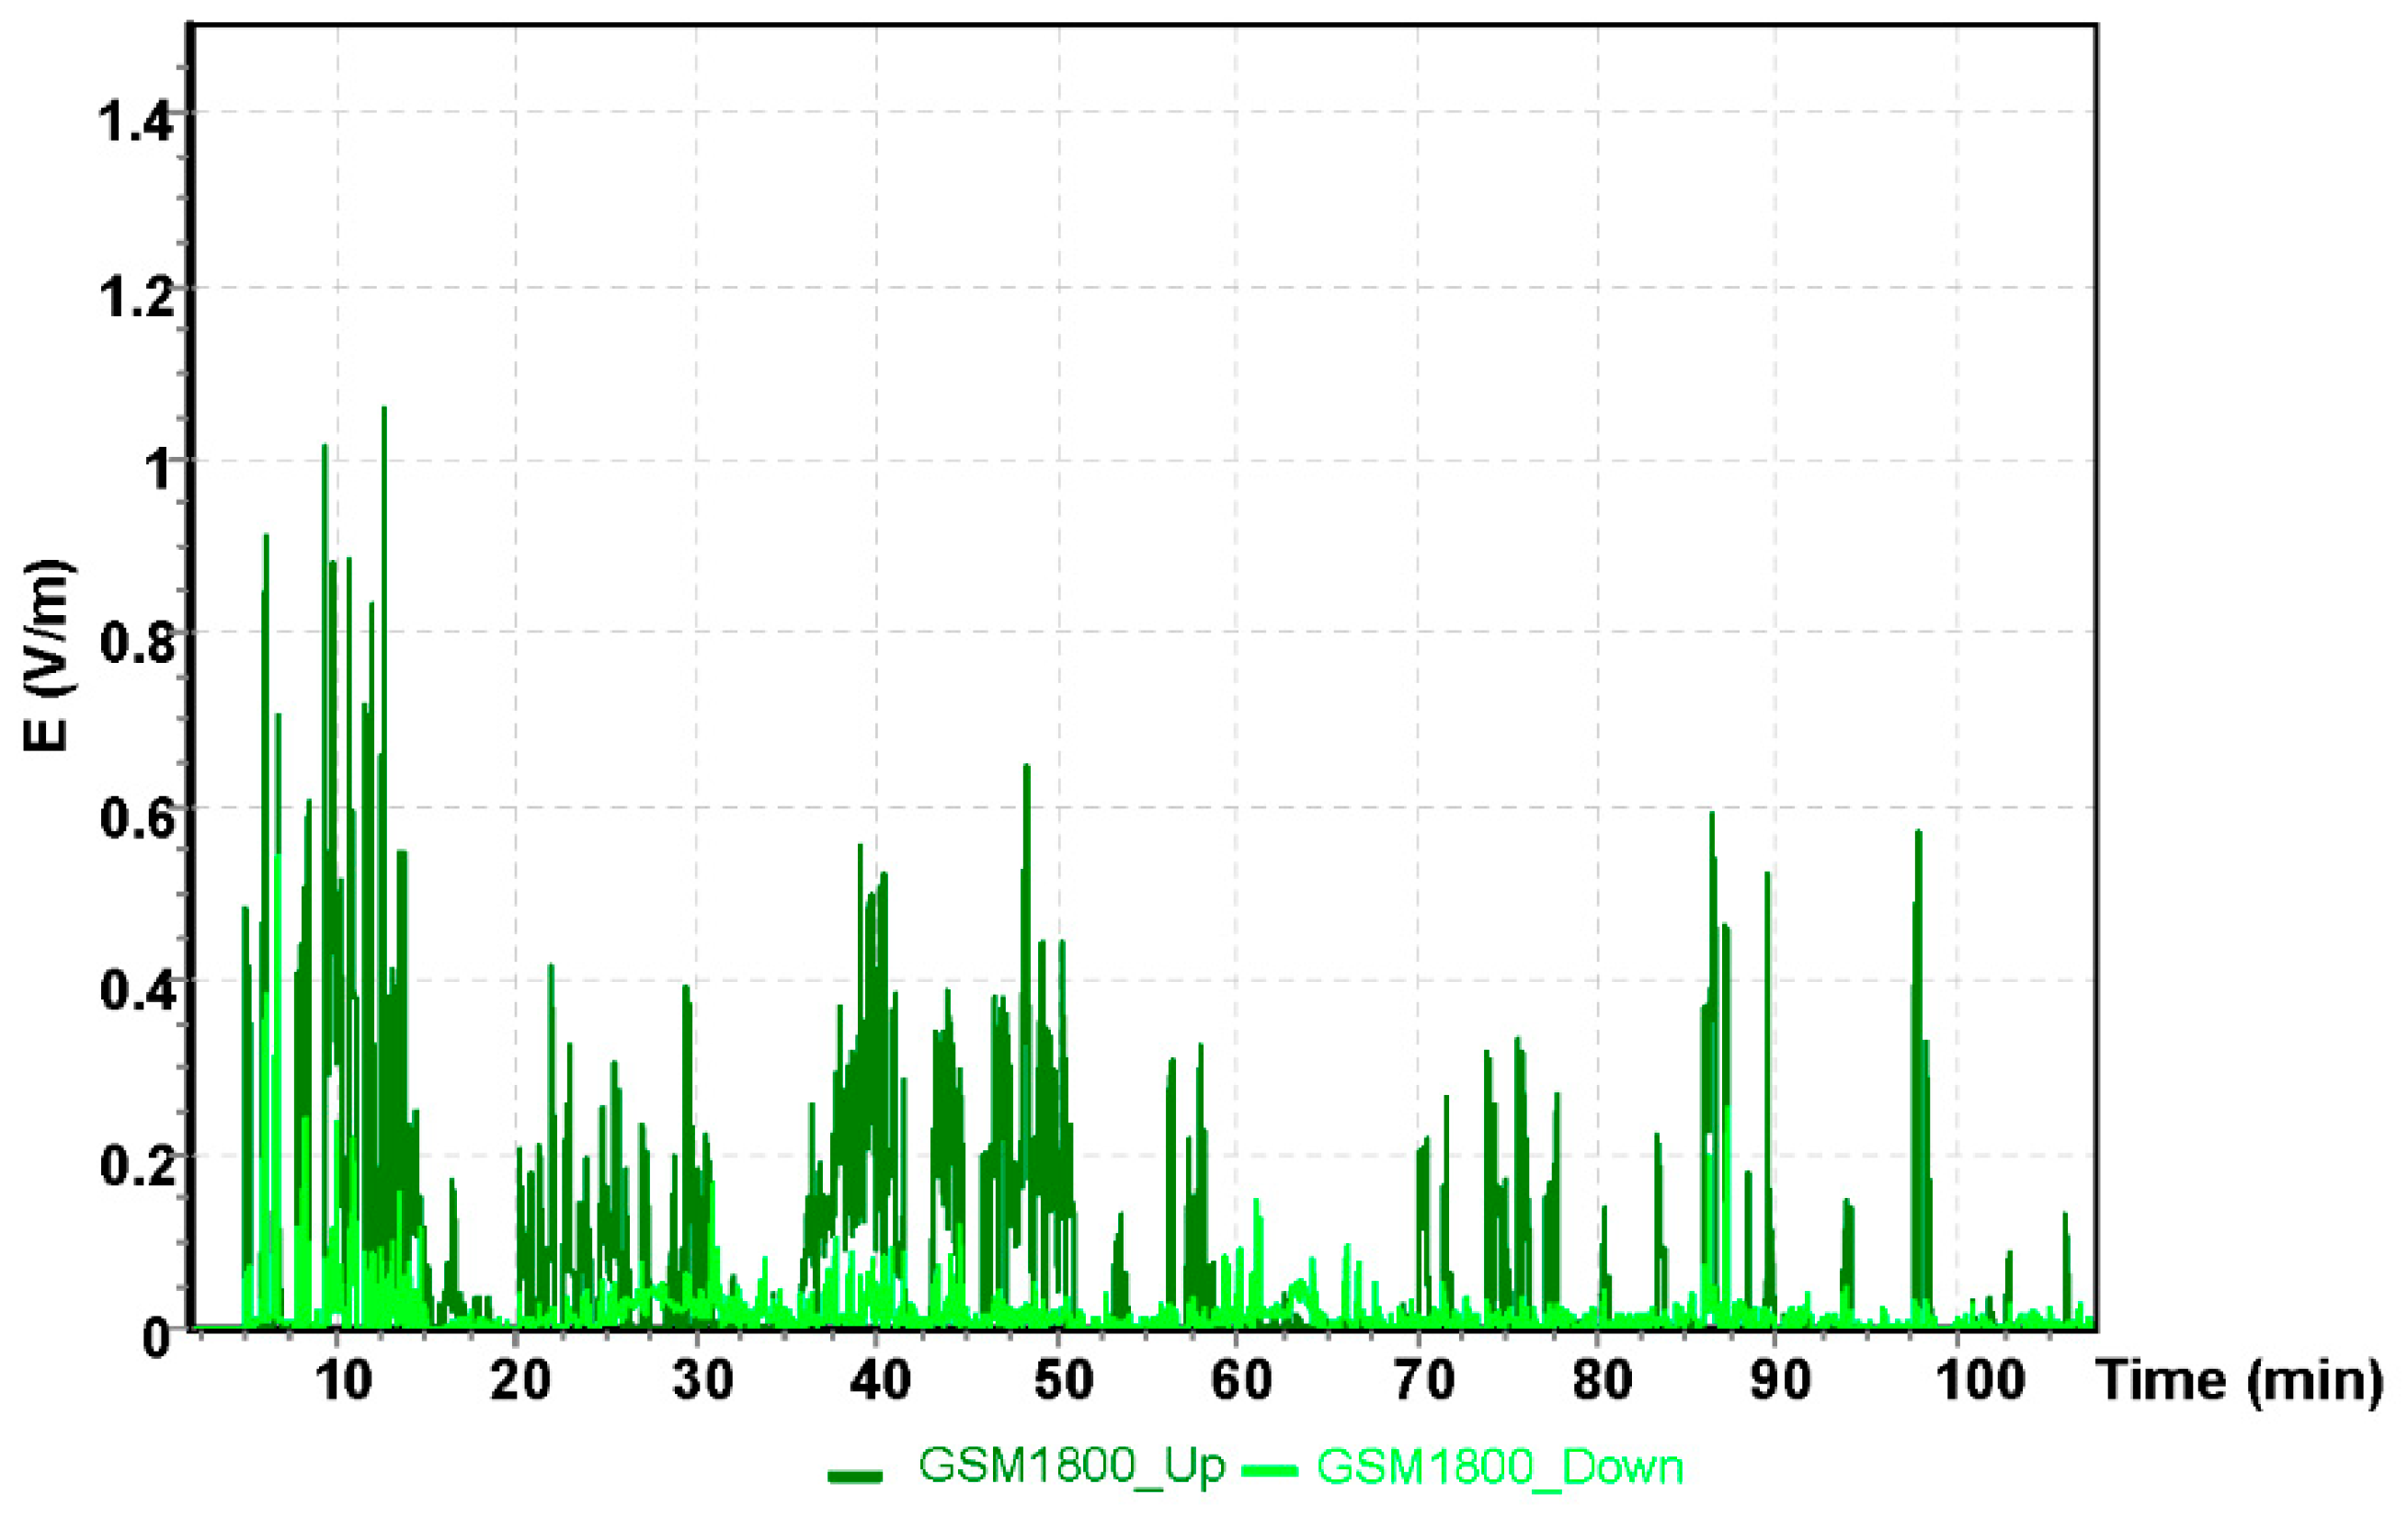
| GSM1800up | 0.0480 | 0.000 | 3.3078 | 0.2080 |
| GSM1800down | 0.0174 | 0.000 | 0.9989 | 0.0595 |
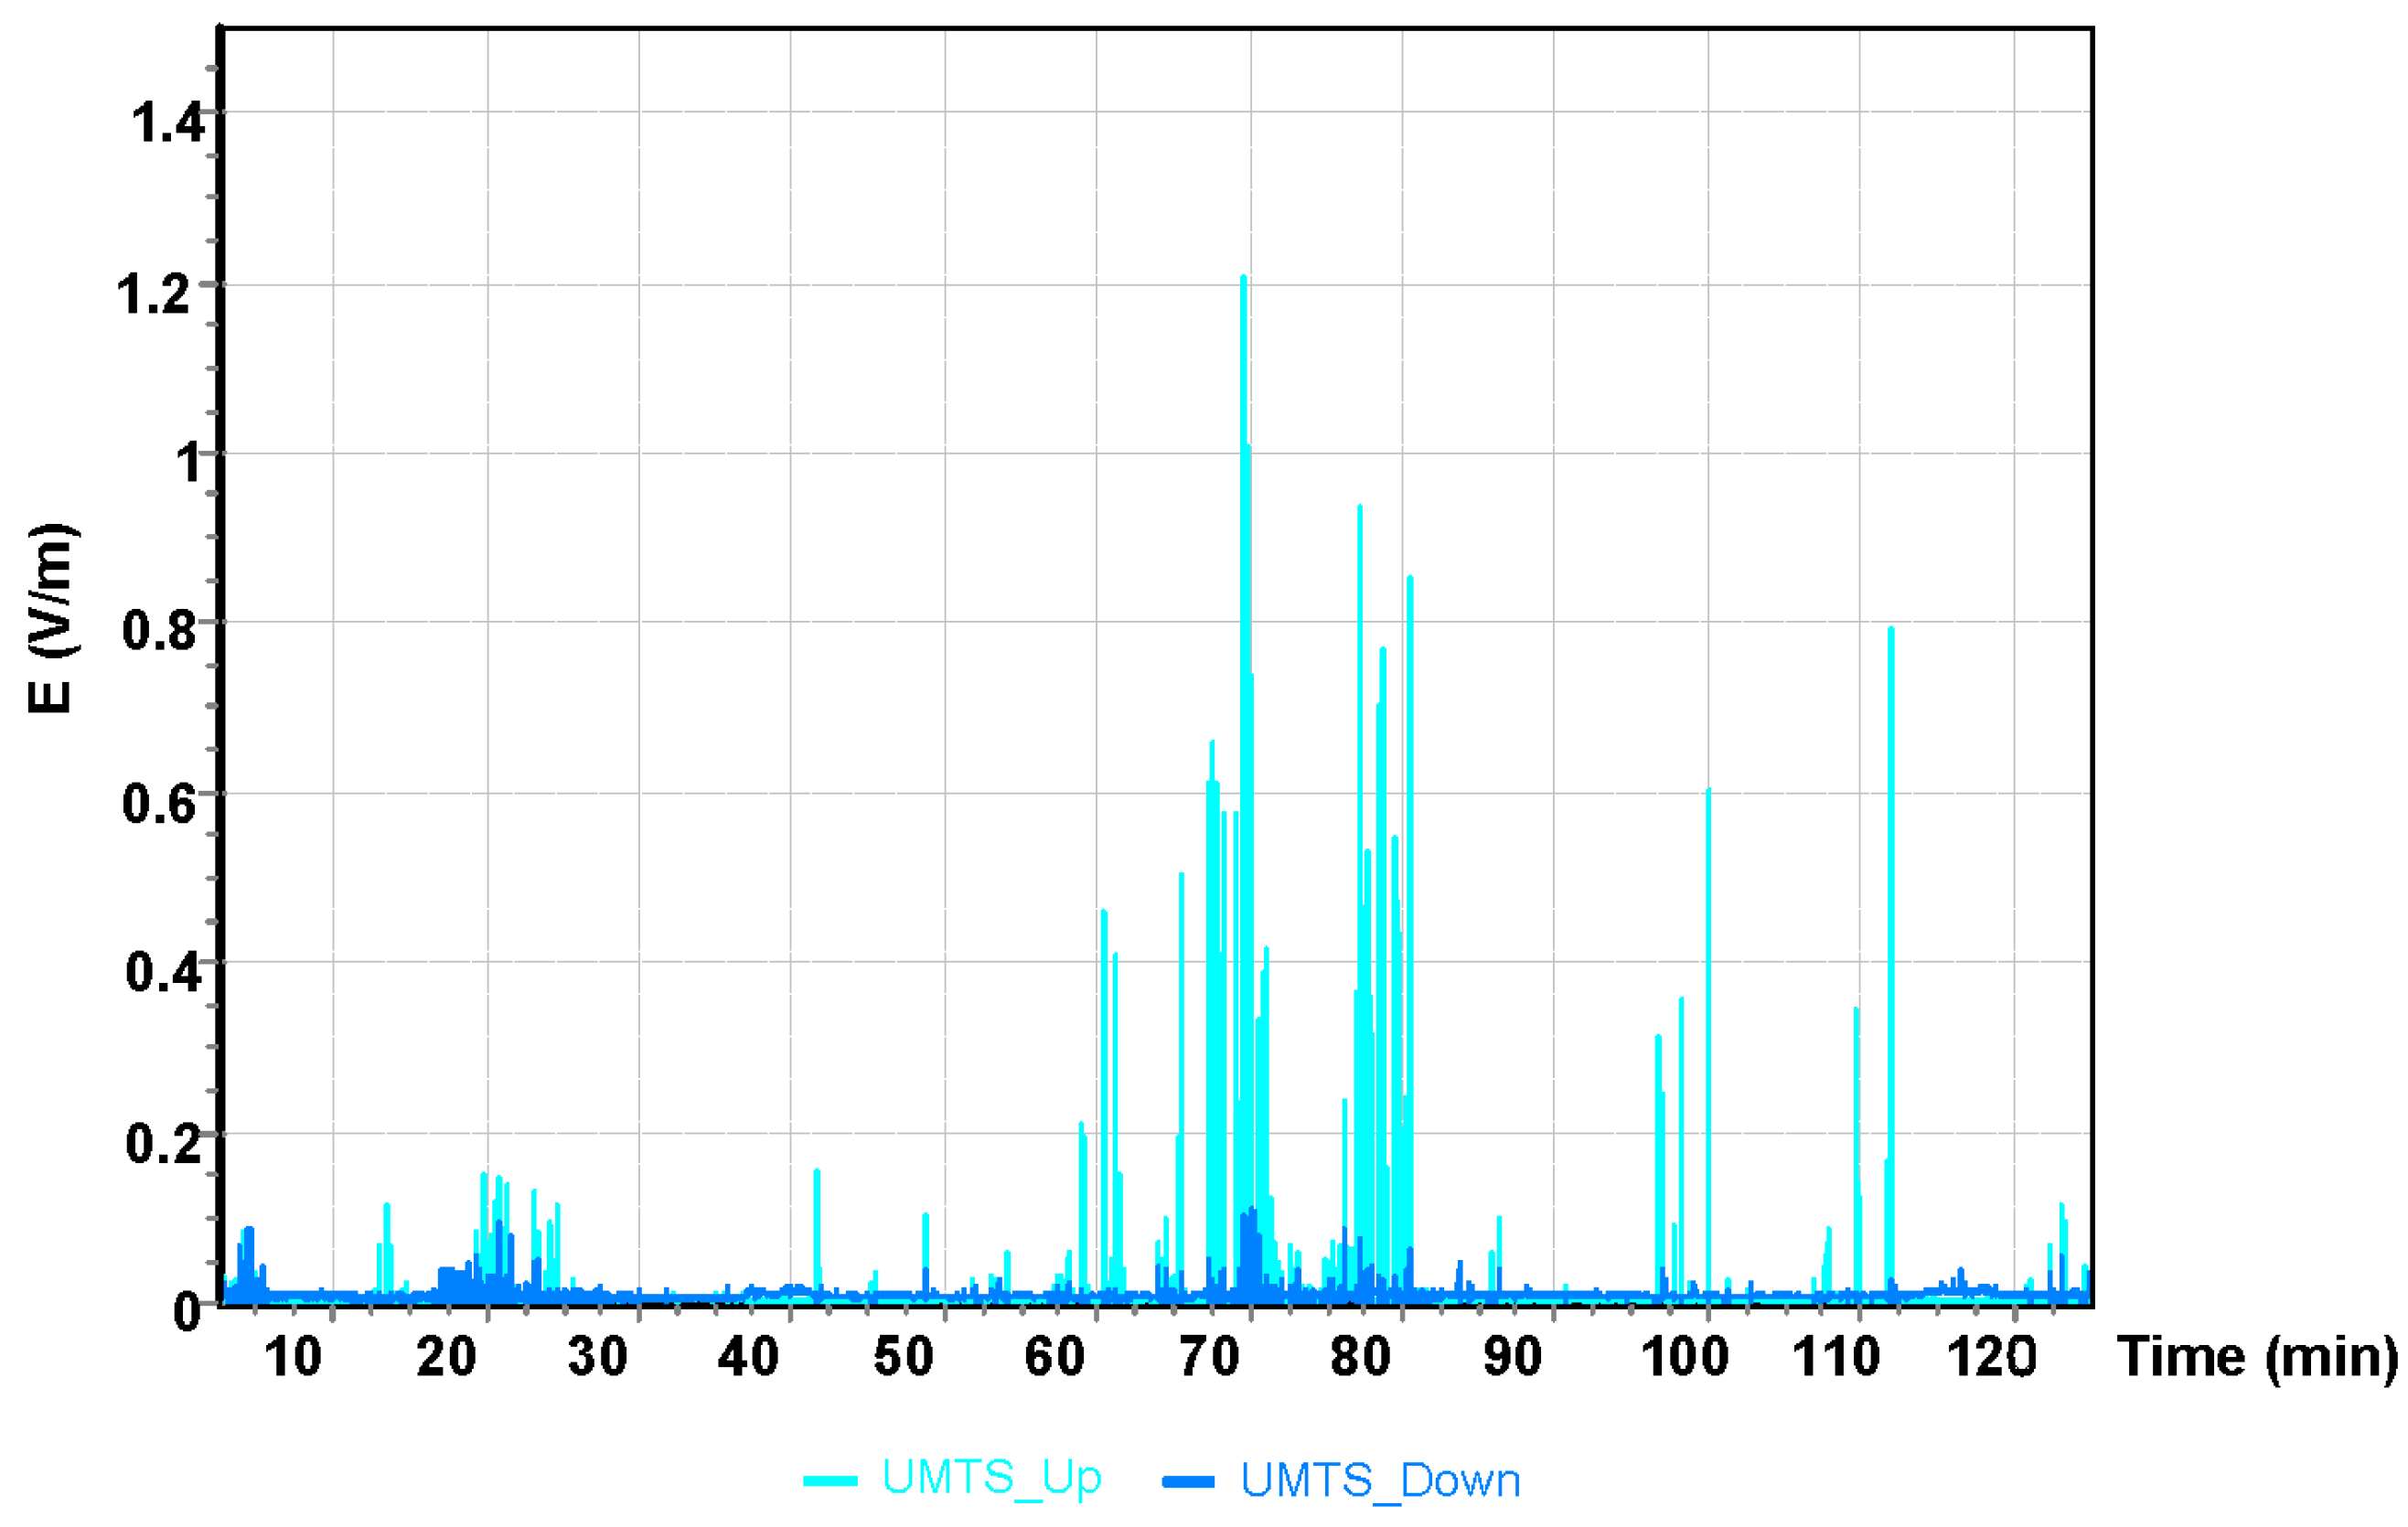
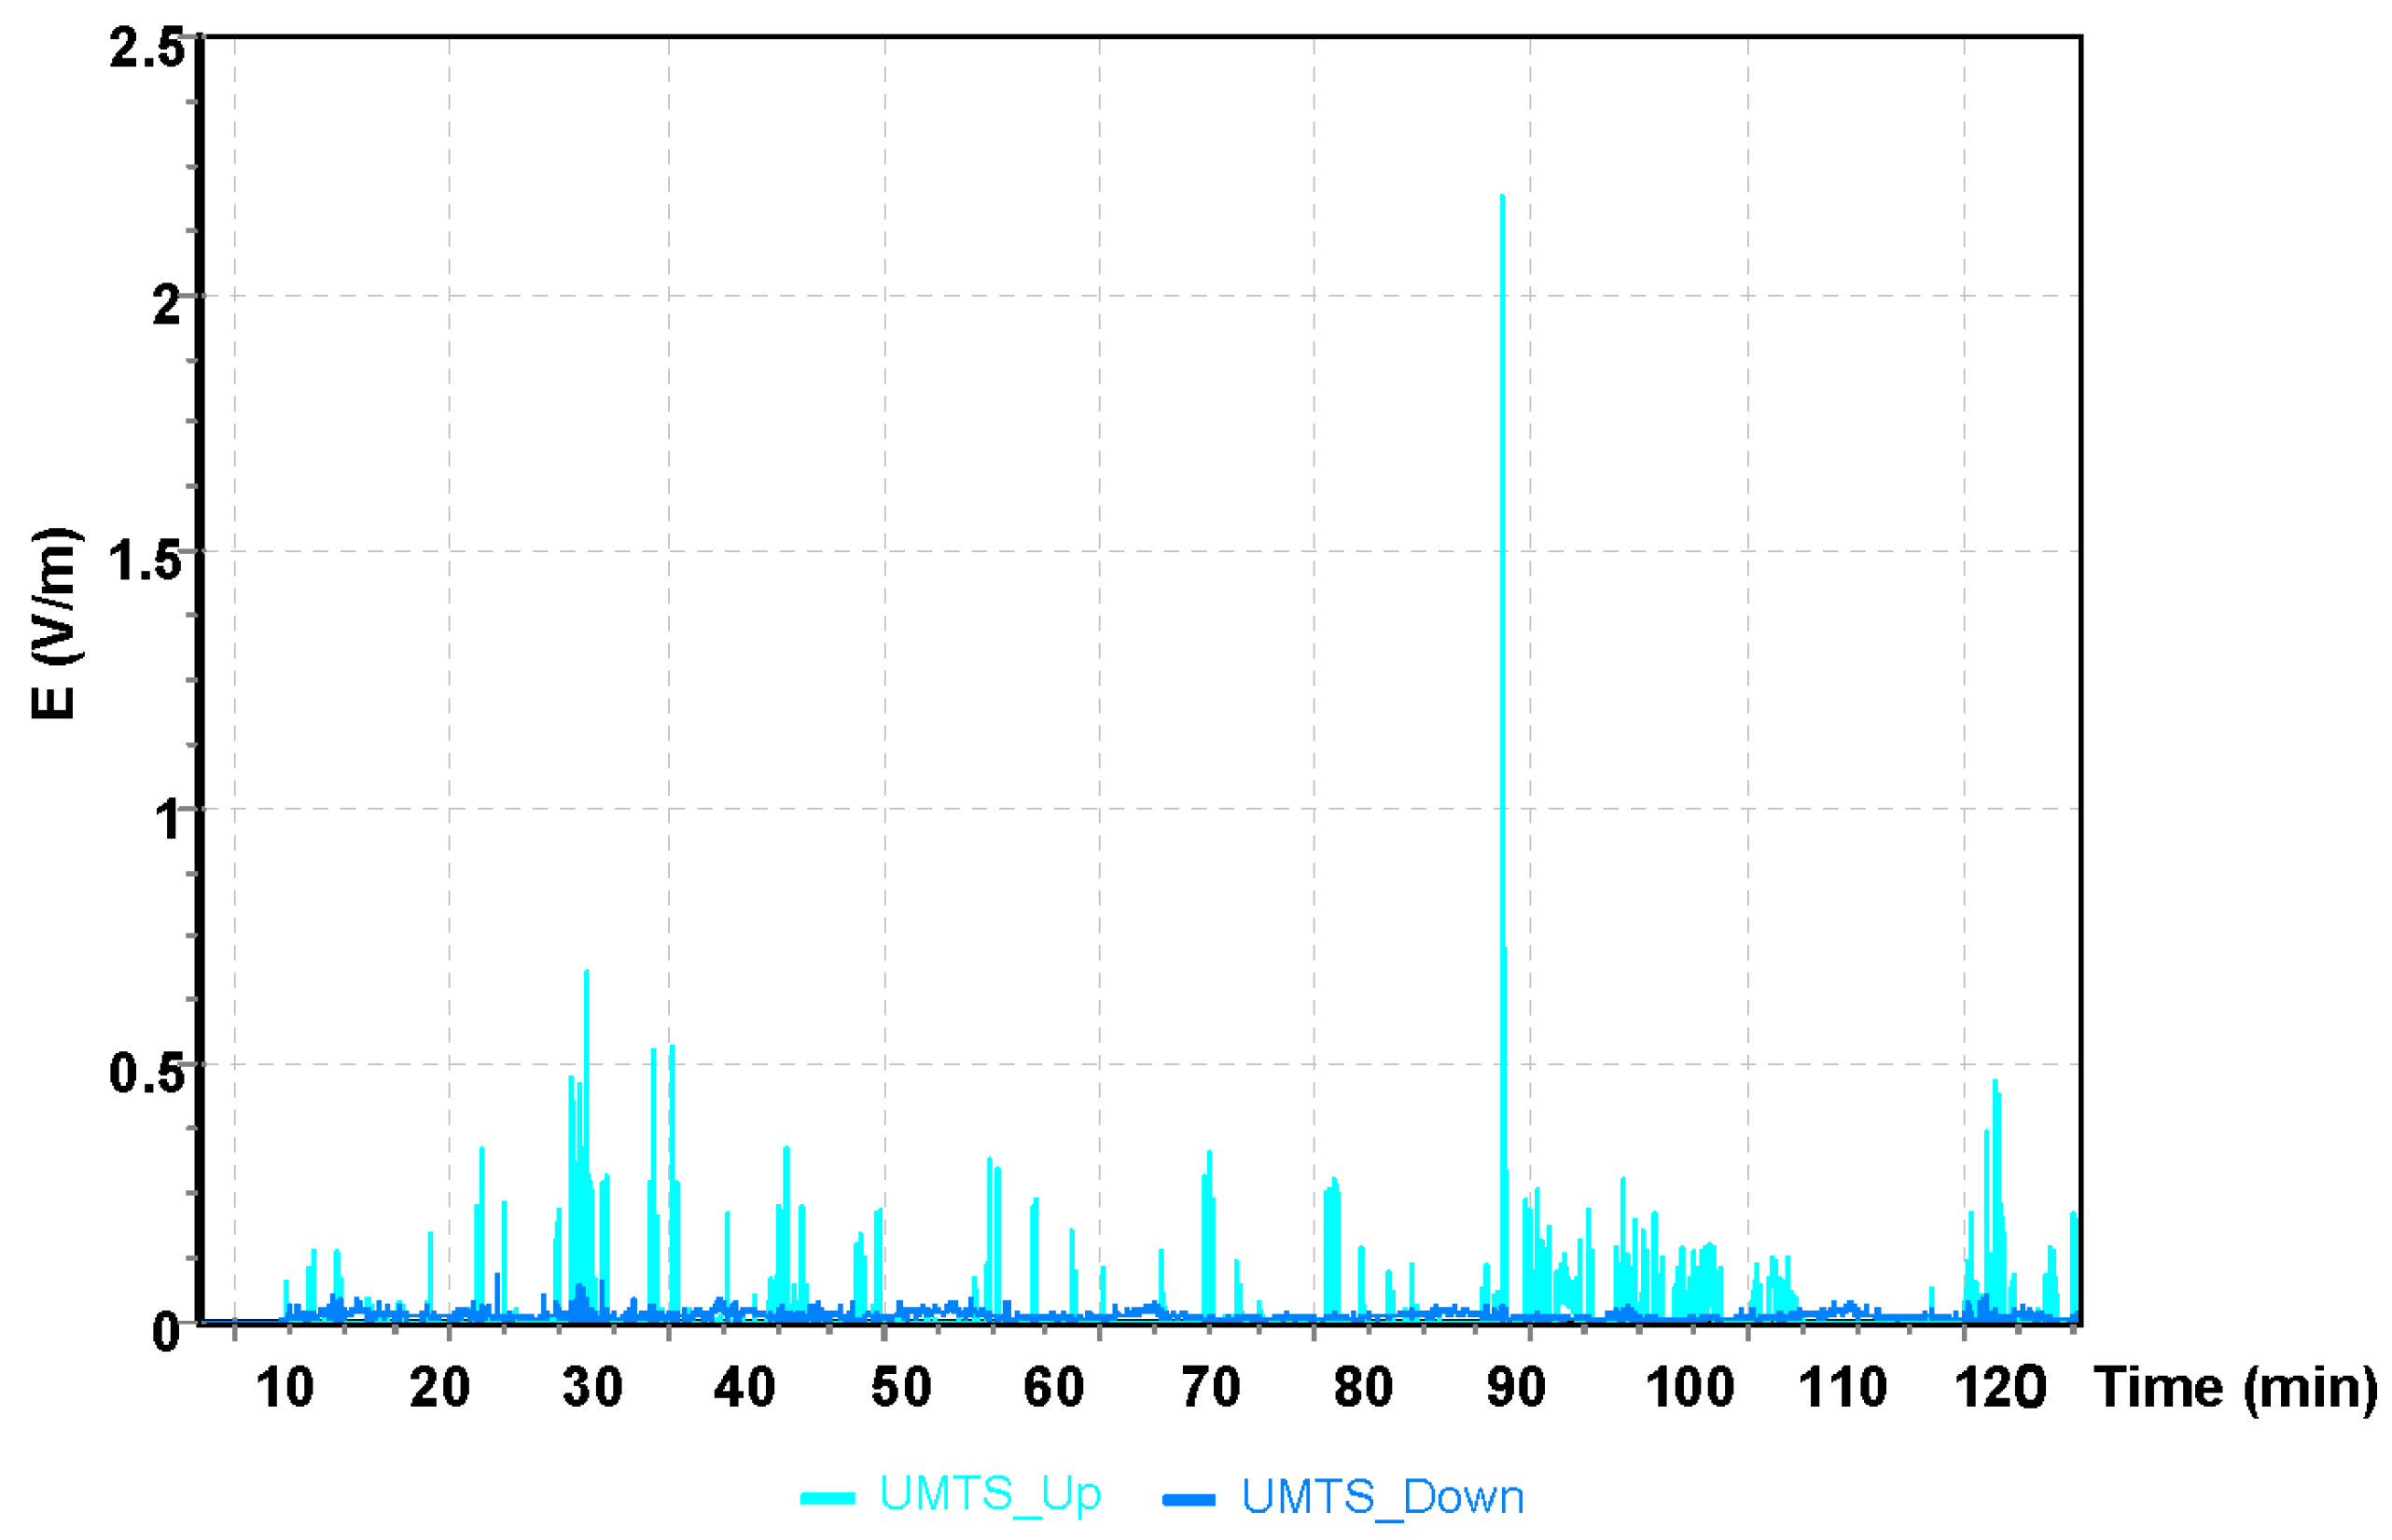
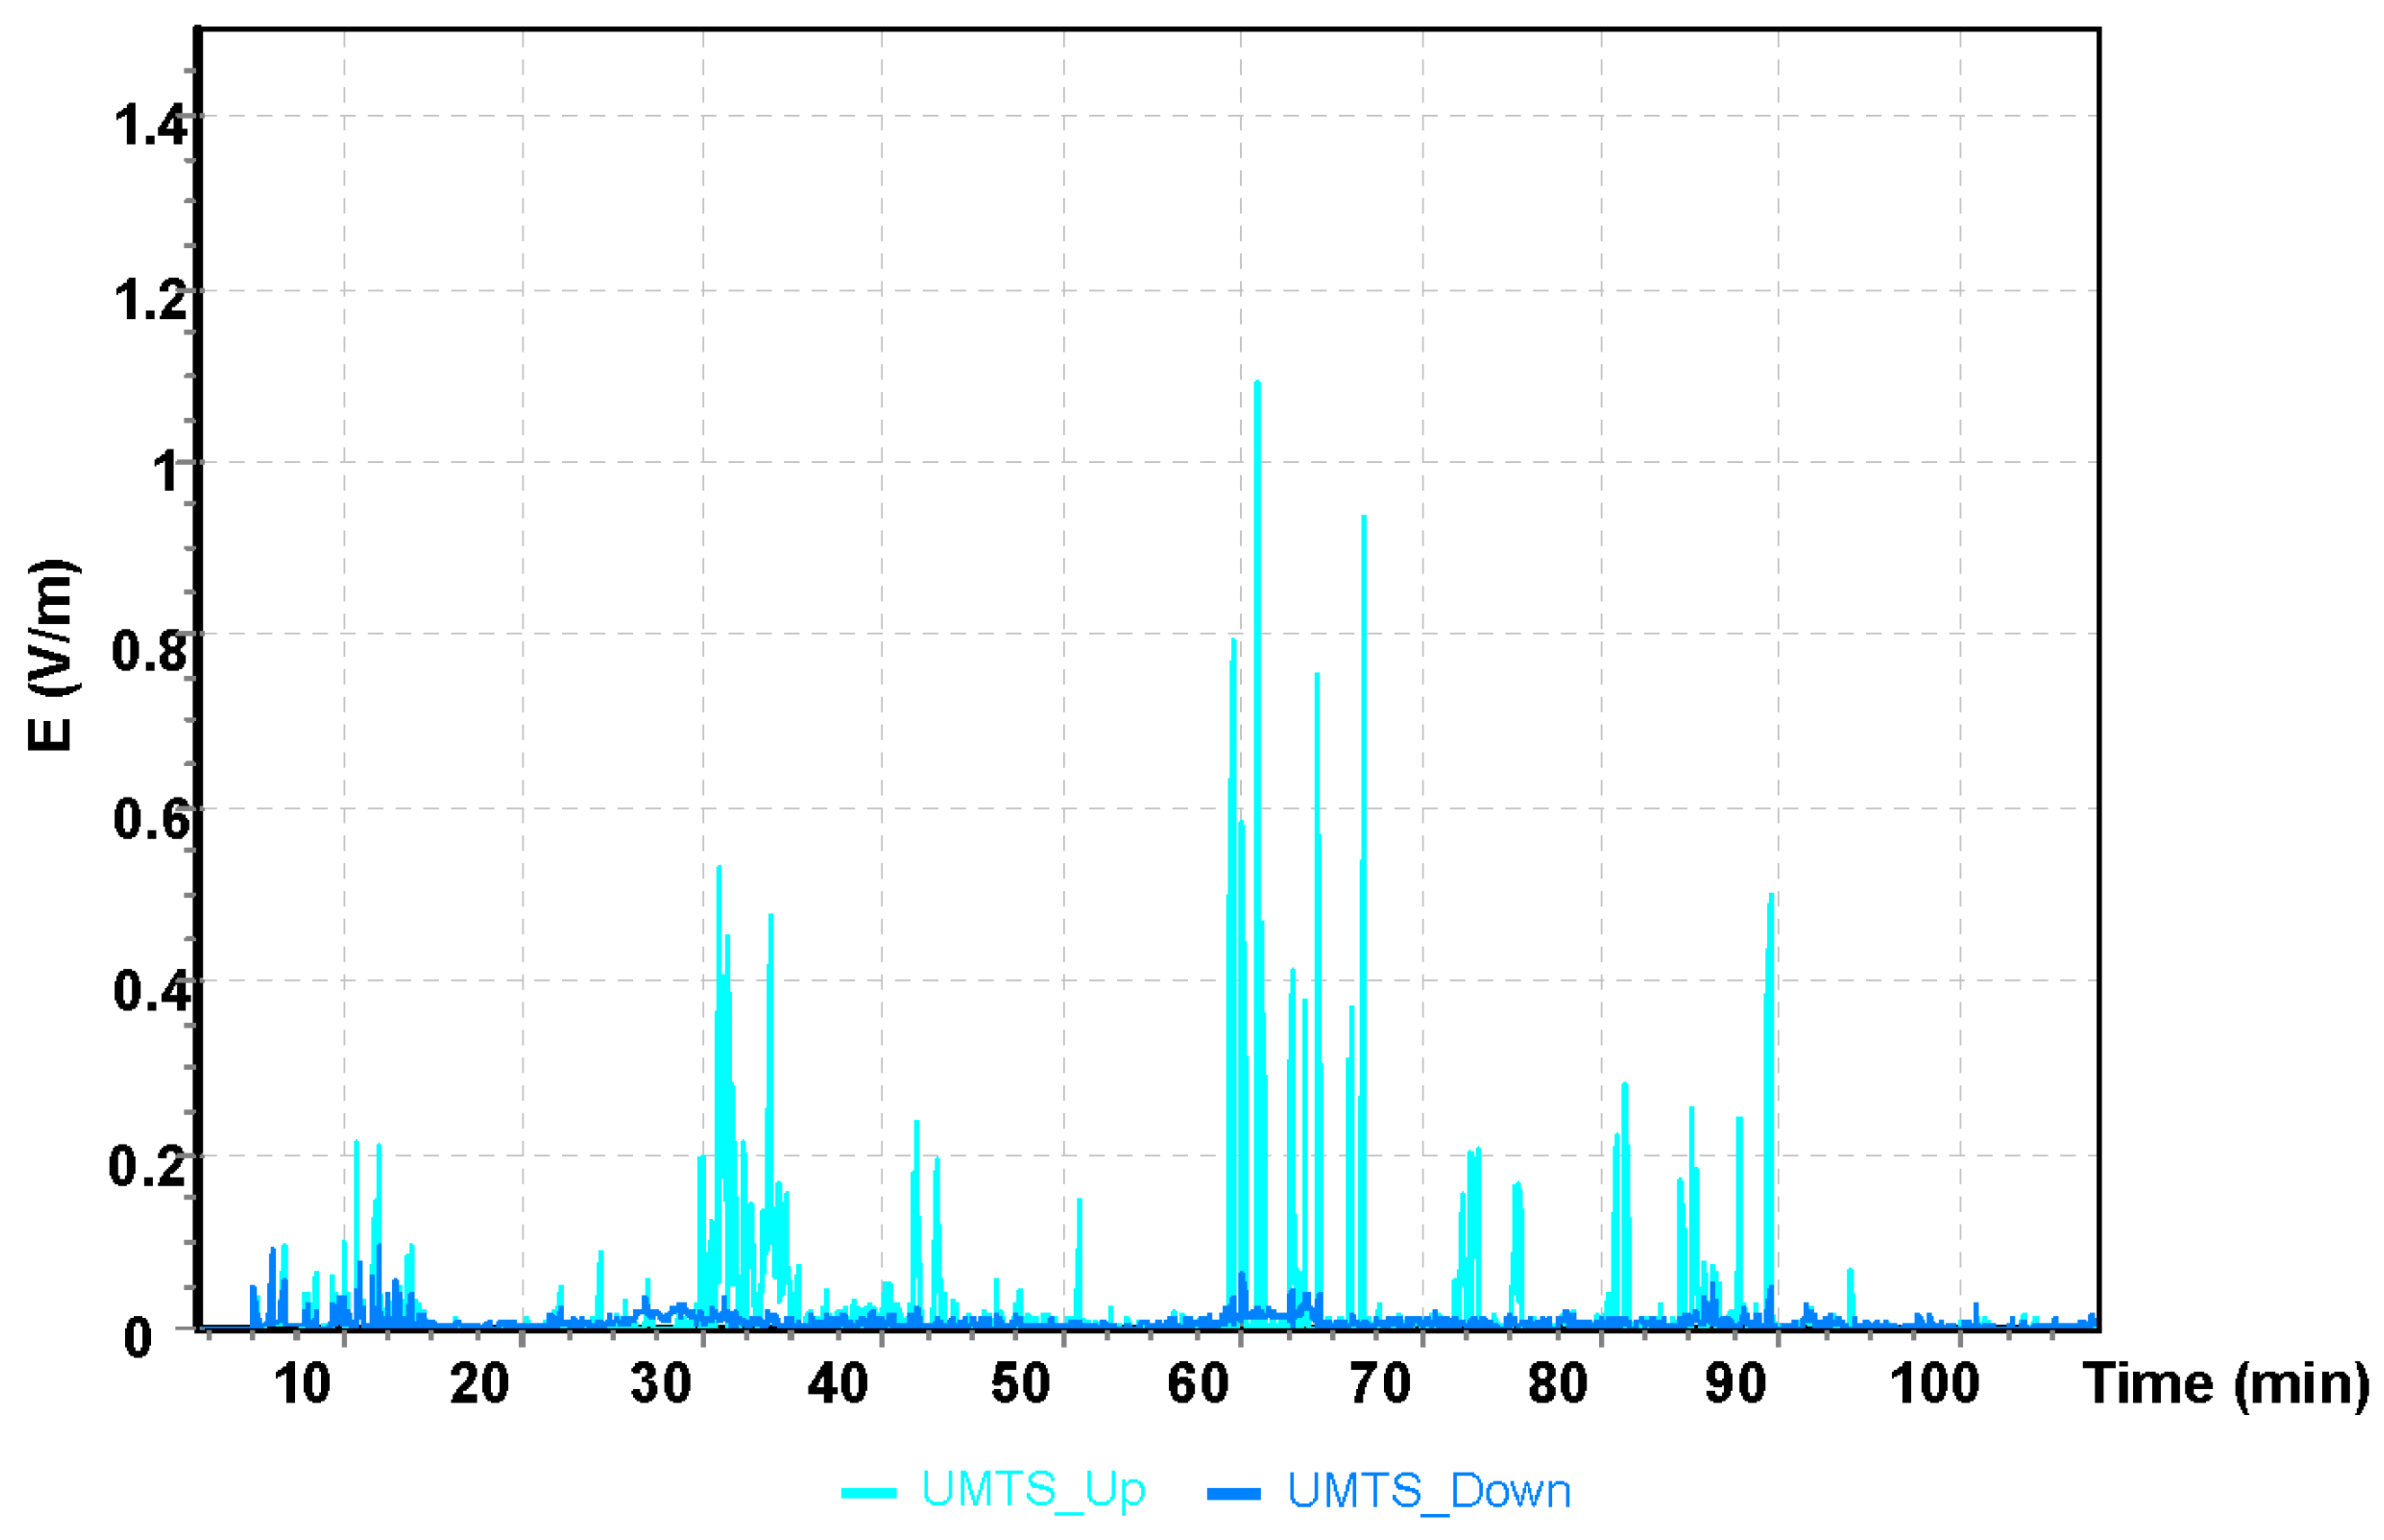
| UMTSup | 0.0158 | 0.000 | 1.9821 | 0.0736 |
| UMTSdown | 0.0103 | 0.000 | 2.5000 | 0.0340 |
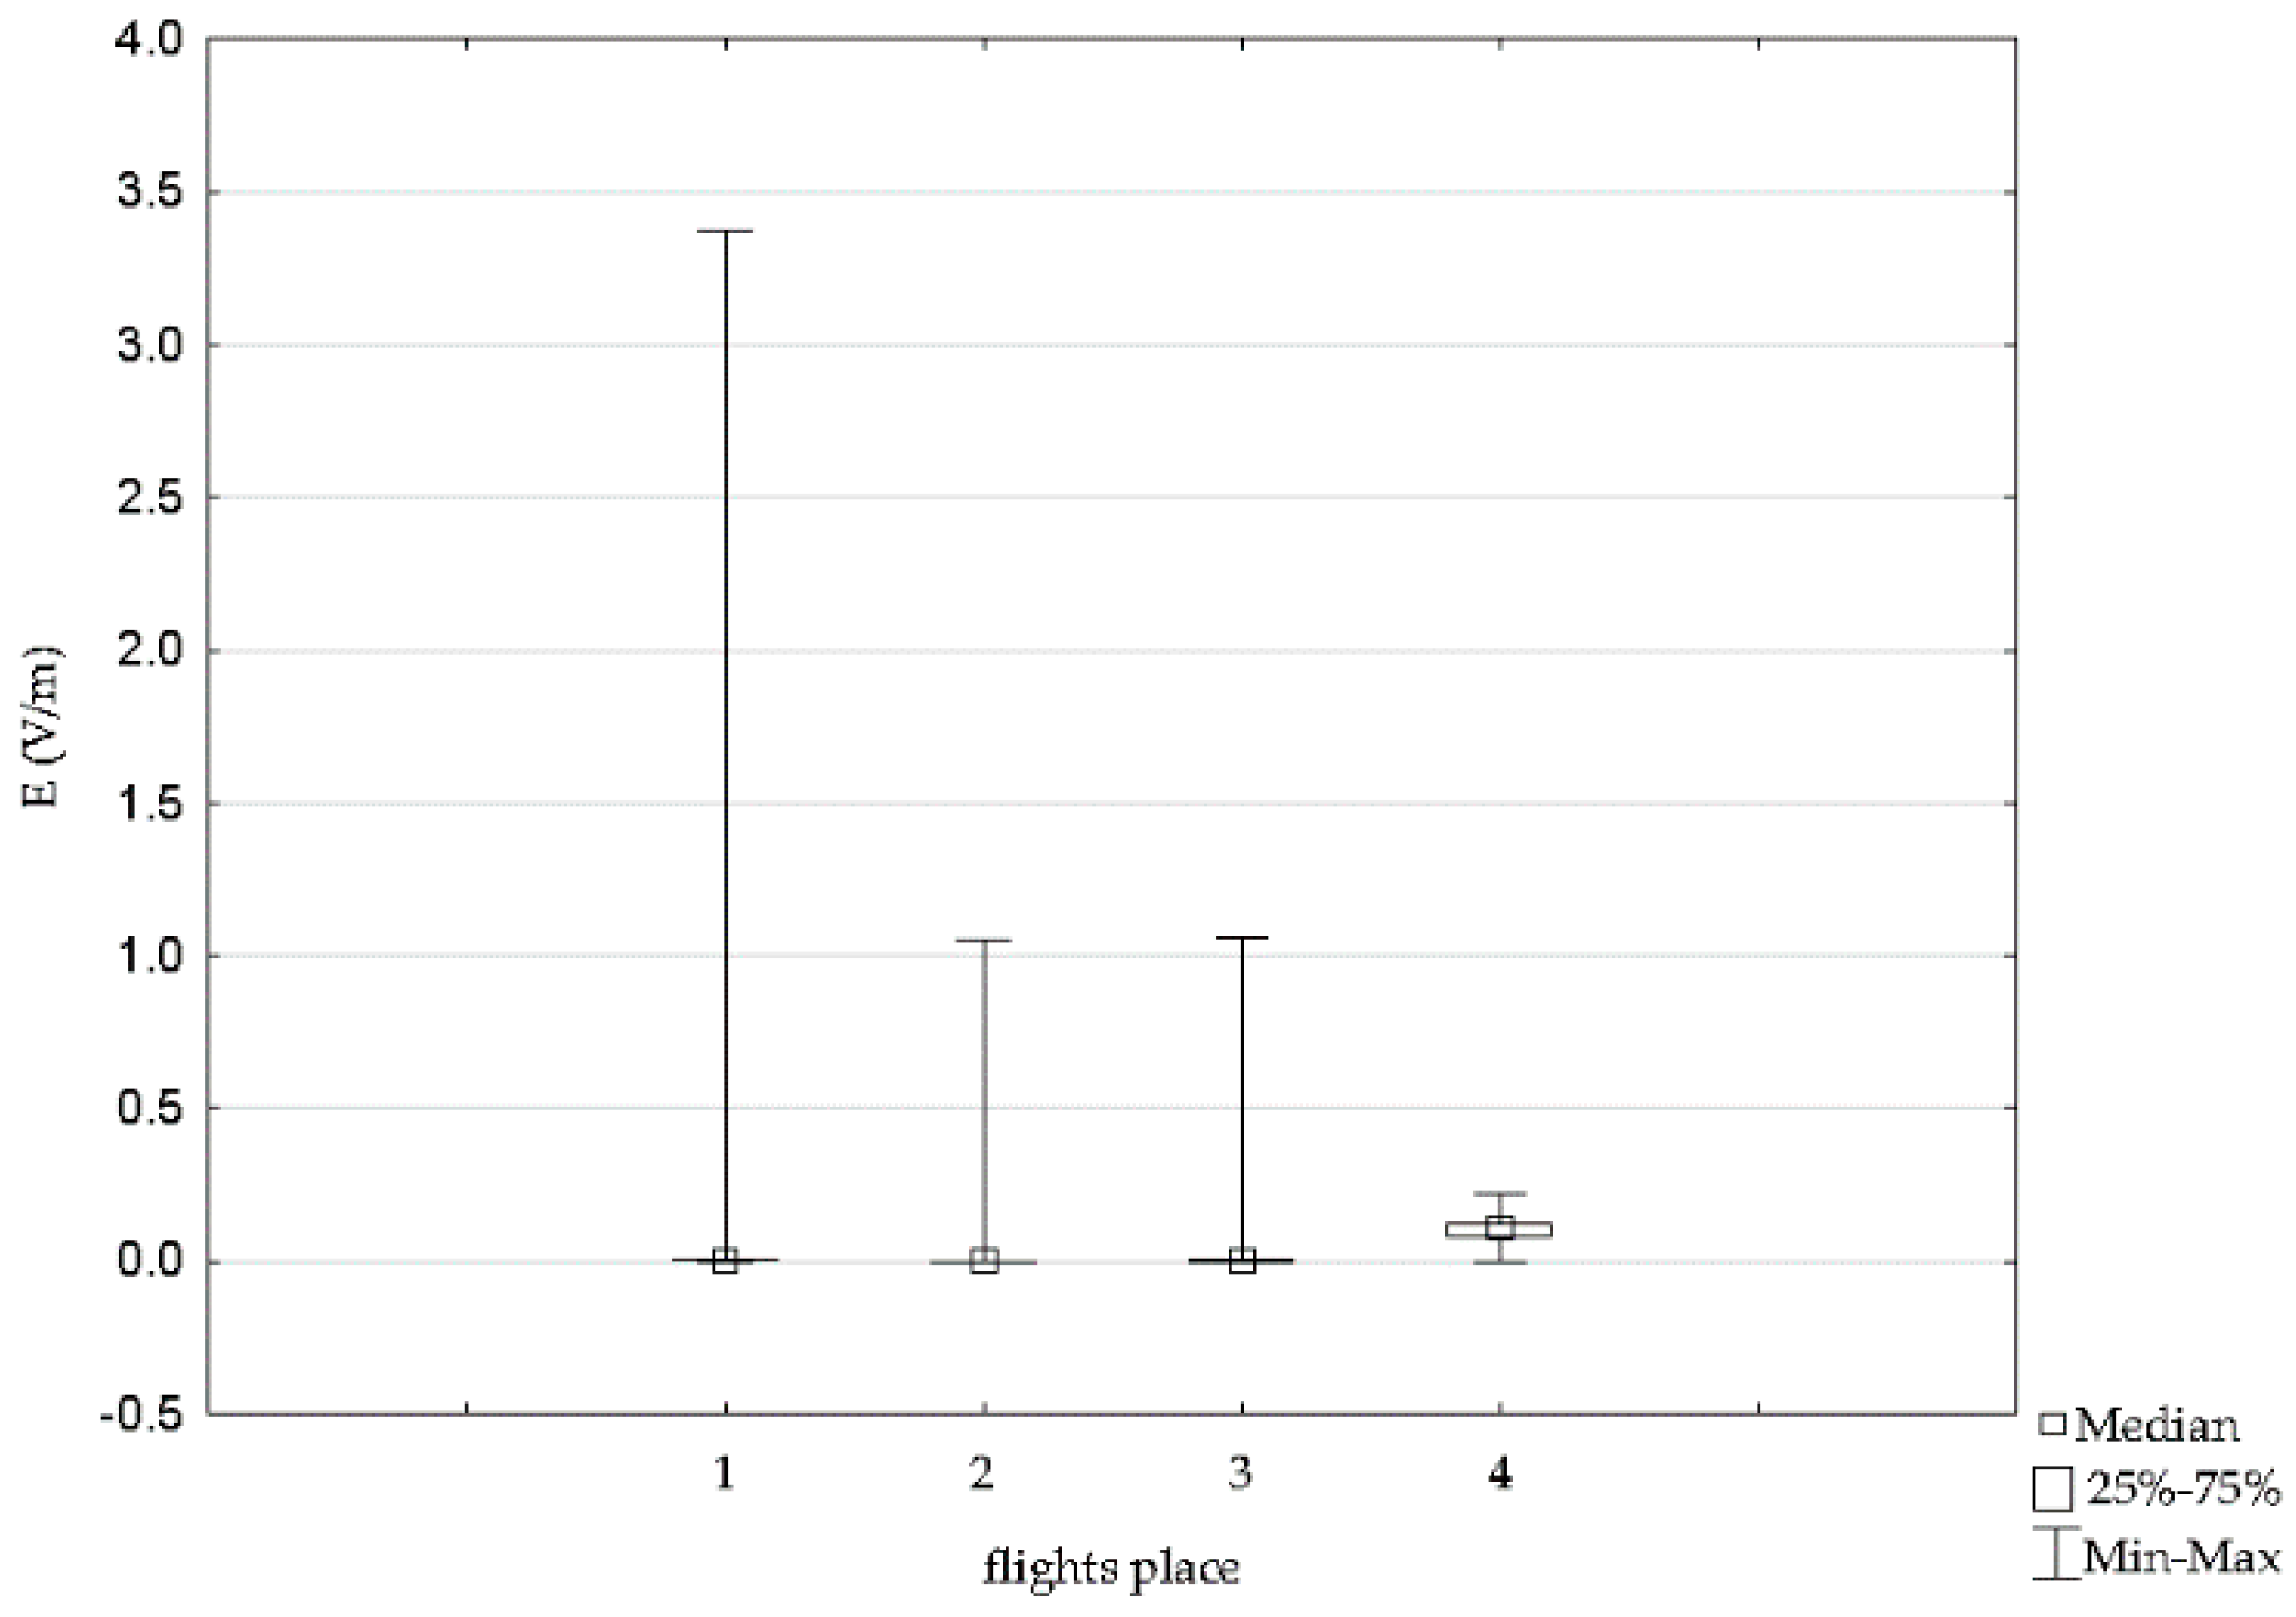
| Variable | Mean | Minimum | Maximum | SD |
|---|---|---|---|---|
| 1 | 0.0540 | 0.0002 | 3.3078 | 0.2675 |
| 2 | 0.0142 | 0.0000 | 1.0467 | 0.0670 |
| 2 | 0.0192 | 0.0000 | 1.0593 | 0.0568 |
| 4 | 0.1019 | 0.0002 | 0.2174 | 0.0374 |
| Test Results for Individual Comparisons | Statistical Significance | |
|---|---|---|
| Background vs. 1 | p = 0.000 | Relevant |
| Background vs. 2 | p = 0.000 | Relevant |
| Background vs. 3 | p = 0.000 | Relevant |
| Background vs. 4 | p = 0.000 | Relevant |
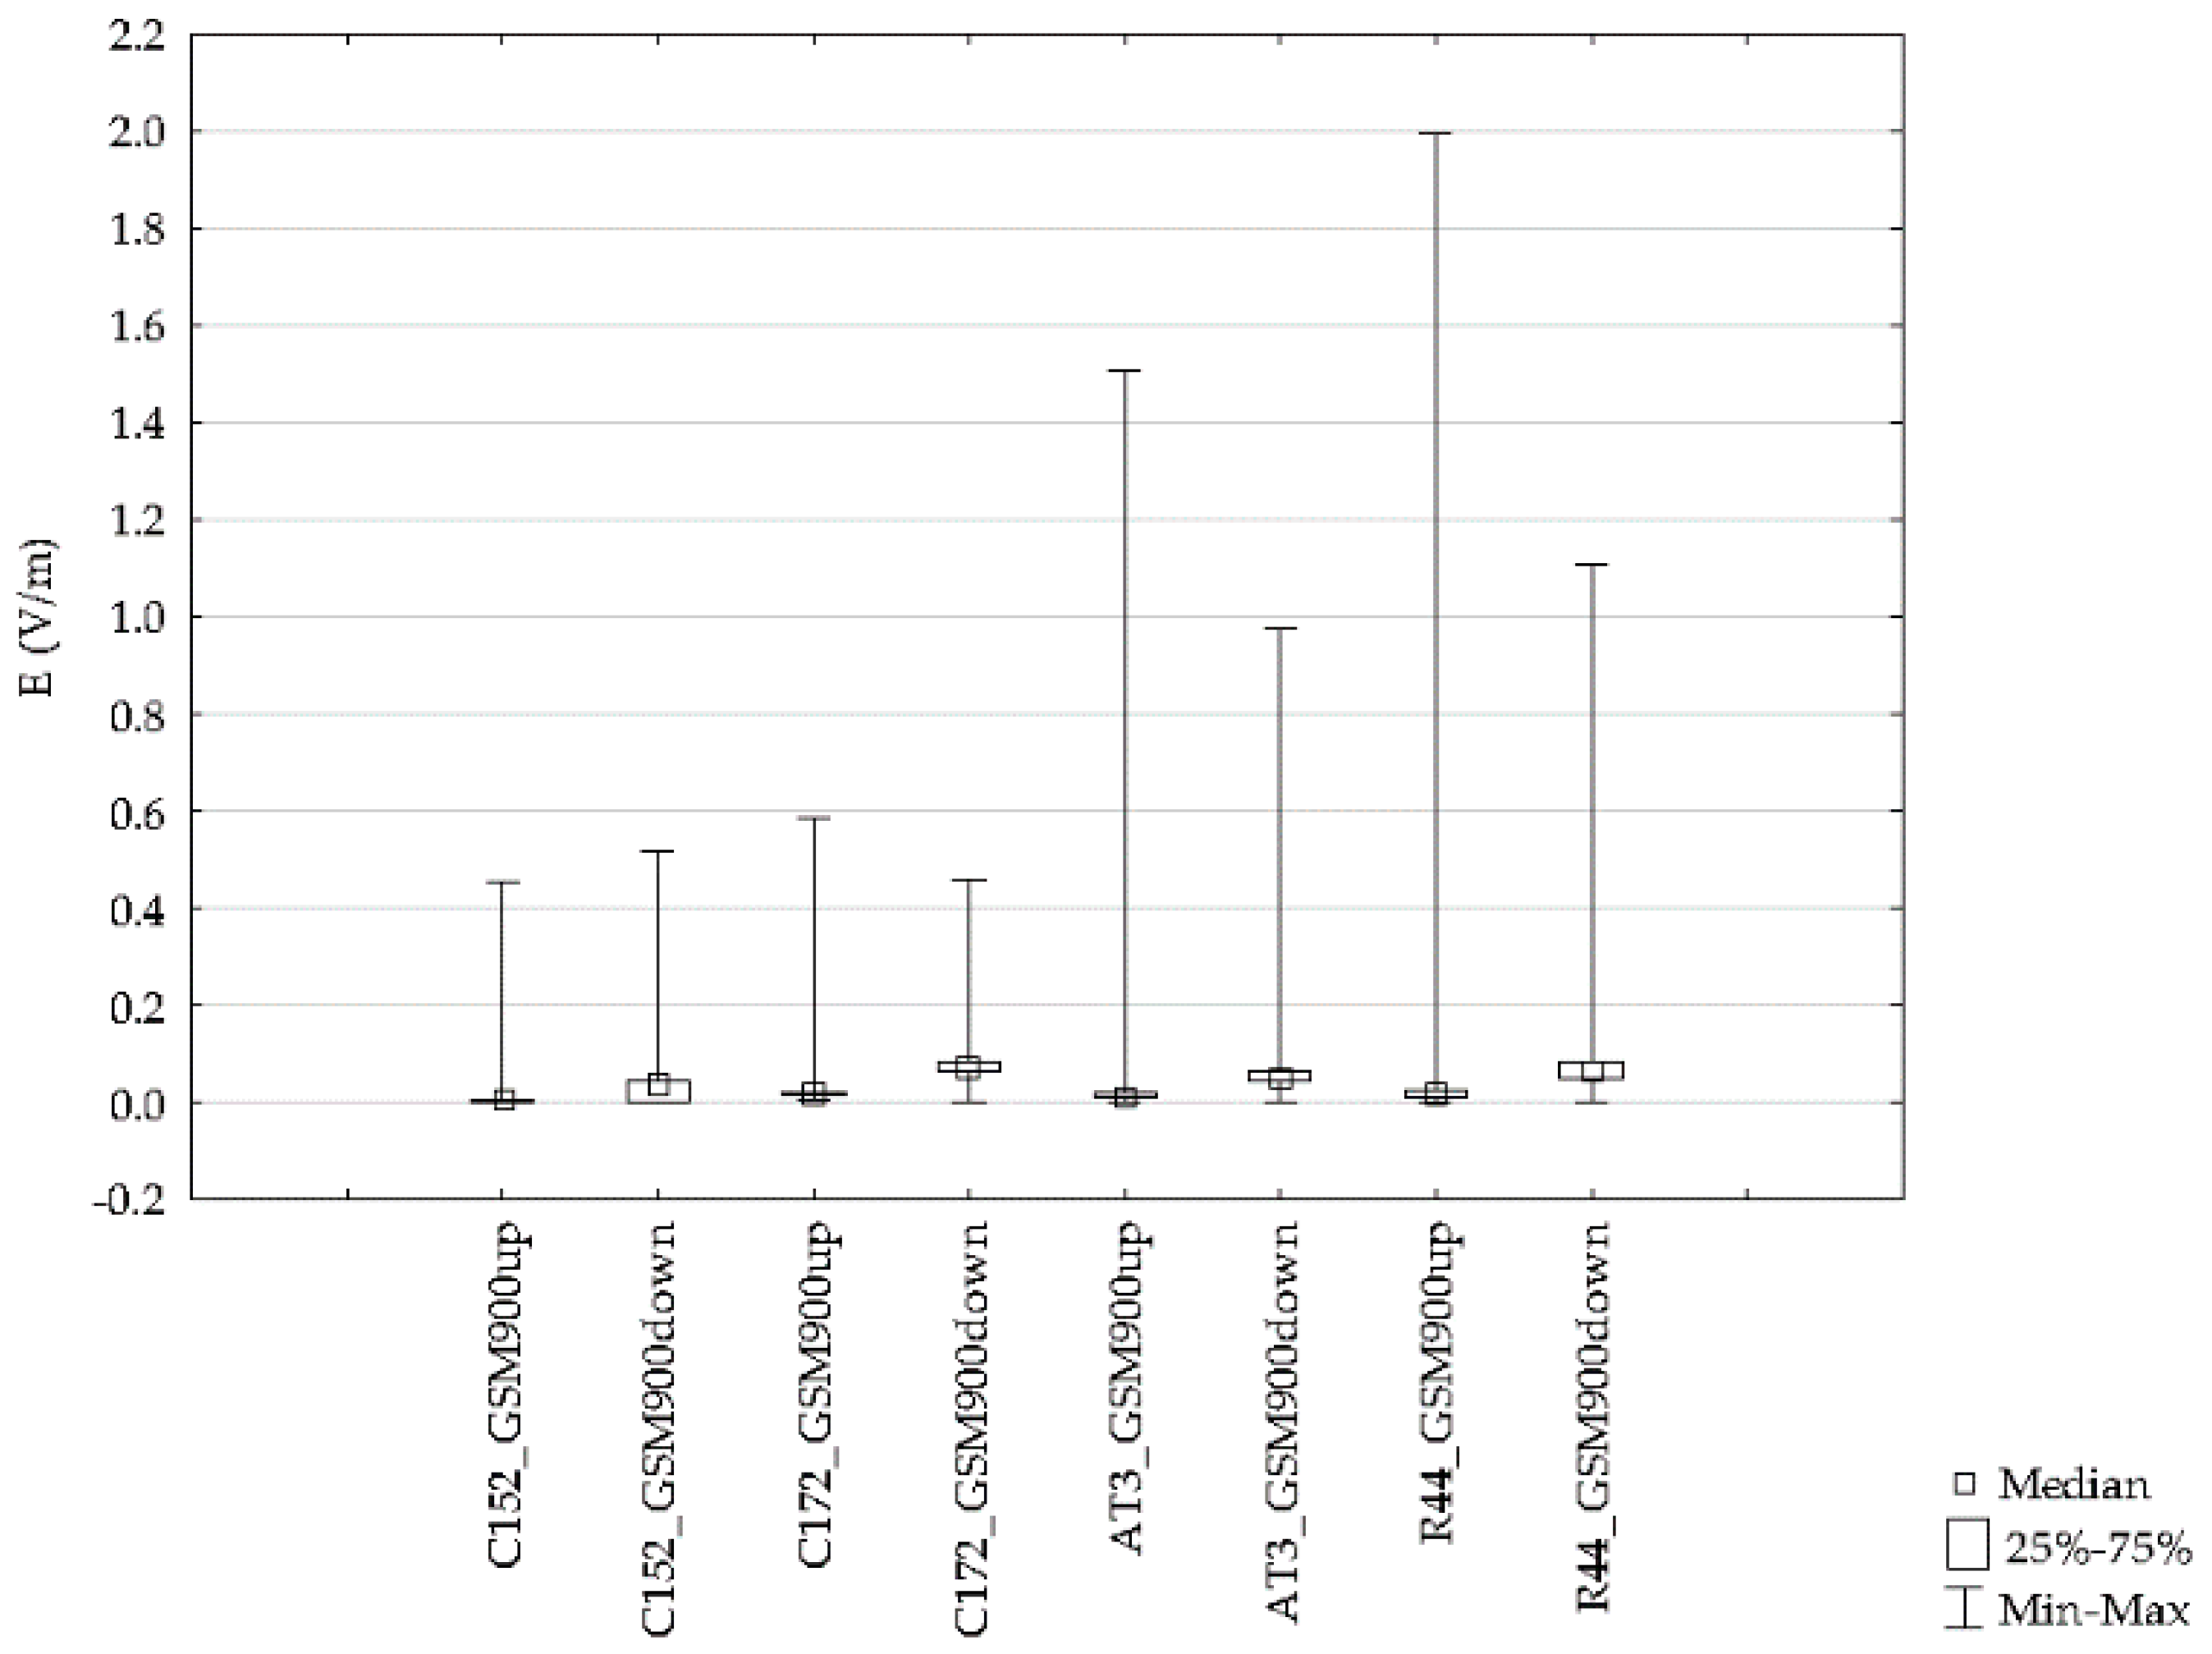
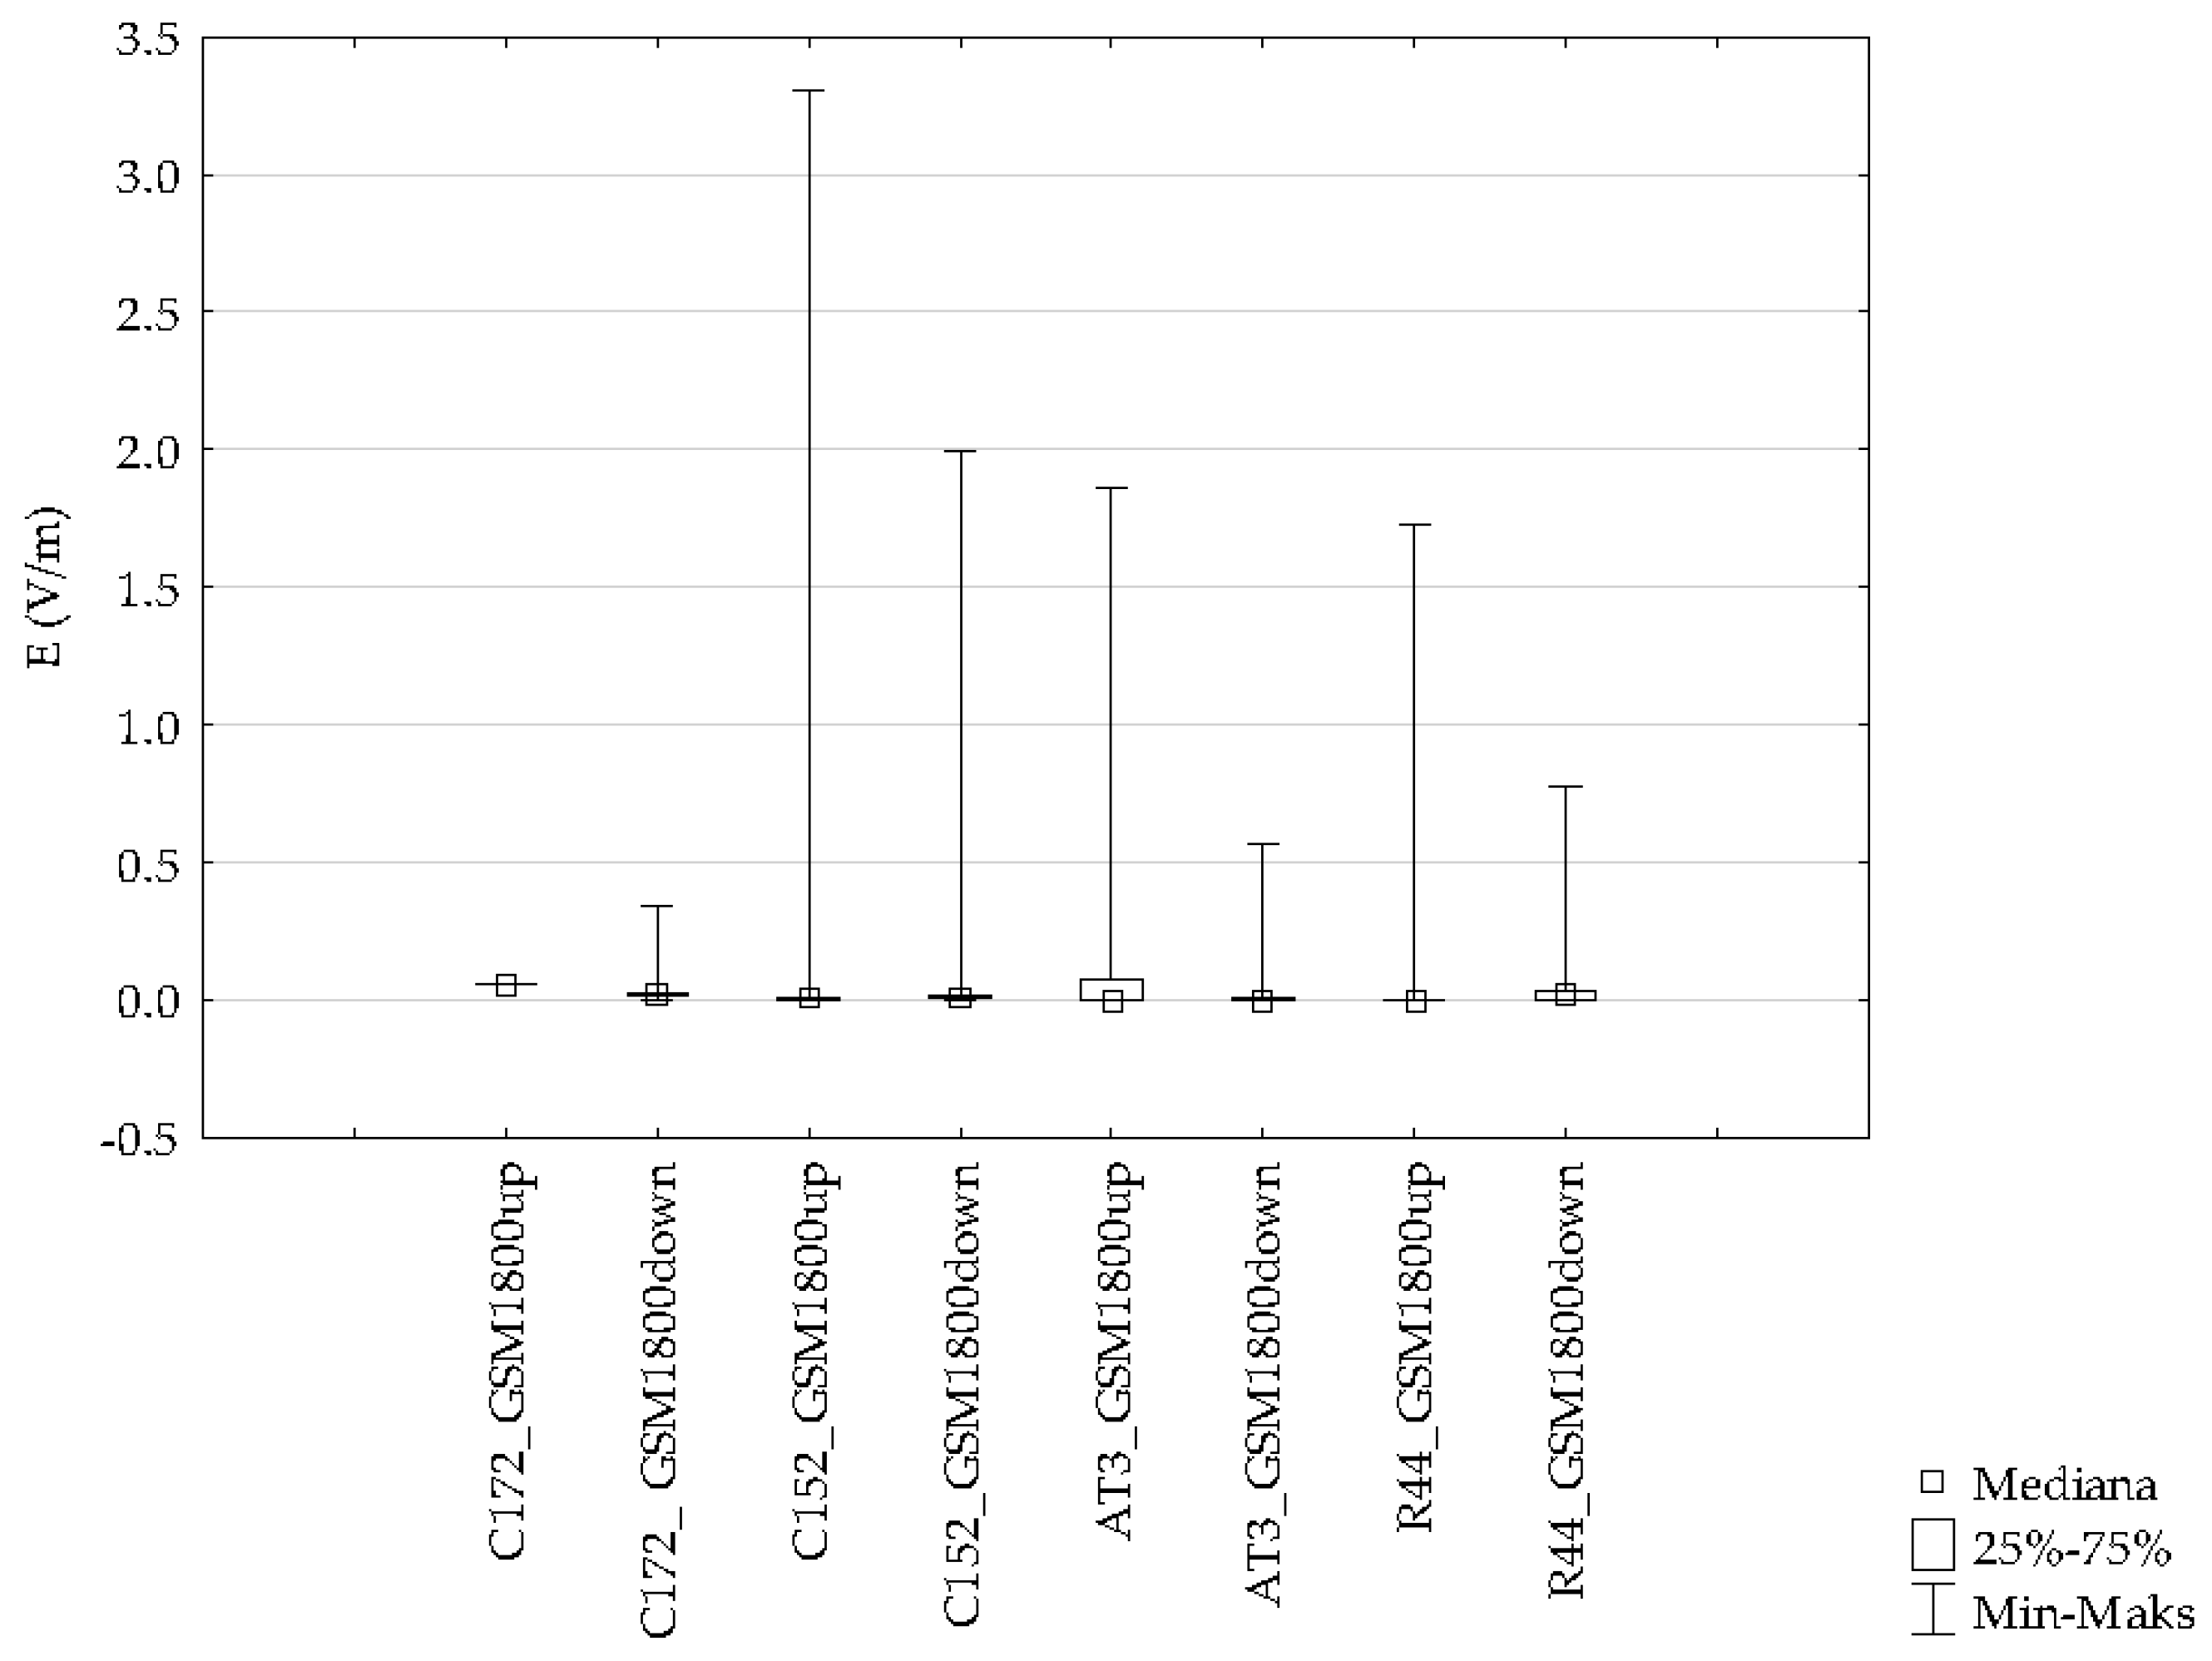
| Variable | Mean | Minimum | Maximum | SD |
|---|---|---|---|---|
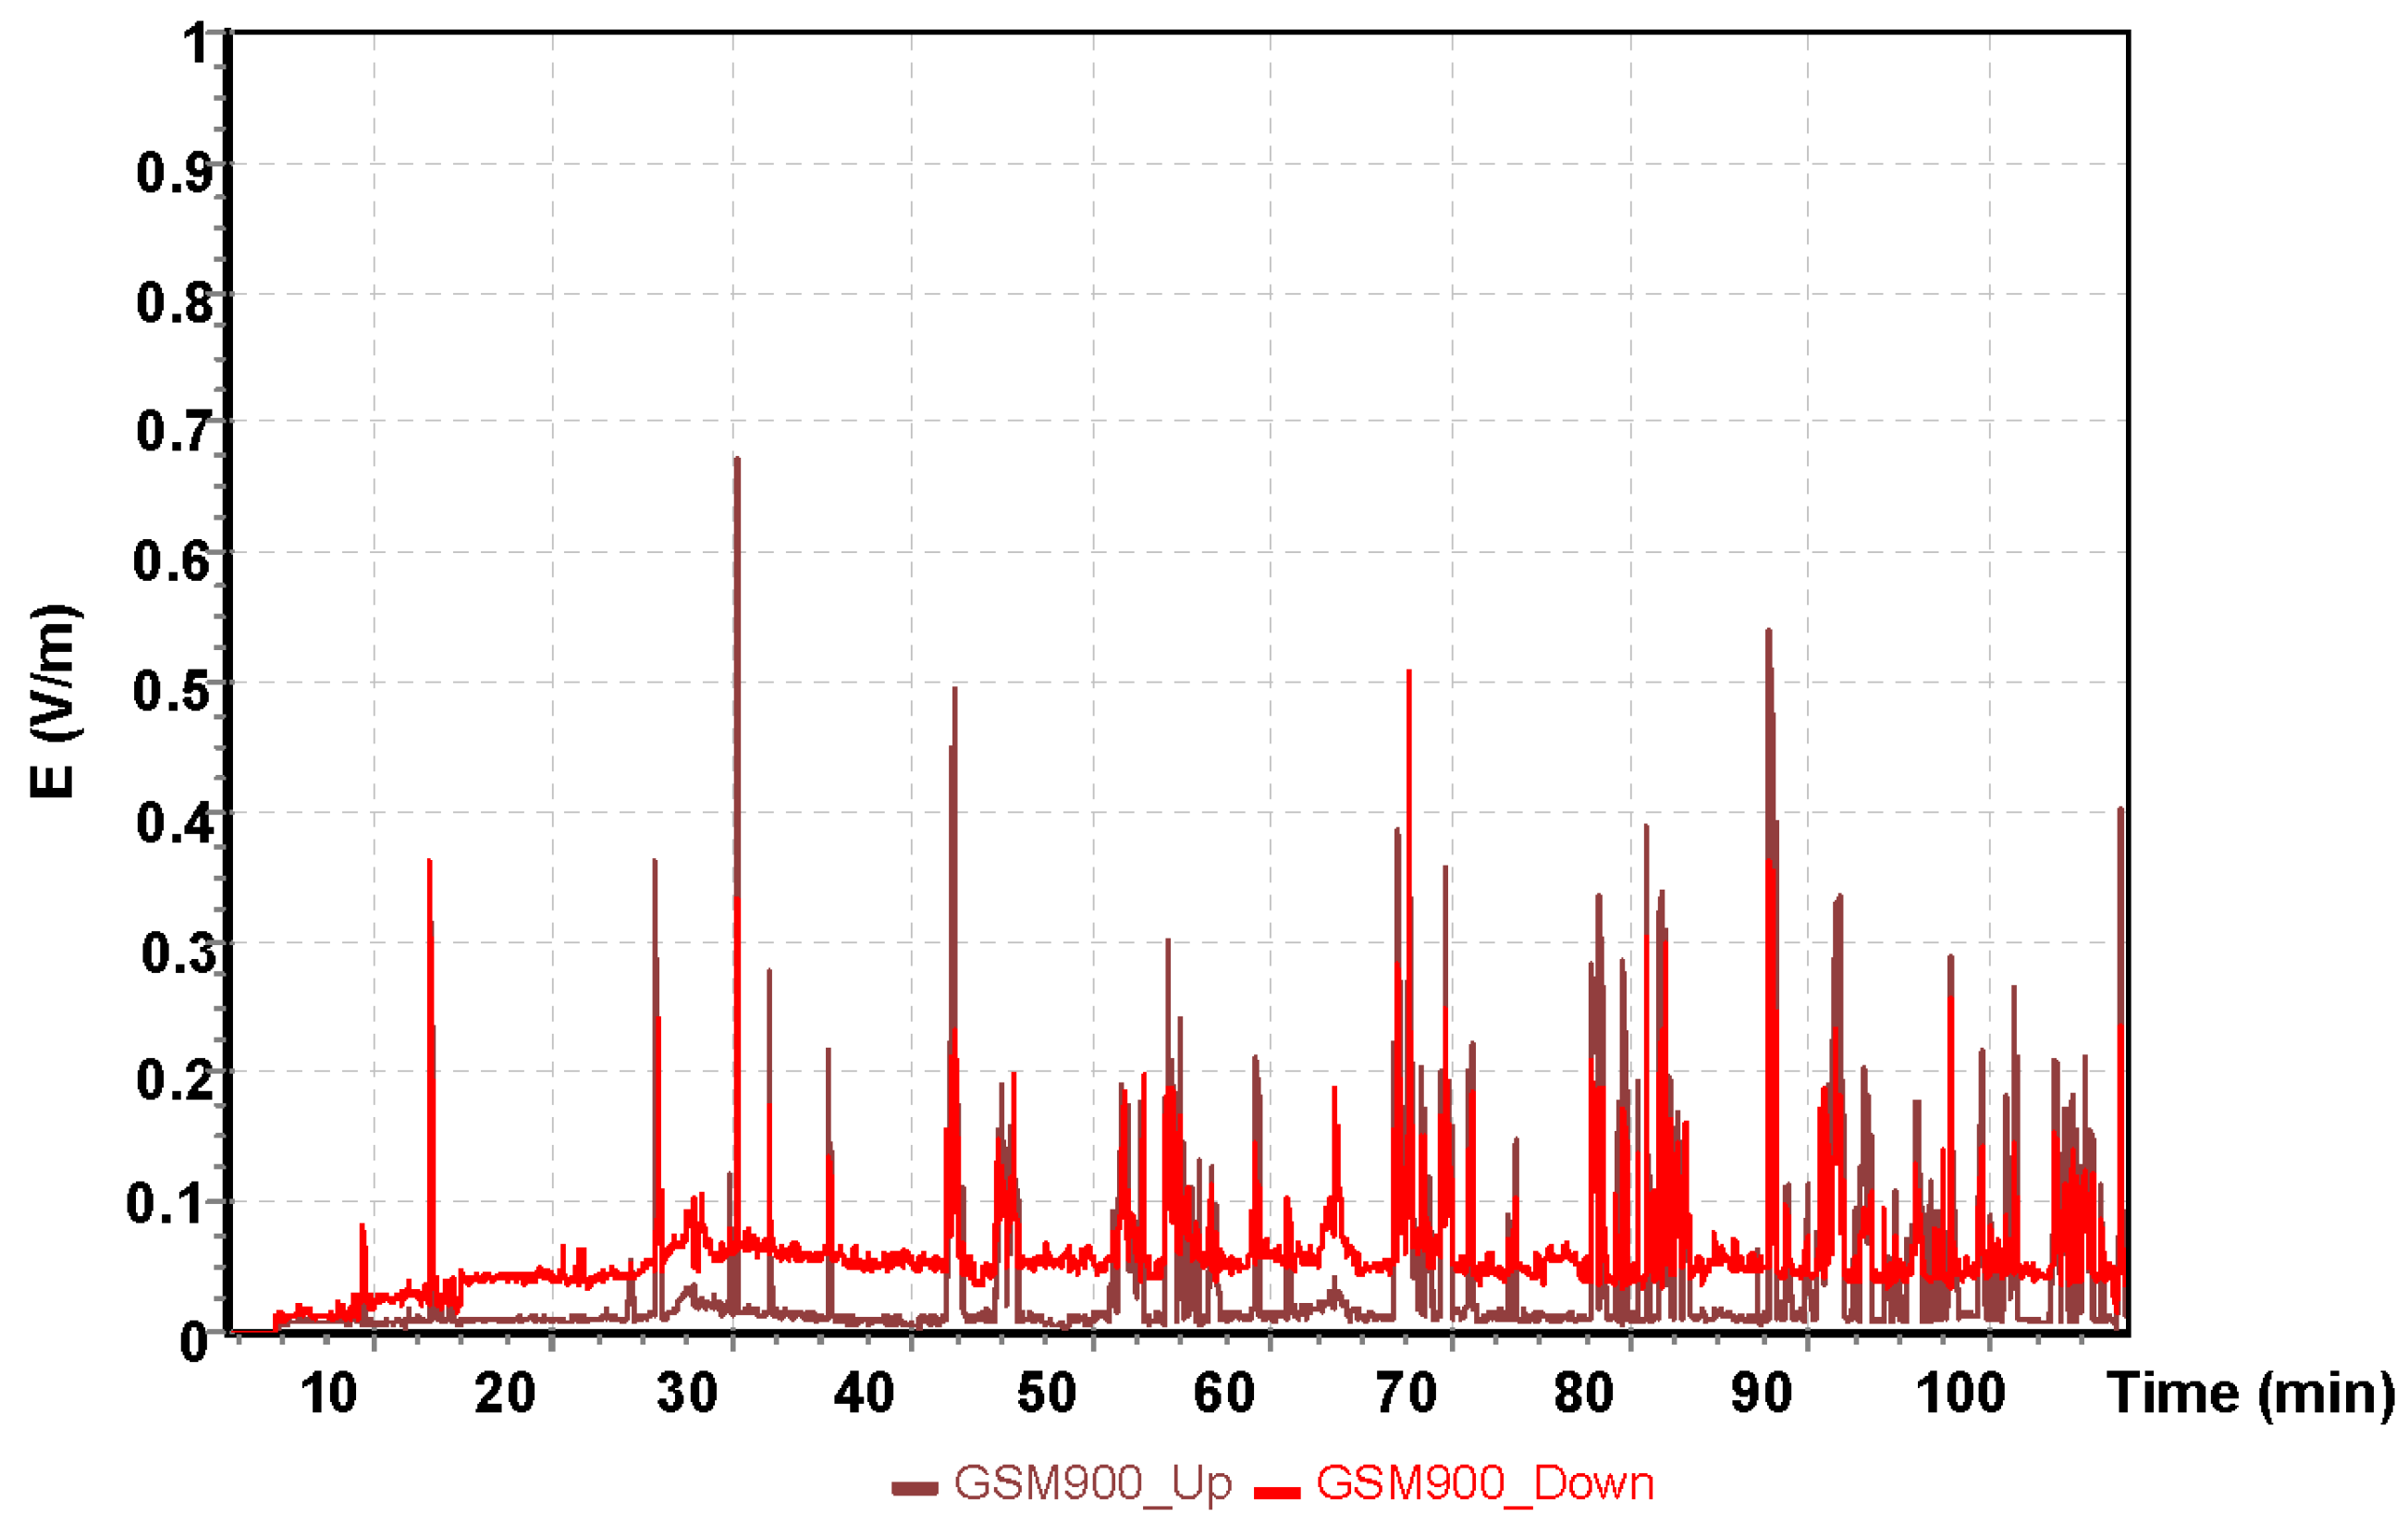
| GSM900up | 0.0229 | 0.0031 | 0.5821 | 0.0311 |
| GSM900down | 0.0749 | 0.0000 | 0.4582 | 0.0246 |
| GSM1800up | 0.0602 | 0.0602 | 1.1602 | 0.0000 |
| GSM1800down | 0.0197 | 0.0000 | 0.3463 | 0.0133 |
| UMTSup | 0.0184 | 0.0000 | 1.8870 | 0.0704 |
| UMTSdown | 0.0114 | 0.0000 | 0.1360 | 0.0074 |
| Variable | Mean | Minimum | Maximum | SD |
|---|---|---|---|---|
| GSM900up | 0.0335 | 0.0000 | 0.6838 | 0.0311 |
| GSM900down | 0.0612 | 0.0000 | 0.5155 | 0.0246 |
| GSM1800up | 0.0629 | 0.0000 | 1.1507 | 0.0000 |
| GSM1800down | 0.0098 | 0.0000 | 0.5669 | 0.0133 |
| UMTSup | 0.0195 | 0.0000 | 1.1697 | 0.0704 |
| UMTSdown | 0.0046 | 0.0000 | 0.2169 | 0.0074 |
| Variable | Mean | Minimum | Maximum | SD |
|---|---|---|---|---|
| GSM900up | 0.0210 | 0.0000 | 0.9839 | 0.0357 |
| GSM900down | 0.0687 | 0.0000 | 0.5182 | 0.0401 |
| GSM1800up | 0.0205 | 0.0000 | 1.1545 | 0.0861 |
| GSM1800down | 0.0235 | 0.0000 | 0.5748 | 0.0313 |
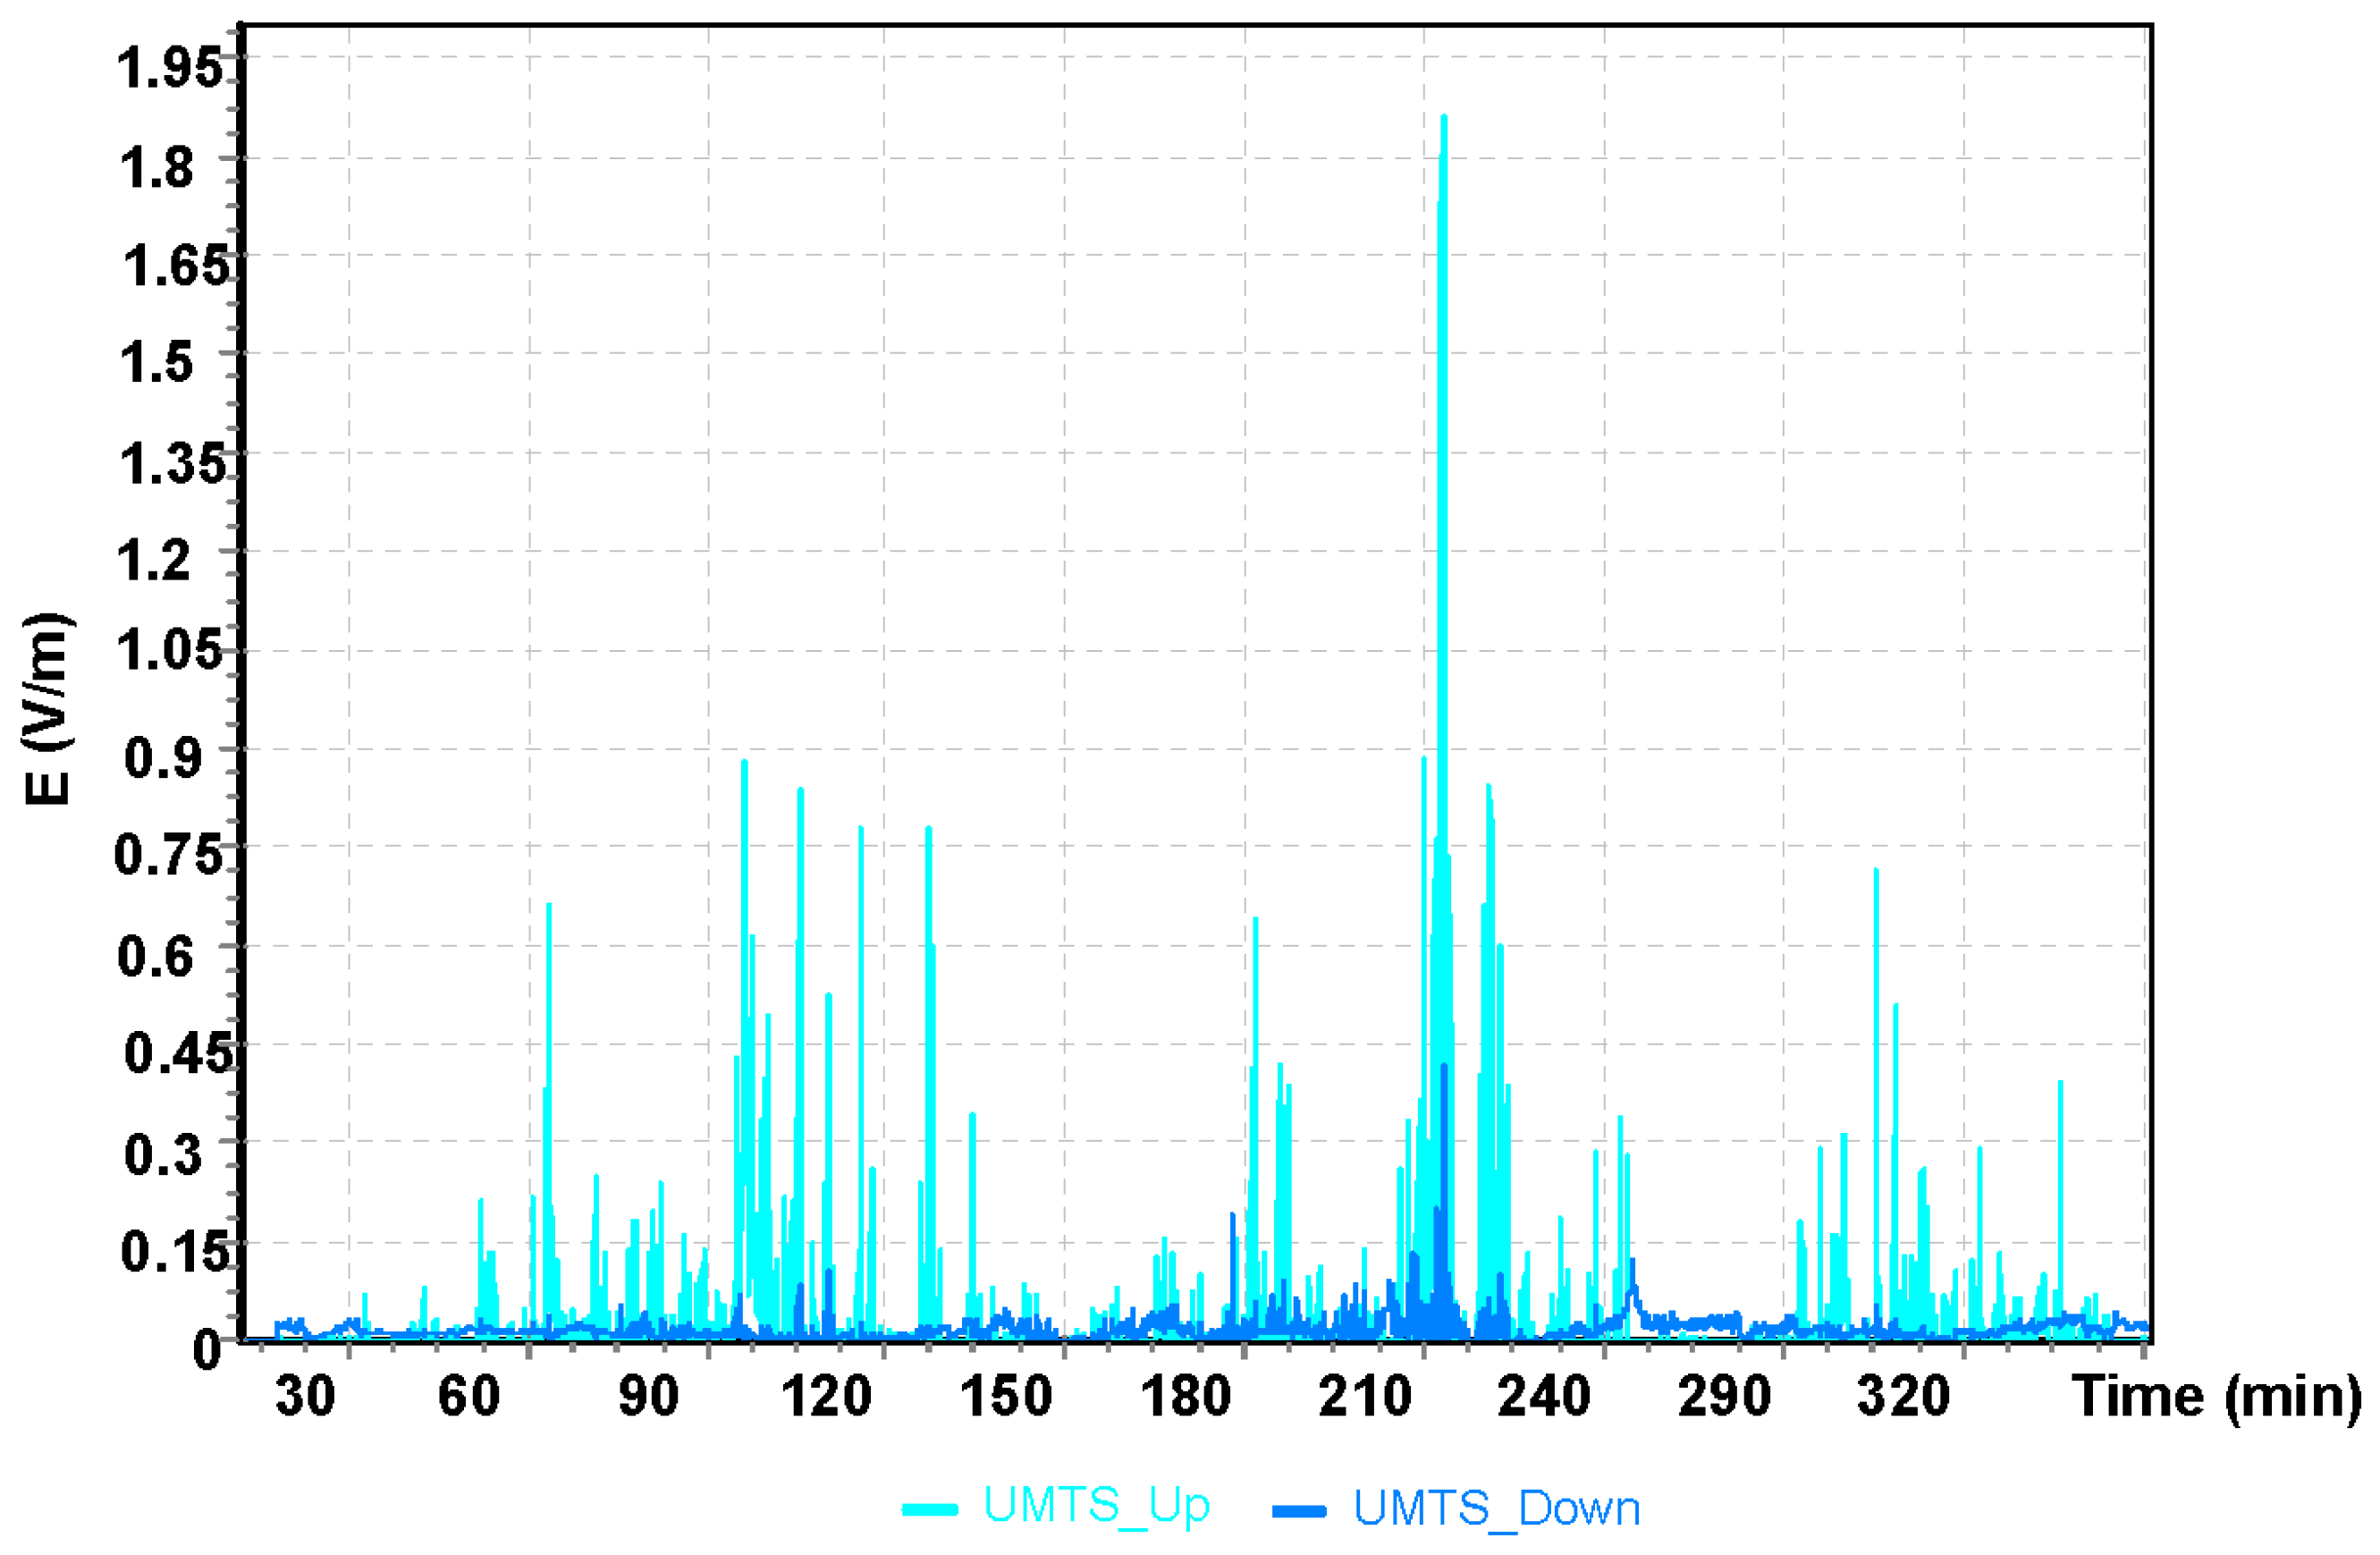
| UMTSup | 0.0230 | 0.0000 | 1.8976 | 0.1063 |
| UMTSdown | 0.0127 | 0.0000 | 0.4411 | 0.0186 |
© 2019 by the authors. Licensee MDPI, Basel, Switzerland. This article is an open access article distributed under the terms and conditions of the Creative Commons Attribution (CC BY) license (http://creativecommons.org/licenses/by/4.0/).
Share and Cite
Michałowska, J.; Tofil, A.; Józwik, J.; Pytka, J.; Legutko, S.; Siemiątkowski, Z.; Łukaszewicz, A. Monitoring the Risk of the Electric Component Imposed on a Pilot During Light Aircraft Operations in a High-Frequency Electromagnetic Field. Sensors 2019, 19, 5537. https://doi.org/10.3390/s19245537
Michałowska J, Tofil A, Józwik J, Pytka J, Legutko S, Siemiątkowski Z, Łukaszewicz A. Monitoring the Risk of the Electric Component Imposed on a Pilot During Light Aircraft Operations in a High-Frequency Electromagnetic Field. Sensors. 2019; 19(24):5537. https://doi.org/10.3390/s19245537
Chicago/Turabian StyleMichałowska, Joanna, Arkadiusz Tofil, Jerzy Józwik, Jarosław Pytka, Stanisław Legutko, Zbigniew Siemiątkowski, and Andrzej Łukaszewicz. 2019. "Monitoring the Risk of the Electric Component Imposed on a Pilot During Light Aircraft Operations in a High-Frequency Electromagnetic Field" Sensors 19, no. 24: 5537. https://doi.org/10.3390/s19245537
APA StyleMichałowska, J., Tofil, A., Józwik, J., Pytka, J., Legutko, S., Siemiątkowski, Z., & Łukaszewicz, A. (2019). Monitoring the Risk of the Electric Component Imposed on a Pilot During Light Aircraft Operations in a High-Frequency Electromagnetic Field. Sensors, 19(24), 5537. https://doi.org/10.3390/s19245537