A Systematic Review of Detecting Sleep Apnea Using Deep Learning

 ,
,  ,
,  and
and 
Abstract
1. Introduction
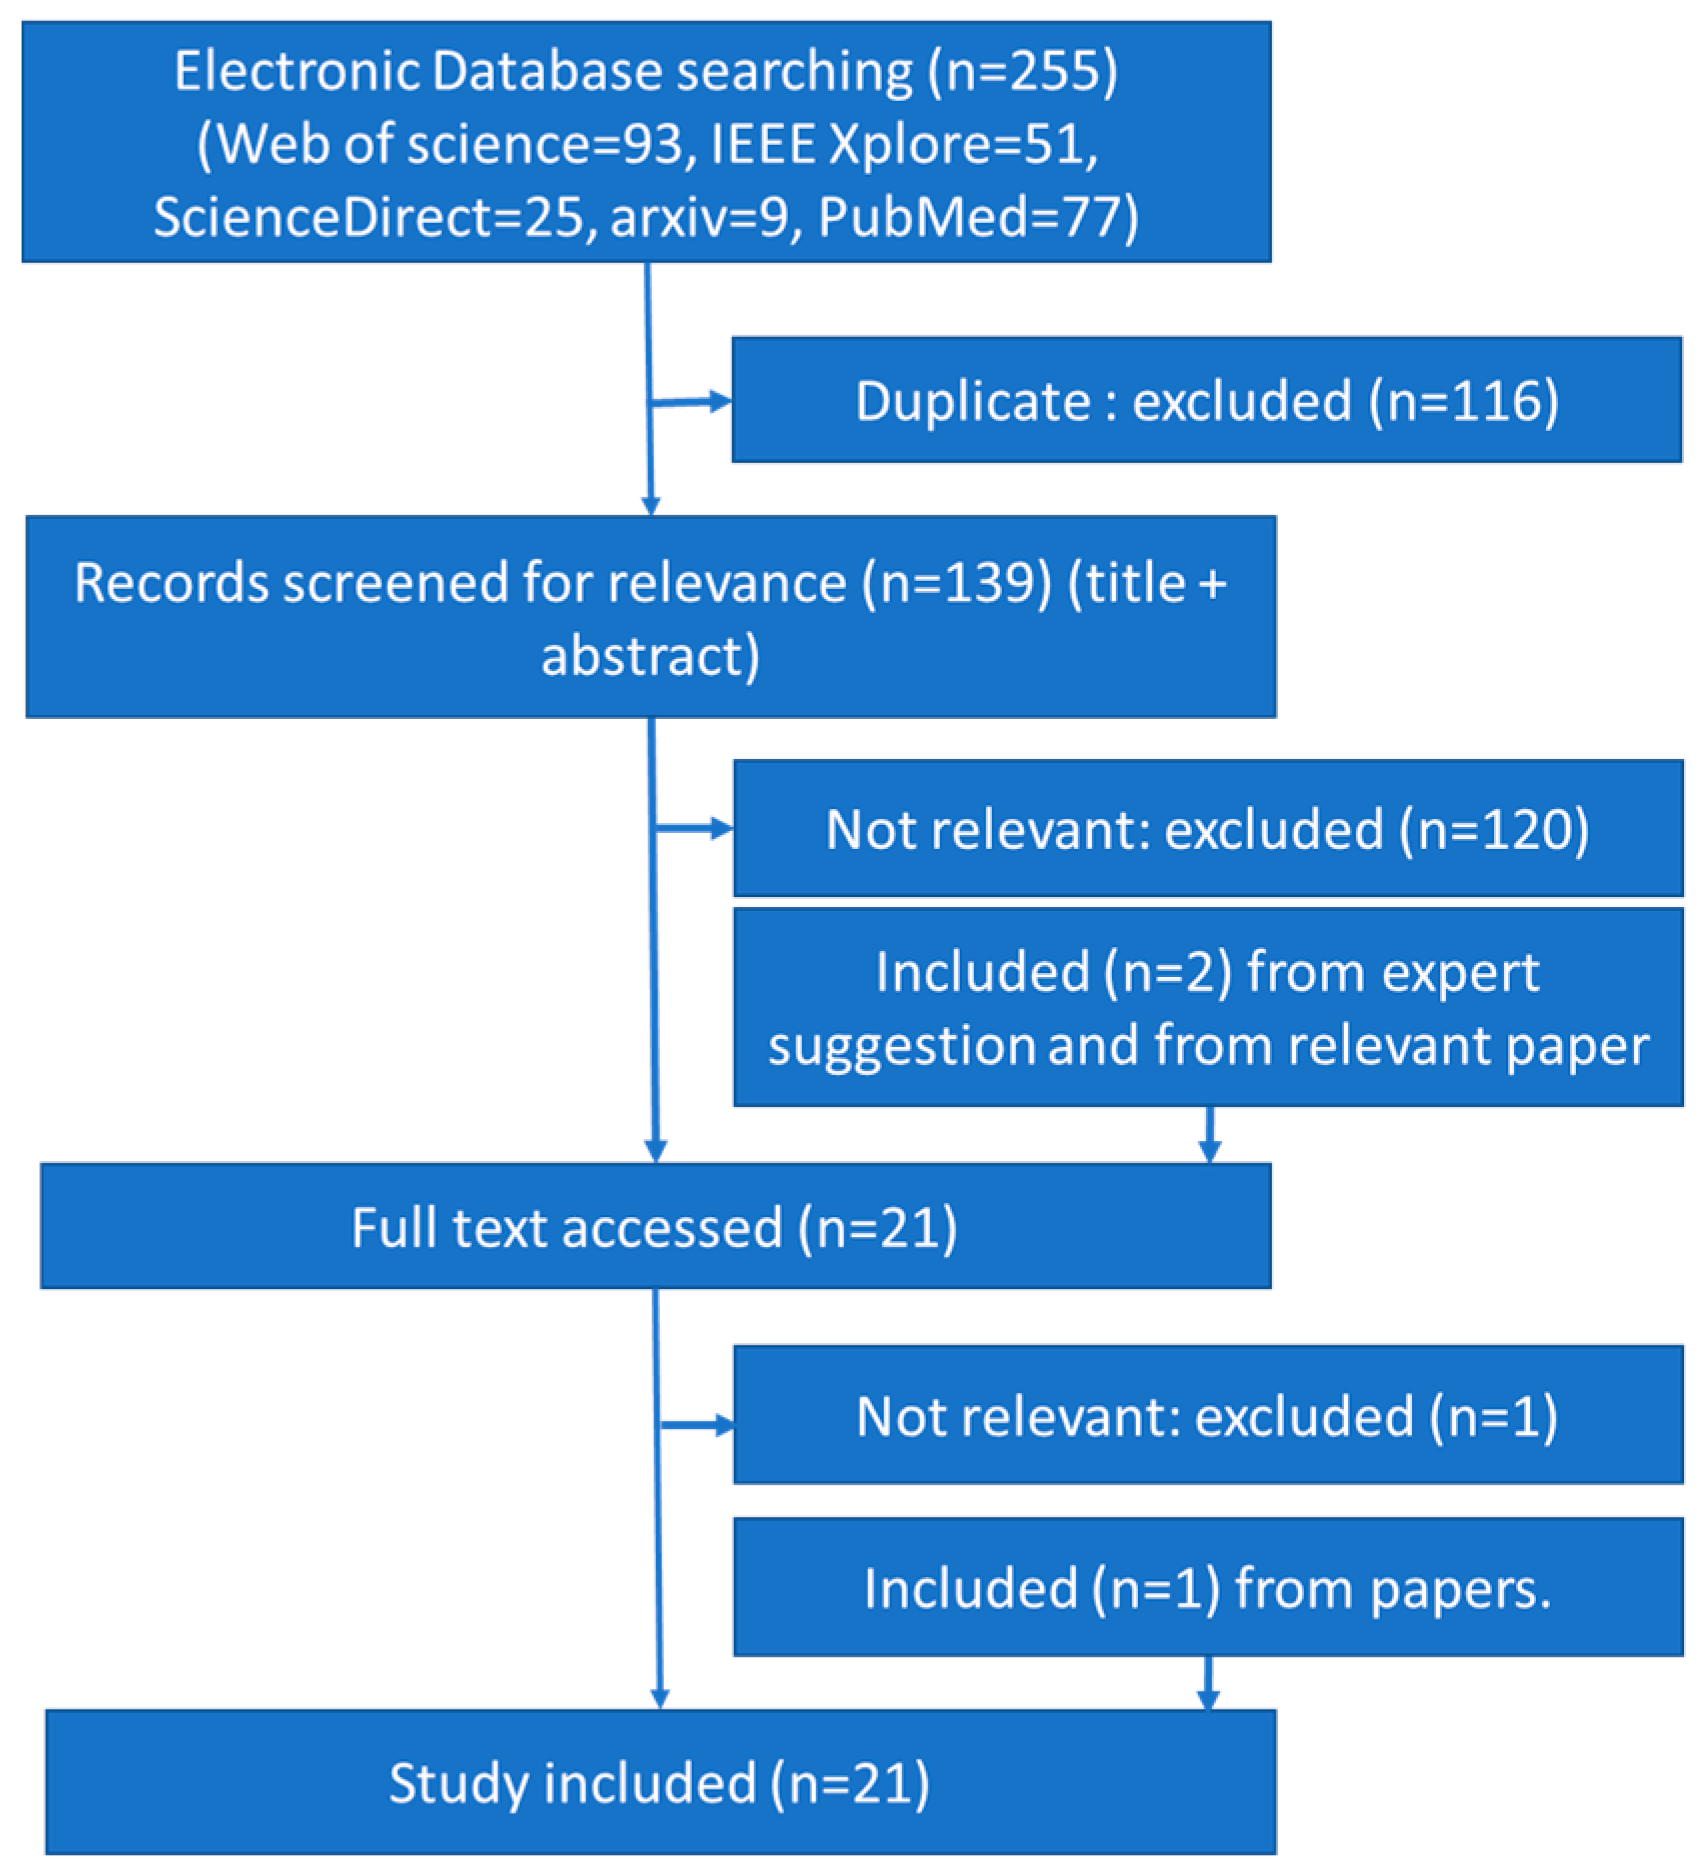
2. Materials and Methods
3. Signals, Sensors and Databases
3.1. Signal Based on Electrocardiography Sensor
3.2. Sensor Based on Blood Oxygen Saturation Index
3.3. Sensor Based on Sound
3.4. Sensor to Detect Airflow
4. Data Pre-Processing
4.1. Raw Input Signal
4.2. Filtered Signal
4.3. Spectrogram
4.4. Heart Rate from ECG
4.5. Features
5. Classifiers
5.1. Deep Vanilla Neural Network (DVNN)
5.1.1. Multiple Hidden Layers Neural Networks
5.1.2. Deep Stacked Sparse Autoencoder
5.1.3. Deep Belief Network
5.2. Convolution Neural Network
5.3. Recurrent Neural Network
5.3.1. Long Short-Term Memory
5.3.2. Gated Recurrent Unit
6. Performance Indicators
7. Implementation of Classifiers and Performance
7.1. Deep Vanilla Neural Network
7.1.1. Automatic Feature Learning Using DVNN
7.1.2. Human Crafted Feature Learning Using DVNN
7.2. Convolutional Neural Network (CNN)
7.2.1. CNN1D
7.2.2. CNN2D
7.3. Recurrent Neural Network (RNN)
7.4. Combination of Multiple Deep Networks
8. Discussion and Conclusions
Author Contributions
Funding
Conflicts of Interest
Appendix A

| Abbreviation and Acronyms | Full Form | Abbreviation and Acronyms | Full Form |
|---|---|---|---|
| AASM | American Academy of Sleep Medicine | LSTM | Long Short-Term Memory |
| Acc | Accuracy | maxpooling | Maximum Pooling |
| AE | Autoencoder | MESA | Multi-Ethnic Study of Atherosclerosis |
| AED | Apnea-ECG database | MGH | Massachusetts General Hospital |
| AF | Air Flow | MHLNN | Multiple hidden layers neural network |
| AHI | Apnea hyperpnea Index | mRMR | Minimum Redundancy Maximum Relevance |
| ANN | Artificial Neural Network | MrOS | Osteoporotic Fractures in Men Study |
| AUC | Area under ROC curve | NPV | Negative Predictive Value |
| bpm | Beats Per Minutes | NSRR | National Sleep Research Resource |
| CNN | Convolution Neural Network | OSA | Obstructive Sleep Apnea |
| CO | Combined Objective | OSAH | Obstructive Sleep Apnea Hypopnea |
| CWT | Continuous Wavelet Transform | SpO2 | Blood Oxygen Saturation Index |
| DAE | Deep Autoencoder | Spc | Specificity |
| DBN | Deep Belief Network | PPV | Precision or Positive Predictive Value |
| DL | Deep Learning | PSG | Polysomnography |
| DNN | Deep Neural Network | RBM | Restricted Boltzmann Machines |
| DVNN | Deep Vanilla Neural Network | RCNN | Combined Deep Recurrent and Convolutional Neural Networks |
| EA | Evolutionary Algorithms | ReLU | Rectified Linear Unit |
| ECG | Electrocardiography | RF | Random Forest |
| EDR | ECG derived respiration | RNN | recurrent neural network |
| EEG | Electroencephalogram | RR-ECG | R to R interval from ECG |
| EMG | Electromyography | SAE | Stacked Autoencoder |
| EOG | Electrooculogram | SCSMC | Sleep Center of Samsung Medical Center |
| score | Sen | Recall or Sensitivity | |
| Weighted score | SFS | Sequential Forward Selection | |
| FP | False Positive | SHHS | Sleep Heart Health Study |
| FLSTM | LSTM with feature inputs | SNUBH | Seoul National University Bundang Hospital |
| GA | Genetic Algorithm | SNUH | Seoul National University Hospital |
| HRV | Heart Rate Variability | SpAE | Sparse Autoencoder |
| Hz | Hertz | Spc | Specificity |
| IHR | Instantaneous Heart Rates | SVM | Support Vector Machine |
| IIR | Infinite Impulse Response | TN | True Negative |
| kNN | k-nearest neighbor | TP | True Positive |
| LDA | Linear Discriminant Analysis | UCD | St. Vincent’s University Hospital/University College Dublin Sleep Apnea Database |
| LR | Logistic Regression |
References
- Sateia, M.J. International Classification of Sleep Disorders-Third Edition (ICSD-3). Chest 2014, 146, 1387–1394. [Google Scholar] [CrossRef] [PubMed]
- Zhang, J.; Zhang, Q.; Wang, Y.; Qiu, C. A Real-time auto-adjustable smart pillow system for sleep apnea detection and treatment. In Proceedings of the 12th International Conference on Information Processing in Sensor Networks (IPSN), Philadelphia, PA, USA, 8–11 April 2013; pp. 179–190. [Google Scholar]
- Young, T.; Palta, M.; Dempsey, J.; Skatrud, J.; Weber, S.; Badr, S. The occurrence of sleep-disordered breathing among middle-aged adults. N. Engl. J. Med. 1993, 328, 1230–1235. [Google Scholar] [CrossRef] [PubMed]
- Young, T.; Evans, L.; Finn, L.; Palta, M. Estimation of the clinically diagnosed proportion of sleep apnea syndrome in middle-aged men and women. Sleep 1997, 20, 705–706. [Google Scholar] [CrossRef] [PubMed]
- Gislason, T.; Benediktsdóttir, B. Snoring, Apneic Episodes, and Nocturnal Hypoxemia Among Children 6 Months to 6 Years Old. Chest 1995, 107, 963–966. [Google Scholar] [CrossRef]
- Ancoli-Israel, S.; DuHamel, E.R.; Stepnowsky, C.; Engler, R.; Cohen-Zion, M.; Marler, M. The relationship between congestive heart failure, sleep apnea, and mortality in older men. Chest 2003, 124, 1400–1405. [Google Scholar] [CrossRef]
- Vgontzas, A.N.; Papanicolaou, D.A.; Bixler, E.O.; Hopper, K.; Lotsikas, A.; Lin, H.-M.; Kales, A.; Chrousos, G.P. Sleep Apnea and Daytime Sleepiness and Fatigue: Relation to Visceral Obesity, Insulin Resistance, and Hypercytokinemia. J. Clin. Endocrinol. Metab. 2000, 85, 1151–1158. [Google Scholar] [CrossRef]
- Doumit, J.; Prasad, B. Sleep Apnea in Type 2 Diabetes. Diabetes Spectr. 2016, 29, 14–19. [Google Scholar] [CrossRef]
- Bsoul, M.; Minn, H.; Tamil, L. Apnea MedAssist: Real-time Sleep Apnea Monitor Using Single-Lead ECG. IEEE Trans. Inf. Technol. Biomed. 2011, 15, 416–427. [Google Scholar] [CrossRef]
- De Chazal, P.; Penzel, T.; Heneghan, C. Automated Detection of Obstructive Sleep Apnoea at Different Time Scales using the Electrocardiogram. Physiol. Meas. 2004, 25, 967–983. [Google Scholar] [CrossRef]
- Agarwal, R.; Gotman, J. Computer-Assisted Sleep Staging. IEEE Trans. Biomed. Eng. 2001, 48, 1412–1423. [Google Scholar] [CrossRef]
- Hillman, D.R.; Murphy, A.S.; Pezzullo, L. The Economic Cost of Sleep Disorders. Sleep 2006, 29, 299–305. [Google Scholar] [CrossRef] [PubMed]
- Alghanim, N.; Comondore, V.R.; Fleetham, J.; Marra, C.A.; Ayas, N.T. The Economic Impact of Obstructive Sleep Apnea. Lung 2008, 186, 7–12. [Google Scholar] [CrossRef] [PubMed]
- Khandoker, A.H.; Gubbi, J.; Palaniswami, M. Automated Scoring of Obstructive Sleep Apnea and Hypopnea Events Using Short-Term Electrocardiogram Recordings. IEEE Trans. Inf. Technol. Biomed. 2009, 13, 1057–1067. [Google Scholar] [CrossRef] [PubMed]
- Mendez, M.O.; Corthout, J.; Van Huffel, S.; Matteucci, M.; Penzel, T.; Cerutti, S.; Bianchi, A.M. Automatic screening of obstructive sleep apnea from the ECG based on empirical mode decomposition and wavelet analysis. Physiol. Meas. 2010, 31, 273–289. [Google Scholar] [CrossRef]
- Mostafa, S.S.; Morgado-Dias, F.; Ravelo-García, A.G. Comparison of SFS and mRMR for oximetry feature selection in obstructive sleep apnea detection. Neural Comput. Appl. 2018, 1–21. [Google Scholar] [CrossRef]
- Al-Angari, H.M.; Sahakian, A.V. Automated Recognition of Obstructive Sleep Apnea Syndrome Using Support Vector Machine Classifier. IEEE Trans. Inf. Technol. Biomed. 2012, 16, 463–468. [Google Scholar] [CrossRef]
- Álvarez-Estévez, D.; Moret-Bonillo, V. Fuzzy reasoning used to detect apneic events in the sleep apnea-hypopnea syndrome. Expert Syst. Appl. 2009, 36, 7778–7785. [Google Scholar] [CrossRef]
- Lee, S.; Urtnasan, E.; Lee, K.-J. Design of a Fast Learning Classifier for Sleep Apnea Database based on Fuzzy SVM. Int. J. Fuzzy Log. Intell. Syst. 2017, 17, 187–193. [Google Scholar] [CrossRef]
- Almazaydeh, L.; Faezipour, M.; Elleithy, K. A Neural Network System for Detection of Obstructive Sleep Apnea Through SpO2 Signal Features. Int. J. Adv. Comput. Sci. Appl. 2012, 3, 7–11. [Google Scholar] [CrossRef]
- Mostafa, S.S.; Carvalho, J.P.; Morgado-Dias, F.; Ravelo-García, A. Optimization of sleep apnea detection using SpO2 and ANN. In Proceedings of the XXVI International Conference on Information, Communication and Automation Technologies (ICAT), Sarajevo, Bosnia-Herzegovina, 26–28 October 2017; pp. 1–6. [Google Scholar]
- Ravelo-García, A.; Kraemer, J.; Navarro-Mesa, J.; Hernández-Pérez, E.; Navarro-Esteva, J.; Juliá-Serdá, G.; Penzel, T.; Wessel, N. Oxygen Saturation and RR Intervals Feature Selection for Sleep Apnea Detection. Entropy 2015, 17, 2932–2957. [Google Scholar] [CrossRef]
- Cover, T.M. The Best Two Independent Measurements Are Not the Two Best. IEEE Trans. Syst. Man Cybern. 1974, SMC-4, 116–117. [Google Scholar] [CrossRef]
- Mendez, M.O.; Bianchi, A.M.; Matteucci, M.; Cerutti, S.; Penzel, T. Sleep Apnea Screening by Autoregressive Models from a Single ECG Lead. IEEE Trans. Biomed. Eng. 2009, 56, 2838–2850. [Google Scholar] [CrossRef] [PubMed]
- Isa, S.M.; Fanany, M.I.; Jatmiko, W.; Arymurthy, A.M. Sleep apnea detection from ECG signal: Analysis on optimal features, principal components, and nonlinearity. In Proceedings of the IEEE 5th International Conference on Bioinformatics and Biomedical Engineering, Wuhan, China, 10–12 May 2011; pp. 1–4. [Google Scholar]
- Mendonça, F.; Mostafa, S.S.; Ravelo-García, A.G.; Morgado-Dias, F.; Penzel, T. Devices for Home Detection of Obstructive Sleep Apnea: A Review. Sleep Med. Rev. 2018, 41, 149–160. [Google Scholar] [CrossRef] [PubMed]
- Mendonca, F.; Mostafa, S.S.; Ravelo-Garcia, A.G.; Morgado-Dias, F.; Penzel, T. A Review of Obstructive Sleep Apnea Detection Approaches. IEEE J. Biomed. Health Inform. 2019, 23, 825–837. [Google Scholar] [CrossRef]
- Jayaraj, R.; Mohan, J.; Kanagasabai, A. A Review on Detection and Treatment Methods of Sleep Apnea. J. Clin. Diagn. Res. 2017, 11, VE01–VE03. [Google Scholar] [CrossRef]
- Penzel, T.; Moody, G.; Mark, R.; Goldberger, A.; Peter, J. The apnea-ECG database. In Proceedings of the Computers in Cardiology, Cambridge, MA, USA, 24–27 September 2000; IEEE: Piscataway, NJ, USA, 2000; pp. 255–258. [Google Scholar]
- PhysioNet. Available online: www.physionet.org (accessed on 20 February 2019).
- Goldberger, A.L.; Amaral, L.A.; Glass, L.; Hausdorff, J.M.; Ivanov, P.C.; Mark, R.G.; Mietus, J.E.; Moody, G.B.; Peng, C.K.; Stanley, H.E. PhysioBank, PhysioToolkit, and PhysioNet: Components of a New Research Resource for Complex Physiologic Signals. Circulation 2000, 101, e215–e220. [Google Scholar] [CrossRef]
- Li, K.; Pan, W.; Li, Y.; Jiang, Q.; Liu, G. A method to detect sleep apnea based on deep neural network and hidden Markov model using single-lead ECG signal. Neurocomputing 2018, 294, 94–101. [Google Scholar] [CrossRef]
- Pathinarupothi, R.K.; Rangan, E.S.; Gopalakrishnan, E.A.; Vinaykumar, R.; Soman, K.P. Single sensor techniques for sleep apnea diagnosis using deep learning. In Proceedings of the IEEE International Conference on Healthcare Informatics (ICHI), Park City, UT, USA, 23–26 August 2017; IEEE: Piscataway, NJ, USA, 2017; pp. 524–529. [Google Scholar]
- Pathinarupothi, R.K.; Vinaykumar, R.; Rangan, E.; Gopalakrishnan, E.; Soman, K.P. Instantaneous heart rate as a robust feature for sleep apnea severity detection using deep learning. In Proceedings of the IEEE EMBS International Conference on Biomedical & Health Informatics (BHI), Orlando, FL, USA, 16–19 February 2017; IEEE: Piscataway, NJ, USA, 2017; pp. 293–296. [Google Scholar]
- Novak, D.; Mucha, K.; Al-Ani, T. Long Short-Term Memory for apnea detection based on heart rate variability. In Proceedings of the 30th Annual International Conference of the IEEE Engineering in Medicine and Biology Society, Vancouver, BC, Canada, 20–24 August 2008; pp. 5234–5237. [Google Scholar]
- De Falco, I.; De Pietro, G.; Sannino, G.; Scafuri, U.; Tarantino, E.; Della Cioppa, A.; Trunfio, G.A. Deep neural network hyper-parameter setting for classification of obstructive sleep apnea episodes. In Proceedings of the 2018 IEEE Symposium on Computers and Communications (ISCC), Natal, Brazil, 25–28 June 2018; IEEE: Piscataway, NJ, USA, 2018; pp. 01187–01192. [Google Scholar]
- Dey, D.; Chaudhuri, S.; Munshi, S. Obstructive sleep apnoea detection using convolutional neural network based deep learning framework. Biomed. Eng. Lett. 2018, 8, 95–100. [Google Scholar] [CrossRef]
- Banluesombatkul, N.; Rakthanmanon, T.; Wilaiprasitporn, T. Single Channel ECG for Obstructive Sleep Apnea Severity Detection using a Deep Learning Approach. In Proceedings of the TENCON 2018—2018 IEEE Region 10 Conference, Jeju, Korea, 28–31 October 2018. [Google Scholar]
- Dean, D.A.; Goldberger, A.L.; Mueller, R.; Kim, M.; Rueschman, M.; Mobley, D.; Sahoo, S.S.; Jayapandian, C.P.; Cui, L.; Morrical, M.G.; et al. Scaling Up Scientific Discovery in Sleep Medicine: The National Sleep Research Resource. Sleep 2016, 39, 1151–1164. [Google Scholar] [CrossRef]
- Blank, J.B.; Cawthon, P.M.; Carrion-Petersen, M.L.; Harper, L.; Johnson, J.P.; Mitson, E.; Delay, R.R. Overview of recruitment for the osteoporotic fractures in men study (MrOS). Contemp. Clin. Trials 2005, 26, 557–568. [Google Scholar] [CrossRef]
- Orwoll, E.; Blank, J.B.; Barrett-Connor, E.; Cauley, J.; Cummings, S.; Ensrud, K.; Lewis, C.; Cawthon, P.M.; Marcus, R.; Marshall, L.M.; et al. Design and baseline characteristics of the osteoporotic fractures in men (MrOS) study--a large observational study of the determinants of fracture in older men. Contemp. Clin. Trials 2005, 26, 569–585. [Google Scholar] [CrossRef] [PubMed]
- Blackwell, T.; Yaffe, K.; Ancoli-Israel, S.; Redline, S.; Ensrud, K.; Stefanick, M.; Laffan, A.; Stone, K. Associations between sleep architecture and sleep-disordered breathing and cognition in older community-dwelling men: The Osteoporotic Fractures in Men Sleep Study. J. Am. Geriatr. Soc. 2011, 59, 2217–2225. [Google Scholar] [CrossRef] [PubMed]
- Urtnasan, E.; Park, J.-U.; Lee, K.-J. Multiclass classification of obstructive sleep apnea/hypopnea based on a convolutional neural network from a single-lead electrocardiogram. Physiol. Meas. 2018, 39, 065003. [Google Scholar] [CrossRef] [PubMed]
- Berry, B.R.; Brooks, R.; Gamaldo, E.C.; Harding, M.S.; Marcus, C.; Vaughn, B. AASM Manual for the Scoring of Sleep and Associated Events. Rules, Terminology and Technical Specifications; AASM: Darien, IL, USA, 2012. [Google Scholar]
- Urtnasan, E.; Park, J.U.; Lee, K.J. Automatic detection of sleep-disordered breathing events using recurrent neural networks from an electrocardiogram signal. Neural Comput. Appl. 2018. [Google Scholar] [CrossRef]
- Urtnasan, E.; Park, J.; Joo, E.; Lee, K. Automated Detection of Obstructive Sleep Apnea Events from a Single-Lead Electrocardiogram Using a Convolutional Neural Network. J. Med. Syst. 2018, 42, 104. [Google Scholar] [CrossRef]
- Mostafa, S.S.; Mendonça, F.; Morgado-Dias, F.; Ravelo-García, A. SpO2 based sleep apnea detection using deep learning. In Proceedings of the 2017 IEEE 21st International Conference on Intelligent Engineering Systems (INES), Larnaca, Cyprus, 20–23 October 2017; IEEE: Piscataway, NJ, USA, 2017; pp. 91–96. [Google Scholar]
- Cen, L.; Yu, Z.L.; Kluge, T.; Ser, W. Automatic system for obstructive sleep apnea events detection using convolutional neural network. In Proceedings of the 40th Annual International Conference of the IEEE Engineering in Medicine and Biology Society (EMBC), Honolulu, HI, USA, 18–21 July 2018; IEEE: Piscataway, NJ, USA, 2018; pp. 3975–3978. [Google Scholar]
- Biswal, S.; Sun, H.; Goparaju, B.; Westover, M.B.; Sun, J.; Bianchi, M.T. Expert-level sleep scoring with deep neural networks. J. Am. Med. Informatics Assoc. 2018, 25, 1643–1650. [Google Scholar] [CrossRef]
- Sleep Heart Health Study. Available online: https://sleepdata.org/datasets/shhs (accessed on 11 January 2019).
- Choi, S.H.; Yoon, H.; Kim, H.S.; Kim, H.B.; Kwon, H.B.; Oh, S.M.; Lee, Y.J.; Park, K.S. Real-time apnea-hypopnea event detection during sleep by convolutional neural networks. Comput. Biol. Med. 2018, 100, 123–131. [Google Scholar] [CrossRef]
- Kim, T.; Kim, J.-W.; Lee, K. Detection of sleep disordered breathing severity using acoustic biomarker and machine learning techniques. Biomed. Eng. Online 2018, 17, 16. [Google Scholar] [CrossRef]
- Haidar, R.; McCloskey, S.; Koprinska, I.; Jeffries, B. Convolutional neural networks on multiple respiratory channels to detect hypopnea and obstructive apnea events. In Proceedings of the 2018 International Joint Conference on Neural Networks (IJCNN), Rio de Janeiro, Brazil, 8–13 July 2018; IEEE: Piscataway, NJ, USA, 2018; pp. 1–7. [Google Scholar]
- Quan, S.F.; Howard, B.V.; Iber, C.; Kiley, J.P.; Nieto, F.J.; O’Connor, G.T.; Rapoport, D.M.; Redline, S.; Robbins, J.; Samet, J.M.; et al. The Sleep Heart Health Study: Design, rationale, and methods. Sleep 1997, 20, 1077–1085. [Google Scholar]
- Van Steenkiste, T.; Groenendaal, W.; Deschrijver, D.; Dhaene, T. Automated Sleep Apnea Detection in Raw Respiratory Signals using Long Short-Term Memory Neural Networks. IEEE J. Biomed. Heal. Informatics 2018. [Google Scholar] [CrossRef]
- Technical Notes on SHHS1. Available online: https://www.sleepdata.org/datasets/shhs/pages/08-equipment-shhs1.md (accessed on 12 February 2019).
- Lakhan, P.; Ditthapron, A.; Banluesombatkul, N.; Wilaiprasitporn, T. Deep neural networks with weighted averaged overnight airflow features for sleep apnea-hypopnea severity classification. In Proceedings of the TENCON, IEEE Region 10 International Conference, Jeju, Korea, 28–31 October 2018; pp. 1–5. [Google Scholar]
- Lee-Chiong, T.L. Sleep Medicine: Essentials and Review; Oxford University Press: Oxford, UK, 2008; ISBN 0195306597. [Google Scholar]
- McCloskey, S.; Haidar, R.; Koprinska, I.; Jeffries, B. Detecting hypopnea and obstructive apnea events using convolutional neural networks on wavelet spectrograms of nasal airflow. In Proceedings of the Pacific-Asia Conference on Knowledge Discovery and Data Mining (PAKDD), Melbourne, Australia, 3–6 June 2018; Springer: Cham, Switzerland, 2018; pp. 361–372. [Google Scholar]
- Haidar, R.; Koprinska, I.; Jeffries, B. Sleep apnea event detection from nasal airflow using convolutional neural networks. In Proceedings of the International Conference on Neural Information Processing (ICONIP), Guangzhou, China, 14–18 November 2017; pp. 819–827. [Google Scholar]
- St. Vincent’s University Hospital/University College Dublin Sleep Apnea Database. Available online: https://physionet.org/pn3/ucddb/ (accessed on 25 February 2019).
- Cheng, M.; Sori, W.J.; Jiang, F.; Khan, A.; Liu, S. Recurrent neural network based classification of ECG signal features for obstruction of sleep apnea detection. In Proceedings of the 2017 IEEE International Conference on Computational Science and Engineering (CSE) and IEEE International Conference on Embedded and Ubiquitous Computing (EUC), Guangzhou, China, 21–24 July 2017; IEEE: Piscataway, NJ, USA, 2017; pp. 199–202. [Google Scholar]
- Boll, S. Suppression of acoustic noise in speech using spectral subtraction. IEEE Trans. Acoust. 1979, 27, 113–120. [Google Scholar] [CrossRef]
- Kim, J.; Kim, T.; Lee, D.; Kim, J.-W.; Lee, K. Exploiting temporal and nonstationary features in breathing sound analysis for multiple obstructive sleep apnea severity classification. Biomed. Eng. Online 2017, 16, 6. [Google Scholar] [CrossRef] [PubMed]
- Van Steenkiste, T.; Groenendaal, W.; Ruyssinck, J.; Dreesen, P.; Klerkx, S.; Smeets, C.; de Francisco, R.; Deschrijver, D.; Dhaene, T. Systematic comparison of respiratory signals for the automated detection of sleep apnea. In Proceedings of the 40th Annual International Conference of the IEEE Engineering in Medicine and Biology Society (EMBC), Honolulu, HI, USA, 18–21 July 2018; IEEE: Piscataway, NJ, USA, 2018; pp. 449–452. [Google Scholar]
- Tian, J.Y.; Liu, J.Q. Apnea detection based on time delay neural network. In Proceedings of the 2005 IEEE Engineering in Medicine and Biology 27th Annual Conference, Shanghai, China, 17–18 January 2006; IEEE: Piscataway, NJ, USA, 2005; pp. 2571–2574. [Google Scholar]
- Pan, J.; Tompkins, W.J. A Real-Time QRS Detection Algorithm. IEEE Trans. Biomed. Eng. 1985, BME-32, 230–236. [Google Scholar] [CrossRef] [PubMed]
- Chen, L.; Zhang, X.; Song, C. An Automatic Screening Approach for Obstructive Sleep Apnea Diagnosis Based on Single-Lead Electrocardiogram. IEEE Trans. Autom. Sci. Eng. 2015, 12, 106–115. [Google Scholar] [CrossRef]
- Software for Viewing, Analyzing, and Creating Recordings of Physiologic Signals. Available online: https://physionet.org/physiotools/wfdb.shtml (accessed on 18 December 2018).
- Niskanen, J.-P.; Tarvainen, M.P.; Ranta-aho, P.O.; Karjalainen, P.A. Software for advanced HRV analysis. Comput. Methods Programs Biomed. 2004, 76, 73–81. [Google Scholar] [CrossRef]
- Haykin, S. Neural Networks: A Comprehnsive Foundation, 2nd ed.; Pearson Education: London, UK, 2001. [Google Scholar]
- Goodfellow, I.; Bengio, Y.; Courville, A. Deep Learning; MIT Press: Cambridge, MA, USA, 2016. [Google Scholar]
- Olshausen, B.A.; Field, D.J. Sparse coding with an overcomplete basis set: A strategy employed by V1? Vision Res. 1997, 37, 3311–3325. [Google Scholar] [CrossRef]
- Salakhutdinov, R.; Murray, I. On the quantitative analysis of deep belief networks. In Proceedings of the 25th International Conference on Machine learning—ICML ’08, Helsinki, Finland, 5–9 July 2008; ACM Press: New York, NY, USA, 2008; pp. 872–879. [Google Scholar]
- Ren, J.S.J.; Xu, L. On vectorization of deep convolutional neural networks for vision tasks. In Proceedings of the 29th AAAI Conference on Artificial Intelligence, 25–29 January 2015; pp. 1840–1846. [Google Scholar]
- Stutz, D. Understanding Convolutional Neural Networks. Nips 2016, 2014, 1–23. [Google Scholar]
- Nagi, J.; Ducatelle, F. Max-pooling convolutional neural networks for vision-based hand gesture recognition. In Proceedings of the IEEE International Conference on Signal and Image Processing Applications (ICSIPA), Kuala Lumpur, Malaysia, 16–18 November 2011; pp. 342–347. [Google Scholar]
- Baptista, D.; Mostafa, S.; Pereira, L.; Sousa, L.; Morgado-Dias, F.; Baptista, D.; Mostafa, S.S.; Pereira, L.; Sousa, L.; Morgado-Dias, F. Implementation Strategy of Convolution Neural Networks on Field Programmable Gate Arrays for Appliance Classification Using the Voltage and Current (V-I) Trajectory. Energies 2018, 11, 2460. [Google Scholar] [CrossRef]
- Memisevic, R.; Zach, C.; Hinton, G.E.; Pollefeys, M. Gated softmax classification. In Proceedings of the Advances in Neural Information Processing Systems 23 (NIPS 2010), Vancouver, BC, Canada, 6–11 December 2010; pp. 1–9. [Google Scholar]
- Ioffe, S.; Szegedy, C. Batch normalization: Accelerating deep network training by reducing internal covariate shift. In Proceedings of the ICML’15 32nd International Conference on International Conference on Machine Learning, Lille, France, 6–11 July 2015; Volume 37, pp. 448–456. [Google Scholar]
- Srivastava, N.; Hinton, G.; Krizhevsky, A.; Sutskever, I.; Salakhutdinov, R. Dropout: A Simple Way to Prevent Neural Networks from Overfitting. J. Mach. Learn. Res. 2014, 15, 1929–1958. [Google Scholar]
- Krizhevsky, A.; Sutskever, I.; Hinton, G.E. ImageNet Classification with Deep Convolutional Neural Networks. Commun. ACM 2017, 60, 84–90. [Google Scholar] [CrossRef]
- Gao, Y.; Glowacka, D. Deep Gate Recurrent Neural Network. In Proceedings of the Asian Conference on Machine Learning, Hamilton, New Zealand, 16–18 November 2016; pp. 350–365. [Google Scholar]
- Hochreiter, S.; Urgen Schmidhuber, J. Long short-term memory. Neural Comput. 1997, 9, 1735–1780. [Google Scholar] [CrossRef] [PubMed]
- Zhang, H.; Li, J.; Ji, Y.; Yue, H. Understanding Subtitles by Character-Level Sequence-to-Sequence Learning. IEEE Trans. Ind. Informatics 2017, 13, 616–624. [Google Scholar] [CrossRef]
- Chung, J.; Gulcehre, C.; Cho, K.; Bengio, Y. Empirical Evaluation of Gated Recurrent Neural Networks on Sequence Modeling. arXiv 2014, arXiv:1412.3555. [Google Scholar]
- Baratloo, A.; Hosseini, M.; Negida, A.; El Ashal, G. Part 1: Simple Definition and Calculation of Accuracy, Sensitivity and Specificity. Emergency (Iran) 2015, 3, 48–49. [Google Scholar] [PubMed]
- Fawcett, T. ROC Graphs: Notes and Practical Considerations for Data Mining Researchers. Hp L-2003-4. Mach. Learn. 2004, 31, 1–38. [Google Scholar]
- Vluymans, S. Learning from imbalanced data. Stud. Comput. Intell. 2019, 807, 81–110. [Google Scholar]
- Wallace, B.C.; Small, K.; Brodley, C.E.; Trikalinos, T.A. Class imbalance, redux. In Proceedings of the IEEE 11th International Conference on Data Mining, Vancouver, BC, Canada, 11–14 December 2011; pp. 754–763. [Google Scholar]
- Johnson, J.M.; Khoshgoftaar, T.M. Survey on deep learning with class imbalance. J. Big Data 2019, 6, 27. [Google Scholar] [CrossRef]
- Song, C.; Liu, K.; Zhang, X.; Chen, L.; Xian, X. An Obstructive Sleep Apnea Detection Approach Using a Discriminative Hidden Markov Model from ECG Signals. IEEE Trans. Biomed. Eng. 2016, 63, 1532–1542. [Google Scholar] [CrossRef]
- Nguyen, H.D.; Wilkins, B.A.; Cheng, Q.; Benjamin, B.A. An Online Sleep Apnea Detection Method Based on Recurrence Quantification Analysis. IEEE J. Biomed. Health Inform. 2014, 18, 1285–1293. [Google Scholar] [CrossRef]


| Paper | Year | Database | Recordings | Sensors/Signals | Window Size (Seconds) | Classification Type |
|---|---|---|---|---|---|---|
| [35] | 2008 | Apnea-ECG Database (AED) [29] | 70 | [Heart rate variability (HRV)- electrocardiogram (ECG)] | 60 | A/N |
| [60] | 2017 | Multi-Ethnic Study of Atherosclerosis (MESA) | 100 | [Nasal airflow] | 30 | OA/N |
| [47] | 2017 | AED [29] | 8 | [Blood oxygen saturation index (SpO2)] | 60 | OA/N |
| University College Dublin Sleep Apnea Database (UCD) [61] | 25 | [SpO2] | 60 | A/N | ||
| [34] | 2017 | AED [29] | 35 | [Instantaneous heart rates (IHR)-ECG] | 60 | G |
| [33] | 2017 | AED [29] | 35 | [IHR-ECG] | 60 | OA/N, G |
| AED [29] | 8 | [SpO2] | 60 | OA/N, G | ||
| [62] | 2017 | AED [29] | 35 | [ECG inter-beat intervals (RR-ECG)] | - | OA/N |
| [37] | 2018 | AED [29] | 35 | [ECG] | 60 | OA/N |
| [59] | 2018 | MESA [39] | 1507 | [Nasal airflow] | 30 | A/H/N |
| [52] | 2018 | Seoul National University Bundang Hospital (SNUBH) [52] | 120 | [Breathing sounds] | 5 | G |
| [46] | 2018 | Sleep Center of Samsung Medical Center, Seoul, Korea (SCSMC82) [46] | 82 | [ECG] | 10 | OA/N |
| [48] | 2018 | UCD [61] | 23 | [SpO2, oronasal airflow, and ribcage and abdomen movements] | 1 | OAH/N |
| [53] | 2018 | MESA [39] | 1507 | [Nasal airflow, Abdominal and thoracic plethysmography] | 30 | OA/H/N |
| [36] | 2018 | AED [29] | 35 | [HRV ECG] | 60 | OA/N |
| [51] | 2018 | Seoul National University Hospital (SNUH) [51], | 179 | [Nasal pressure] | 10 | AH/N, G |
| MESA [39] | 50 | [Nasal pressure] | 10 | AH/N, G | ||
| [38] | 2018 | Osteoporotic Fractures in Men Study (MrOS) (Visit 1) [40] | 545 | [ECG] | 15 | G |
| [57] | 2018 | MrOS (Visit 2) [40] | 520 | [Airflow] | - | G |
| [49] | 2018 | Massachusetts General Hospital (MGH) | 10 000 | [Airflow, respiration (chest and abdomen belts), SpO2] | 1 | G |
| Sleep Heart Health Study (SHHS) [50] | 5804 | [Airflow, respiration (chest and abdomen belts), SpO2] | 1 | G | ||
| [55] | 2018 | SHHS-1 [54] | 2100 | [Respiratory signals (chest and abdomen belts), ECG derived respiration (EDR)] | 30 | A/N |
| [43] | 2018 | SCSMC86 [43] | 86 | [ECG] | 10 | OA/H/N |
| [45] | 2018 | SCSMC92 | 92 | [ECG] | 10 | A/H/N, AH/N |
| [32] | 2018 | AED [29] | 70 | [RR–ECG] | 60 | OAH/N, G |
| Paper | Classifier Type | Sen/Recall (%) | Spc (%) | Acc (%) | Others |
|---|---|---|---|---|---|
| [57] | Multiple hidden layers neural network (MHLNN) (Apnea Hypopnea Index, AHI 5) | 80.47 (G) | 86.35 (G) | 83.46 (G) | - |
| MHLNN (AHI 15) | 85.56 (G) | 86.96 (G) | 85.39 (G) | - | |
| MHLNN (AHI 30) | 93.06 (G) | 90.23 (G) | 92.69 (G) | - | |
| [36] | MHLNN | - | - | 68.37 | - |
| [52] | MHLNN | - | - | 75 (G) | - |
| [32] | Stacked autoencoder (SAE) | 88.9 | 88.4 | 83.8 | Area under the receiver operating characteristic curve (AUC) 0.86.9 |
| SAE | 100 (G) | 100 (G) | 100 (G) | ||
| [47] | Deep belief networks (DBN), (UCD) | 60.36 | 91.71 | 85.26 | Combined objective (CO) 79.1 |
| DBN (AED) | 78.75 | 95.89 | 97.64 | - | |
| [43] * | Convolution neural network (CNN)1D | 87 | 87 | 90.8 | Positive predictive value, |
| [46] * | CNN1D | 96 | 96 | 96 | 0.96 |
| [37] | CNN1D | 97.82 | 99.20 | 98.91 | PPV 99.06%, negative predictive value (NPV) 98.14% |
| [51] | CNN1D | 81.1 | 98.5 | 96.6 | PPV 87%, NPV 97.7% |
| CNN1D (AHI 5) | 100 (G) | 84.6 (G) | 96.2 (G) | PPV 95.1%, NPV 100%, 0.98 (G) | |
| CNN1D (AHI 15) | 98.1 (G) | 86.5 (G) | 92.3 (G) | PPV 87.9%, NPV 97.8%, 0.93 (G) | |
| CNN1D (AHI 30) | 96.2 (G) | 96.2 (G) | 96.2 (G) | PPV 89.3%, NPV 98.7%, 0.93 (G) | |
| [60] | CNN1D | 74.70 | - | 74.70 | PPV 74.50% |
| [53] | CNN1D-3ch | 83.4 | - | 83.5 | PPV 83.4%, 83.4 |
| [59] | CNN1D | 77.6 | - | 77.6 | PPV 77.4%, 77.5 |
| CNN2D | 79.7 | - | 79.8 | PPV 79.8%, 79.7 | |
| [48] | CNN2D | - | 79.6 | - | |
| [33] | Long short-term memory (LSTM), (SpO2) | 92.9 | - | 95.5 | AUC 0.98, PPV 99.2% |
| LSTM (IHR) | 99.4 | - | 89.0 | AUC 0.99%, PPV 82.4% | |
| LSTM (SpO2 + IHR) | 84.7 | - | 92.1 | AUC 0.99%, PPV 99.5% | |
| LSTM (IHR) | 99.4 (G) | ||||
| [34] | LSTM (IHR) | - | - | 100 (G) | 1 (G) |
| [62] | LSTM | - | - | 97.08 | - |
| [35] | FLSTM | 85.5 | 80.1 | 82.1 | - |
| [55] | FLSTM (abdores) | 57.9 | 73.9 | 71.1 | AUC 71.5, PPV 33.0% |
| LSTM (abdores) | 62.3 | 80.3 | 77.2 | AUC 77.5, PPV 39.9% | |
| FLSTM (thorres) | 62.9 | 77.2 | 74.7 | AUC 76.9, PPV 36.8% | |
| LSTM (thorres) | 67.8 | 76.5 | 75 | AUC 79.7, PPV 37.7% | |
| FLSTM (EDR) | 48.8 | 60.8 | 58.7 | AUC 57.6, PPV 21.1% | |
| LSTM (EDR) | 52.1 | 61.8 | 60.1 | AUC 58.8, PPV 22.1% | |
| [45] | LSTM | 98 | 98 | 98.5 | 98.0 |
| Gated recurrent unit (GRU) | 99 | 99 | 99.0 | 99.0 | |
| [49] | Recurrent and convolutional neural networks (RCNN), (MGH) | - | - | 88.2 (G) | - |
| [38] | CNN1D-LSTM- MHLNN | 77.60 (G) | 80.10 (G) | 79.45 (G) | 79.09 (G) |
© 2019 by the authors. Licensee MDPI, Basel, Switzerland. This article is an open access article distributed under the terms and conditions of the Creative Commons Attribution (CC BY) license (http://creativecommons.org/licenses/by/4.0/).
Share and Cite
Mostafa, S.S.; Mendonça, F.; G. Ravelo-García, A.; Morgado-Dias, F. A Systematic Review of Detecting Sleep Apnea Using Deep Learning. Sensors 2019, 19, 4934. https://doi.org/10.3390/s19224934
Mostafa SS, Mendonça F, G. Ravelo-García A, Morgado-Dias F. A Systematic Review of Detecting Sleep Apnea Using Deep Learning. Sensors. 2019; 19(22):4934. https://doi.org/10.3390/s19224934
Chicago/Turabian StyleMostafa, Sheikh Shanawaz, Fábio Mendonça, Antonio G. Ravelo-García, and Fernando Morgado-Dias. 2019. "A Systematic Review of Detecting Sleep Apnea Using Deep Learning" Sensors 19, no. 22: 4934. https://doi.org/10.3390/s19224934
APA StyleMostafa, S. S., Mendonça, F., G. Ravelo-García, A., & Morgado-Dias, F. (2019). A Systematic Review of Detecting Sleep Apnea Using Deep Learning. Sensors, 19(22), 4934. https://doi.org/10.3390/s19224934