Article

Rotating Machinery Fault Diagnosis Based on Improved Multiscale Amplitude-Aware Permutation Entropy and Multiclass Relevance Vector Machine

1
School of Measurement and Communication Engineering, Harbin University of Science and Technology, Harbin 150080, China
2
School of Electrical Engineering and Automation, Harbin Institute of Technology, Harbin 150080, China
*
Authors to whom correspondence should be addressed.
Sensors 2019, 19(20), 4542; https://doi.org/10.3390/s19204542
Submission received: 4 September 2019 / Revised: 4 October 2019 / Accepted: 17 October 2019 / Published: 18 October 2019
(This article belongs to the Special Issue Sensors for Fault Diagnosis)

Abstract

:
The health state of rotating machinery directly affects the overall performance of the mechanical system. The monitoring of the operation condition is very important to reduce the downtime and improve the production efficiency. This paper presents a novel rotating machinery fault diagnosis method based on the improved multiscale amplitude-aware permutation entropy (IMAAPE) and the multiclass relevance vector machine (mRVM) to provide the necessary information for maintenance decisions. Once the fault occurs, the vibration amplitude and frequency of rotating machinery obviously changes and therefore, the vibration signal contains a considerable amount of fault information. In order to effectively extract the fault features from the vibration signals, the intrinsic time-scale decomposition (ITD) was used to highlight the fault characteristics of the vibration signal by extracting the optimum proper rotation (PR) component. Subsequently, the IMAAPE was utilized to realize the fault feature extraction from the PR component. In the IMAAPE algorithm, the coarse-graining procedures in the multi-scale analysis were improved and the stability of fault feature extraction was promoted. The coarse-grained time series of vibration signals at different time scales were firstly obtained, and the sensitivity of the amplitude-aware permutation entropy (AAPE) to signal amplitude and frequency was adopted to realize the fault feature extraction of coarse-grained time series. The multi-classifier based on the mRVM was established by the fault feature set to identify the fault type and analyze the fault severity of rotating machinery. In order to demonstrate the effectiveness and feasibility of the proposed method, the experimental datasets of the rolling bearing and gearbox were used to verify the proposed fault diagnosis method respectively. The experimental results show that the proposed method can be applied to the fault type identification and the fault severity analysis of rotating machinery with high accuracy.

1. Introduction

Rotating machinery is one of the most common mechanical equipment, which plays an important role in industrial applications. It generally operates under tough working environments, which can eventually result in mechanical breakdown that lead to high maintenance costs, severe financial losses, and safety concerns [1,2]. As rotating machinery is the most malfunctioning part of a mechanical system, the fault diagnosis of rotating machinery has been a popular research topic in the industry. At present, there are many different theoretical methods to solve the fault diagnosis of rotating machinery, including a vibration signal analysis, acoustic emission, thermal imaging and multi-sensor fusion, etc [3]. In the condition monitoring and fault diagnosis technology of rotating machinery, the fault diagnosis technology based on vibration signals is widely used because of the close correlation between the vibration signal and mechanical structure [4,5].
The vibration signal is widely used in fault diagnosis of rotating machinery because it is easy to collect and monitor online. For example, when there is a local fault in the running process of the rolling bearing, each contact causes an instantaneous shock and stimulates the rolling bearing to conduct high-frequency free vibration attenuation according to its inherent frequency. The instantaneous impact caused by the failure has obvious periodicity, the impact frequency depends on the bearing speed, and the impact amplitude depends on the bearing fault size. Therefore, the impact characteristics caused by local damage should be extracted by signal analysis technology and then, fault identification should be conducted by the artificial classifier.
As rotating machinery works in the industrial environment, its vibration signal often contains the inherent vibration signal of rotating machinery, the fault impact signal and background noise. The vibration signals collected by the accelerometers have the characteristics of non-linearity, non-stationarity and impact [6]. Therefore, how to effectively extract fault signal characteristics from complex vibration signals and accurately identify these fault features are the key problems in the fault diagnosis of rotating machinery. Pattern recognition is one of the important methods to realize the vibration signal analysis of rotating machinery. Many scholars have made achievements in this field. Jiang et al. [7] decomposed the vibration signal by ensemble local characteristic-scale decomposition (ELCD) and obtained a series of intrinsic scale components (ISCs). The principle ISCs were selected and the permutation entropy (PE) values of these ISCs were calculated to construct the feature vector. Finally, the fault type of the rolling bearing is identified by the relevance vector machine (RVM) constructed by the feature vector set. Li et al. [8] proposed a rolling bearing fault diagnosis method based on multiscale permutation entropy (MPE) and improved the support vector machine based on the binary tree (ISVM-BT). Local mean decomposition (LMD) was utilized to decompose the vibration signal of the rolling bearing into a set of product functions (PFs), and the MPE extracted the fault features of the rolling bearing from PFs. The ISVM-BT established by a feature set effectively identified the fault type automatically. Chen et al. [9] presented an integrated fault diagnosis method for a gearbox using complementary ensemble empirical mode decomposition (CEEMD), sample entropy (SampEn) and a probabilistic neural network (PNN). CEEMD decomposed the vibration signal of the gearbox into a set of intrinsic mode functions (IMFs). The fault features were extracted by SampEn from each IMF. Then, the PNN was used as the classifier to identify the fault type of the gearbox.
Due to the nonlinearity and non-stationarity of the vibration signals of rotating machinery a time-frequency analysis method is often used to solve the problem of feature extraction of the vibration signals of rotating machinery. The fast Fourier transform (FFT) is a classical time-frequency analysis method, but it is only suitable for solving the problem of stationary signal analysis. The wavelet transform (WT) is also a classical time-frequency analysis method that can preset the time and frequency window of interest. However, the WT is not an adaptive signal decomposition method, and it requires the kernel function and its parameters to be set in advance. The wavelet packet transform (WPT) can select the frequency resolution and the WPT is more flexible than the WT. However, the WPT is still not an adaptive time-frequency analysis method. The empirical mode decomposition (EMD) is a self-adaptive time-frequency method that can adaptively decompose the vibration signal into a set of intrinsic mode functions (IMFs) that contain the amplitude and frequency characteristics. However, the EMD has the end effect and mode mixing problem in that the stability of the IMFs is poor, which affects the subsequent feature extraction process. In order to solve the problems existing in EMD, EEMD and a complete ensemble empirical mode decomposition (CEEMD) are proposed [6].
In recent years, due to the fact that fault information contained in the vibration signals can be extracted more effectively at different time scales, a large number of scholars have applied a multiscale entropy (MSE) algorithm and its variants to fault feature extraction of rotating machinery [10,11]. In addition to the MSE algorithm [12], some scholars proposed many fault feature extraction methods of the vibration signal based on the multiscale permutation entropy (MPE) [13,14,15] and multiscale fuzzy entropy (MFE) [16,
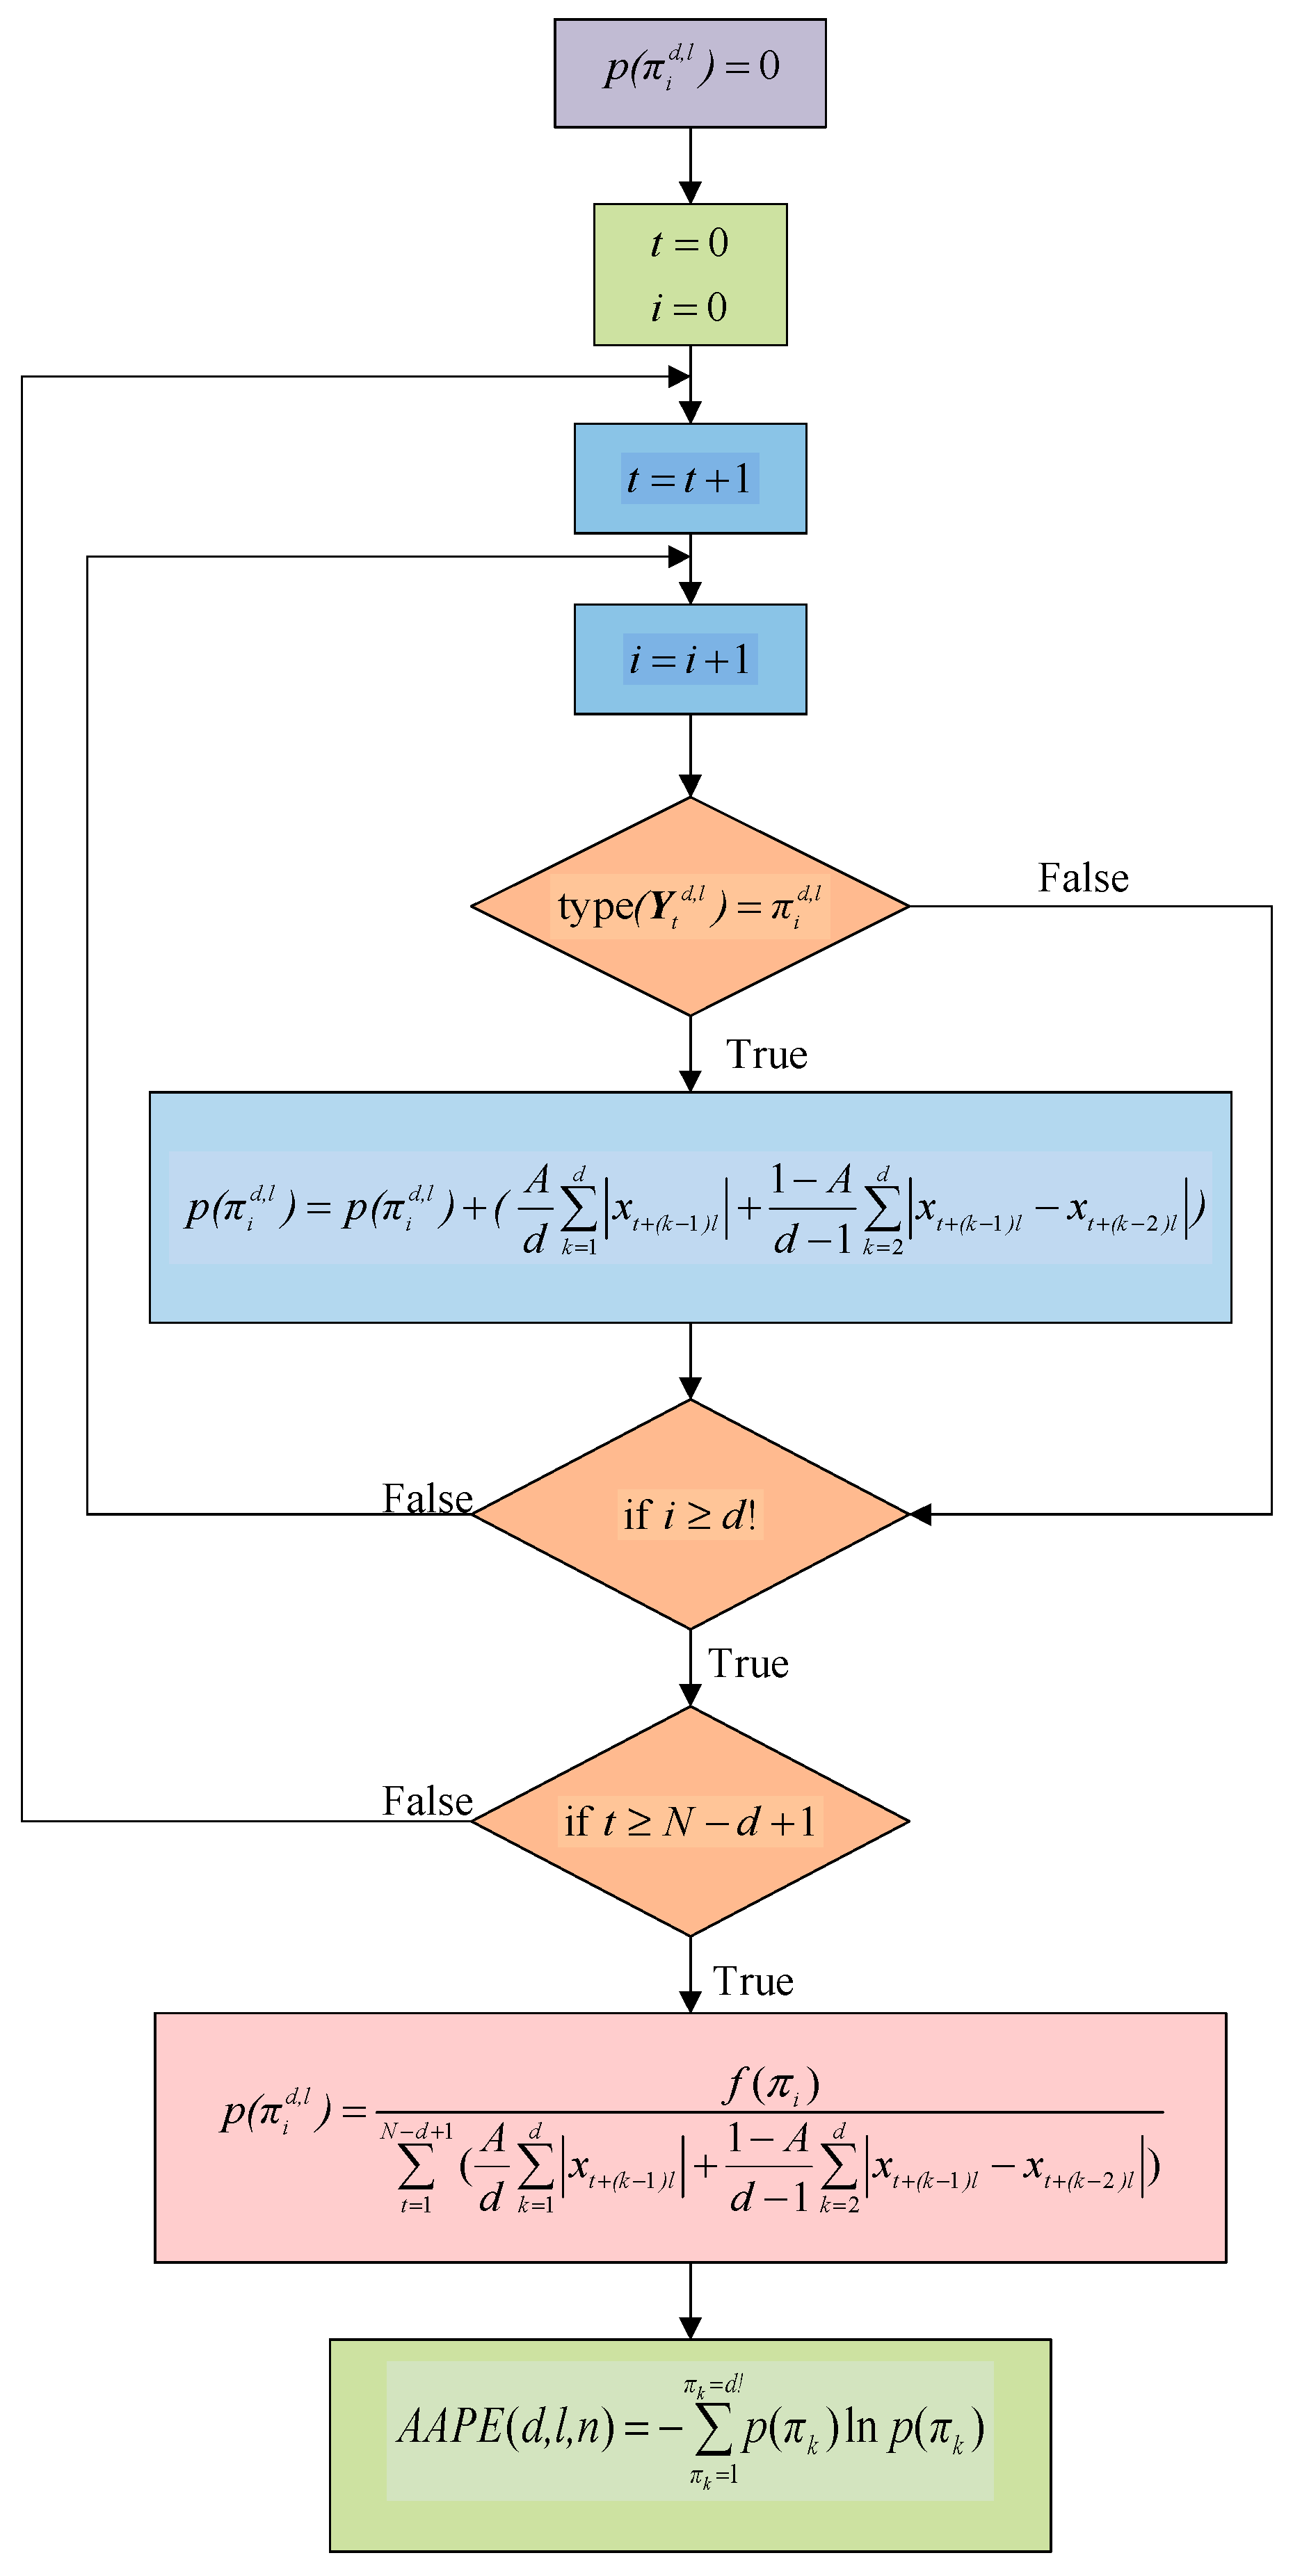
17]. However, the commonly used entropy theoretical methods still have some limitations. The poor stability of the approximate entropy (ApEn) results leads to its excessive dependence on the length of the time series. The calculation efficiency of the sample entropy (SampEn) is low, which is not suitable for analyzing long time series. When calculating the PE value of the time series, the PE algorithm does not consider the average amplitude of the time series. The different signals with significantly different mean amplitudes may be counted in the same order. Moreover, if there are elements with the same amplitude in the time series, the results calculated by the PE will be random. At present, the performance of the fault feature extraction method based on entropy theory needs to be improved. In order to solve the above problems, the amplitude-aware permutation entropy (AAPE) was proposed by Azami and Escudero [
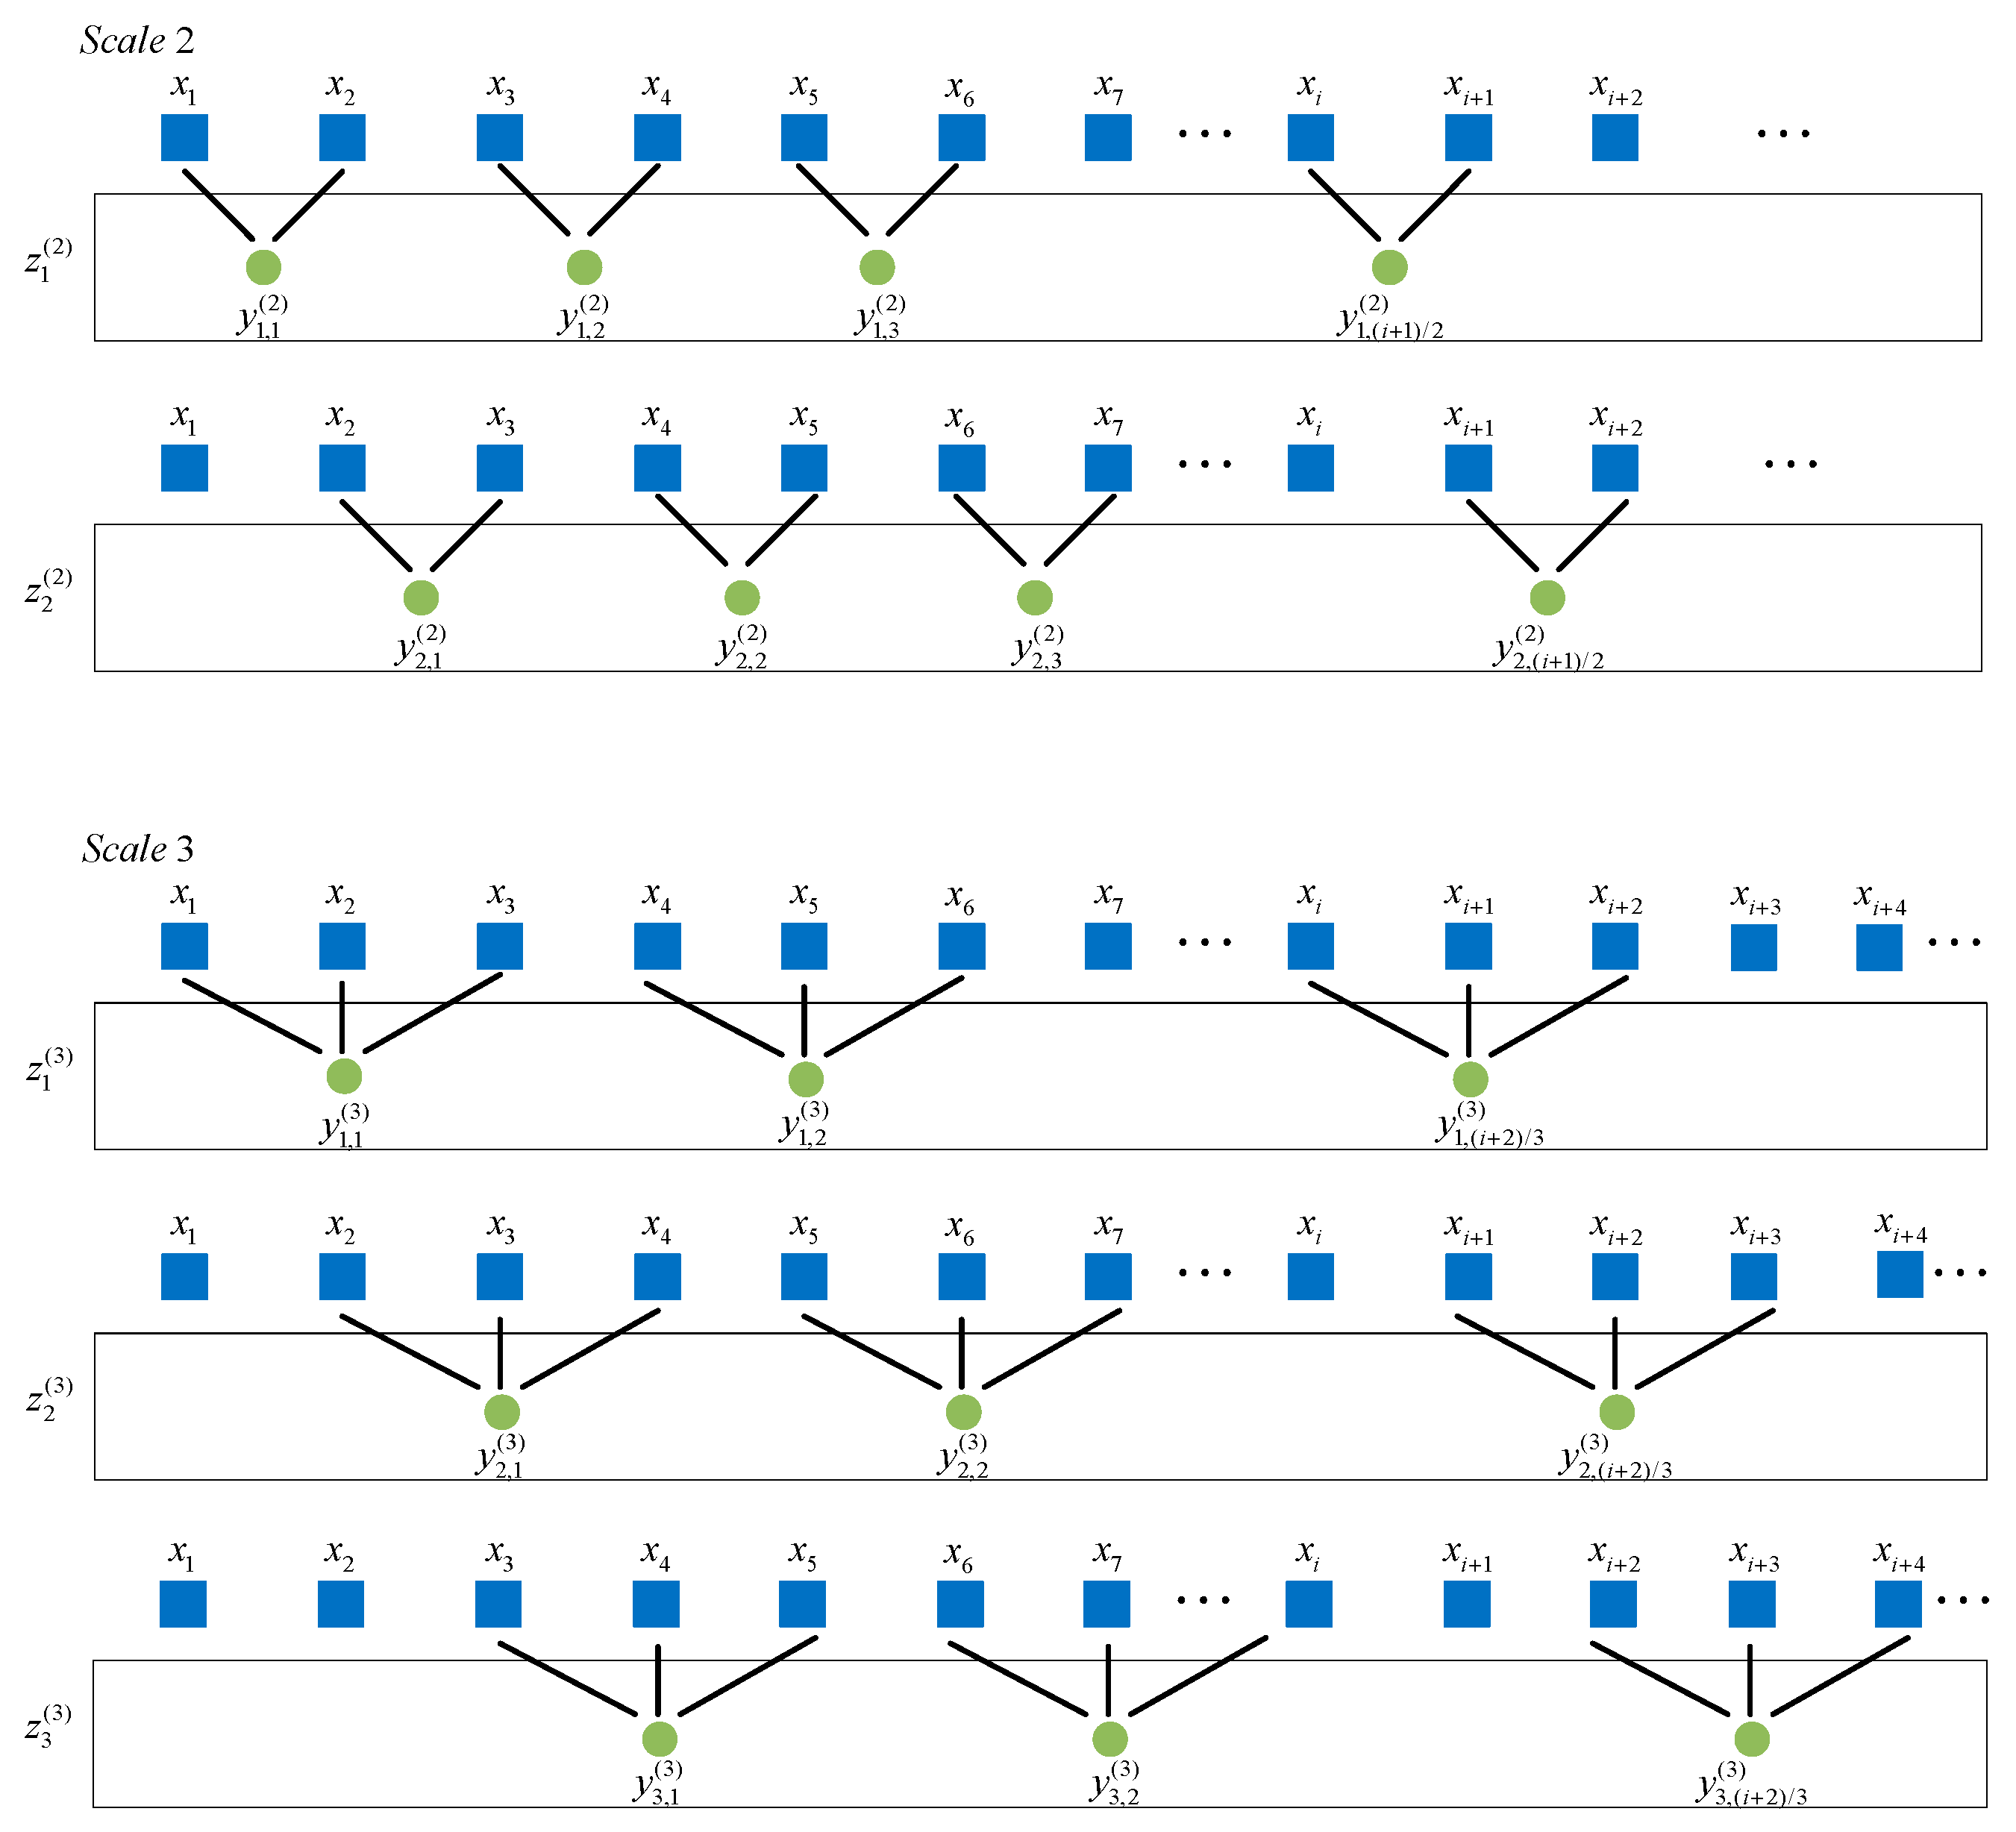
18] to improve the classical PE. The AAPE is sensitive to the changes in the amplitude, in addition to the frequency that can highlight the fault information contained in the vibration signal more effectively than the PE. In the coarse-graining procedures of the MSE and MPE, the length of the coarse-grained time series decreases with the increase of the scale factor. Therefore, when the scale factor is large, the entropy value of the coarse-grained time series is unstable. The literature [19] improved the coarse-graining procedure of MSE by making the computation stable and reliable in the case of a large time scale through the sliding averaging process, so as to solve the shortcomings of the traditional MSE.
After the fault features are extracted from the vibration signals of rotating machinery, a high performance classifier is needed to identify the fault types and fault severity. Many artificial intelligence techniques have been adopted to realize the fault diagnosis of rotating machinery, such as the artificial neural network (ANN) [20], support vector machine (SVM) [21], random forest (RF) [22]. The structure of the ANN is usually set by experience and its recognition rate is related to the number of training samples. Although the SVM can realize classification with high accuracy under the dichotomist condition of small training samples, the SVM requires multiple dichotomers to realize multiple classifications and further, the selection of the kernel function directly affects the classification accuracy. It is difficult for the random forest classifier to obtain the most ideal parameters, and the selection of parameters has a great impact on the recognition results. The relevance vector machine (RVM) [
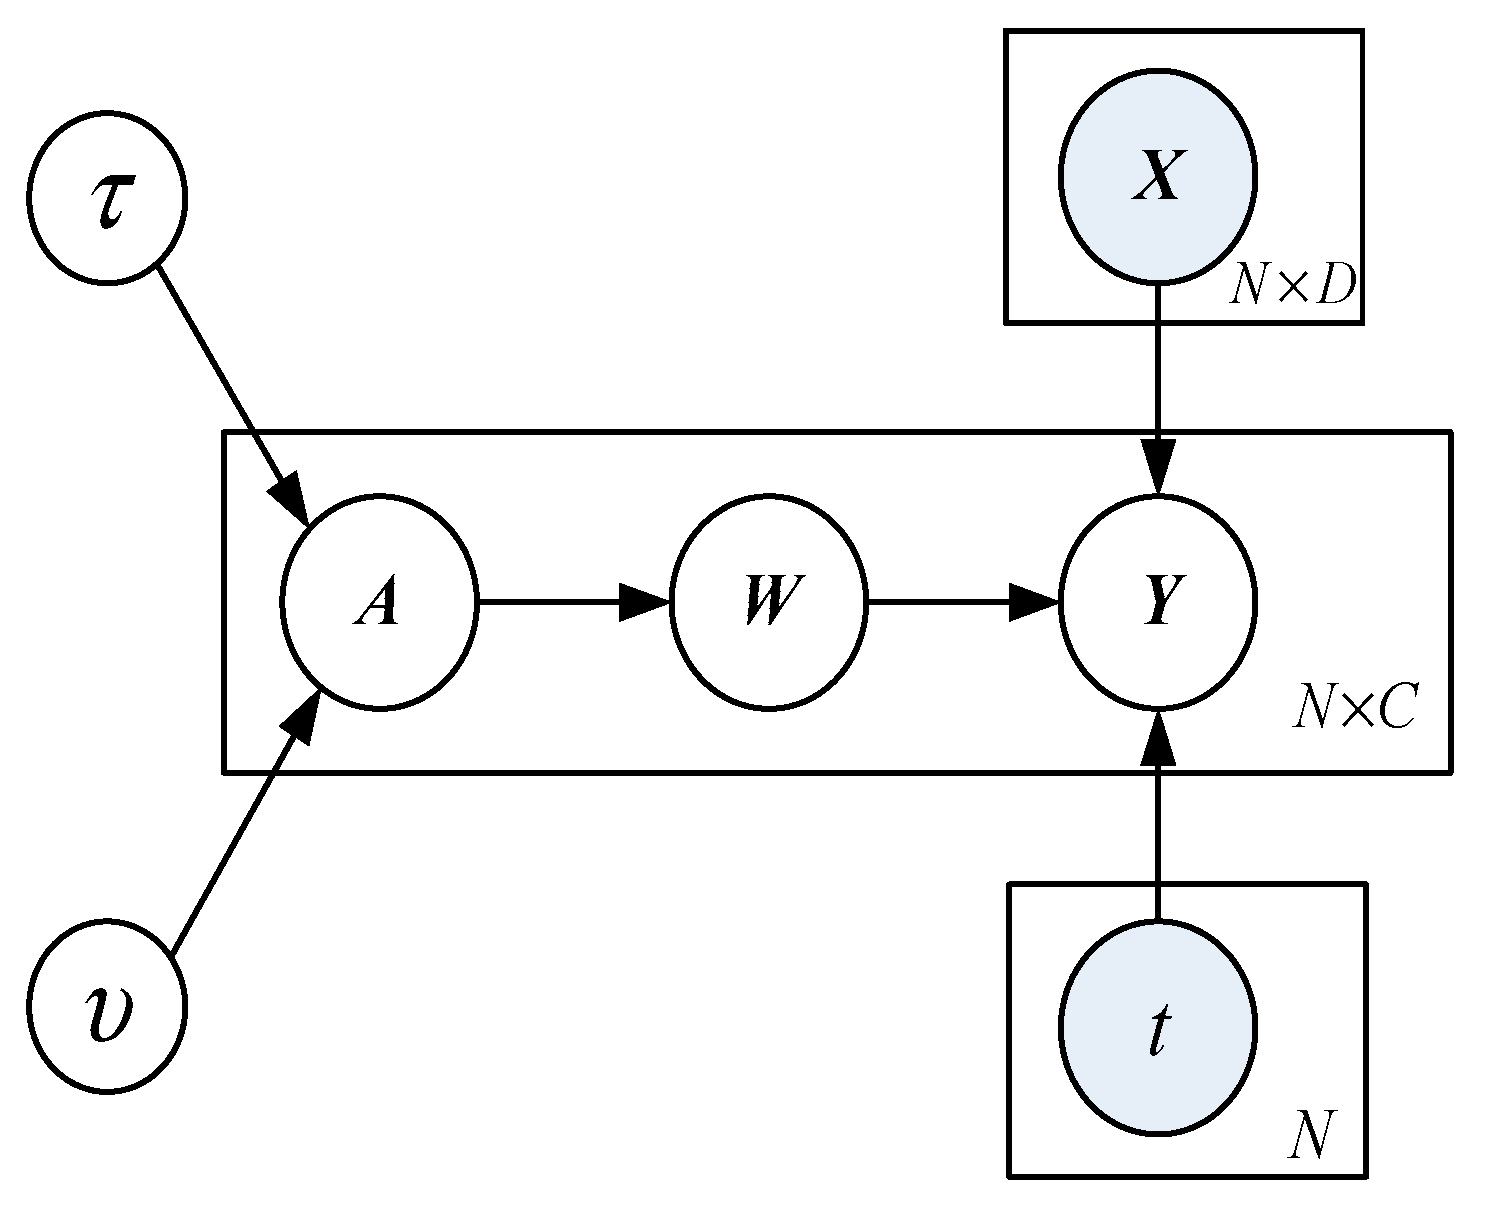
7] is more sparse than the SVM, more suitable for online monitoring, and its generalization ability is better than the SVM. However, like the SVM, the RVM is a binary classifier and cannot directly implement multiple classifications. The multiclass relevance vector machine (mRVM) [23] is an extended algorithm that can directly classify the input samples into multiple categories and output the probabilities belonging to each category. The unique properties of the mRVM are suitable for the multi-fault identification of rotating machinery fault diagnosis [6,24].
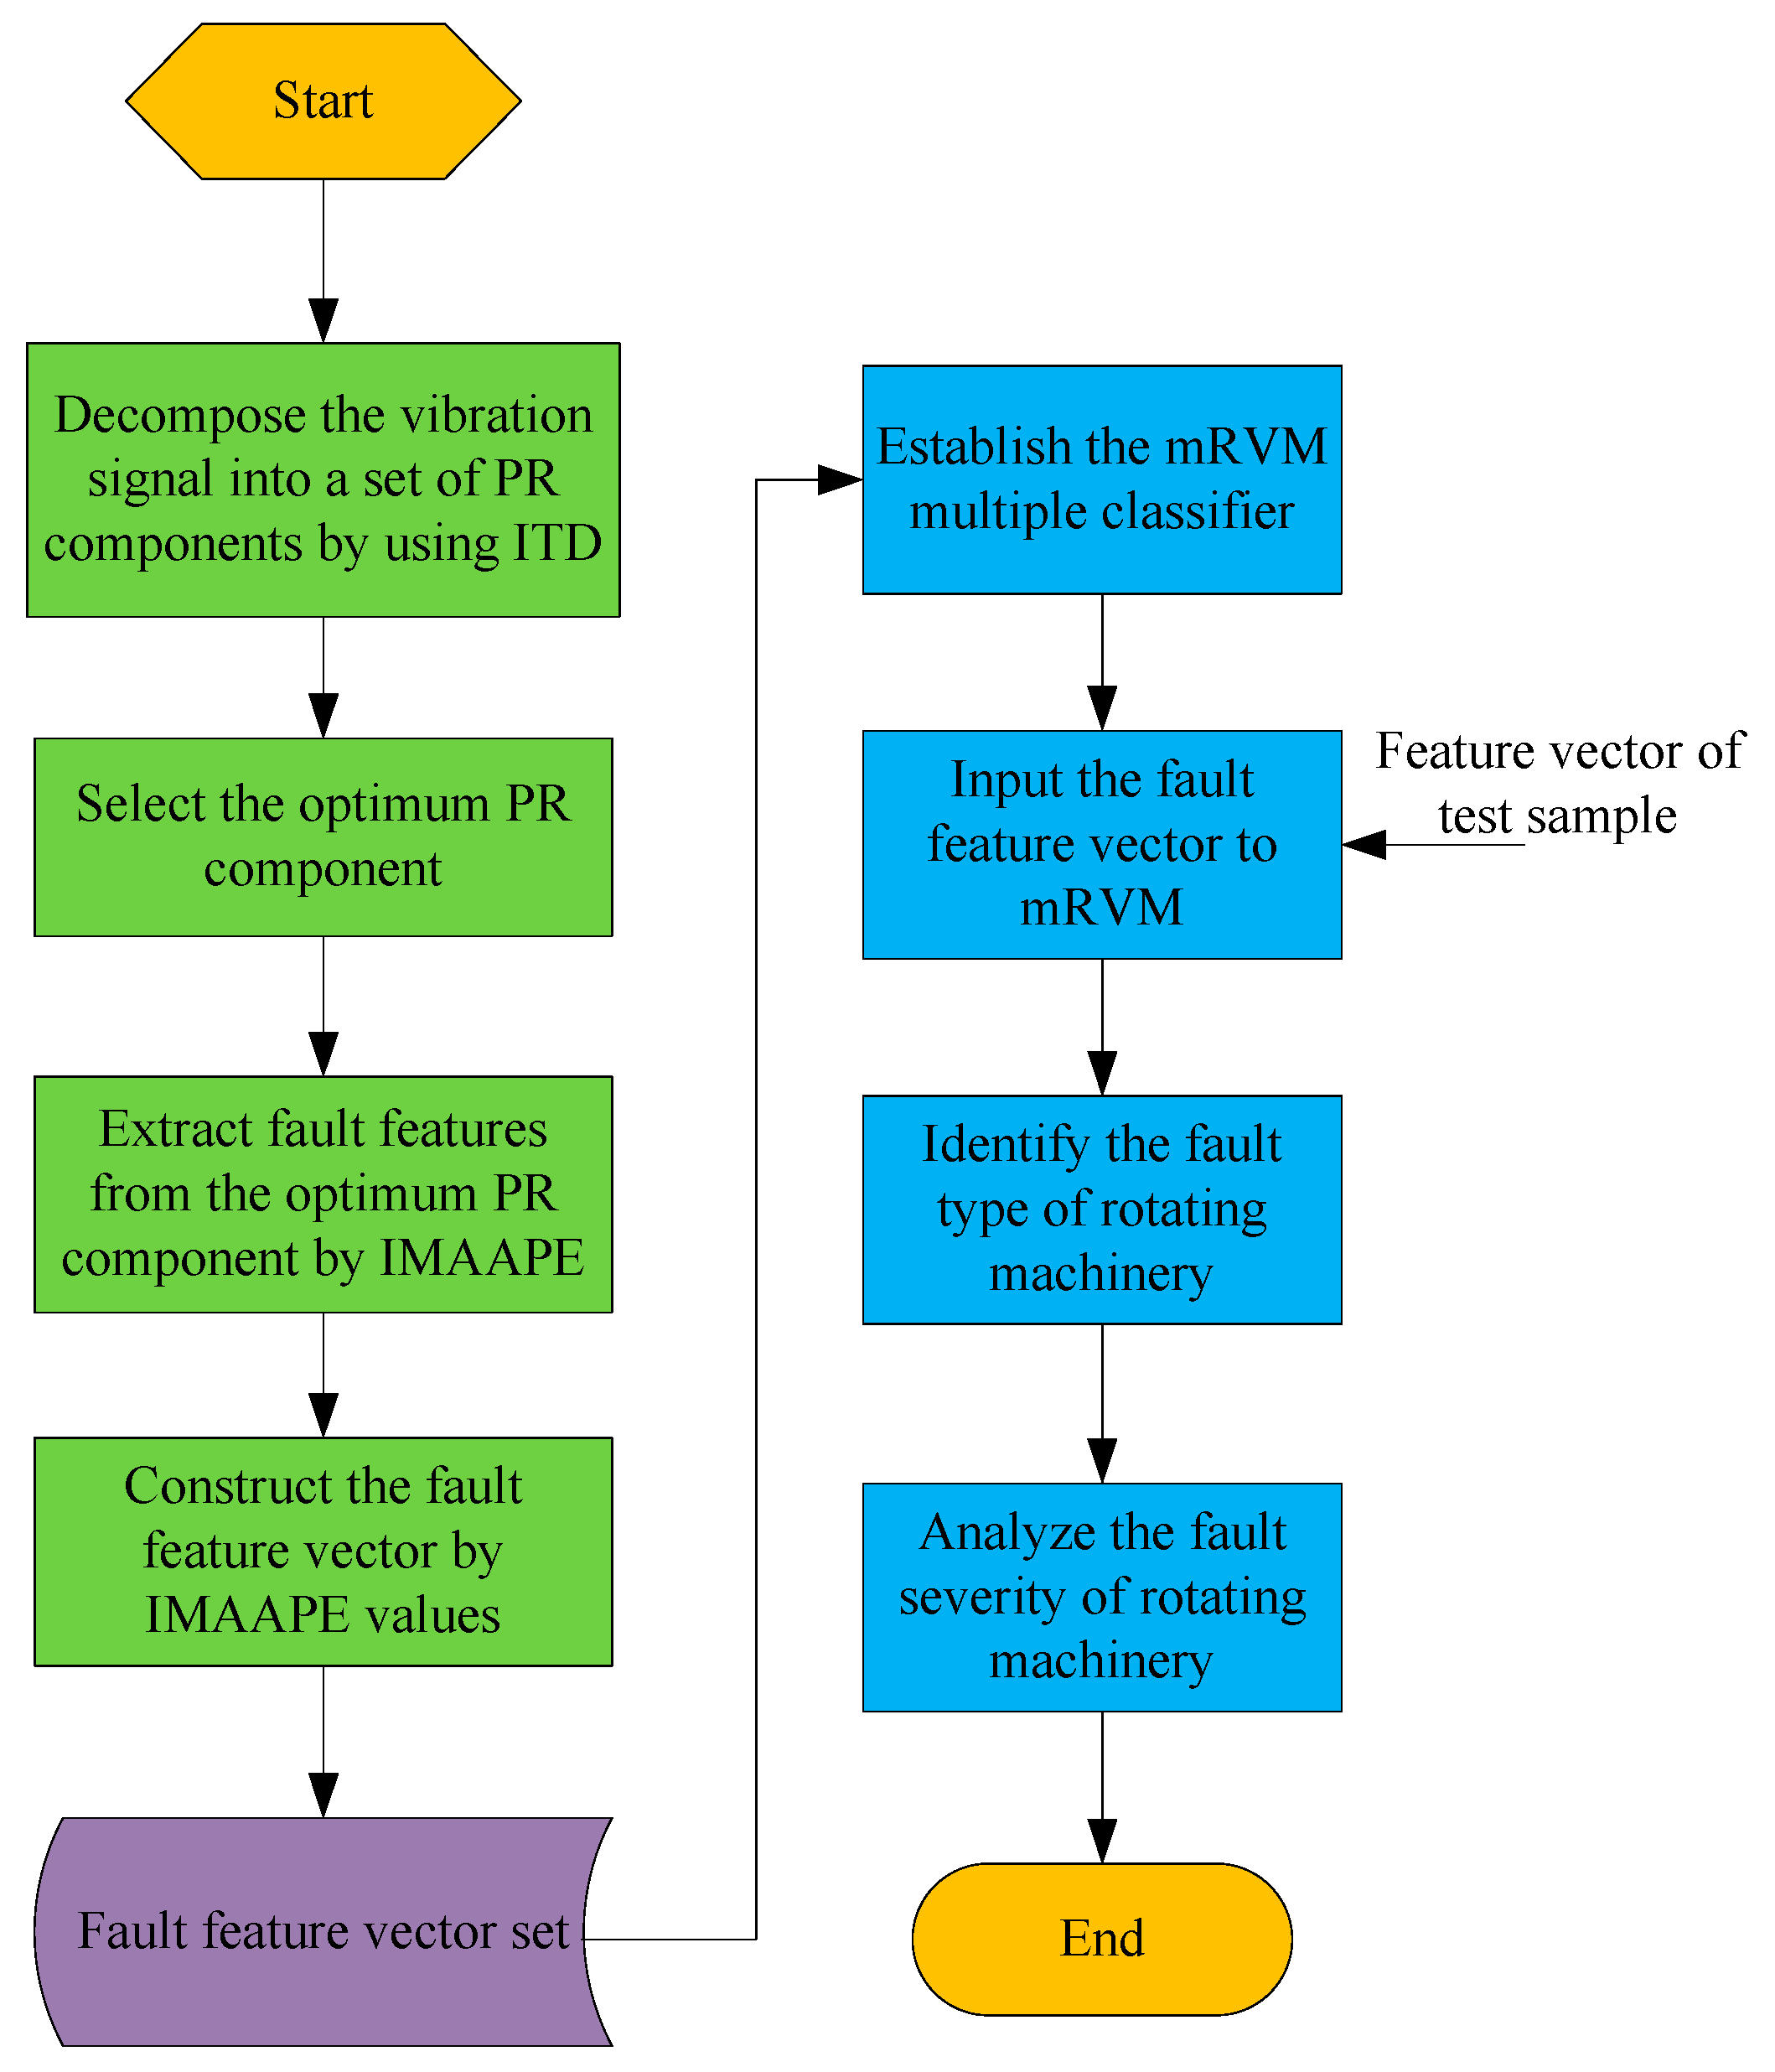
In view of the above problems in fault diagnosis of rotating machinery based on the pattern recognition method, this paper presents a novel fault diagnosis method based on the improved multiscale amplitude-aware permutation entropy (IMAAPE) and the mRVM for rotating machinery. The main contributions of this paper are summarized as follows:
(1) As the AAPE is very sensitive to the amplitude change of the vibration signal, the vibration of rotating machinery needs to be pre-processed before the feature extraction to minimize the interference of external noise to the vibration signal. The intrinsic time-scale decomposition (ITD) was used to decompose the vibration signal of rotating machinery into a group of proper rotation components stably, among which the optimum PR component can highlight the main time-frequency characteristics of the vibration signal so as to facilitate the subsequent fault feature extraction.
(2) The performance of the AAPE improved. A fault feature extraction method of rotating machinery based on the IMAAPE is proposed for the first time. The IMAAPE improves the coarse-graining procedure in a multiscale analysis and adopts the characteristics of the AAPE sensitive to the amplitude and frequency changes of the vibration signal. The IMAAPE can calculate the AAPE values in different time scales and construct the feature vectors, which can effectively describe the fault features contained in the vibration signals of rotating machinery.
(3) The mRVM multi-classifier is trained to realize fault identification and fault severity analysis of rotating machinery. In this paper, two different realization methods of the mRVM and the effect of parameter selection on the identification accuracy of rotating machinery fault types are discussed by comparing experiments.
The organization of the rest of this paper is as follows. Section 2 introduces the theoretical basis of the methodologies adopted in this paper. The proposed fault diagnosis method is described in Section 3. 
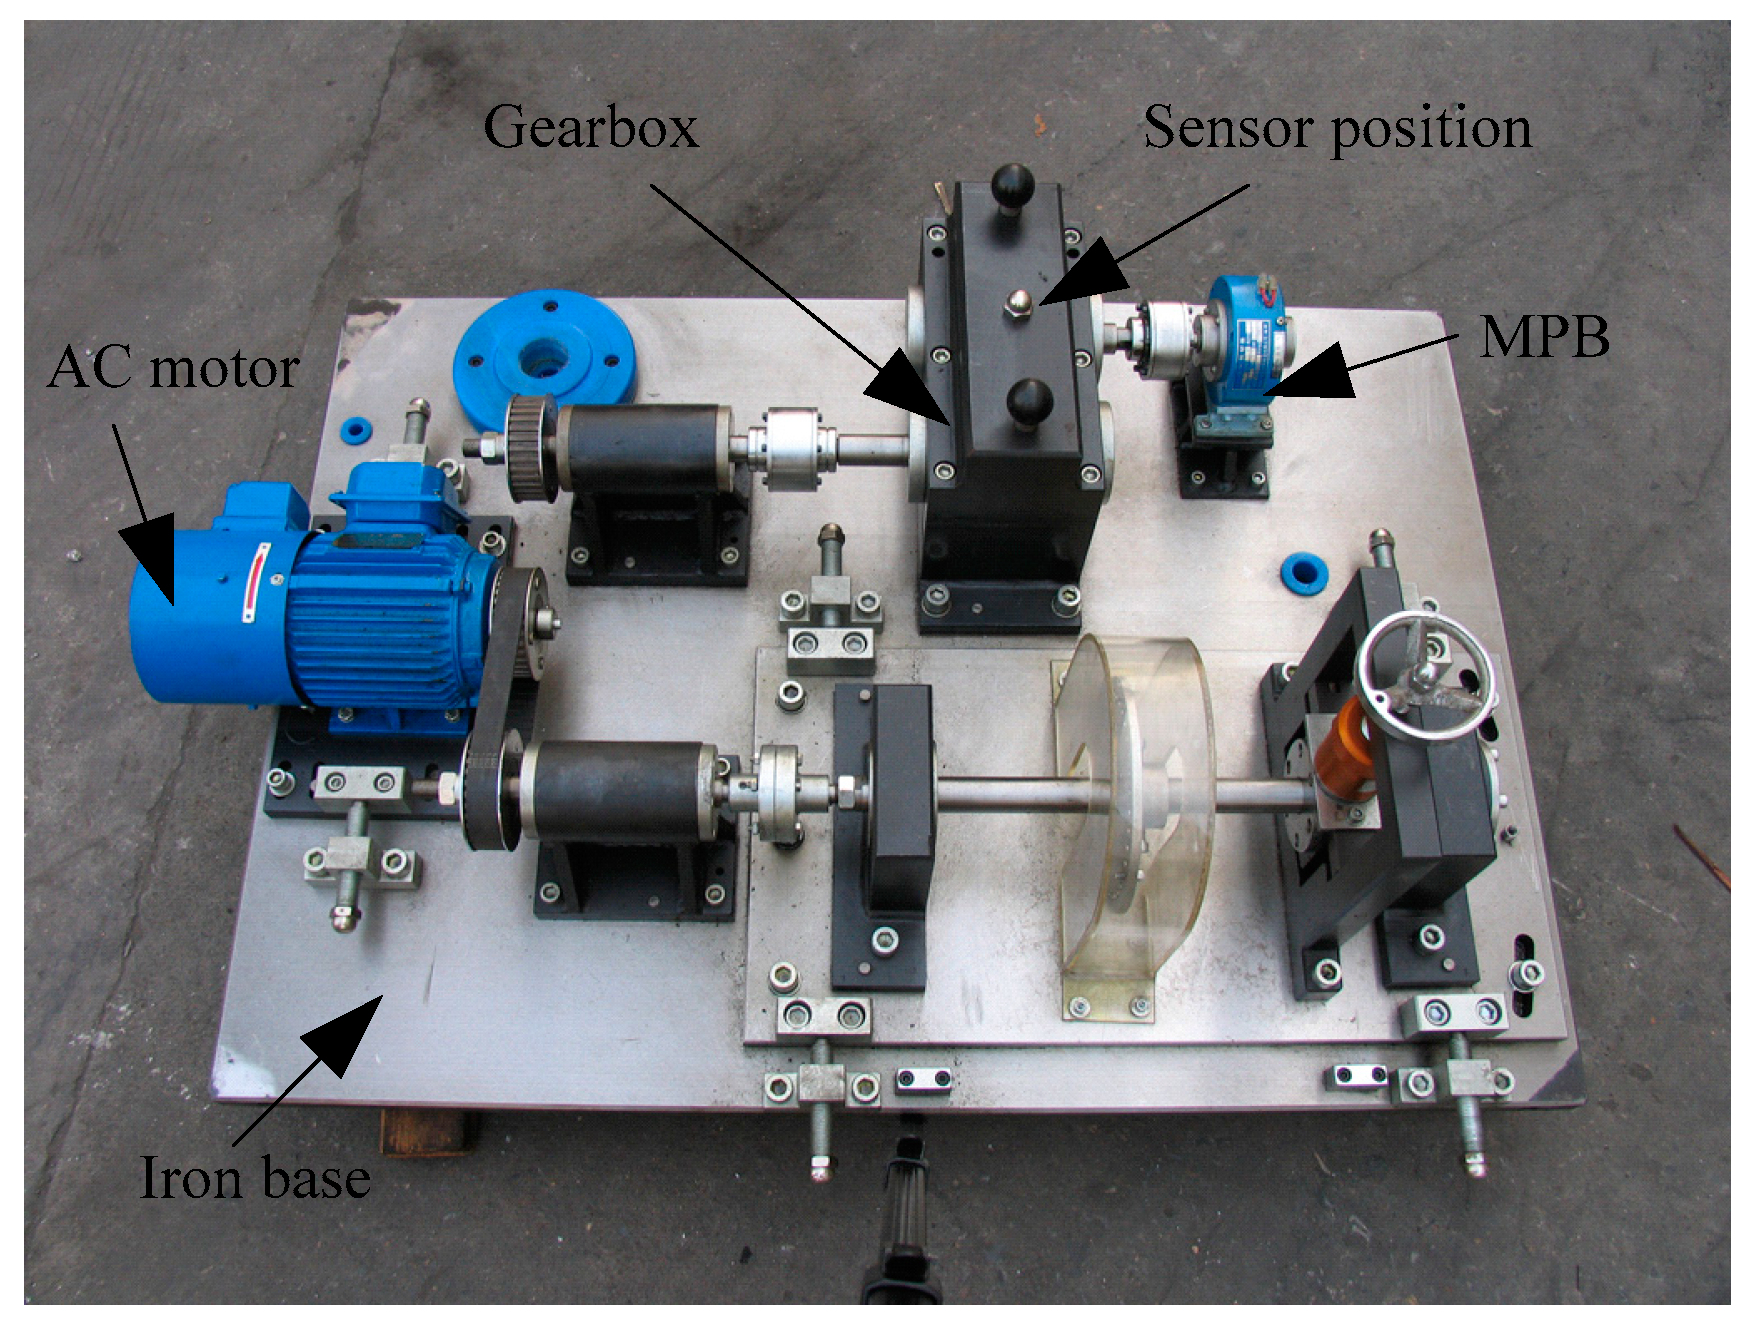
Section 4 verifies the feasibility and effectiveness of the proposed fault diagnosis method by rolling bearing experiments and gearbox experiments, respectively. Finally, conclusions are drawn in Section 5.

2. Methodologies

2.1. Instrinsic Time-Scale Decomposition

The ITD is an algorithm for the efficient and precise time-frequency-energy (TFE) analysis of signals. The ITD can decompose a complex time series into a series of proper rotation (PR) components and accurately extract the intrinsic instantaneous amplitude, frequency information and other morphological characteristics of the complex time series, which is suitable for the analysis of non-stationary and nonlinear signals [25].
Let X t be the complex time series to be analyzed and define as the baseline extraction factor. can extract the baseline signal L t = X t from X t , then X t can be decomposed into:
X t = X t + ( 1 ) X t = L t + H t
where L t is the baseline signal, and H t is the PR component.
The main steps of the ITD algorithm are as follows:
Assuming that { τ k , k = 1 , 2 , } represents the local extrema of signal X t , the default τ 0 = 0 . L t and H t are defined in the interval [ 0 , τ k ] , and X t is valid in the interval t [ 0 , τ k + 2 ] . In the successive extrema interval ( τ k , τ k + 1 ] , the extracted baseline signal L t is expressed as:
X t = L t = L k + ( L k + 1 L k X k + 1 X k ) ( X t X k ) , t ( τ k , τ k + 1 ]
in which:
L k + 1 = α [ X k + ( τ k + 1 τ k τ k + 2 τ k ) ( X k + 2 X k ) ] + ( 1 α ) X k + 1
where α is a linear scaling factor used to adjust the amplitude of the extracted PR component, α [ 0 , 1 ] [25].
According to Equation (2) and Equation (3), the PR component H t can be expressed as:
X t ( 1 ) X t = H t = X t L t
where is proper rotation extraction operator.
The baseline signal L t can be taken as the input signal of the next decomposition and the above steps can be repeated to obtain a series of PR components. The termination condition of decomposition is that the baseline signal L t becomes monotonous or less than a certain preset value.
After the ITD, the time series X t is decomposed into a series of PR components and a monotone trend component. The kurtosis value of the signal can effectively describe the pulse characteristic of the signal. The higher the kurtosis value, the richer the impact features contained in the signal. Therefore, the PR component with the maximum kurtosis value is defined as the optimum PR component and its calculation process is expressed as follows:
K i = 1 n k = 1 n P R i k 4
U i = K i i = 1 m K i
where K i represents the kurtosis value of the ith PR component and n represents the length of the time series. U i is the normalized kurtosis value of the ith PR component and m is the number of PR components. The optimum proper rotation component selects the PR component corresponding to the maximum value of U i .

2.2. Multiscale Entropy

The entropy analysis of the time series from a single scale may lose some important information of the original signal. The multiscale entropy (MSE) was proposed by Costa M. to represent the complexity of a signal. The MSE relies on the computation of the sample entropy over a range of scales to extract the characteristic information of the complex signal in different time scales [26]. The MSE algorithm is composed of two steps:
(1) The coarse-graining procedure derives a set of time series representing the system dynamics on different time scales. The coarse-graining procedure for scale i is obtained by averaging the samples of the time series inside the consecutive but non overlapping windows of length i . For a monovariate discrete signal of { X i } = { x 1 , x 2 , , x N } , the coarse-grained time series can be computed as:
y j τ = 1 τ i = ( j 1 ) τ + 1 j τ x i , 1 j N τ
where y j τ represents the new-time series obtained after the coarse-graining procedure when the scale factor is τ . The length of the coarse-grained time series { y τ } is N / τ .
(2) Then, the sample entropy of each coarse-grained time series is calculated and n sample entropy values of different time scales are obtained to describe the signal characteristics of the original time series.

2.3. Amplitude-Aware Permutation Entropy

Bandt put forward the concept of basic permutation entropy in 2002 [27]. At present, the PE is widely used in the analysis of complex time series signals to measure the complexity of a nonlinear and non-stationary signal. The calculation process of the PE is as follows:
Assume the given time series x = { x 1 , x 2 , , x N } with length N , and for each time point t , embed the signal x in a d-dimensional space to obtain the reconstruction vectors X t d , l = { x t , x t + l , , x t + ( d 2 ) l , x t + ( d 1 ) l } , t = 1 , 2 , , N ( d 1 ) l , where d and l denote the embedding dimension and the time delay, respectively. Each vector X t d , l is arranged in an increasing order as { x t + ( j 1 1 ) l , x t + ( j 2 1 ) l , , x t + ( j d 1 2 ) l , x t + ( j d 1 ) l } , where j * is the index of the element in the reconstruction vector. Therefore, when the embedding dimension is d , there are d ! potential ordinal pattern and the ith permutation is called as π i . For each π i , p ( π i ) represents the occurrence probability as follows:
p ( π i ) = f ( π i ) N d + 1
where f ( π i ) is the function that counts the number of occurrences of π i . Whenever the inner elements of X t d , l are arranged in order of π i , f ( π i ) increases by 1. The definition of the PE is as follows:
P E ( x , d , l ) = π i = 1 π i = d ! p ( π i ) ln p ( π i )
However, there are two main problems in describing the complex time series by the PE. First, the traditional PE only considers the ordinal structure of a time series, but ignores the amplitude information of the corresponding elements in the time series. Second, the effect of the elements with equal amplitude on the PE value in the time series is not clearly explained. In view of these, Azami and Escudero proposed the amplitude-aware permutation entropy (AAPE) to improve the sensitivity of the PE to the amplitude and frequency of the time series. The flow chart of the AAPE algorithm is shown in Figure 1 [18].
Assuming that the initial value of p ( π i d , l ) is 0, for the time series X t d , l , when t gradually increases from 1 to N d + 1 , p ( π i d , l ) should be updated whenever π i d , l appears.
p ( π i d , l ) = p ( π i d , l ) + ( A d k = 1 d | x t + ( k 1 ) l | + 1 A d 1 k = 2 d | x t + ( k 1 ) l x t + ( k 2 ) l | )
where A [ 0 , 1 ] is the adjustment coefficient to adjust the weight of the signal amplitude mean and the deviation between the amplitudes. Therefore, the probability of p ( π i d , l ) appearing in the whole time series is π i d , l .
p ( π i d , l ) t = 1 N d + 1 ( A d k = 1 d | x t + ( k 1 ) l | + 1 A d 1 k = 2 d | x t + ( k 1 ) l x t + ( k 2 ) l | )
The AAPE calculation of the time series can be expressed as follows:
A A P E ( d , l , n ) = π k = 1 π k = d ! p ( π k ) ln p ( π k )

2.4. Multiclass Relevance Vector Machine

The traditional RVM is a binary classifier which cannot directly solve the multi-classification problem. The multiclass relevance vector machine (mRVM) effectively solves the multi-classification application problem of the traditional RVM. The basic principle of the mRVM is described below.
The input training data sample set is denoted as T = { x i , t i } i = 1 N , where x i R D is D dimensional input vector and t { 1 , 2 , , C } is the corresponding category tag. The kernel function is set as K R N × N , the auxiliary variable Y R C × N is introduced as the target of weight parameter w T K , and obtain:
y c n | w c , k n ~ N y c n ( w c T k n , 1 )
The continuous nature of Y allows, not only multiple class discrimination by the multinomial probit link t n = i   if   y n i > y n j   j i , but also a probabilistic output for class membership via the multinomial probit likelihood function,
P ( t n = i | w , k n ) = ε p ( u ) { j i Φ ( u + ( w i w j ) Τ k n ) }
where ε is the expectation of the standard normal distribution p ( u ) ~ N ( 0 , 1 ) and Φ is the Gaussian cumulative distribution function.
In order to ensure the sparsity of the mRVM, similar to the RVM, a normal prior distribution with mean value of 0 and variance of α n c 1 is introduced for weight parameter w . α n c belongs to the prior parameter matrix A R N × C and obeys the Gamma distribution of parameters τ , υ . τ , υ ( < 1 0 5 ) can guarantee the sparsity of mRVM.
P ( w | Y ) P ( Y | w ) P ( w | A ) c = 1 C N ( ( K K T + A c ) 1 K y c Τ , ( K K Τ + A c ) ) 1
The regressors w closed-form posterior can be derived based on Figure 2. In Equation (15), A c is a diagonal matrix derived from the c column of A which expresses the scales α i c across samples. Then, through the maximum posterior probability estimation, the equation can be obtained as:
w ^ = arg max w P ( w | Y , A , K )
When category i is given, the update method based on weight parameters is as follows:
w ^ c = ( K K Τ + A c ) 1 K y c Τ
For a certain category, the posterior expectation of auxiliary variables is:
y ˜ i n = w ^ i T k n ( j i y ˜ i n w ^ i T k n )
For c i ,
y ˜ c n w ^ c T k n ε p ( u ) { N u ( w ^ c T k n w ^ i T k n , 1 ) Φ u n , i , c } ε p ( u ) { Φ ( u + w ^ i T k n w ^ c T k n ) Φ u n , i , c }
and for the i th class:
y ˜ i n w ^ i T k n ( j i y ˜ j n w ^ j T k n )
where the “tilde” symbol above y denotes the expected value and Φ is a normalized cumulative distribution function, Φ u n , i , c = j i , c Φ ( u + w ^ i T k n w ^ j T k n ) .
The posterior probability distribution of the prior parameters of the weight vector is:
P ( A | w ) P ( w | A ) P ( A | τ , υ ) c = 1 C n = 1 N G ( τ + 1 2 , w n c 2 + 2 υ 2 )
Psorakis proposed two training methods of the mRVM in the literature [23] and the difference between them lies in the different nuclear operation modes at the training stage. The mRVM1 follows the construction process, starting with an empty sample set, gradually adding samples according to their contribution to the method, or deleting samples with a low contribution to the method. The mRVM1 has two convergence principles: conv1 and conv2. The mRVM1_conv1 follows the principle described by [28]. The mRVM1_conv2 adds the limit of the minimum number of iterations to the mRVM1_conv1. The mRVM2 follows a top-down process, first loading the entire training sample set and then removing the unnecessary samples during the training process. The mRVM2 has two convergence principles: convA and convN. For the mRVM2_convA principle, | log A ( k ) log A ( k 1 ) | < ς indicates the iterative convergence. For the mRVM2_convN, the number of iterations is limited to λ N t r a i n .

3. The Proposed Fault Diagnosis Method

The main process of the proposed fault diagnosis method of rotating machinery includes signal preprocessing, fault feature extraction and fault identification. The principle of the fault diagnosis method proposed in this paper is introduced below.

3.1. Signal Preprocessing

Due to the fault of rotating machinery, the vibration signal has impact characteristics and the impact amplitudes are obviously different with different fault severity. In order to reduce the influence of external interference on the vibration signals and highlight the fault features of the vibration signals, it is necessary to preprocess the vibration signals before the feature extraction.
Although different from the time-frequency analysis method such as the EMD, EEMD and LMD, the ITD is used to highlight the major amplitude variations in the vibration signals. The ITD algorithm is adopted to decompose the vibration signal into a sum of proper rotation components, for which instantaneous frequency and amplitude, as well as a monotonic trend, are well defined. The ITD can effectively suppress the mode mixing and end effect. The optimum proper rotation component is selected for further fault feature extraction because it contains the most obvious fault features. The calculation process of signal preprocessing based on the ITD can be referred to Section 2.1.

3.2. Feature Extraction

In order to effectively extract fault features of the vibration signals, an improved multi-scale amplitude-aware permutation entropy (IMAAPE) algorithm is proposed in this paper. This method improves the coarse-graining procedures in a multi-scale analysis and improves the stability of the fault feature extraction. In the classical MSE algorithm, when the scale factor τ is high, the number of elements in the coarse-grained time series decreases, which leads to instability of the entropy measure. In order to solve the problem of shortening the length of the time series after the MSE coarse-graining procedure, relevant scholars have improved the coarse-graining procedure [19].
Supposing that the time series to be analyzed is { x 1 , x 2 , , x N } , a set of coarse-grained time series z i ( τ ) = { y i , 1 ( τ ) , y i , 2 ( τ ) , } is generated by the improved coarse-graining procedure where y i , j ( τ ) = f = 0 τ 1 x f + i + τ ( i 1 ) τ , τ = 1 , 2 , , n . The improved coarse-graining procedures for scale factor τ = 2 and τ = 3 are shown in Figure 3.
For each scale factor τ and embedded dimension d , the AAPE value of each time series in z i ( τ ) | ( i = 1 , 2 , , τ ) is calculated respectively, and its average value is defined as IMAAPE,
I M A A P E ( x , τ , d ) = 1 τ i = 1 τ A A P E ( z i ( τ ) )

3.3. Fault Identification

The high-performance multi-classifier can realize the fault type identification and further, a fault severity analysis of rotating machinery. The mRVM is adopted to analyze and identify the fault features of rotating machinery in this paper. After the feature extraction of the vibration signal samples with different fault types and fault severity by IMAAPE, a fault feature set is formed to model the mRVM classifier. The established mRVM classifier can identify the fault type and analyze the fault severity of rotating machinery by extracting the IMAAPE fault feature from the vibration signals.

3.4. Fault Diagnosis Procedure

The fault diagnosis procedure of rotating machinery proposed in this paper is shown in Figure 4. The whole procedure of the fault diagnosis method consists of two parts: the training part and testing part. In the training process, the vibration signals of rotating machinery under different fault states are collected according to a fixed sampling frequency to form the vibration signal sample set. The ITD is used to decompose the vibration signal into a set of PR components and the optimum PR component is selected to highlight the fault characteristics of rotating machinery. Then, the IMAAPE algorithm proposed in this paper is used to extract the features of the optimum PR component and construct the feature vector to accurately describe the fault type and fault severity. The fault feature vector set is constructed by all IMAAPE feature vectors that are extracted from the vibration signals in the vibration signal sample set. The mRVM multiple classifier is established by the fault feature vector set. In the testing process, the vibration signals of rotating machinery are collected by vibration accelerometers in real time. The fault features contained in the vibration signals are effectively extracted by the feature extraction method based on the IMAAPE proposed in this paper. Finally, the fault type and fault severity of rotating machinery are estimated by the mRVM classifier.

4. Experiment and Analysis

In order to verify the feasibility and effectiveness of the fault diagnosis method of rotating machinery proposed in this paper, the rolling bearing and gearbox are taken as examples to carry out the experiments and analysis. The rolling bearing experiment adopts the famous public data set provided by Case Western Reserve University Bearing Data Center [29]. The gearbox experiment is carried out at the QPZZ-II vibration analysis and fault diagnosis test platform system of rotating machinery manufactured by Jiangsu Qianpeng Diagnosis Engineering Co., Ltd. (Zhenjiang, China) [30].

4.1. Fault Diagnosis Experiment of Rolling Bearing

4.1.1. Experimental Platform and Data Set

The experimental platform designed by Case Western Reserve University Bearing Data Center is shown in Figure 5. The vibration data was collected using accelerometers, which were attached to the housing with magnetic bases. The accelerometers were placed at the 12 o’clock position at both the drive end and fan end of the motor housing. During some experiments, an accelerometer was attached to the motor supporting base plate as well. The vibration signals were collected using a 16 channel DAT recorder. In this paper, normal (Norm), inner race (IR) fault, outer race (OR) fault and ball elements (BE) fault are used for the experiments. The experimental sample description and experimental sample distribution under different load conditions of the rolling bearing are shown in Table 1 and Table 2, respectively. The vibration signal waveforms of the rolling bearing in different fault types with different fault severity at load 0 hp (1 hp = 746 w) are shown in Figure 6. As shown in Figure 6, the amplitude and frequency of the vibration signals of the rolling bearing under different fault states and fault severity are different.

4.1.2. Fault Feature Extraction

A vibration signal waveform of the rolling bearing with ball elements fault under the fault diameter of 7 mils with the load 0 hp is shown in Figure 7. The vibration signal is decomposed by the ITD and the ITD decomposition results (PR components) are shown in Figure 8. The PR component with the largest amplitude is the optimum PR component as shown in Figure 8. The optimum PR component highlights the frequency and amplitude characteristics of the ball elements fault.
Figure 9 shows the IMAAPE feature vectors for different fault types under the fault diameter of 7 mils with load 0 hp. Figure 10 shows the IMAAPE feature vectors for different fault types under the fault diameter of 7 mils with the load 0 hp. The IMAAPE can highlight the fault characteristics under different scale factors. It can be seen that the feature vectors of different fault types with different fault severity of the rolling bearings have certain differences. It is the difference of the feature vectors in different fault states that makes it possible to identify the fault types and analyze the fault severity.
The three dimensions of the IMAAPE feature vectors for different fault types under different fault diameters with load 0 hp is shown in Figure 11. It can be seen from the Figure 11 that the IMAAPE fault feature extraction method can make feature vectors extracted under different fault types have good clustering characteristics under different fault diameter conditions. Figure 12 shows the two dimensions of the IMAAPE feature vectors for different fault types under different fault diameters with the load 0 hp. It can be seen from Figure 12 that, although the fault features have different fault severity, the IMAAPE feature extraction method can also have good separability. The IMAAPE fault feature extraction method can provide an effective means for the fault severity analysis of the rolling bearings. The between-class distance and the within-class distance of the different rolling bearing fault feature extraction methods are shown in Table 3 and Table 4, respectively. The ratio of the between-class distance to the within-class distance is shown in Table 5. To some extent, the between-class distance and the within-class distance can represent the clustering effect of the feature extraction method. Compared with other feature extraction methods, the fault features extracted by the IMAAPE can have a relatively larger between-class distance and a smaller within-class distance. Although the ratio of the between-class distance to the within-class distance of the IMAAPE is not the best in these methods, its comprehensive performance is the best. Therefore, the fault features extracted by the IMAAPE have good clustering characteristics. The time required by the different feature extraction methods is shown in Table 6. It can be seen from Table 6 that the IMAAPE fault feature extraction algorithm proposed in this paper has higher computational efficiency.

4.1.3. Fault Identification

In order to illustrate the fault identification accuracy of the fault diagnosis method based on the IMAAPE and the mRVM proposed in this paper, the samples under different loads were used to verify the effectiveness of the proposed method. The selection of the experimental samples is shown in Table 1 and Table 2. The experimental results of fault identification accuracy of the different classifiers with different loads are as shown in Table 7, Table 8, Table 9 and Table 10. The fault feature extraction method based on the IMAAPE combined with different classifiers has high fault identification accuracy. Moreover, the experimental results show that the identification accuracy of the mRVM1_conv1 is higher than other classification methods, and at the same time, this method has reasonable operation efficiency. Therefore, the mRVM1_conv1 was used as the multiple classifier of the rolling bearing fault diagnosis method in this paper.
The fault identification accuracy of mRVM1_conv1 under different fault severity with the load 0 hp is shown in Table 11. It can be seen that the fault diagnosis method proposed in this paper can effectively identify the different fault severity of the rolling bearing. Further, the identification accuracy reaches 99.25%. As the selection of nuclear parameters has a great impact on the identification accuracy of the mRVM, this paper compares the selection of nuclear parameters of the mRVM and the experimental results are shown in Table 12. It can be seen that when the nuclear parameter is 8.5, the mRVM multi-classifier has the highest fault identification accuracy for the rolling bearing faults with different fault severity.
In this paper, the effectiveness of the different fault extraction methods combined with the mRVM classifier for the rolling bearing were compared. The experimental results are shown in Table 13. The fault diagnosis method proposed in this paper has the highest fault identification accuracy up to 99.925%.

4.2. Fault Diagnosis Experiment of Gearbox

4.2.1. Experimental Platform and Data

The experimental platform QPZZ-II was manufactured by Jiangsu Qingpeng Diagnosis Engineering Co., Ltd. A picture of QPZZ-II is shown in Figure 13. The vibration signals were collected by accelerometers. In the experiments, five working states were considered including the normal condition, gear pitting fault (pitting), gear tooth breaking (tooth breaking), pinion wear fault (wearing) and gear pitting fault coupling with pinion wear fault (pitting and wearing). The experimental sample description of the gearbox is shown in Table 14. The acquisition equipment is QPZZ-II produced by the Jiangsu Qianpeng Diagnosis Engineering Co. Ltd. and the sampling frequency is 5.12 kHz. There are 53,248 data points for each health condition. The collected data was divided into several non-overlapping samples. Each sample contained 1024 points.
The vibration signal waveforms of the gearbox in different fault conditions are shown in Figure 14. As can be seen from the figure, the vibration signals of the gearbox under different fault states have differences in amplitude and frequency. This can provide more effective help for the pattern recognition method.

4.2.2. Fault Feature Extraction

The vibration signal is decomposed by the ITD and the ITD decomposition results (PR components) are shown in Figure 15. The optimum PR component highlights the frequency and amplitude characteristics of the gear pitting fault.
Figure 16 shows the IMAAPE feature vectors for different fault types of the gearbox. The IMAAPE can highlight the fault characteristics of the gearbox under different scale factors. The three dimensions of the IMAAPE feature vectors for different fault types of the gearbox are shown in Figure 17. It can be seen from the figure that the IMAAPE fault feature extraction algorithm can effectively describe the fault features and the feature vectors have good clustering characteristics.

4.2.3. Fault Identification

As shown in Table 15, Table 16, Table 17 and Table 18, the selection of nuclear parameters of different mRVM implementations can make the fault identification accuracy of the gearbox up to 100%. In order to evaluate the effectiveness of the gearbox fault diagnosis method proposed in this paper, fault diagnosis accuracy comparison experiments were carried out. The experimental results show that the fault identification accuracy of the IMAAPE and the mRVM based fault diagnosis methods reach 100% in Table 19. Compared with other fault feature extraction methods, the IMAAPE has obvious advantages in fault identification accuracy. Therefore, the proposed fault diagnosis method proposed in this is suitable for gearbox fault diagnosis and has high identification accuracy.

5. Conclusions

This paper presents a novel diagnosis method for rotating machinery, which can further analyze the fault severity of rotating machinery on the basis of accurately identify the fault types. The experiments were conducted to illustrate the validity and feasibility of the fault diagnosis method for rotating machinery. This paper can summarize the following conclusions:
(1) The improved multiscale amplitude-aware permutation entropy (IMAAPE) proposed in this paper improves the coarse-graining process of the MSE and the problems existing in the PE, and can effectively extract the fault information contained in the vibration signals. Moreover, compared with other fault feature extraction methods, the IMAAPE has higher execution efficiency.
(2) The multiclass relevance vector machine (mRVM) is suitable for the multi-classification of rotating machinery and has high identification accuracy on the basis of reasonable selection of nuclear parameters.
(3) The rolling bearing experiments and gearbox experiments show the effectiveness of the proposed method. The experimental results on the rolling bearing and gear box show that the proposed fault diagnosis method for rotating machinery has a high fault identification accuracy of over 99%. In particular, the rolling bearing experiments show the potential application of the proposed method in fault severity analysis.

Author Contributions

Y.C. clarified the research content and ideas, and completed the writing of this paper. T.Z. and W.Z. studied the method and carried out experiments. Z.L. and H.L. analyzed the data and proofread the manuscript.

Funding

This research was funded by the Research Project of Education Department of Heilongjiang Province under grant number 12541117.

Acknowledgments

Thanks for the Bearing Data Center of Case Western Reserve University to supply the rolling bearing data set and Jiangsu Qianpeng Diagnosis Engineering Co., Ltd. to supply the gearbox data set.

Conflicts of Interest

The authors declare no conflicts of interest.

Abbreviations

AAPEAmplitude-aware permutation entropy
ApEnApproximate entropy
ANNArtificial neural network
BEBall elements
CEEMDComplementary ensemble empirical mode decomposition
EMDEmpirical mode decomposition
ELCDEnsemble local characteristic-scale decomposition
FFTFast Fourier transform
IMAAPEImproved multiscale amplitude-aware permutation entropy
ISVM-BTImproved support vector machine based on binary tree
IRInner race
IMFIntrinsic mode function
IMFEImproved multiscale fuzzy entropy
IMSEImproved multiscale entropy
ISCIntrinsic scale component
ITDIntrinsic time-scale decomposition
LMDLocal mean decomposition
mRVMMulticlass relevance vector machine
MSEMultiscale entropy
MFEMultiscale fuzzy entropy
MPEMultiscale permutation entropy
NormNormal
OVA-SVMOne-against-All SVM
OAO-SVMOne-against-One SVM
OROuter race
PEPermutation entropy
PNNProbabilistic neural network
PFProduct function
PRProper rotation
RFRandom forest
RCMPERefined composite multiscale permutation entropy
RCMSERefined composite multiscale entropy
RVMRelevance vector machine
SampEnSample entropy
SVMSupport vector machine
TFETime-frequency-energy
WPTWavelet packet transform
WTWavelet transform

References

  1. Liu, R.; Yang, B.; Zio, E.; Chen, X. Artificial intelligence for fault diagnosis of rotating machinery: A review. Mech. Syst. Signal Process. 2018, 108, 33–47. [Google Scholar] [CrossRef]
  2. Lei, Y.; Lin, J.; He, Z.; Zuo, M.J. A review on empirical mode decomposition in fault diagnosis of rotating machinery. Mech. Syst. Signal Process. 2013, 35, 108–126. [Google Scholar] [CrossRef]
  3. Zhang, S.; Zhang, S.; Wang, B.; Habetler, T.G. Machine Learning and Deep Learning Algorithms for Bearing Fault Diagnostics-A Comprehensive Review. arXiv 2019, arXiv:1901.08247. [Google Scholar]
  4. Li, Y.; Liang, X.; Wei, Y.; Wang, X. A method based on refined composite Multi-Scale symbolic dynamic entropy and ISVM-BT for rotating machinery fault diagnosis. Neurocomputing 2018, 315, 246–260. [Google Scholar] [CrossRef]
  5. Li, C.; Zheng, J.; Pan, H.; Tong, J.; Zhang, Y. Refined Composite Multivariate Multiscale Dispersion Entropy and Its Application to Fault Diagnosis of Rolling Bearing. IEEE Access 2019, 7, 47663–47673. [Google Scholar] [CrossRef]
  6. Chen, Y.; Zhang, T.; Luo, Z.; Sun, K. A Novel Rolling Bearing Fault Diagnosis and Severity Analysis Method. Appl. Sci. 2019, 9, 2356. [Google Scholar] [CrossRef]
  7. Jiang, X.; Wu, L.; Pan, L.; Ge, M.; Hu, D. Rolling Bearing Fault Diagnosis Based on ELCD Permutation Entropy and RVM. J. Eng. 2016, 2016, 1308108. [Google Scholar]
  8. Li, Y.; Xu, M.; Wei, Y.; Huang, W. A new rolling bearing fault diagnosis method based on multiscale permutation entropy and improved support vector machine based binary tree. Measurement 2016, 77, 80–94. [Google Scholar] [CrossRef]
  9. Chen, J.; Zhou, D.; Lyu, C.; Lu, C. An integrated method based on CEEMD-SampEn and the correlation analysis algorithm for the fault diagnosis of a gearbox under different working conditions. Mech. Syst. Signal Process. 2018, 113, 102–111. [Google Scholar] [CrossRef]
  10. Humeau-Heurtier, A. The multiscale entropy algorithm and its variants: A review. Entropy 2015, 17, 3110–3123. [Google Scholar] [CrossRef]
  11. Li, Y.; Wang, X.; Liu, Z.; Liang, X.; Si, S. The entropy algorithm and its variants in the fault diagnosis of rotating machinery: A review. IEEE Access 2018, 6, 66723–66741. [Google Scholar] [CrossRef]
  12. Liu, H.; Han, M. A fault diagnosis method based on local mean decomposition and Multi-Scale entropy for roller bearings. Mech. Mach. Theory 2014, 75, 67–78. [Google Scholar] [CrossRef]
  13. Vakharia, V.; Gupta, V.K.; Kankar, P.K. A multiscale permutation entropy based approach to select wavelet for fault diagnosis of ball bearings. J. Vib. Control 2015, 21, 3123–3131. [Google Scholar] [CrossRef]
  14. Tiwari, R.; Gupta, V.K.; Kankar, P.K. Bearing fault diagnosis based on Multi-Scale permutation entropy and adaptive neuro fuzzy classifier. J. Vib. Control 2015, 21, 461–467. [Google Scholar] [CrossRef]
  15. Wu, S.-D.; Wu, P.-H.; Wu, C.-W.; Ding, J.-J.; Wang, C.-C. Bearing fault diagnosis based on multiscale permutation entropy and support vector machine. Entropy 2012, 14, 1343–1356. [Google Scholar] [CrossRef]
  16. Li, Y.; Xu, M.; Wang, R.; Huang, W. A fault diagnosis scheme for rolling bearing based on local mean decomposition and improved multiscale fuzzy entropy. J. Sound Vib. 2016, 360, 277–299. [Google Scholar] [CrossRef]
  17. Zheng, J.; Pan, H.; Cheng, J. Rolling bearing fault detection and diagnosis based on composite multiscale fuzzy entropy and ensemble support vector machines. Mech. Syst. Signal Process. 2017, 85, 746–759. [Google Scholar] [CrossRef]
  18. Azami, H.; Escudero, J. Amplitude-Aware permutation entropy: Illustration in spike detection and signal segmentation. Comput. Methods Programs Biomed. 2016, 128, 40–51. [Google Scholar] [CrossRef]
  19. Azami, H.; Escudero, J. Improved multiscale permutation entropy for biomedical signal analysis: Interpretation and application to electroencephalogram recordings. Biomed. Signal Process. 2016, 23, 28–41. [Google Scholar] [CrossRef] [Green Version]
  20. Yu, Y.; Junsheng, C. A roller bearing fault diagnosis method based on EMD energy entropy and ANN. J. Sound Vib. 2006, 294, 269–277. [Google Scholar] [CrossRef]
  21. Zhang, X.L.; Wang, B.J.; Chen, X.F. Intelligent fault diagnosis of roller bearings with multivariable Ensemble-Based incremental support vector machine. Knowl.-Based Syst. 2015, 89, 56–85. [Google Scholar] [CrossRef]
  22. Wang, Z.; Zhang, Q.; Xiong, J.; Xiao, M.; Sun, G.; He, J. Fault diagnosis of a rolling bearing using wavelet packet denoising and random forests. IEEE Sens. J. 2017, 17, 5581–5588. [Google Scholar] [CrossRef]
  23. Psorakis, I.; Damoulas, T.; Girolami, M.A. Multiclass relevance vector machines: Sparsity and accuracy. IEEE Trans. Neural Netw. 2010, 21, 1588–1598. [Google Scholar] [CrossRef] [PubMed]
  24. Lei, Y.; Liu, Z.; Wu, X.; Li, N.; Chen, W.; Lin, J. Health condition identification of Multi-Stage planetary gearboxes using a mRVM-Based method. Mech. Syst. Signal Process. 2015, 60, 289–300. [Google Scholar] [CrossRef]
  25. Frei, M.G.; Osorio, I. Intrinsic Time-Scale decomposition: Time–Frequency–Energy analysis and Real-Time filtering of Non-Stationary signals. Proc. R. Soc. A 2006, 463, 321–342. [Google Scholar] [CrossRef]
  26. Costa, M.; Goldberger, A.L.; Peng, C.K. Multiscale entropy analysis of complex physiologic time series. Phys. Rev. Lett. 2002, 89, 068102. [Google Scholar] [CrossRef]
  27. Bandt, C.; Pompe, B. Permutation entropy: A natural complexity measure for time series. Phys. Rev. Lett. 2002, 88, 174102. [Google Scholar] [CrossRef]
  28. Tipping, M.E.; Faul, A.C. Fast marginal likelihood maximisation for sparse Bayesian models. In Proceedings of the Ninth International Workshop on Artificial Intelligence and Statistics, Key West, FL, USA, 3–6 January 2003; pp. 3–6. [Google Scholar]
  29. Case Western Reserve University. Bearing Data Center. Available online: http://csegroups.case.edu/bearingdatacenter/pages/download-data-file (accessed on 17 October 2019).
  30. Jiang, L.; Cui, J.; Wang, J.A. DPCA-Based online fault indicator for gear faults using Three-Direction vibration signals. J. Vibroeng. 2018, 20, 1340–1354. [Google Scholar] [CrossRef]
Figure 1. The flow chart of the amplitude-aware permutation entropy (AAPE) algorithm.
Sensors 19 04542 g001
Figure 2. Plates diagram of the multiclass relevance vector machine (mRVM) model.
Sensors 19 04542 g002
Figure 3. The improved coarse-graining procedures for scale factor τ = 2 and τ = 3.
Sensors 19 04542 g003
Figure 4. The proposed fault diagnosis procedure based on the improved multiscale amplitude-aware permutation entropy (IMAAPE) and mRVM.
Sensors 19 04542 g004
Figure 5. The experimental platform of rolling bearing from Bearing Data Center of Case Western Reserve University.
Sensors 19 04542 g005
Figure 6. The vibration signal waveforms of rolling bearing in different fault states at load 0 hp.
Sensors 19 04542 g006
Figure 7. The vibration signal waveform of rolling bearing with the ball elements fault under the fault diameter of 7mils with the load 0 hp.
Sensors 19 04542 g007
Figure 8. The intrinsic time-scale decomposition (ITD) results of the vibration signal with the ball elements of the rolling bearing under the fault diameter of 7 mils with the load 0 hp.
Sensors 19 04542 g008
Figure 9. IMAAPE feature vectors for different fault types under the fault diameter of 7 mils with the load 0 hp.
Sensors 19 04542 g009
Figure 10. IMAAPE feature vectors for different fault types under different fault diameters with the load 0 hp.
Sensors 19 04542 g010
Figure 11. Three dimensions of the IMAAPE feature vectors for different fault types under different fault diameters with the load 0 hp. (a) fault diameter is 7 mils; (b) fault diameter is 14 mils; (c) fault diameter is 21 mils.
Sensors 19 04542 g011
Figure 12. Two dimensions of the IMAAPE feature vectors for different fault types under different fault diameters with the load 0 hp.
Sensors 19 04542 g012
Figure 13. The experimental platform of the gearbox from QPZZ-II.
Sensors 19 04542 g013
Figure 14. The vibration signal waveforms of the gearbox in different fault conditions.
Sensors 19 04542 g014
Figure 15. The ITD decomposition results of the vibration signal with the gear pitting fault.
Sensors 19 04542 g015
Figure 16. IMAAPE feature vectors for different fault types of the gearbox.
Sensors 19 04542 g016
Figure 17. Three dimensions of the IMAAPE feature vectors for different fault types of the gearbox.
Sensors 19 04542 g017
Table 1. Experimental sample description of the rolling bearing.
Fault TypeLabelsFault Diameter (mils)Training Sample NumberTesting Sample Number
NormalNorm01040
Inner race faultIR0771040
IR14141040
IR21211040
Outer race faultOR0771040
OR14141040
OR21211040
Ball elements faultBE0771040
BE14141040
BE21211040
Table 2. Experimental sample distribution under different load conditions of the rolling bearing.
LabelsFault SeverityFault Diameter (mils)Load (hp)
0123
Norm01
IR07Minor7
IR14Medium14
IR21Serious21
OR07Minor7
OR14Medium14
OR21Serious21
BE07Minor7
BE14Medium14
BE21Serious21
1 “✓” represents the experimental sample of rolling bearing under current load.
Table 3. The between-class distance of different rolling bearing fault feature extraction methods.
Between-Class DistanceIMAAPEIMPERCMPEIMSEIMFERCMSE
BE-IR1.3731.0111.0080.9330.7770.477
BE-Norm1.1151.1291.1591.8215.0935.693
BE-OR1.0120.5360.5343.3342.4252.293
IR-Norm1.1311.1111.1321.5504.9825.778
IR-OR1.4070.8080.8043.1552.3202.374
Norm-OR1.3851.1171.1412.5546.7457.495
Table 4. The within-class distance of different rolling bearing fault feature extraction methods.
Within-Class DistanceIMAAPEIMPERCMPEIMSEIMFERCMSE
BE0.1830.1890.3061.0870.2690.252
IR0.1870.1890.2130.9440.2190.156
Norm0.3110.3560.4501.0440.5611.014
OR0.1350.1760.2330.6910.2800.105
Table 5. The ratio of the between-class distance to the within-class distance.
Failure StatesIMAAPEIMPERCMPEIMSEIMFERCMSE
BE6.3754.7202.9421.86710.27911.194
IR6.9715.1684.6071.99112.29718.438
Norm3.8923.1432.5421.8929.9946.235
OR9.3934.6613.5464.36213.67938.610
Table 6. Time required by different feature extraction methods.
Feature Extraction MethodIMAAPEIMPERCMPEIMSEIMFERCMSE
Time (ms)0.390.571.110.4217.300.40
Table 7. Fault identification accuracy of different classifiers with the load 0 hp.
Classifier TypeAverage Time (ms)Identification Accuracy (%)
MaximumMinimumAverage
mRVM1_conv10.328710099.2599.925
mRVM1_conv20.329810097.0099.842
mRVM2_convA0.446599.7597.5099.05
mRVM2_convN9.143010096.7598.89
OAO-SVM0.005489.0089.7589.25
OVA-SVM0.024189.5089.7589.53
Random Forest3.087089.2588.7588.78
Table 8. Fault identification accuracy of different classifiers with the load 1 hp.
Classifier TypeAverage Time (ms)Identification Accuracy (%)
MaximumMinimumAverage
mRVM1_conv10.2801100100100
mRVM1_conv20.3174100100100
mRVM2_convA0.358410098.9998.73
mRVM2_convN10.365910098.7498.52
OAO-SVM0.003995.0088.9492.76
OVA-SVM0.024195.9893.7295.18
Random Forest2.970699.0097.7598.42
Table 9. Fault identification accuracy of different classifiers with the load 2 hp.
Classifier TypeAverage Time (ms)Identification Accuracy (%)
MaximumMinimumAverage
mRVM1_conv10.3107100100100
mRVM1_conv20.2809100100100
mRVM2_convA0.3584100100100
mRVM2_convN11.4355100100100
OAO-SVM0.003998.7587.2593.00
OVA-SVM0.024199.2583.2591.54
Random Forest2.970699.5099.2599.40
Table 10. The fault identification accuracy of different classifiers with the load 3 hp.
Classifier TypeAverage Time (ms)Identification Accuracy (%)
MaximumMinimumAverage
mRVM1_conv10.2855100100100
mRVM1_conv20.2662100100100
mRVM2_convA0.358499.5098.5099.30
mRVM2_convN11.435510098.7599.62
OAO-SVM0.005289.7284.4686.81
OVA-SVM0.022299.2583.2591.54
Random Forest2.860099.7598.9999.30
Table 11. Fault identification accuracy of the mRVM1_conv1 under different fault severity with the load 0 hp (%).
Testing Fault SeverityTesting Results
BE07BE14BE21IR07IR14IR21NormOR07OR14OR21
BE07100
BE14 100
BE21 100
IR07 99.250.75
IR14 100
IR21 100
Norm 100
OR07 100
OR14 100
OR21 100
Table 12. The influence of nuclear parameter selection of the mRVM on fault identification accuracy of the rolling bearing (%).
Testing Fault SeverityNuclear Parameter Value
1.52.02.53.03.54.04.55.05.56.06.57.07.58.08.59.09.510.0
BE0776.2584.2591.092.2590.593.2595.598.7510099.2593.010010096.7510010099.50100
BE1475.2587.510098.310093.7597.096.2510010010099.7510010010010099.7596.50
BE2159.084.586.2592.7598.7596.599.510099.7510099.75100100100100100100100
OR0777.084.588.7591.7592.7598.2510099.510010099.75100100100100100100100
OR1475.2576.086.7510010094.095.597.7510010010010010010010095.25100100
OR2176.5082.086.2584.7510097.010010010010010099.7599.7510010010010097.0
IR0775.2584.2587.091.592.2510094.2598.2510010010010010010099.2595.25100100
IR1476.5082.7590.089.2588.593.7596.7599.7599.25100100100100100100100100100
IR2159.084.586.2592.7598.096.099.2597.7598.7599.097.510010010010010010097.0
Norm75.084.7593.2510094.2510090.7597.010099.0100100100100100100100100
Table 13. Rolling bearing fault identification accuracy of different fault extraction methods combined with the mRVM.
Feature Extraction MethodFault Identification Accuracy (%)
IMAAPE99.925
IMFE96.25
IMPE96.0
RCMSE92.25
IMSE84.25
RCMPE97.5
Table 14. Experimental sample description of the gearbox.
Fault TypeLabelsTraining Sample NumberTesting Sample Number
Normal11040
Wearing21040
Tooth breaking31040
Pitting41040
Pitting & wearing51040
Table 15. The influence of nuclear parameter selection of the mRVM1_conv1 on fault identification accuracy of the rolling bearing (%).
Testing Fault SeverityNuclear Parameter Value
1.52.02.53.03.54.04.55.05.56.06.57.07.58.08.59.09.510.0
BE0792.010098.510099.5100100100100100100100100100100100100100
BE1477.592.099.097.0100100100100100100100100100100100100100100
BE2191.097.099.5100100100100100100100100100100100100100100100
OR0796.599.010098.599.0100100100100100100100100100100100100100
OR1493.097.599.010099.0100100100100100100100100100100100100100
OR2163.094.099.010099.0100100100100100100100100100100100100100
IR0790.010010099.599.0100100100100100100100100100100100100100
IR1463.097.5100100100100100100100100100100100100100100100100
IR2195.099.098.599.010010010099.5100100100100100100100100100100
Norm98.598.591.0100100100100100100100100100100100100100100100
Table 16. The influence of nuclear parameter selection of the mRVM1_conv2 on fault identification accuracy of the rolling bearing (%).
Testing Fault SeverityNuclear Parameter Value
1.52.02.53.03.54.04.55.05.56.06.57.07.58.08.59.09.510.0
BE0778.593.0100100100100100100100100100100100100100100100100
BE1496.510010010098.5100100100100100100100100100100100100100
BE2192.010091.0100100100100100100100100100100100100100100100
OR0799.010099.010010010010099.5100100100100100100100100100100
OR1496.591.099.510010099.0100100100100100100100100100100100100
OR2195.078.010099.0100100100100100100100100100100100100100100
IR0770.010099.095.098.5100100100100100100100100100100100100100
IR1480.010094.098.5100100100100100100100100100100100100100100
IR2199.096.099.510010010010099.5100100100100100100100100100100
Norm85.097.099.5100100100100100100100100100100100100100100100
Table 17. The influence of nuclear parameter selection of the mRVM2_convA on fault identification accuracy of the rolling bearing (%).
Testing Fault SeverityNuclear Parameter Value
1.52.02.53.03.54.04.55.05.56.06.57.07.58.08.59.09.510.0
BE07100100100100100100100100100100100100100100100100100100
BE1498.010099.5100100100100100100100100100100100100100100100
BE2194.010010010099.5100100100100100100100100100100100100100
OR0710010010010010010010099.5100100100100100100100100100100
OR1410097.510010010099.0100100100100100100100100100100100100
OR2199.510096.5100100100100100100100100100100100100100100100
IR07100100100100100100100100100100100100100100100100100100
IR14100100100100100100100100100100100100100100100100100100
IR2197.596.099.5100100100100100100100100100100100100100100100
Norm87.099.5100100100100100100100100100100100100100100100100
Table 18. The influence of nuclear parameter selection of the mRVM2_convN on fault identification accuracy of the rolling bearing (%).
Testing Fault SeverityNuclear Parameter Value
1.52.02.53.03.54.04.55.05.56.06.57.07.58.08.59.09.510.0
BE0770.581.585.588.596.597.598.510099.099.599.599.599.5100100100100100
BE1484.582.082.589.091.597.598.010010099.599.599.5100100100100100100
BE2179.081.585.590.594.096.097.599.099.599.5100100100100100100100100
OR0778.083.587.091.095.097.598.599.099.010099.599.599.5100100100100100
OR1479.579.086.586.092.597.097.510099.5100100100100100100100100100
OR2178.084.081.091.597.099.096.599.599.599.510099.5100100100100100100
IR0777.080.586.091.594.096.597.598.510010099.599.5100100100100100100
IR1473.579.085.588.594.597.510099.510010099.599.5100100100100100100
IR2181.077.585.087.596.097.098.510099.5100100100100100100100100100
Norm67.078.586.590.095.598.096.599.510099.5100100100100100100100100
Table 19. Gearbox fault identification accuracy of different fault extraction methods combined with the mRVM.
Feature Extraction MethodFault Identification Accuracy (%)
IMAAPE100
IMFE99.0
IMPE98.0
RCMSE99.5
IMSE96.5
RCMPE97.5

