Development of a New Embedded Dynamometer for the Measurement of Forces and Torques at the Ski-Binding Interface


Abstract
:1. Introduction
2. Materials and Methods
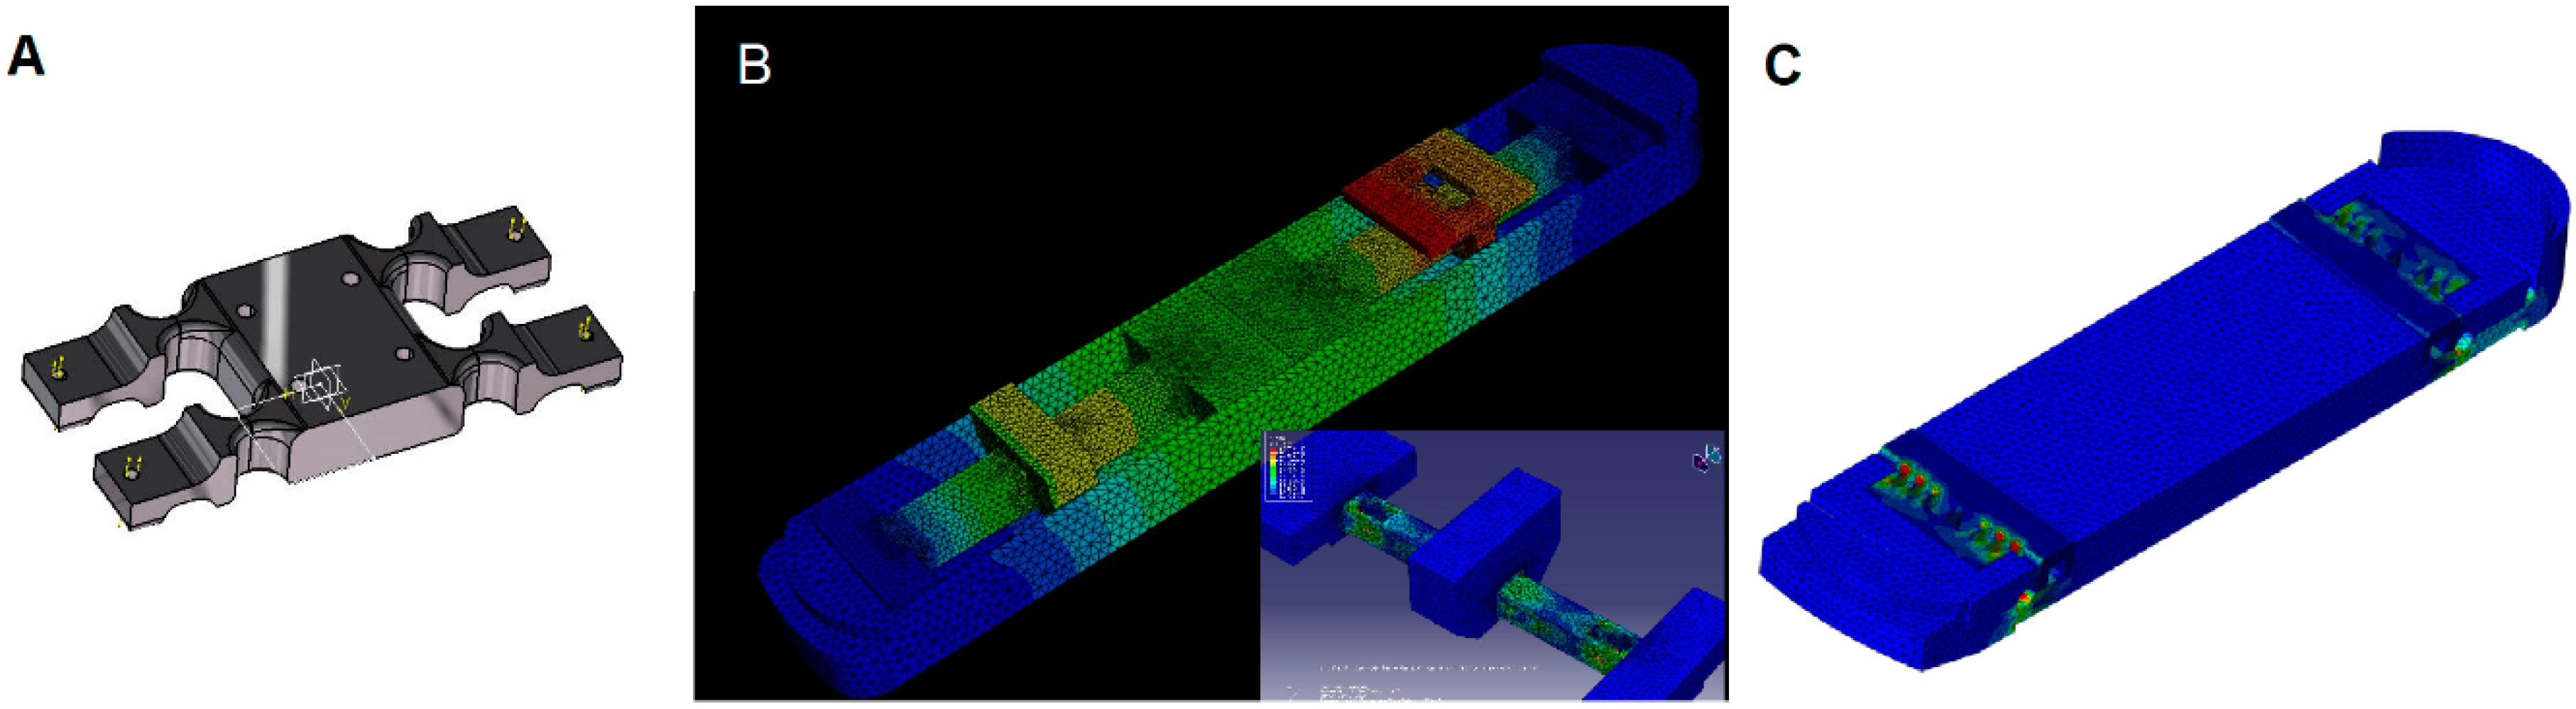
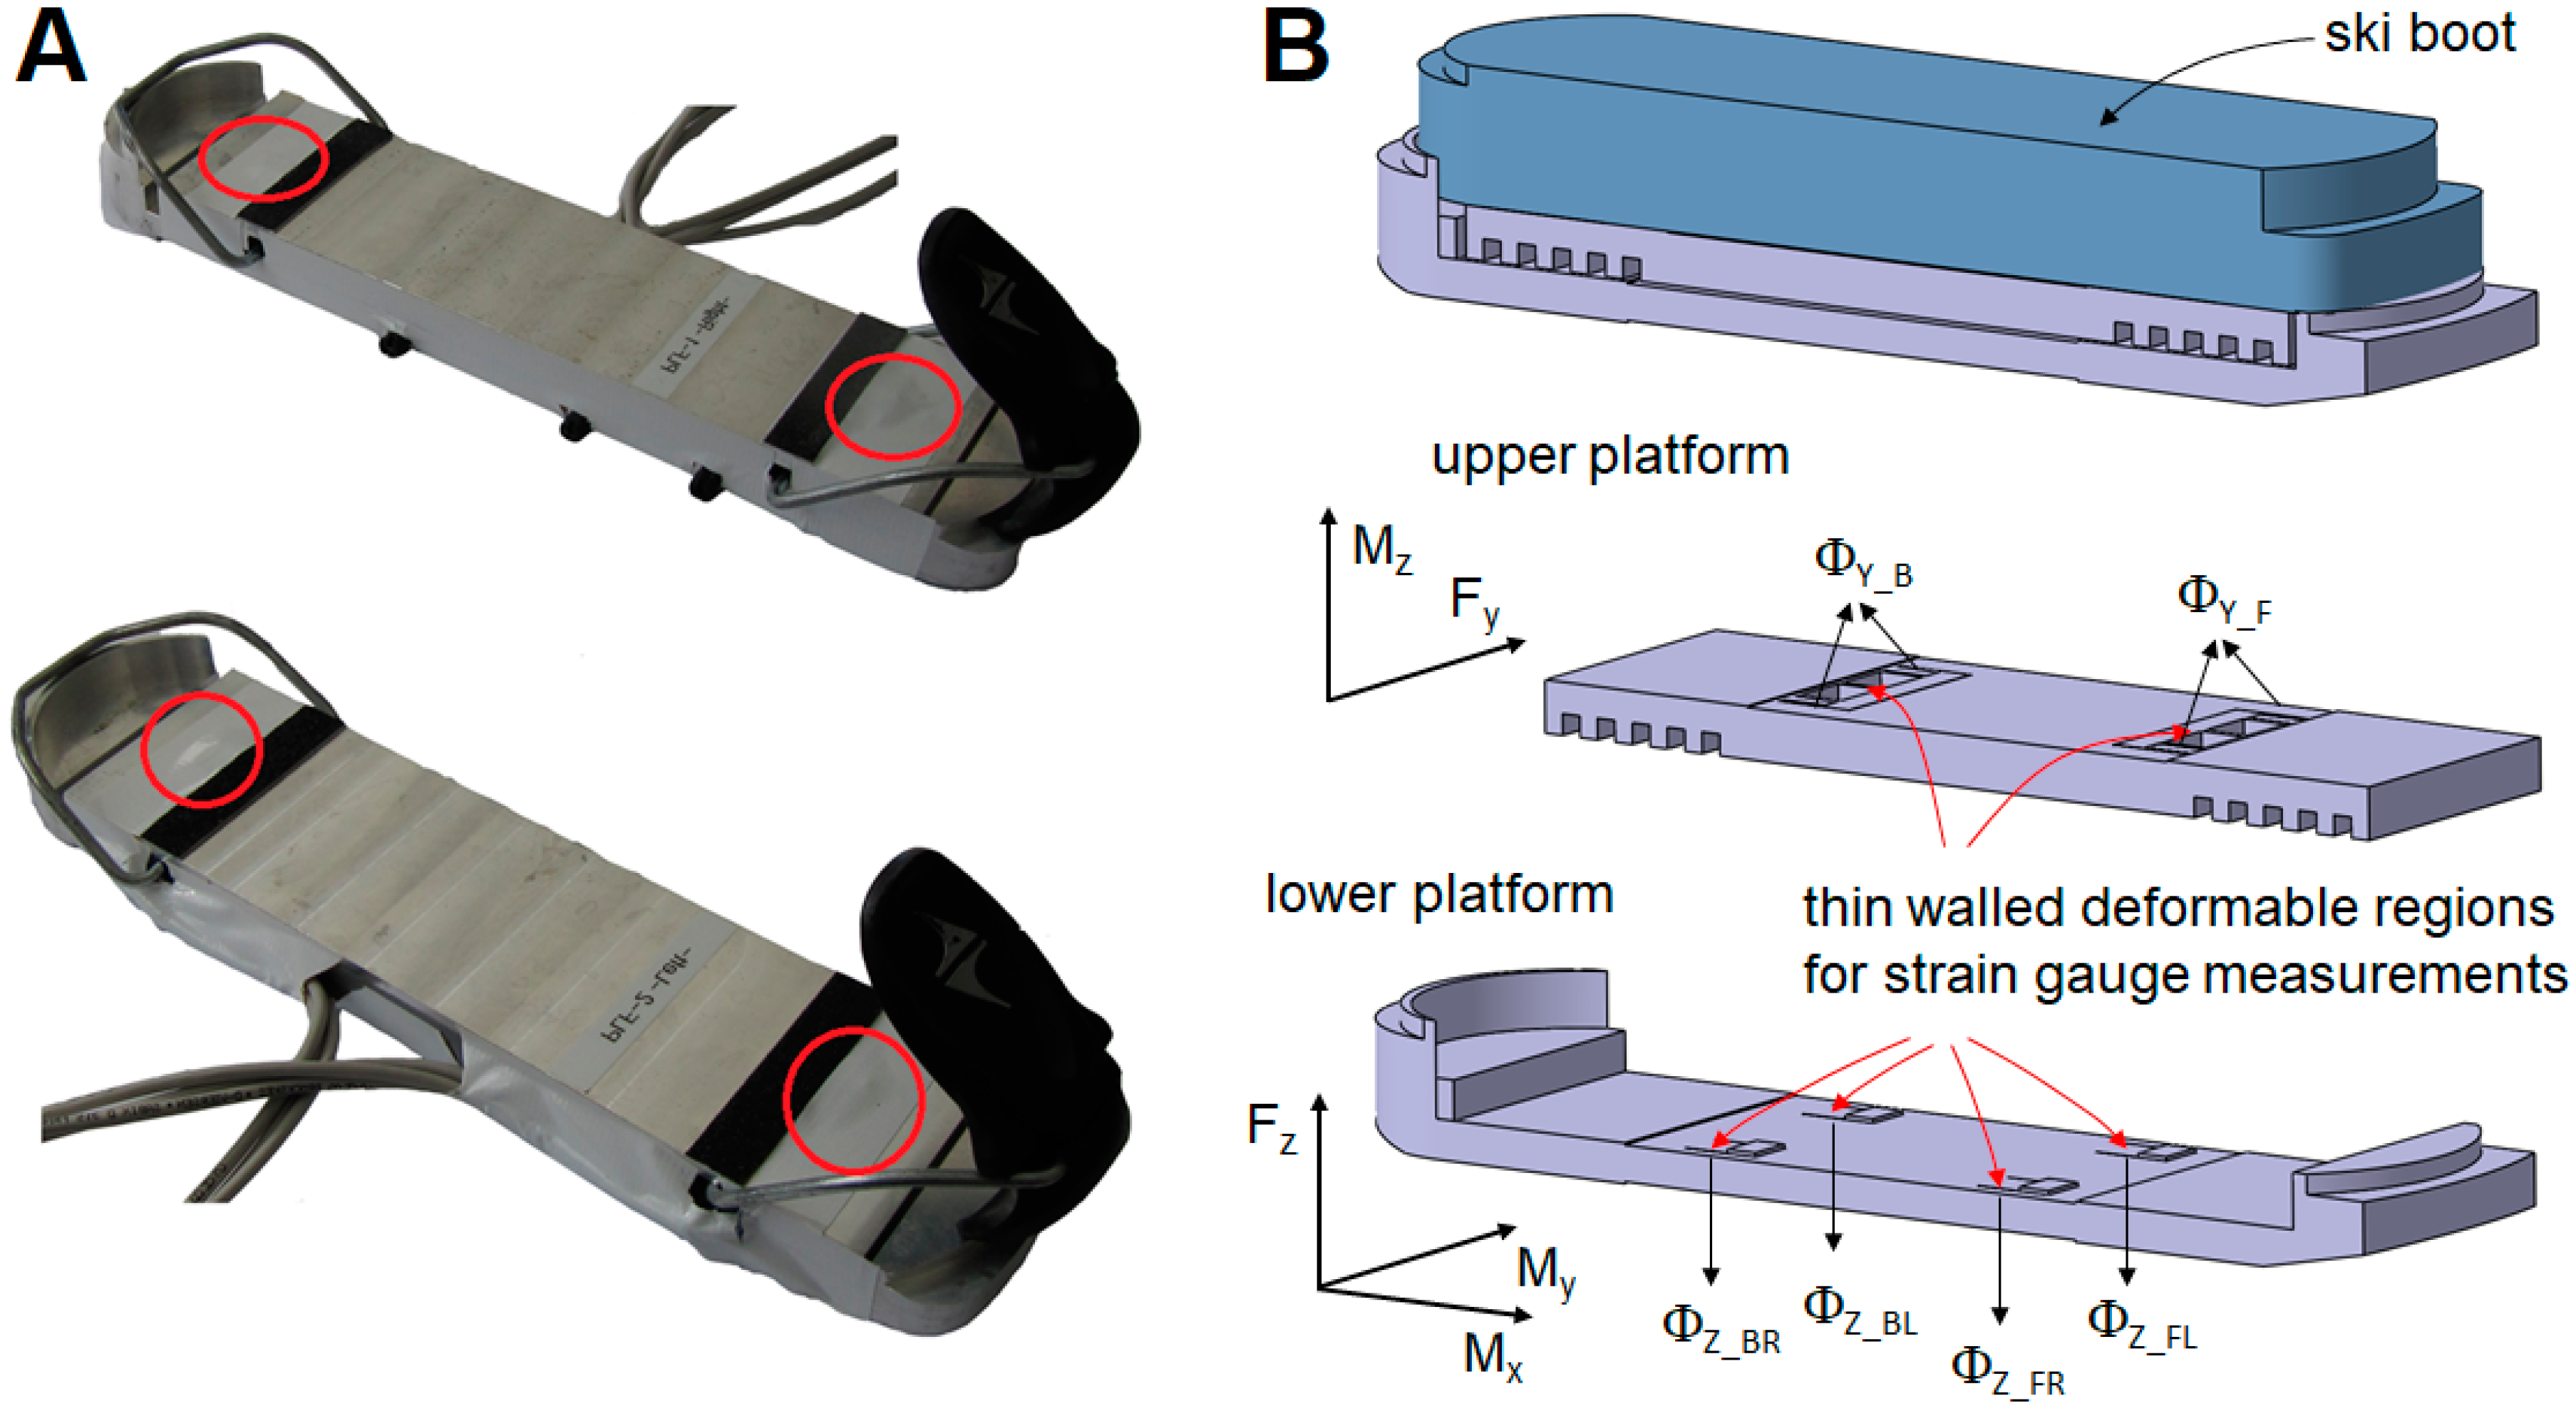
2.1. Dynamometer Design
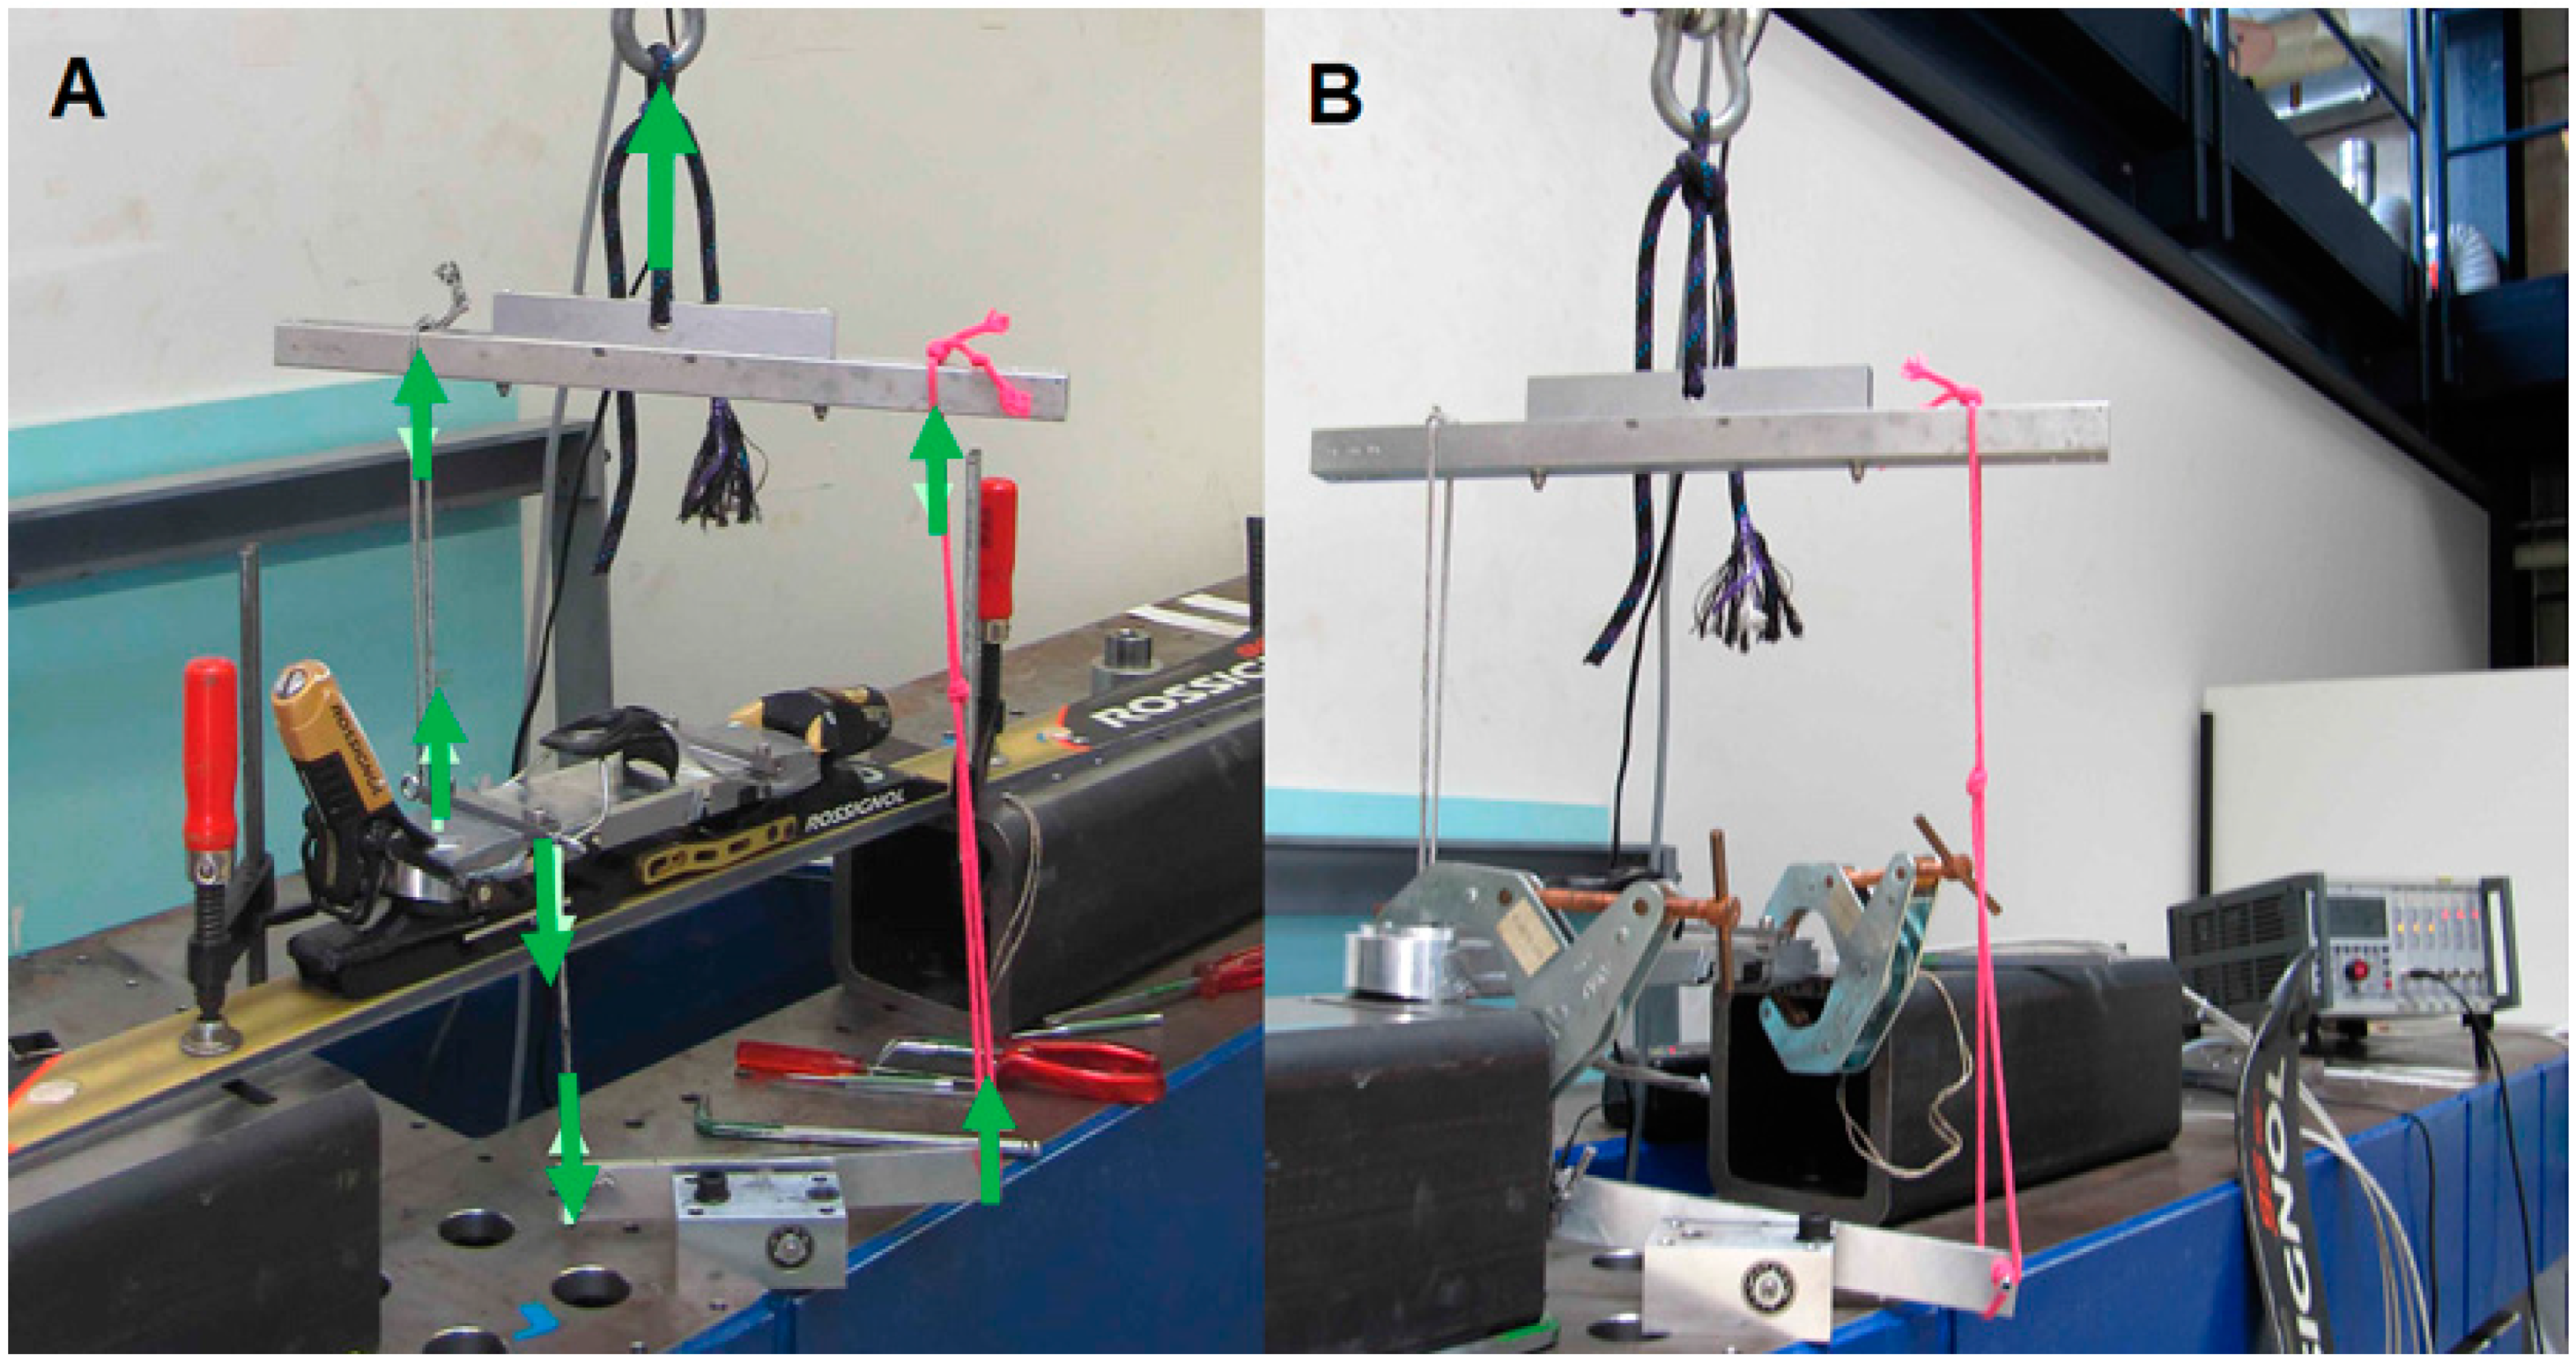
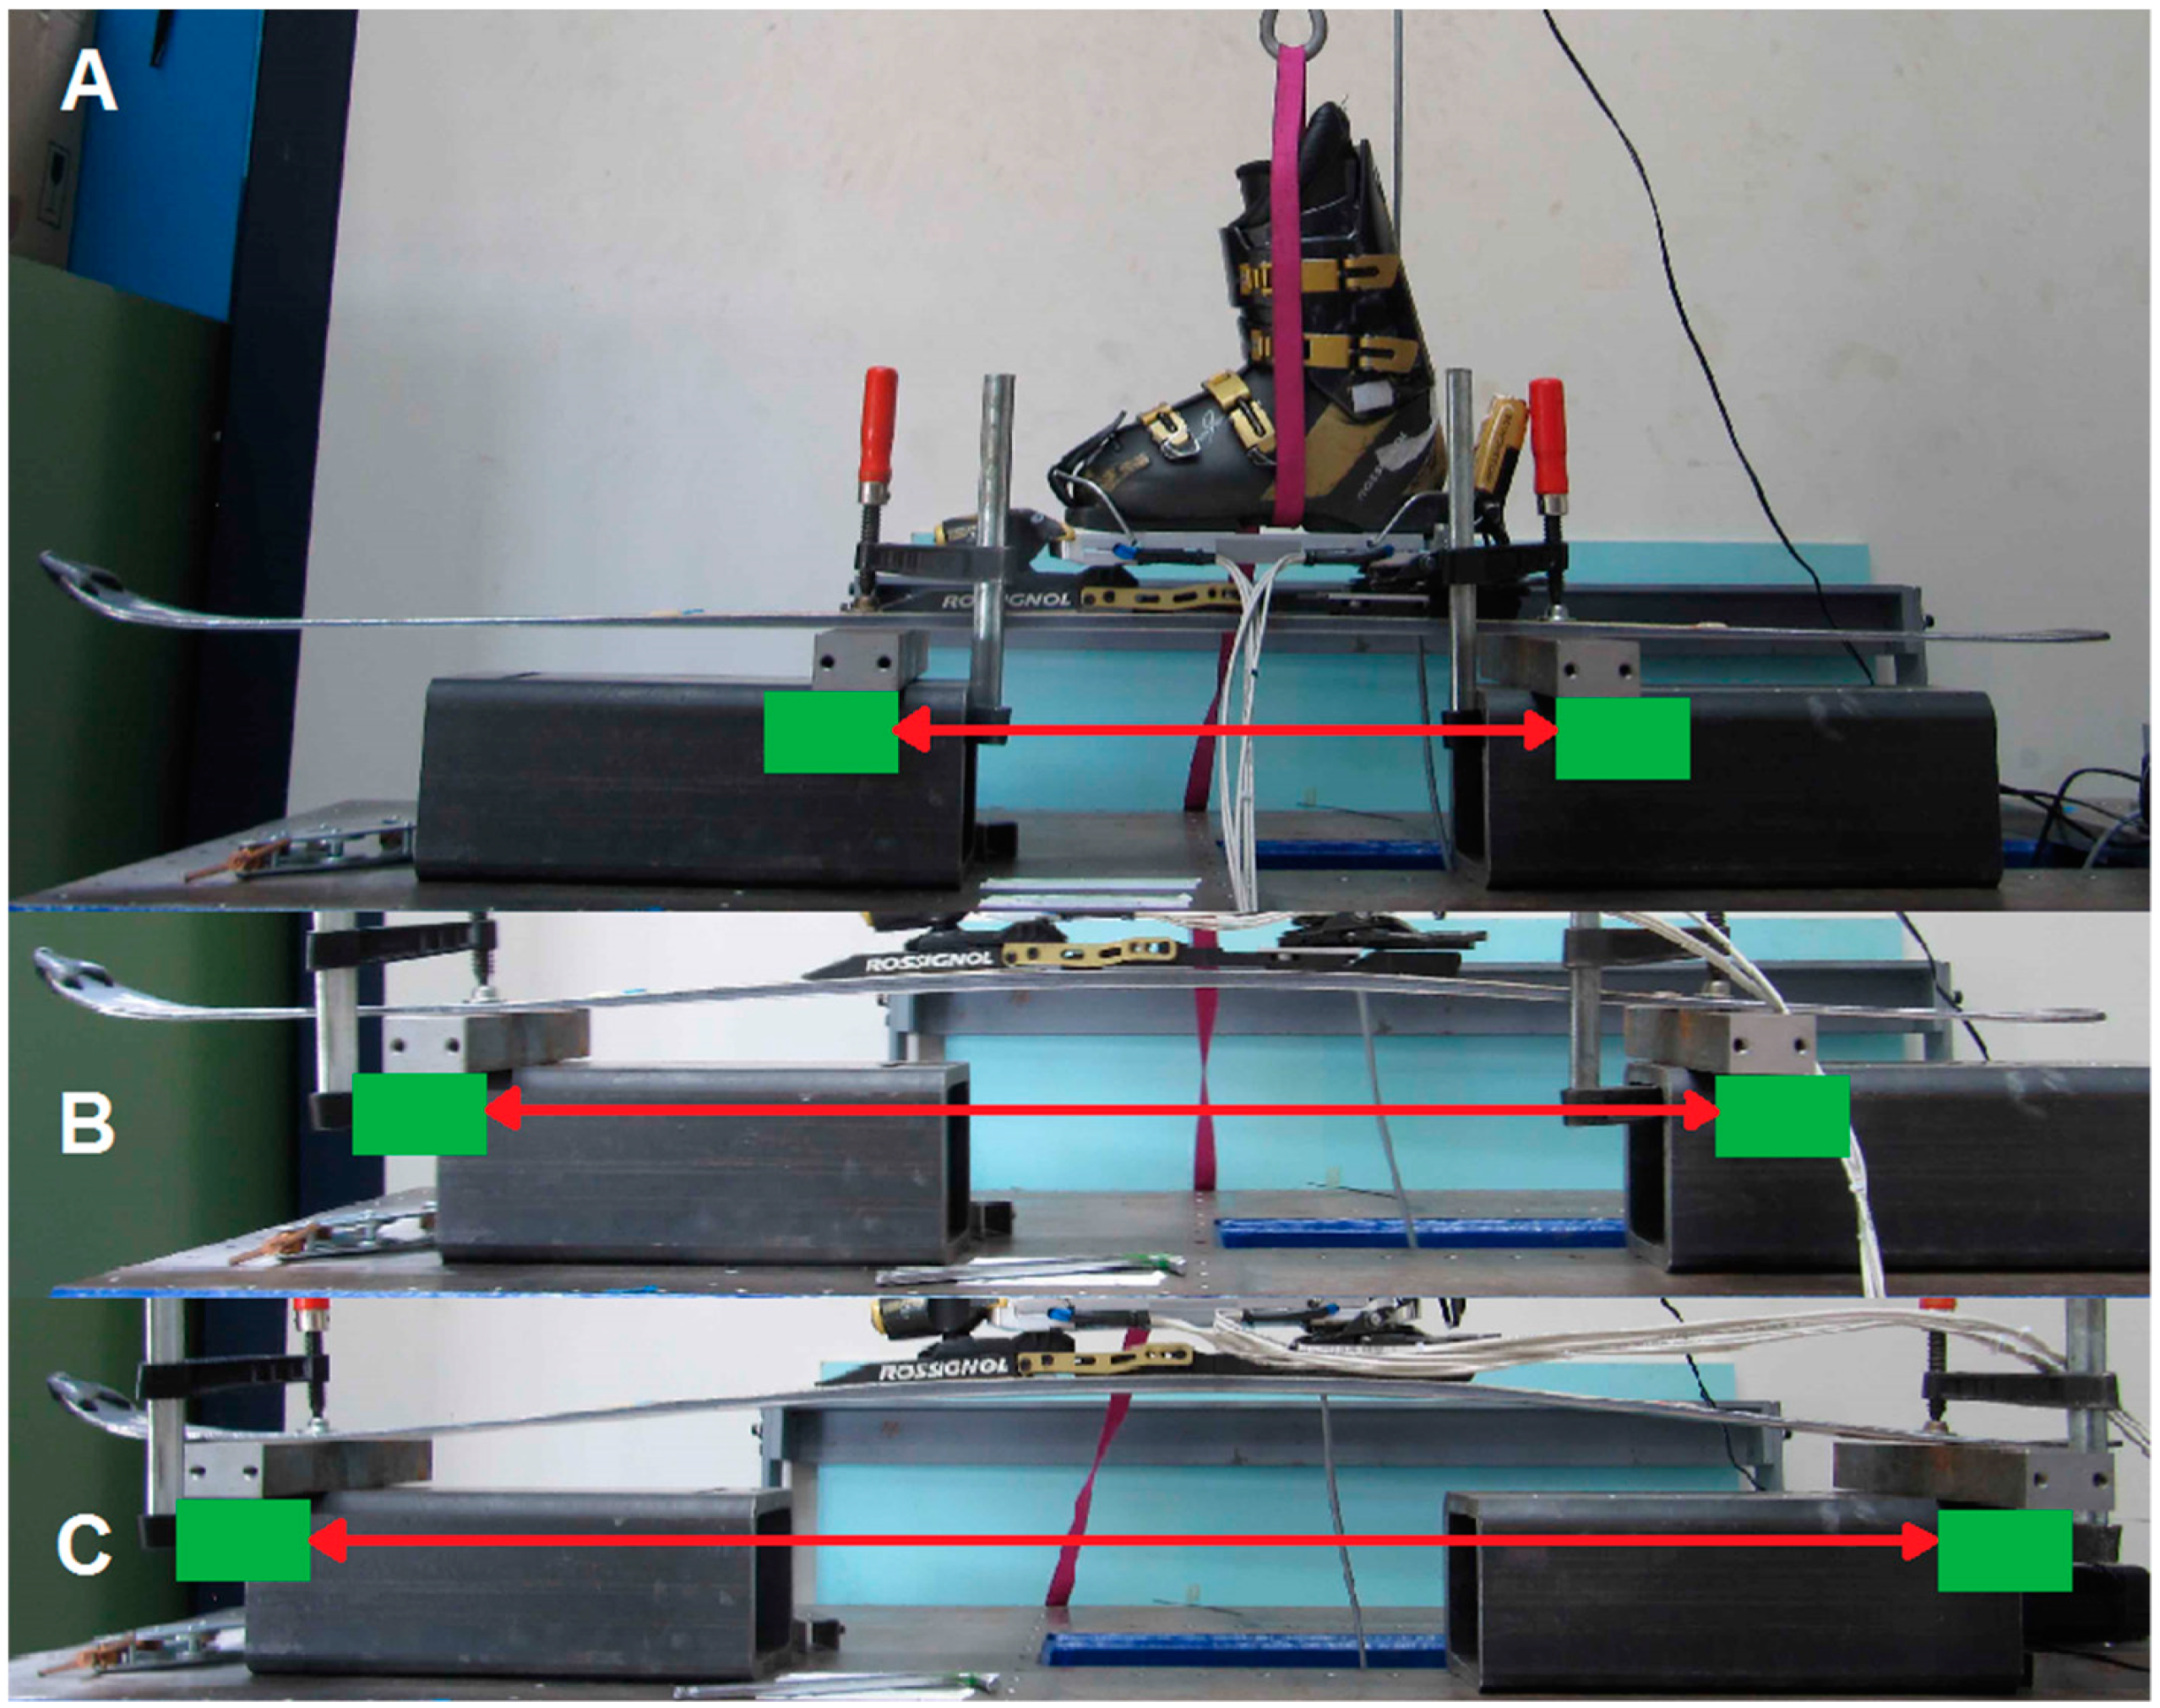
2.2. Calibration
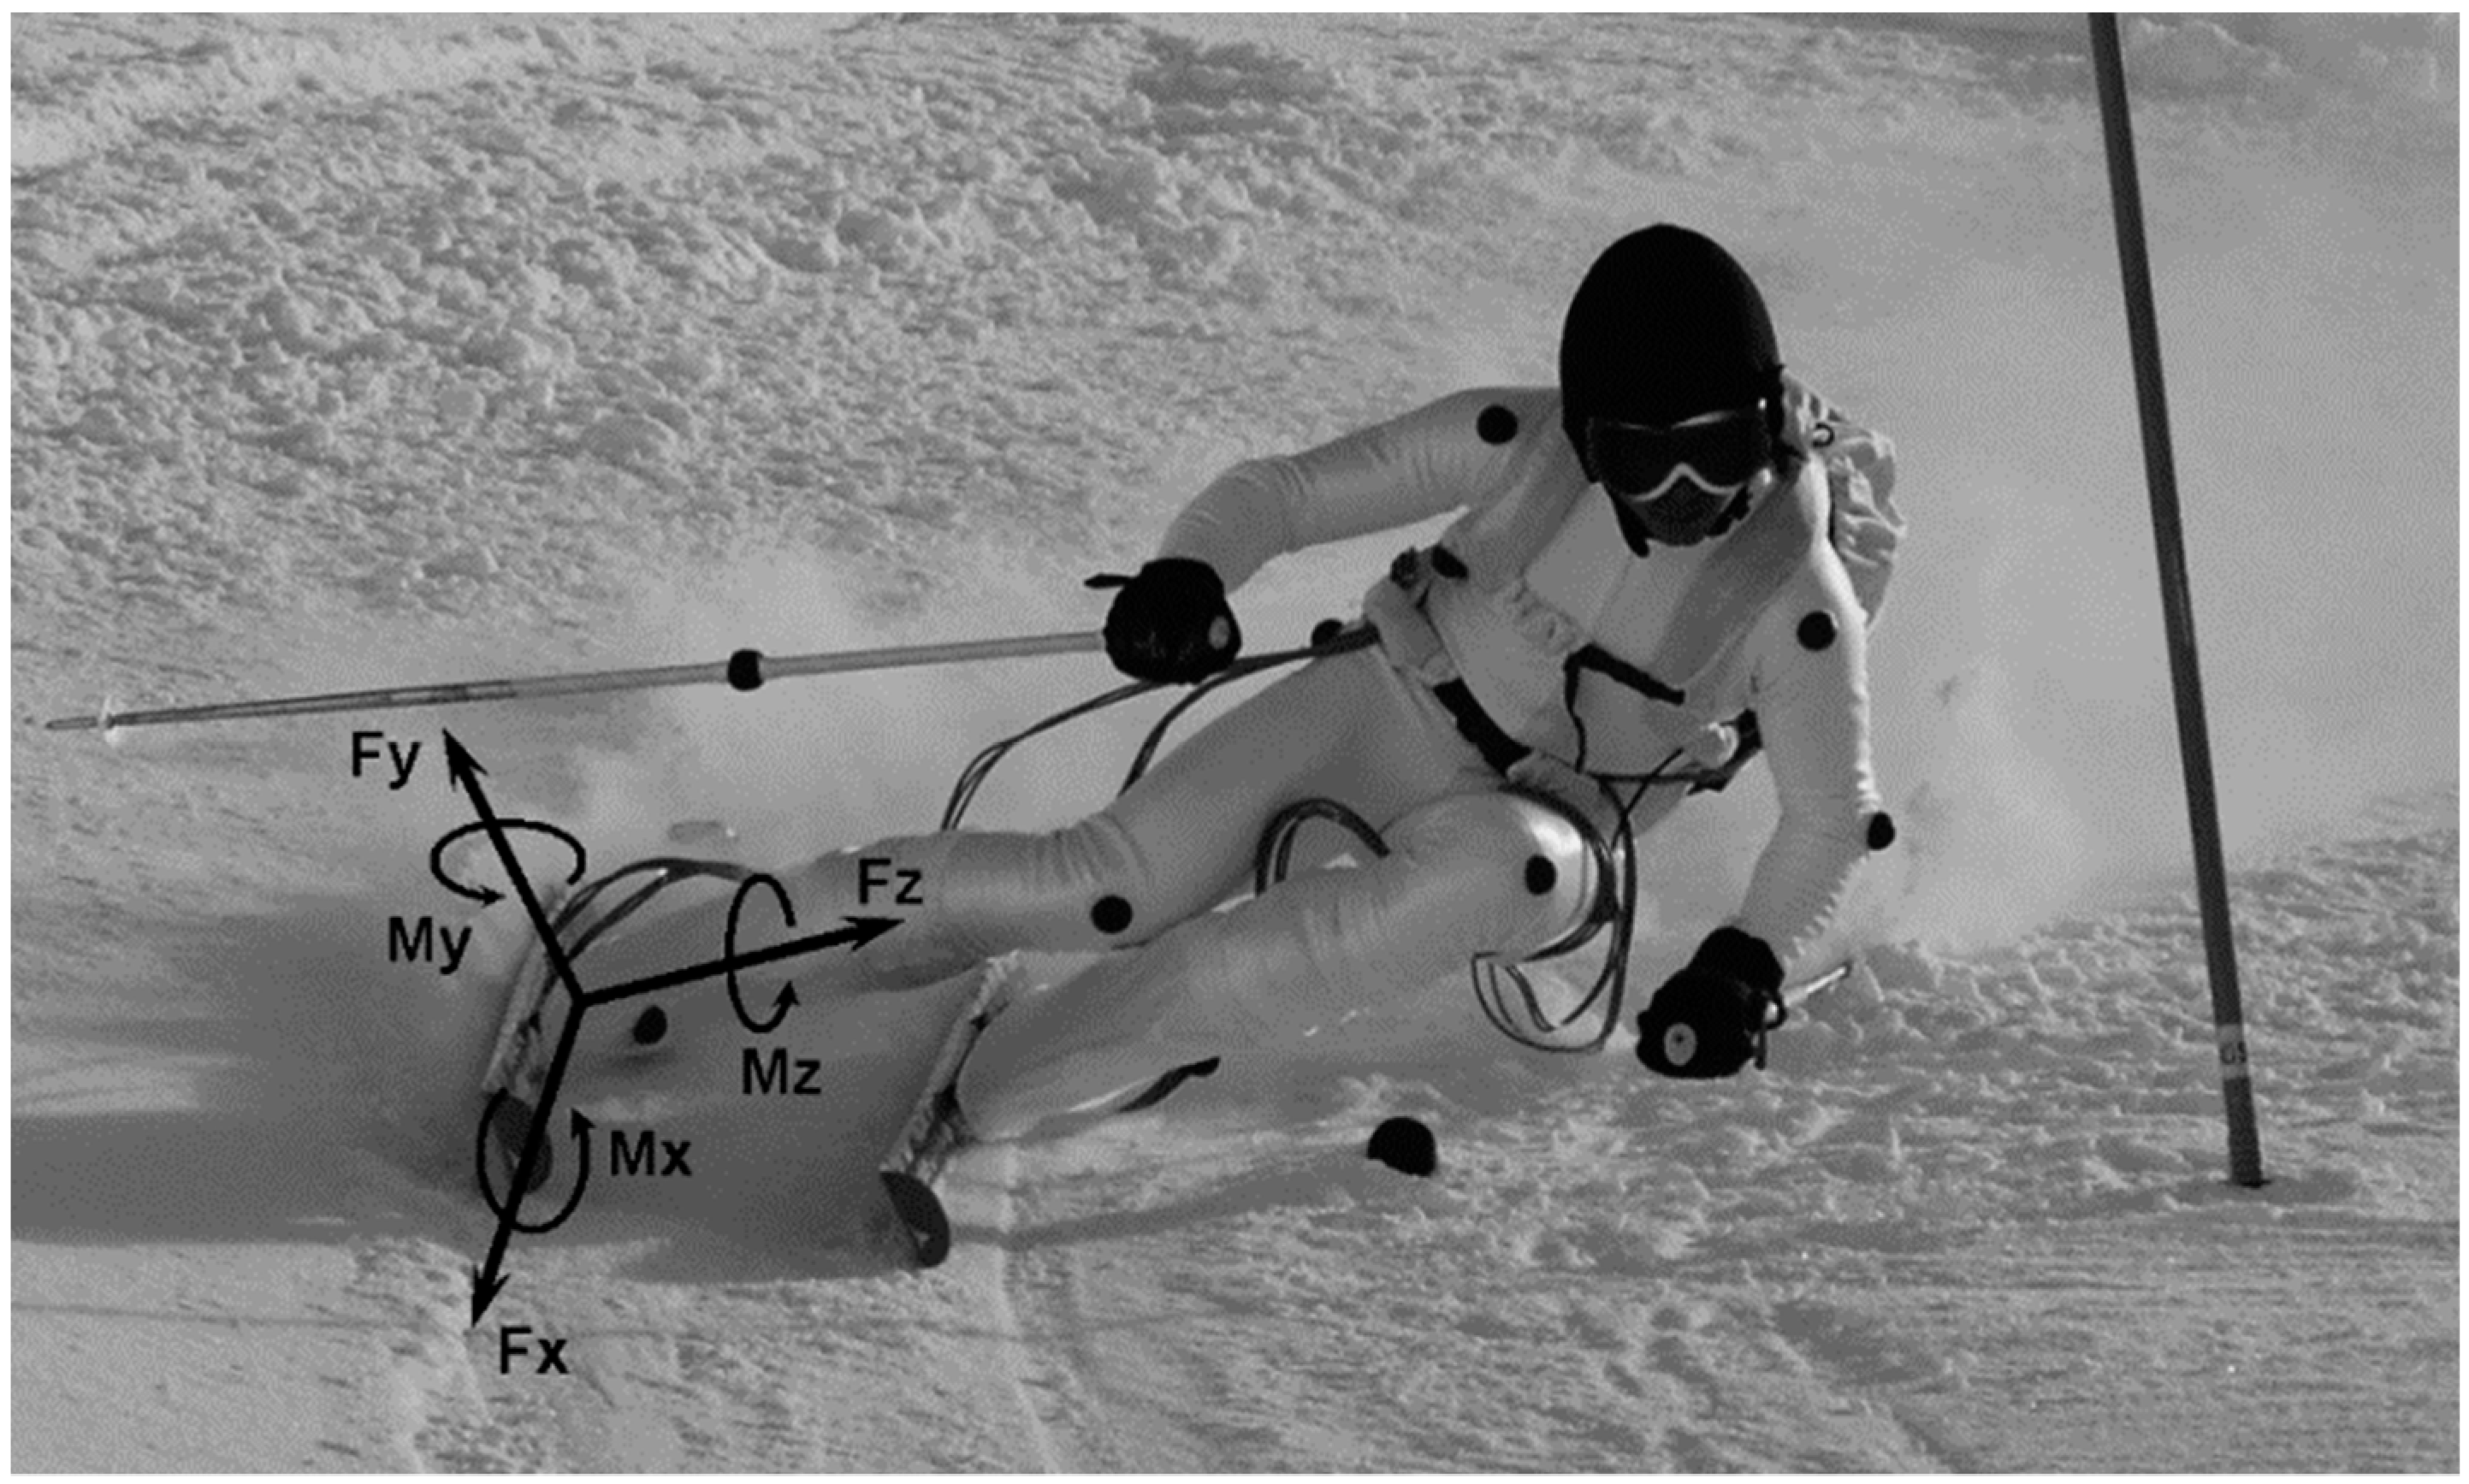
2.3. Field Test
3. Results
3.1. Calibration
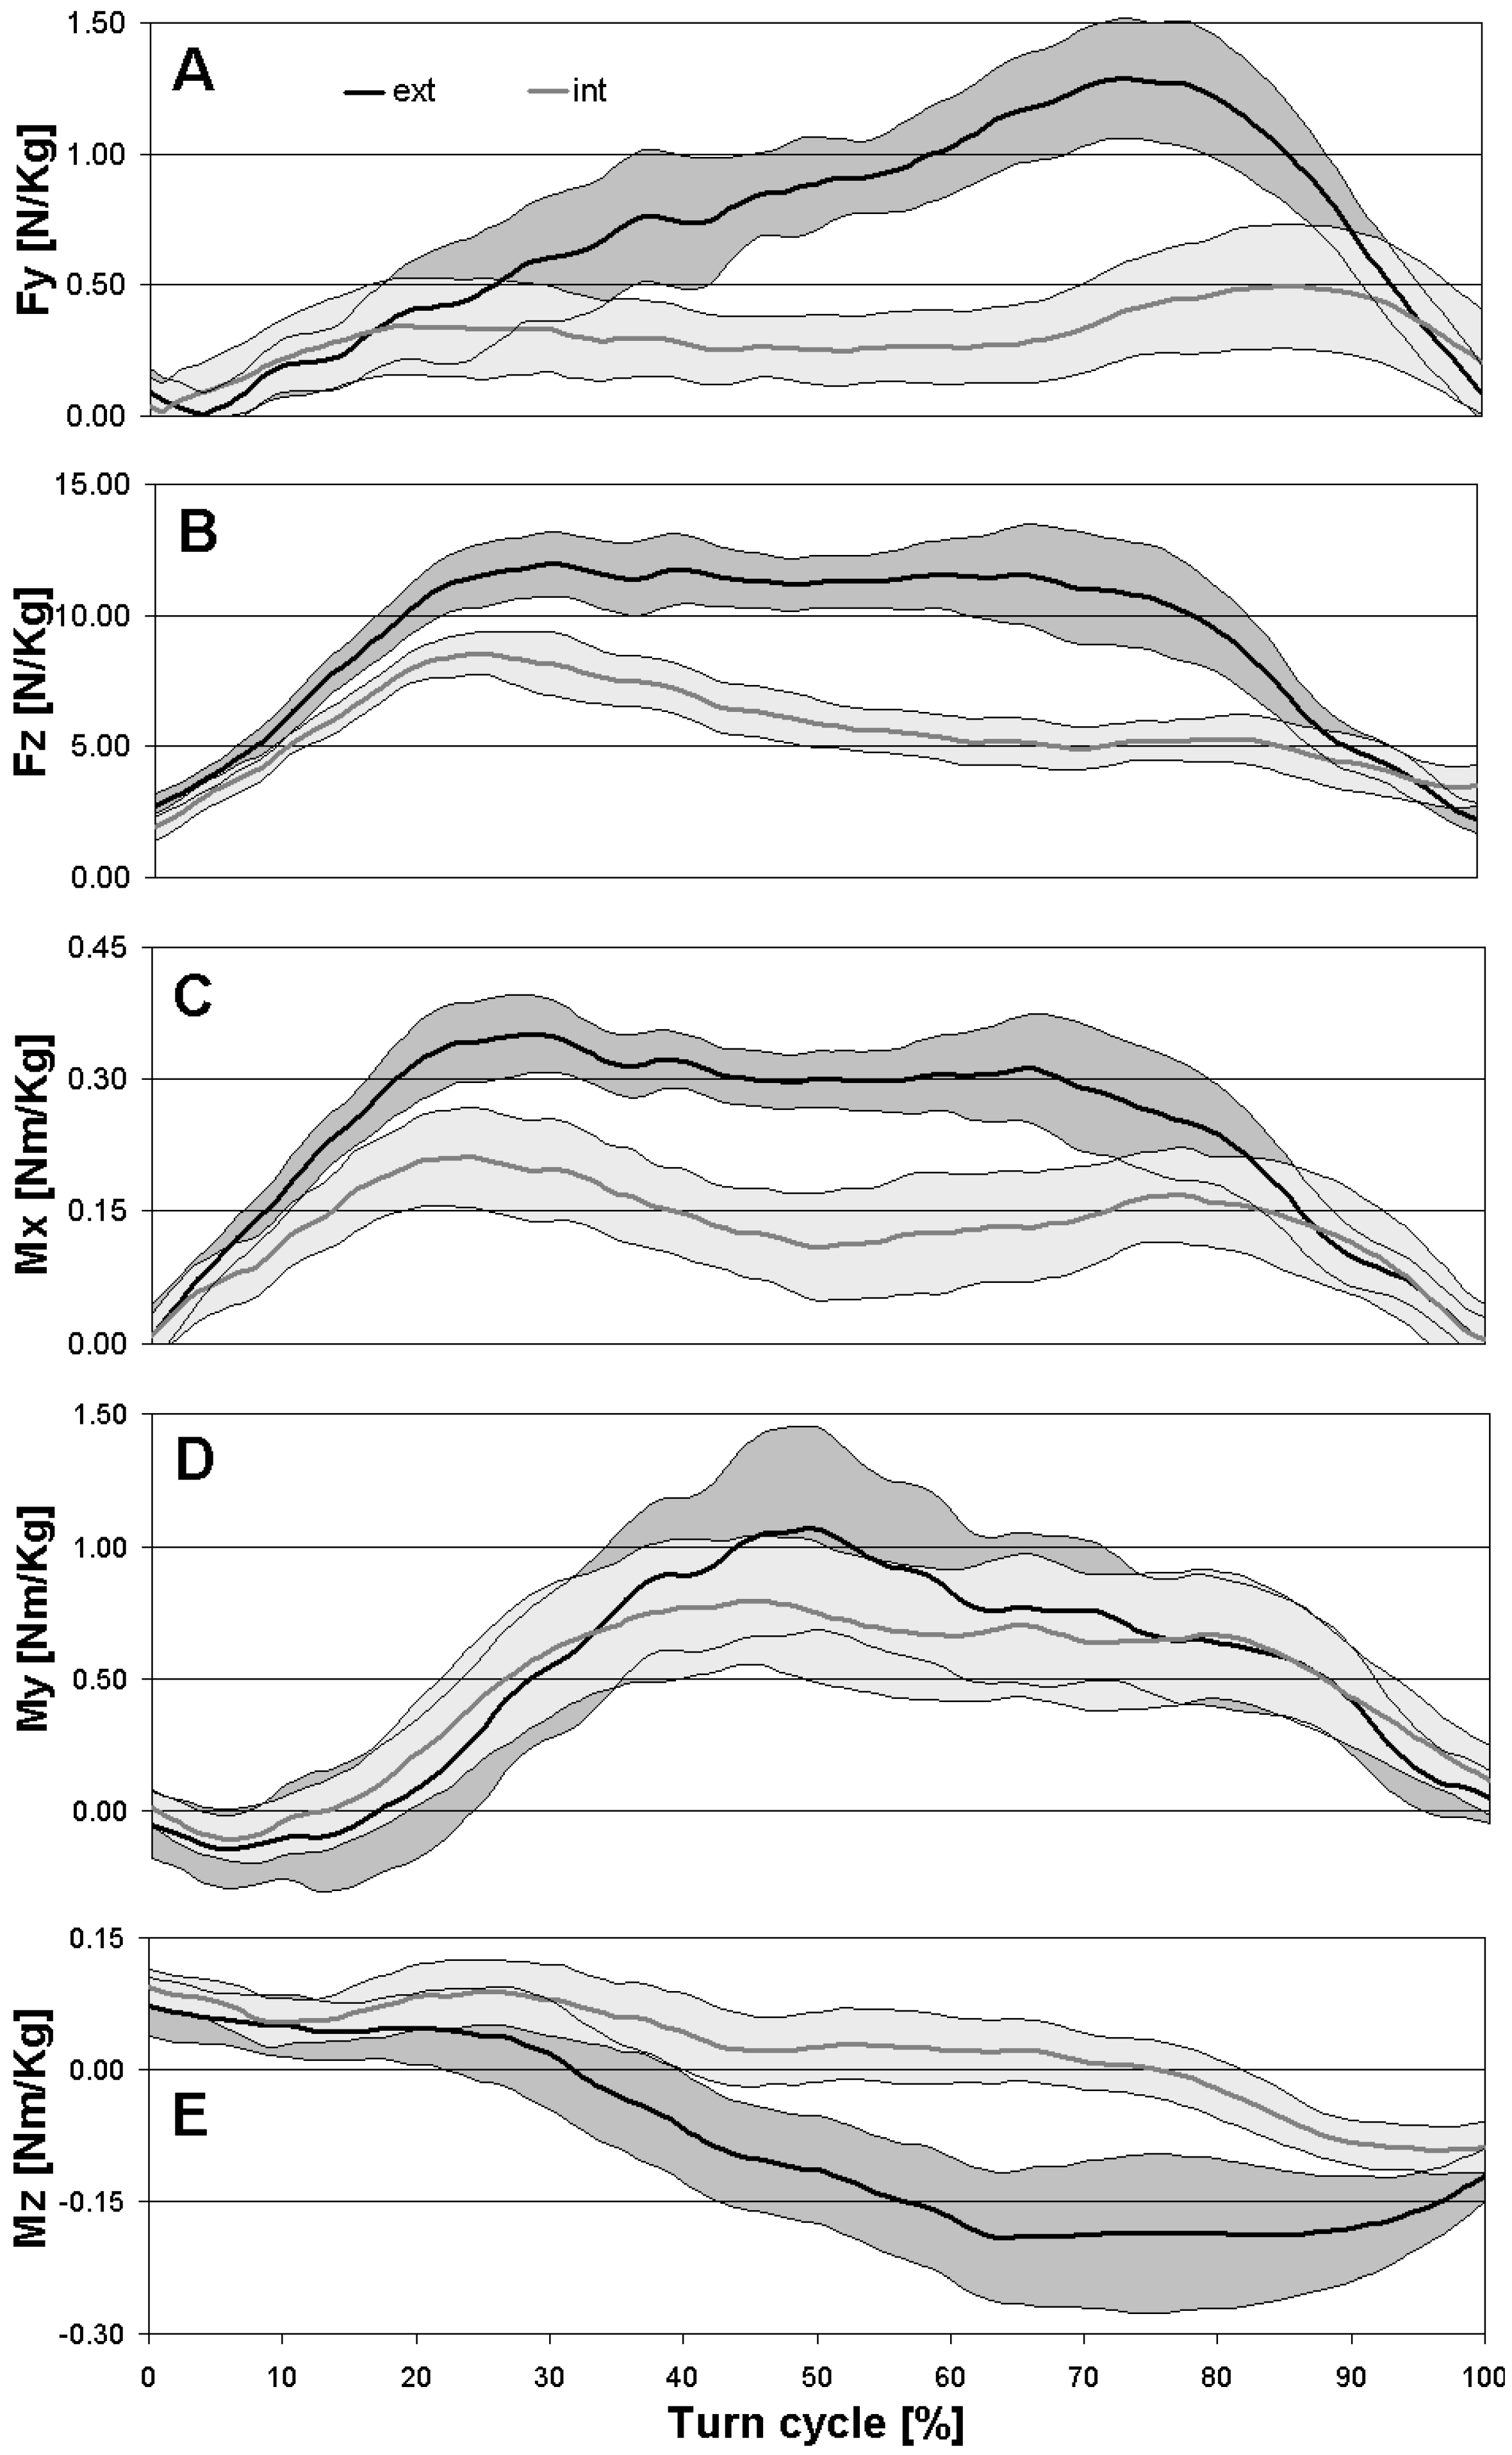
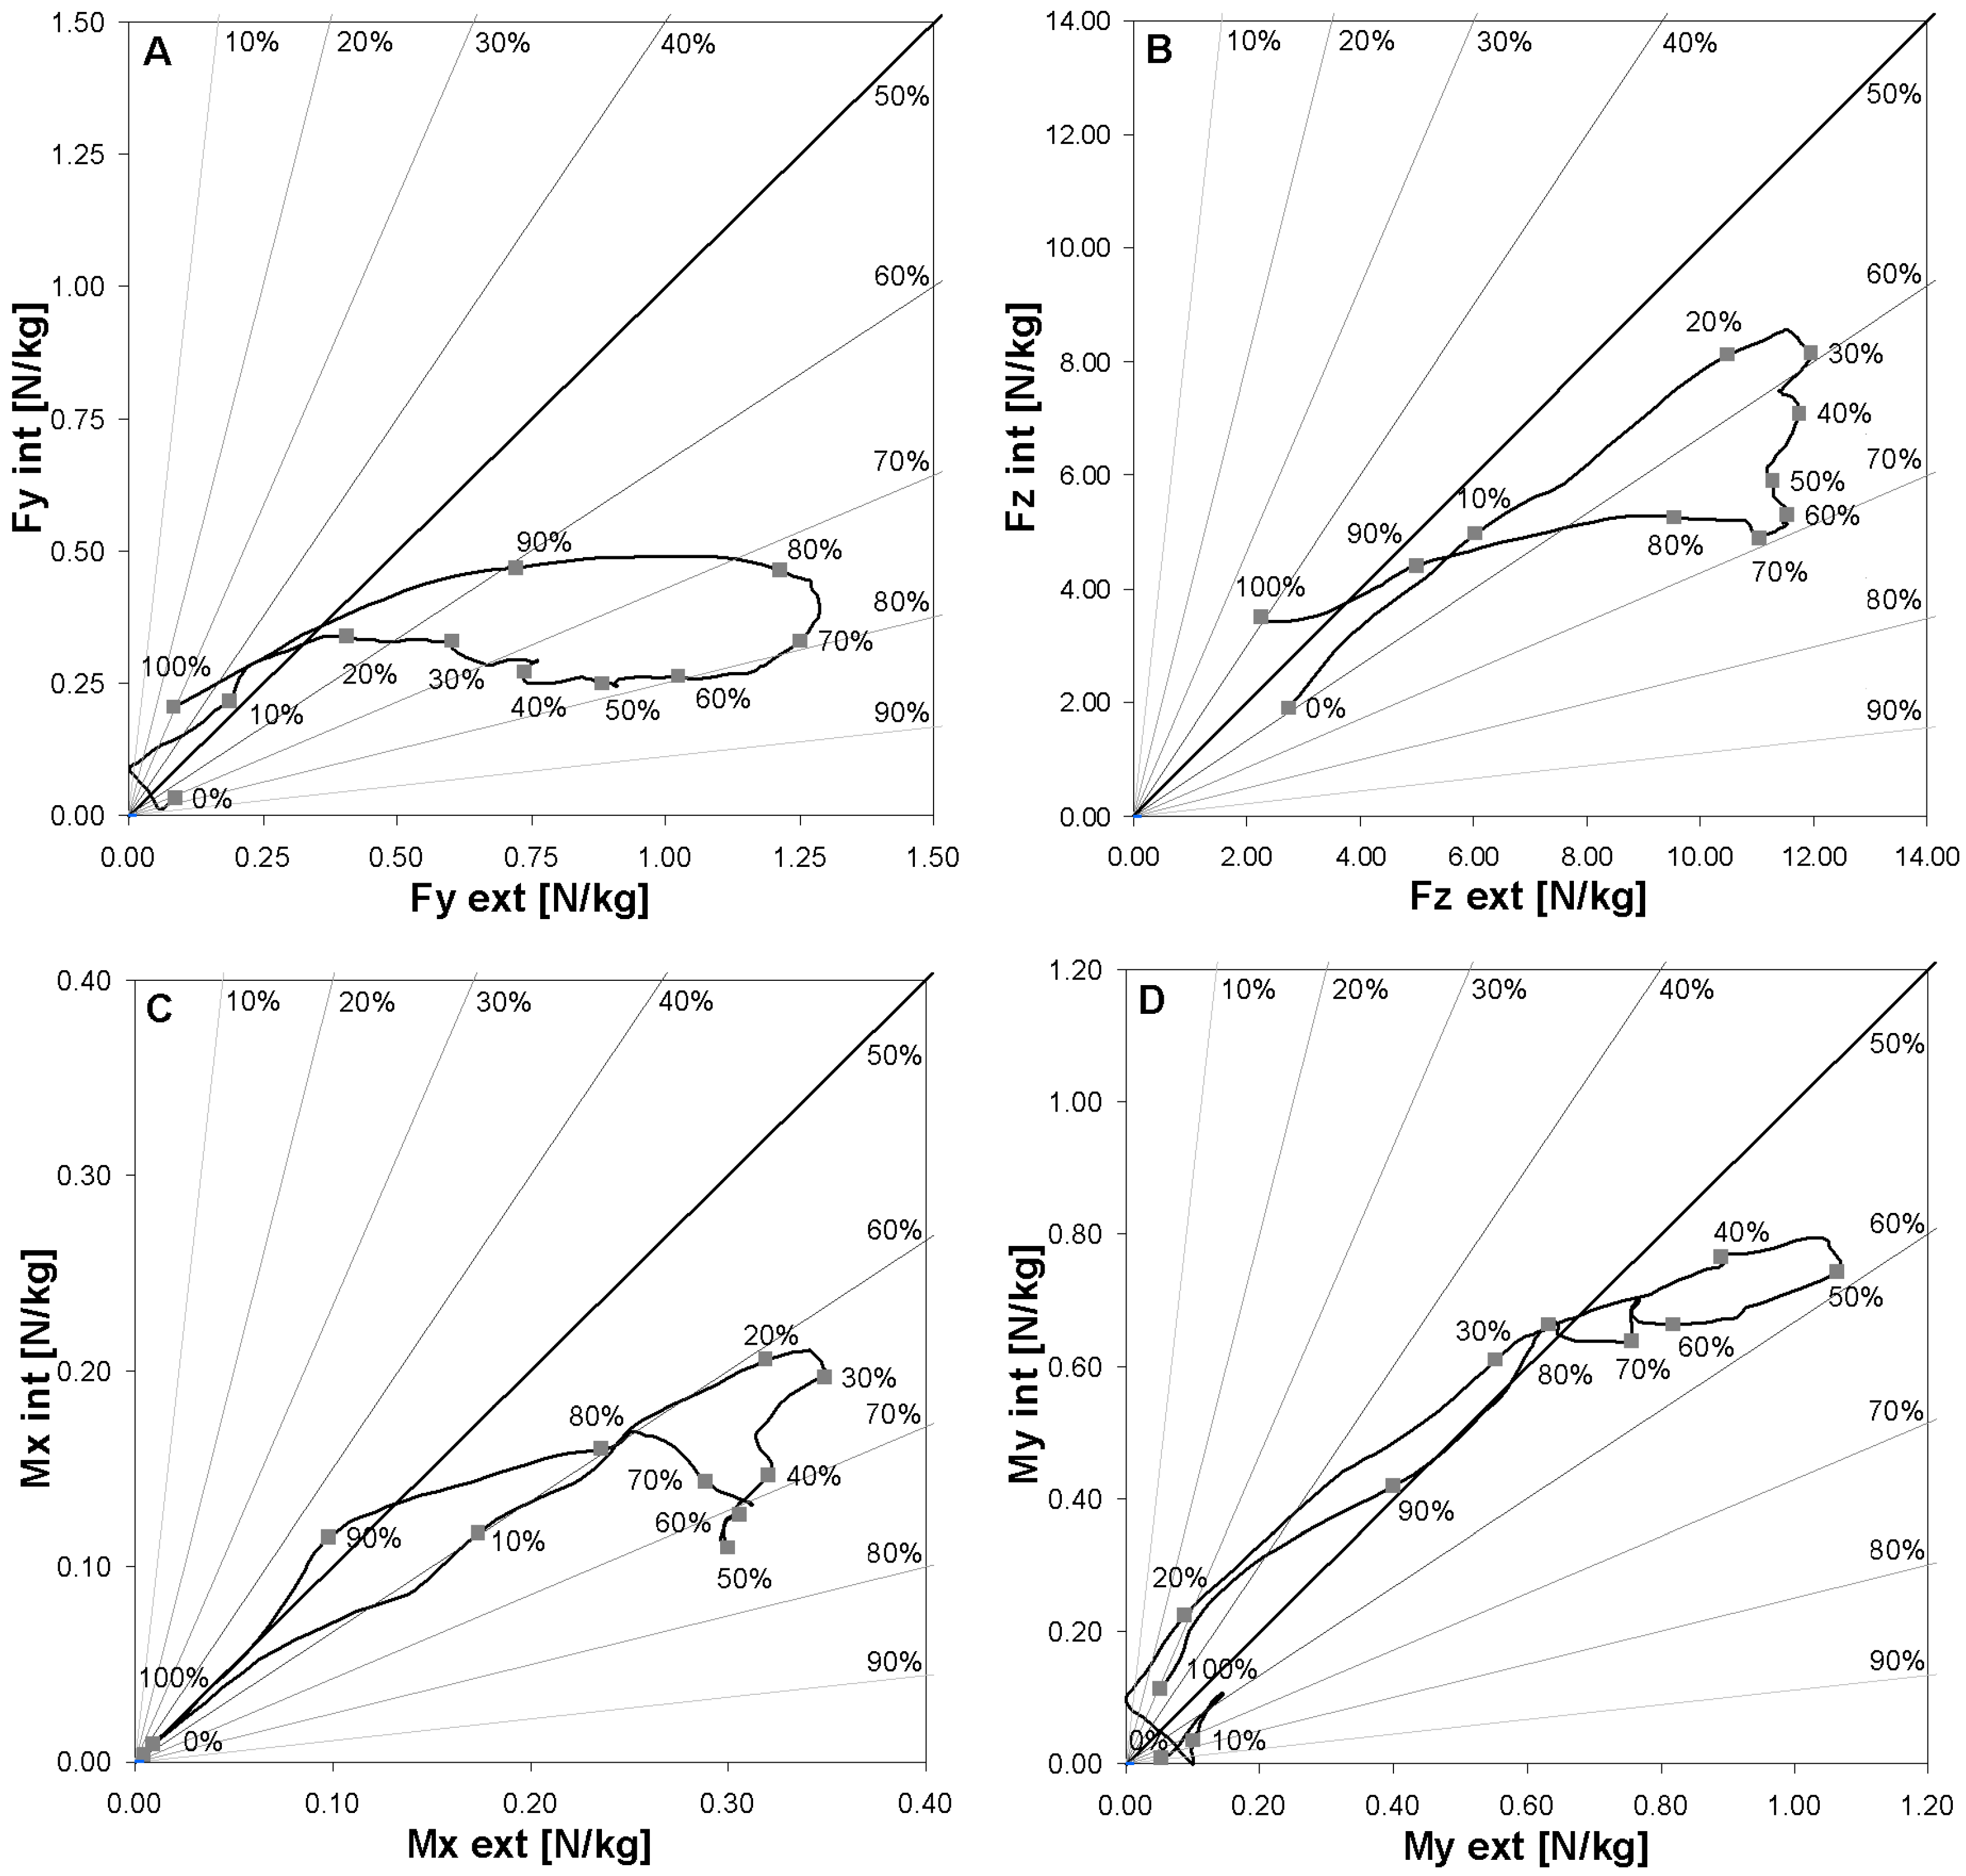
3.2. Field Test
4. Discussion
Author Contributions
Funding
Acknowledgments
Conflicts of Interest
References
- Hull, M.L.; Mote, C.D., Jr. Pulse code modulation telemetry in ski injury research. I. Instrumentation. Biotelemetry 1974, 1, 182–192. [Google Scholar] [PubMed]
- Hull, M.L.; Mote, C.D., Jr. Pulse code modulation telemetry in ski injury research. II. Preliminary results. Biotelemetry 1975, 2, 276. [Google Scholar] [PubMed]
- Hull, M.L.; Mote, C.D. Analysis of leg loading in snow skiing. J. Dyn. Syst. Meas. Control. 1978, 100, 177–186. [Google Scholar] [CrossRef]
- MacGregor, D.; Hull, M.L.; Dorius, L.K. A microcomputer controlled snow ski binding system-I. Instrumentation and field evaluation. J. Biomech. 1985, 18, 255–265. [Google Scholar] [CrossRef]
- MacGregor, D.; Hull, M.L. A microcomputer controlled snow ski binding system-II. Release decision theories. J. Biomech. 1985, 18, 267–275. [Google Scholar] [CrossRef]
- Wunderly, G.S.; Hull, M.L.; Maxwell, S. A second generation microcomputer controlled binding system for alpine skiing research. J. Biomech. 1988, 21, 299–318. [Google Scholar] [CrossRef]
- Quinn, T.P.; Mote, C.D. Optimal design of an uncoupled six-degree-of-freedom dynamometer. Exp. Mech. 1990, 30, 40–48. [Google Scholar] [CrossRef]
- Quinn, T.P.; Mote, C.D. Prediction of the loading along the leg during snow skiing. J. Biomech. 1992, 25, 609–625. [Google Scholar] [CrossRef]
- Wimmer, M.A.; Holzner, R. Constraint forces may influence the measurement of vertical ground reaction forces during slalom skiing. In Science and Skiing; Müller, E., Schwameder, H., Kornexl, E., Raschner, C., Eds.; Technical University of Hamburg-Harburg: Hamburg, Germany, 1997; Volume I, pp. 208–215. [Google Scholar]
- Jandova, S.; Lufinka, A.; Zubek, T. The dynamographic method application for alpine skiing. Hum. Mov. 2005, 5, 19–23. [Google Scholar]
- Klous, M.; Schwameder, H.; Müller, E. Joint loading on the lower extremities in skiing and snowboarding: methodological procedure. J. Biomech. 2006, 39, S187. [Google Scholar] [CrossRef]
- Knüz, B.; Nachbauer, W.; Schindelwig, K.; Brunner, F. Forces and moments at the boot sole during snowboarding. In Proceedings of the Second International Congress on Skiing and Science, St. Christoph a. Arlberg, Austria, 9–15 January 2000; pp. 242–249. [Google Scholar]
- Lüthi, A.; Federolf, P.; Fauve, M.; Oberhofer, K.; Rhyner, H.; Ammann, W.; Stricker, G.; Schiefermüller, C.; Eitzlmair, E.; Schwameder, H.; et al. Determination of forces in carving using three differents methods. In Science and Skiing III; Müller, E., Bacharach, D., Klika, R., Lindinger, S., Schwameder, H., Eds.; Meyer & Meyer Sport: Aachen, Germany, 2005; pp. 96–106. [Google Scholar]
- Stricker, G.; Scheiber, P.; Lindenhofer, E.; Müller, E. Determination of forces in alpine skiing and snowboarding: Validation of a mobile data acquisition system. Eur. J. Sport Sci. 2010, 10, 31–41. [Google Scholar] [CrossRef]
- Moritz, E.F.; Haake, S.; Kiefmann, A.; Krinninger, M.; Lindemann, U.; Senner, V.; Spitzenpfeil, P. A New Six Component Dynamometer for Measuring Ground Reaction Forces in Alpine Skiing. In The Engineering of Sport 6; Springer: New York, NY, USA, 2006. [Google Scholar]
- Kurpiers, N.; Kersting, U.-G.; McAlpine, P.R. Effect of a mock-up force plate on riding technique and perception—A prerequisite for a comprehensive biomechanical analysis in modul skiing. In Proceedings of the 4th International Congress on Science and Skiing, St. Christoph am Arlberg, Austria, 14–20 December 2007; pp. 327–336. [Google Scholar]
- Antonsson, E.K.; Mann, R.W. The frequency content of gait. J. Biomech. 1985, 18, 39–47. [Google Scholar] [CrossRef]
- Müller, E.; Bartlett, R.; Raschner, C.; Schwameder, H.; Benko-Bernwick, U.; Lindinger, S. Comparisons of the ski turn techniques of experienced and intermediate skiers. J. Sports Sci. 1998. [Google Scholar] [CrossRef] [PubMed]
- Hoffmann, K. Applying the wheatstone bridge circuit. Resour. Am. Lit. Study 2001, 27, 291–294. [Google Scholar]
- Cubells-Beltran, M.D.; Reig, C.; Munoz, D.R.; de Freitas, S.I.P.C.; de Freitas, P.J.P. Full Wheatstone Bridge Spin-Valve Based Sensors for IC Currents Monitoring. IEEE Sens. J. 2009, 9, 1756–1762. [Google Scholar] [CrossRef]
- Nakazato, K.; Scheiber, P.; Müller, E. A comparison of ground reaction forces determined by portable force-plate and pressure-insole systems in alpine skiing. J. Sport. Sci. Med. 2011, 10, 754. [Google Scholar]
- Gilgien, M.; Spörri, J.; Chardonnens, J.; Kröll, J.; Müller, E. Determination of External Forces in Alpine Skiing Using a Differential Global Navigation Satellite System. Sensors 2013, 13, 9821–9835. [Google Scholar] [CrossRef] [PubMed] [Green Version]
- Logar, G.; Munih, M. Estimation of joint forces and moments for the in-run and take-off in ski jumping based on measurements with wearable inertial sensors. Sensors 2015, 15, 11258–11276. [Google Scholar] [CrossRef] [PubMed]
- Chardonnens, J.; Favre, J.; Cuendet, F.; Gremion, G.; Aminian, K. Measurement of the dynamics in ski jumping using a wearable inertial sensor-based system. J. Sports Sci. 2014, 32, 591–600. [Google Scholar] [CrossRef] [PubMed]
- Meyer, F.; Waegli, A.; Ducret, S.; Skaloud, J.P.R. Assessment of timing and performance based on trajectories from low-cost GPS/INS positioning. In Science and Skiing IV; Müller, E., Lindinger, S., Stöggl, T., Eds.; University of Salzburg: Salzburg, Austria, 2009; pp. 556–564. [Google Scholar]


| Test | Ski | Condition | Loading Position | |||
|---|---|---|---|---|---|---|
| [kg/V] | [kg/V] | [Nm/V] | ||||
| 1 | With ski | Standard | Front | 0.46 | 1.57 | 0.73 |
| Back | 0.51 | 1.56 | 0.75 | |||
| 2 | Without ski | Standard | Front | - | - | 0.74 |
| Back | - | - | 0.73 | |||
| 3 | Without ski | Loads applied with offset | Front | - | 1.16 | - |
| Back | - | 1.38 | - | |||
| Front | - | 1.3 | - | |||
| Back | - | 1.11 | - | |||
| Front | - | 1.32 | - | |||
| Back | - | 1.24 | - | |||
| 4 | Without ski | Positive and negative loads | Front | - | 1.34 | - |
| Back | - | 1.34 | - | |||
| 5 | With ski and | 0.5 m attachment distance | Centered | - | 1.23 | - |
| With boot | 0.9 m attachment distance | Centered | - | 1.1 | - | |
| 1.3 m attachment distance | Centered | - | 1.03 | - | ||
| Mean | 0.49 | 1.28 | 0.74 | |||
| Standard Deviation (SD) | 0.04 | 0.21 | 0.01 | |||
© 2019 by the authors. Licensee MDPI, Basel, Switzerland. This article is an open access article distributed under the terms and conditions of the Creative Commons Attribution (CC BY) license (http://creativecommons.org/licenses/by/4.0/).
Share and Cite
Meyer, F.; Prenleloup, A.; Schorderet, A. Development of a New Embedded Dynamometer for the Measurement of Forces and Torques at the Ski-Binding Interface. Sensors 2019, 19, 4324. https://doi.org/10.3390/s19194324
Meyer F, Prenleloup A, Schorderet A. Development of a New Embedded Dynamometer for the Measurement of Forces and Torques at the Ski-Binding Interface. Sensors. 2019; 19(19):4324. https://doi.org/10.3390/s19194324
Chicago/Turabian StyleMeyer, Frédéric, Alain Prenleloup, and Alain Schorderet. 2019. "Development of a New Embedded Dynamometer for the Measurement of Forces and Torques at the Ski-Binding Interface" Sensors 19, no. 19: 4324. https://doi.org/10.3390/s19194324