Design and Application of a Metamaterial Superstrate on a Bio-Inspired Antenna for Partial Discharge Detection through Dielectric Windows

 ,
,  , , , and
Abstract
:1. Introduction
2. Printed Monopole Antenna (PMA)
3. Metamaterials: Concept and Design
4. Material and Methods
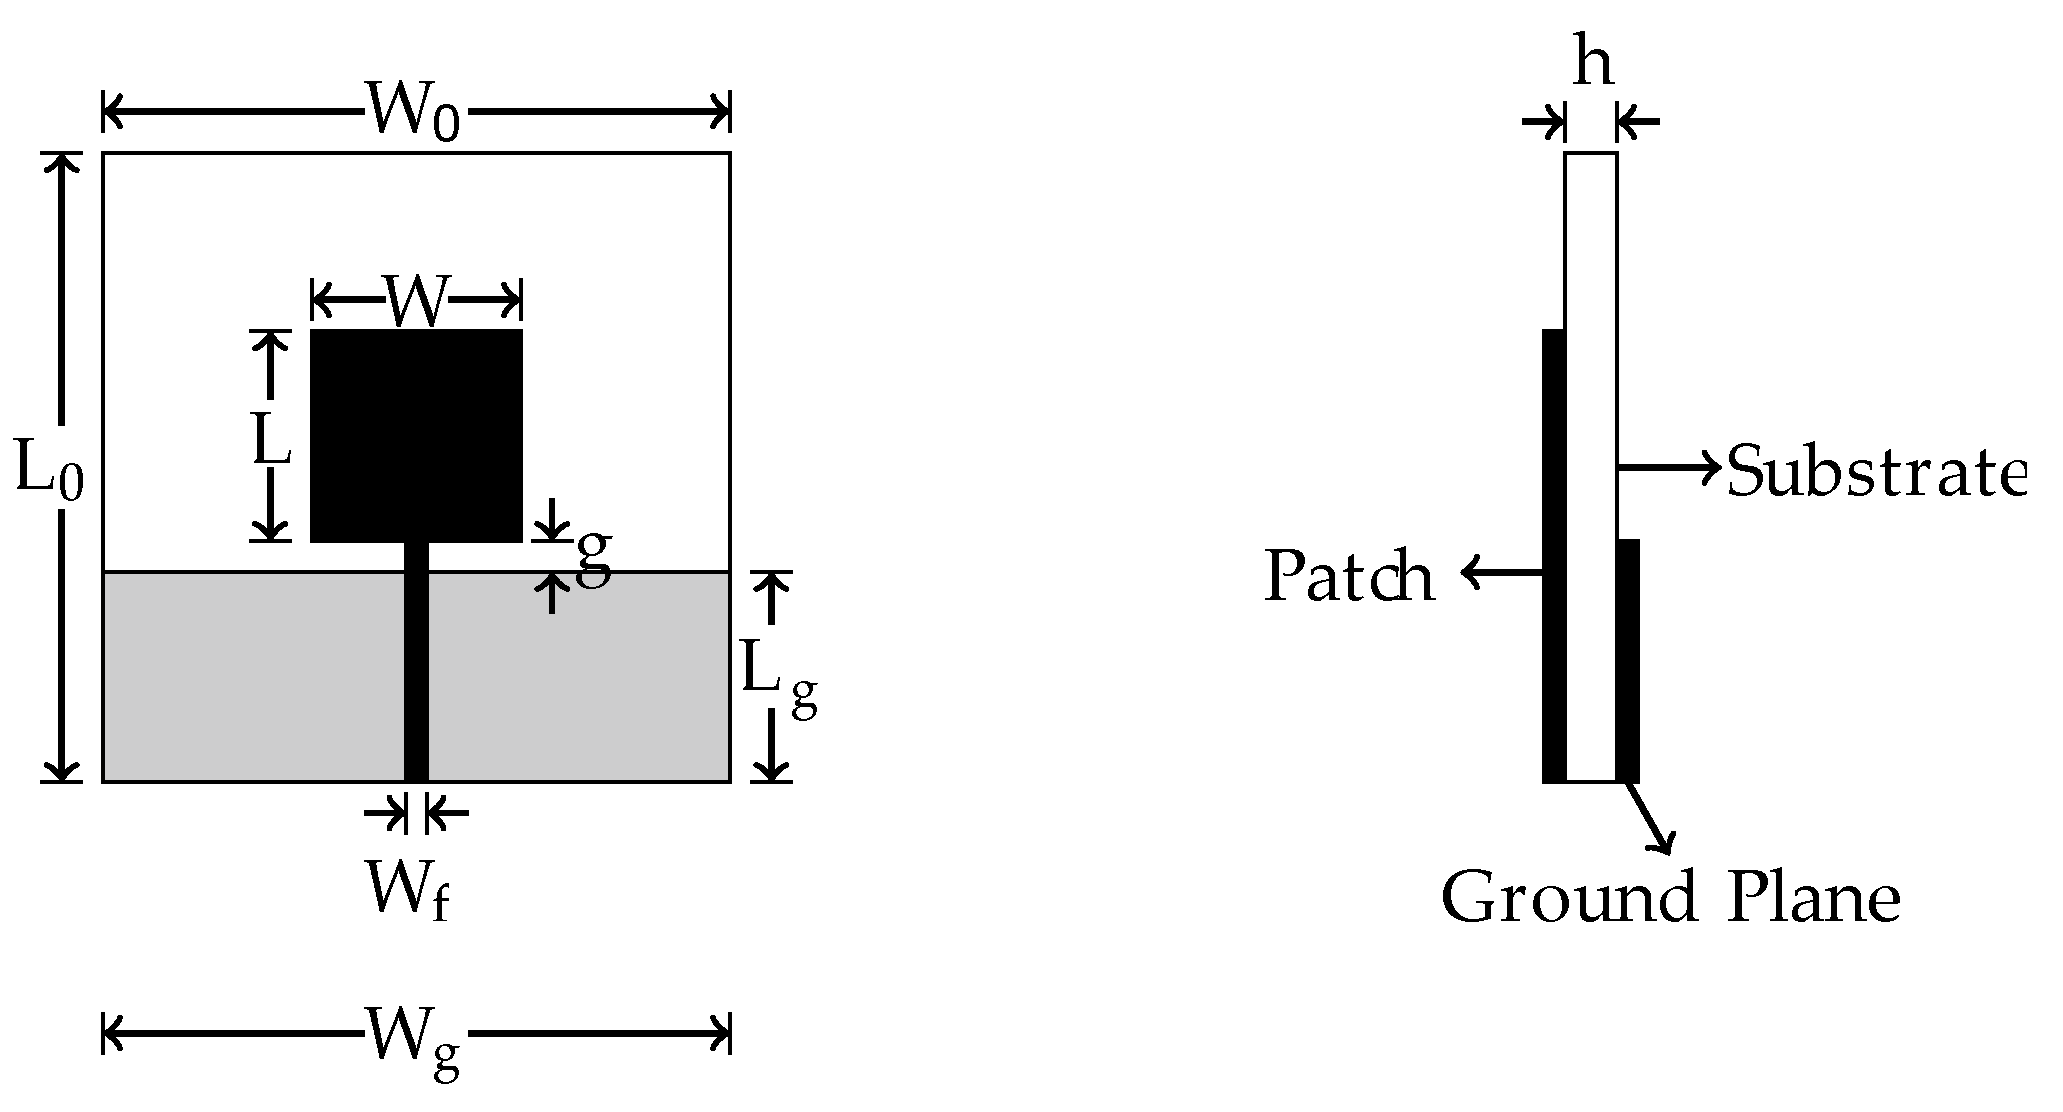
4.1. Bio-Inspired PMA Design
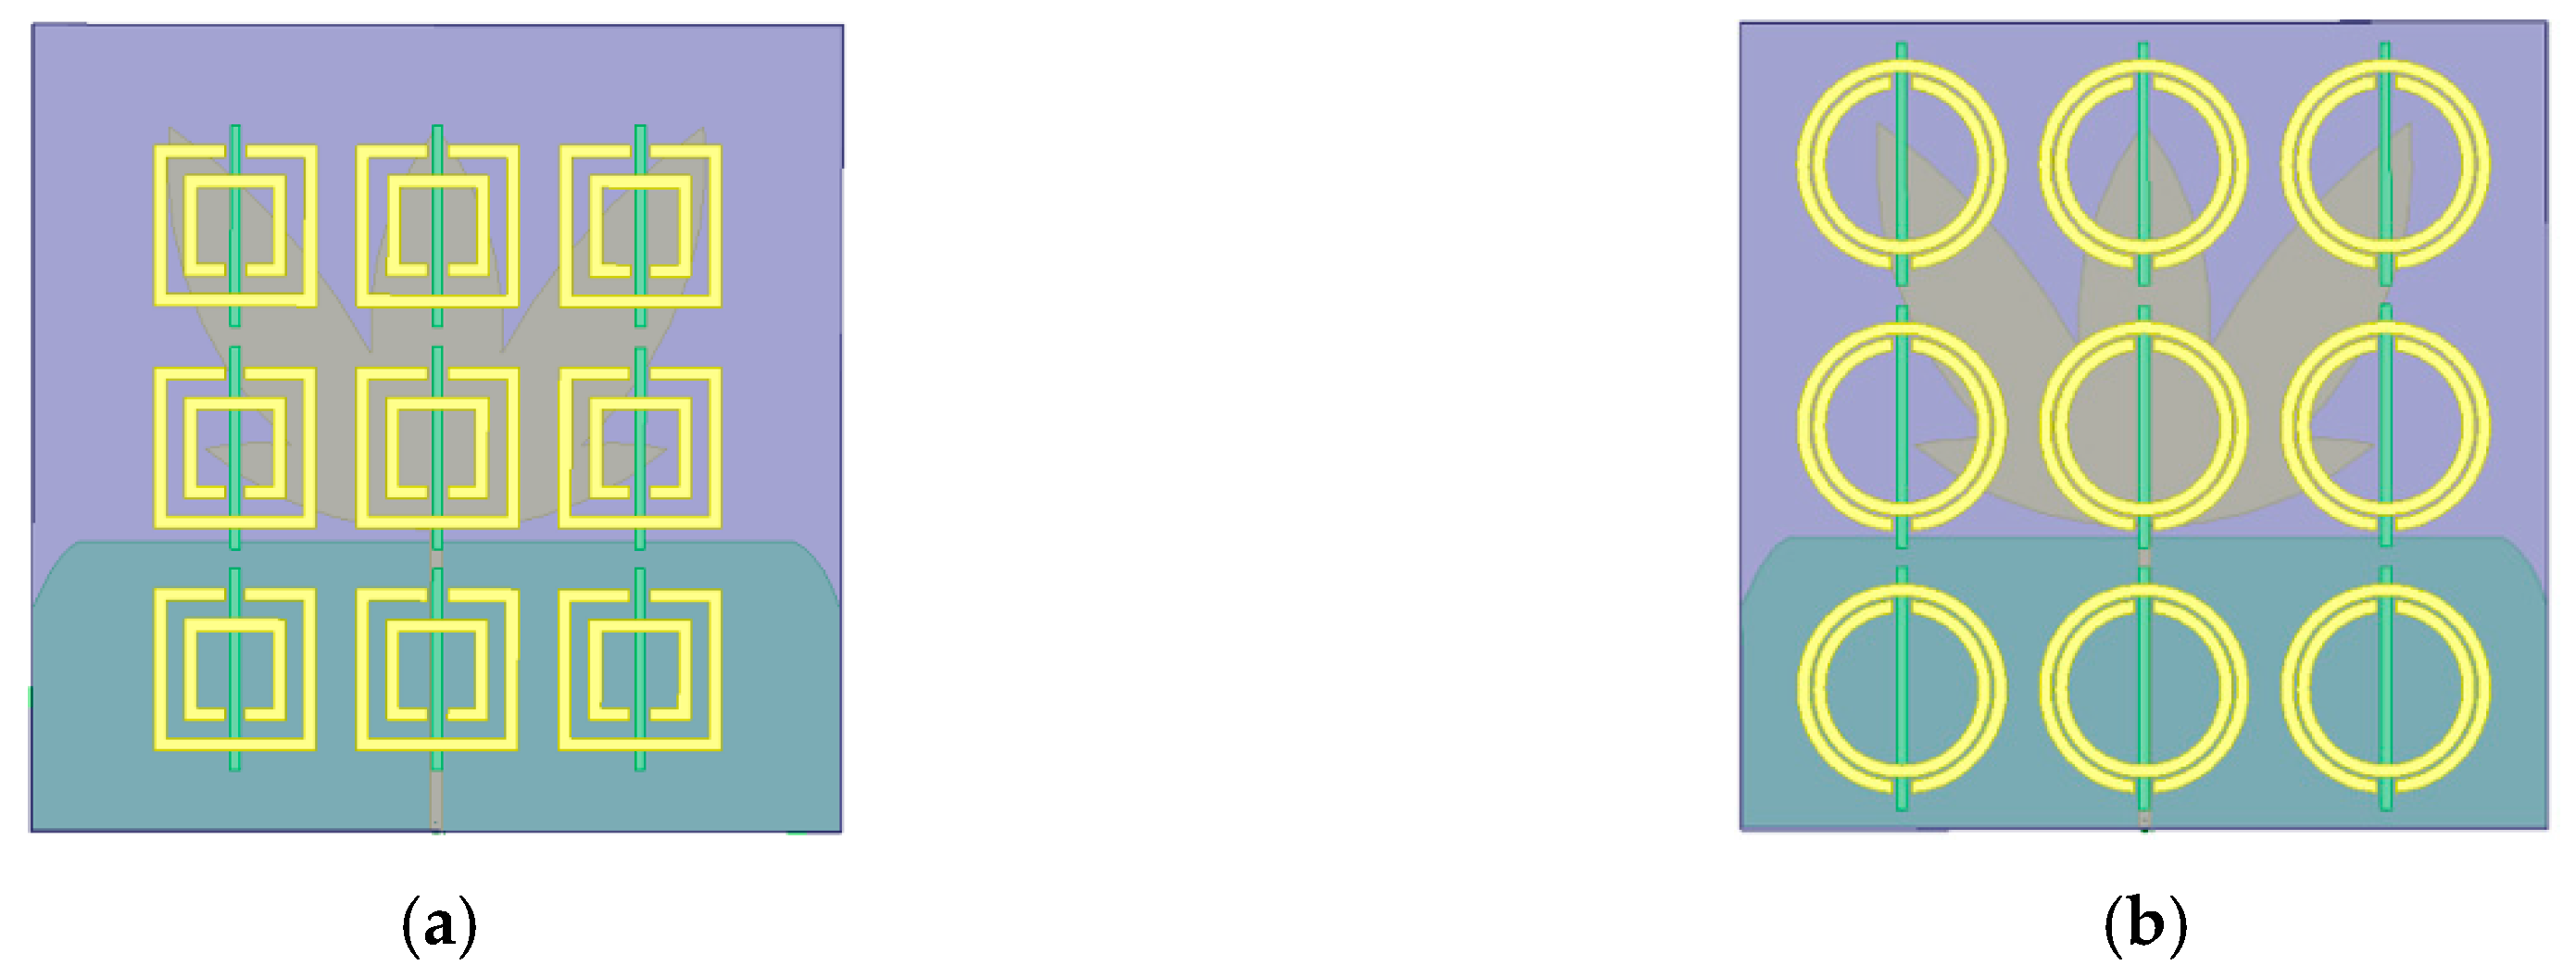
4.2. Metamaterial Unit Cell Simulations
4.3. Metamaterial Superstrate Simulations
4.4. Reflection Coefficient and Gain Measurements
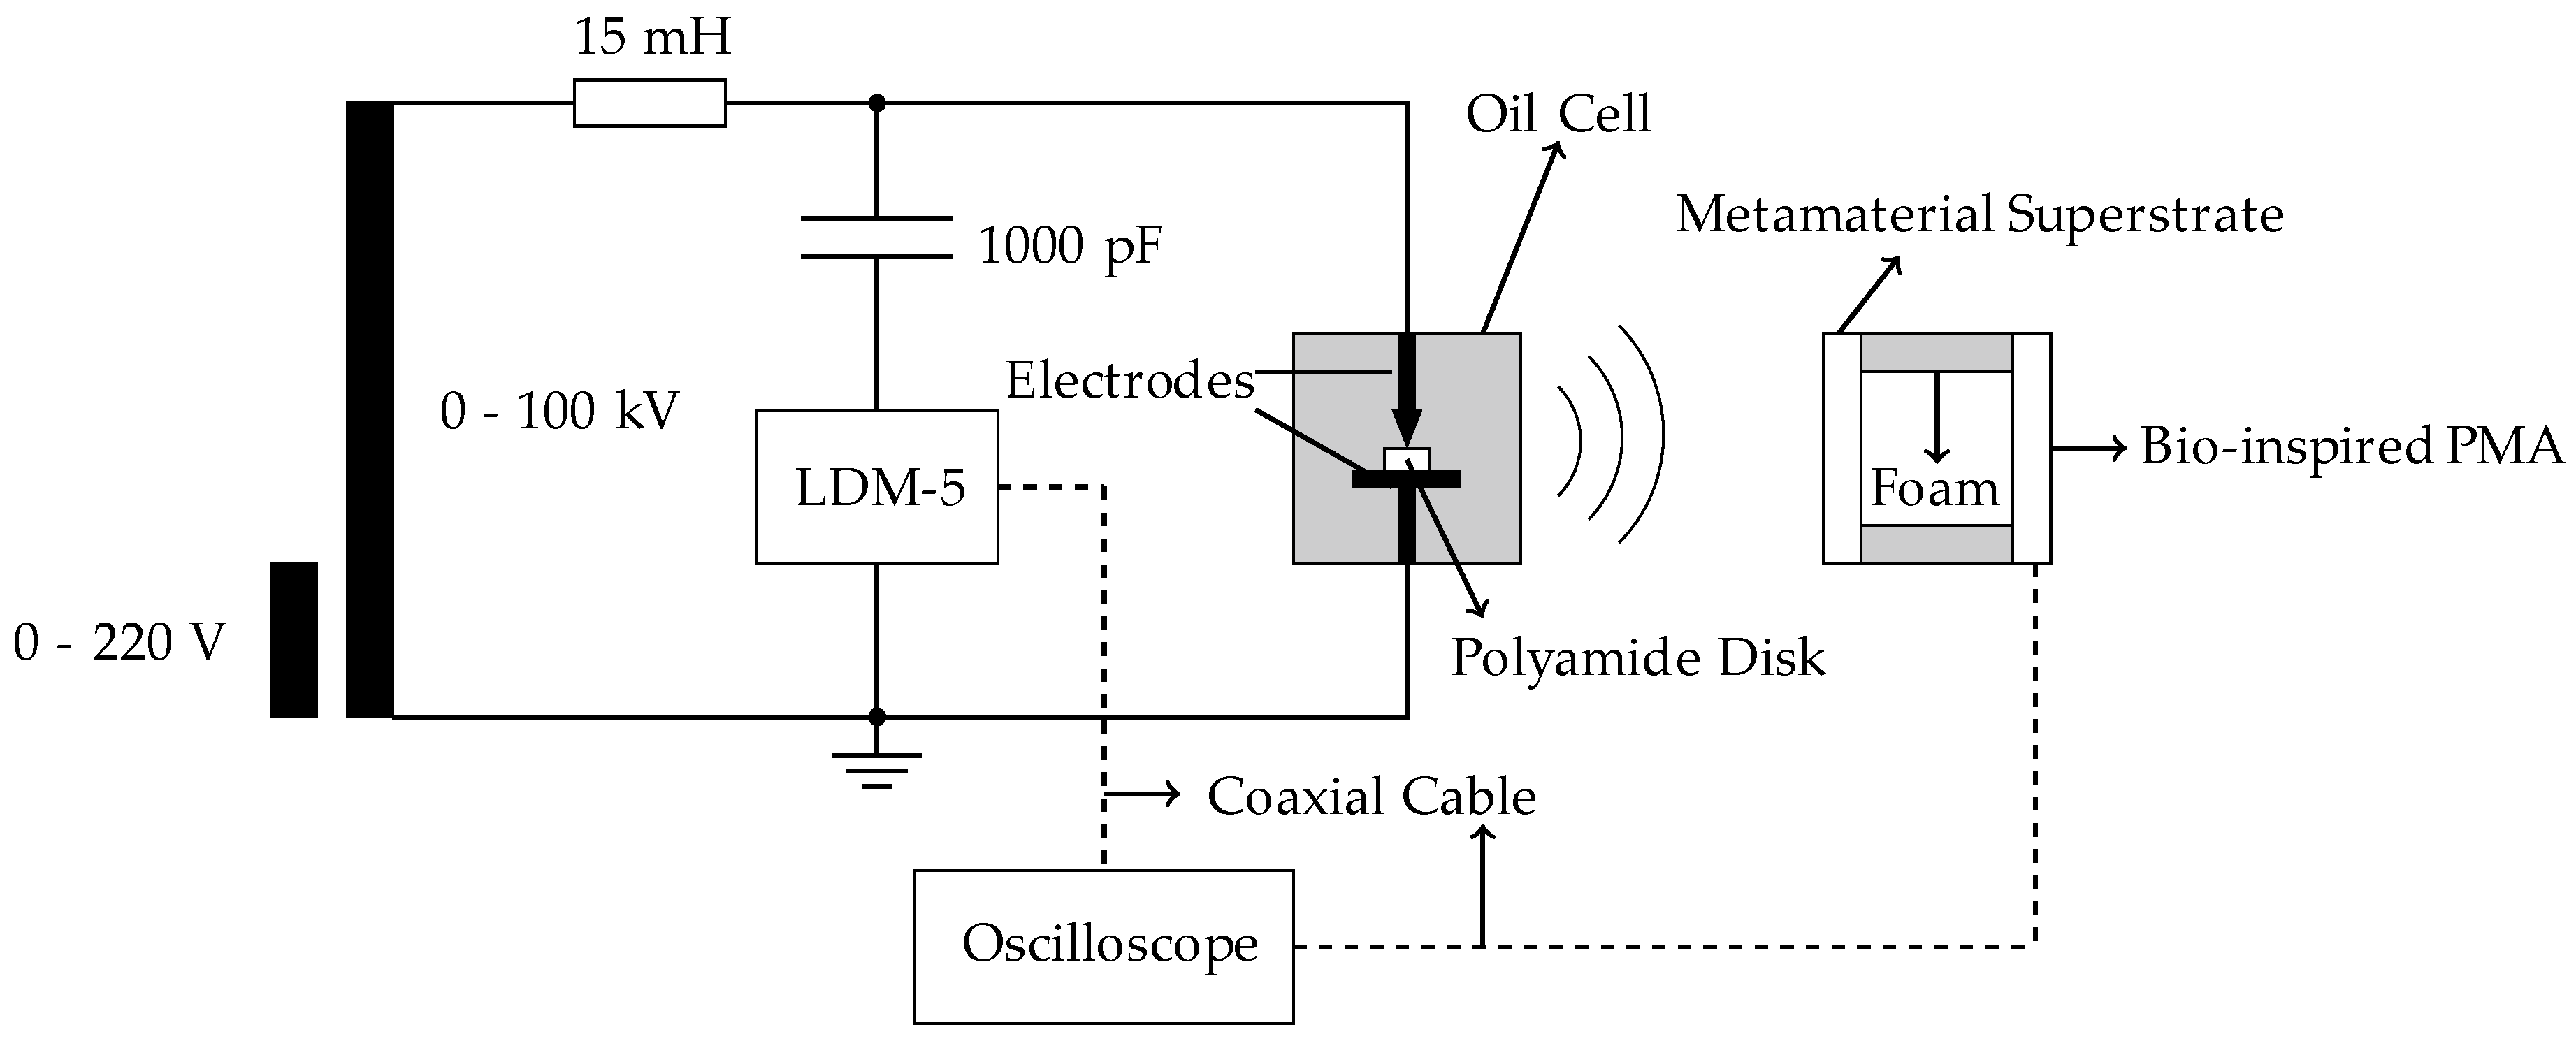
4.5. PD Detection Sensitivity Tests
4.6. PD Detection in a 230 kV Current Transformer
5. Results
5.1. Simulation Results
5.2. Laboratory Experimental Results
5.3. PD Detection in a 230 kV Substation
6. Discussion
7. Conclusions
- (1)
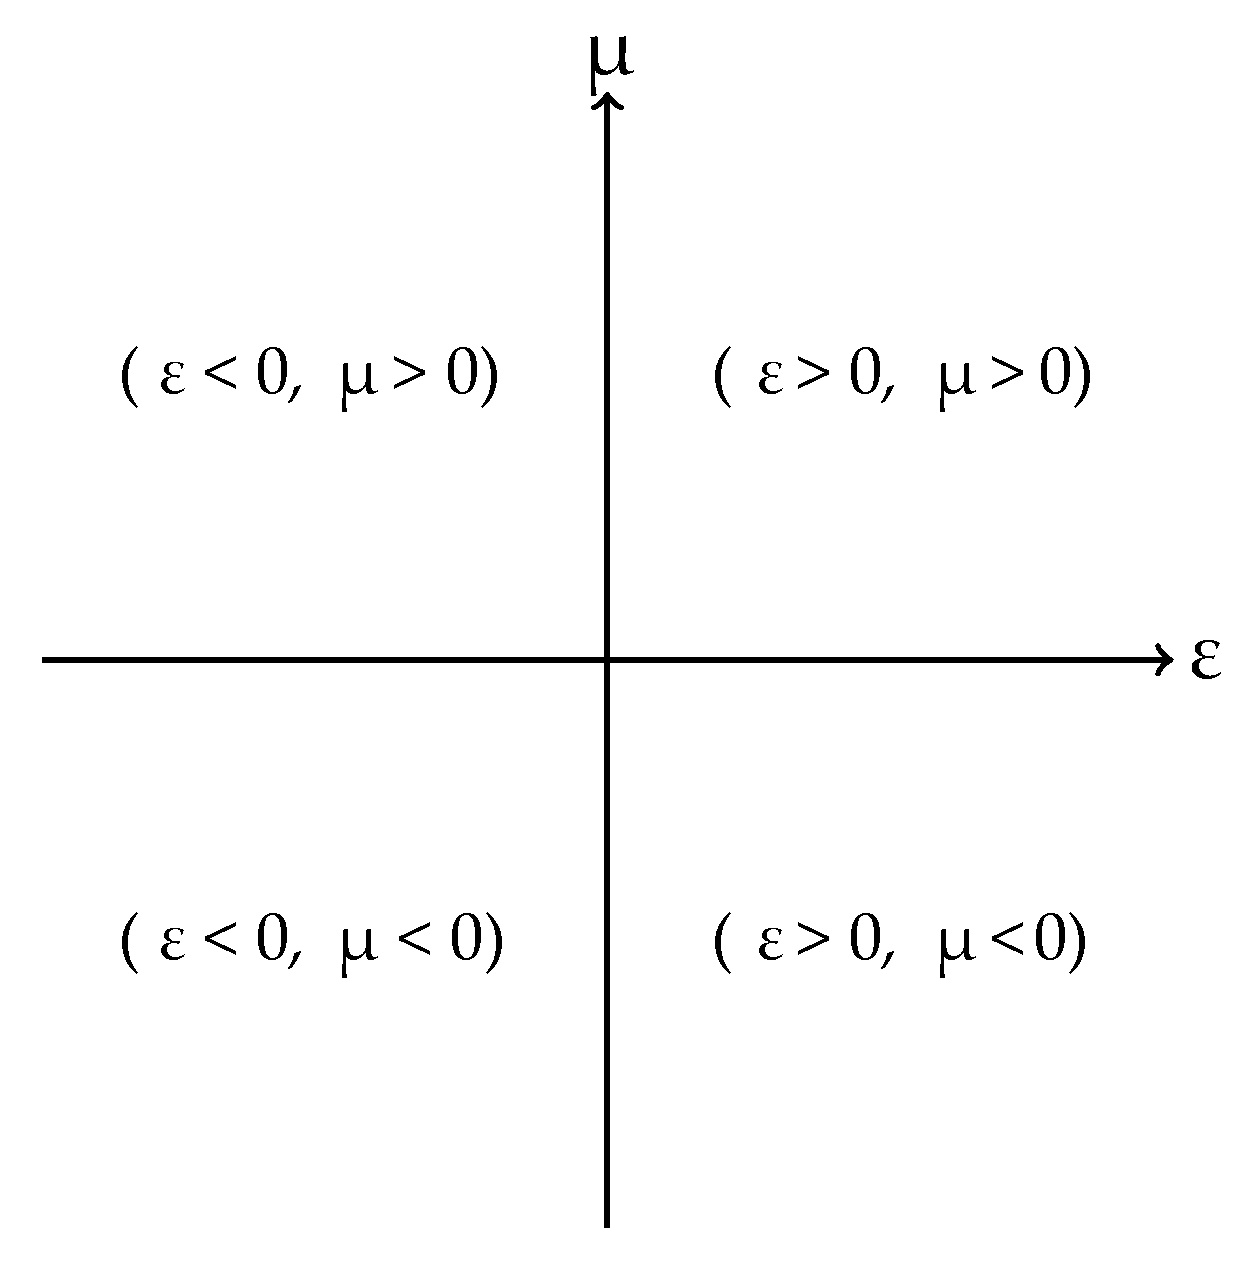
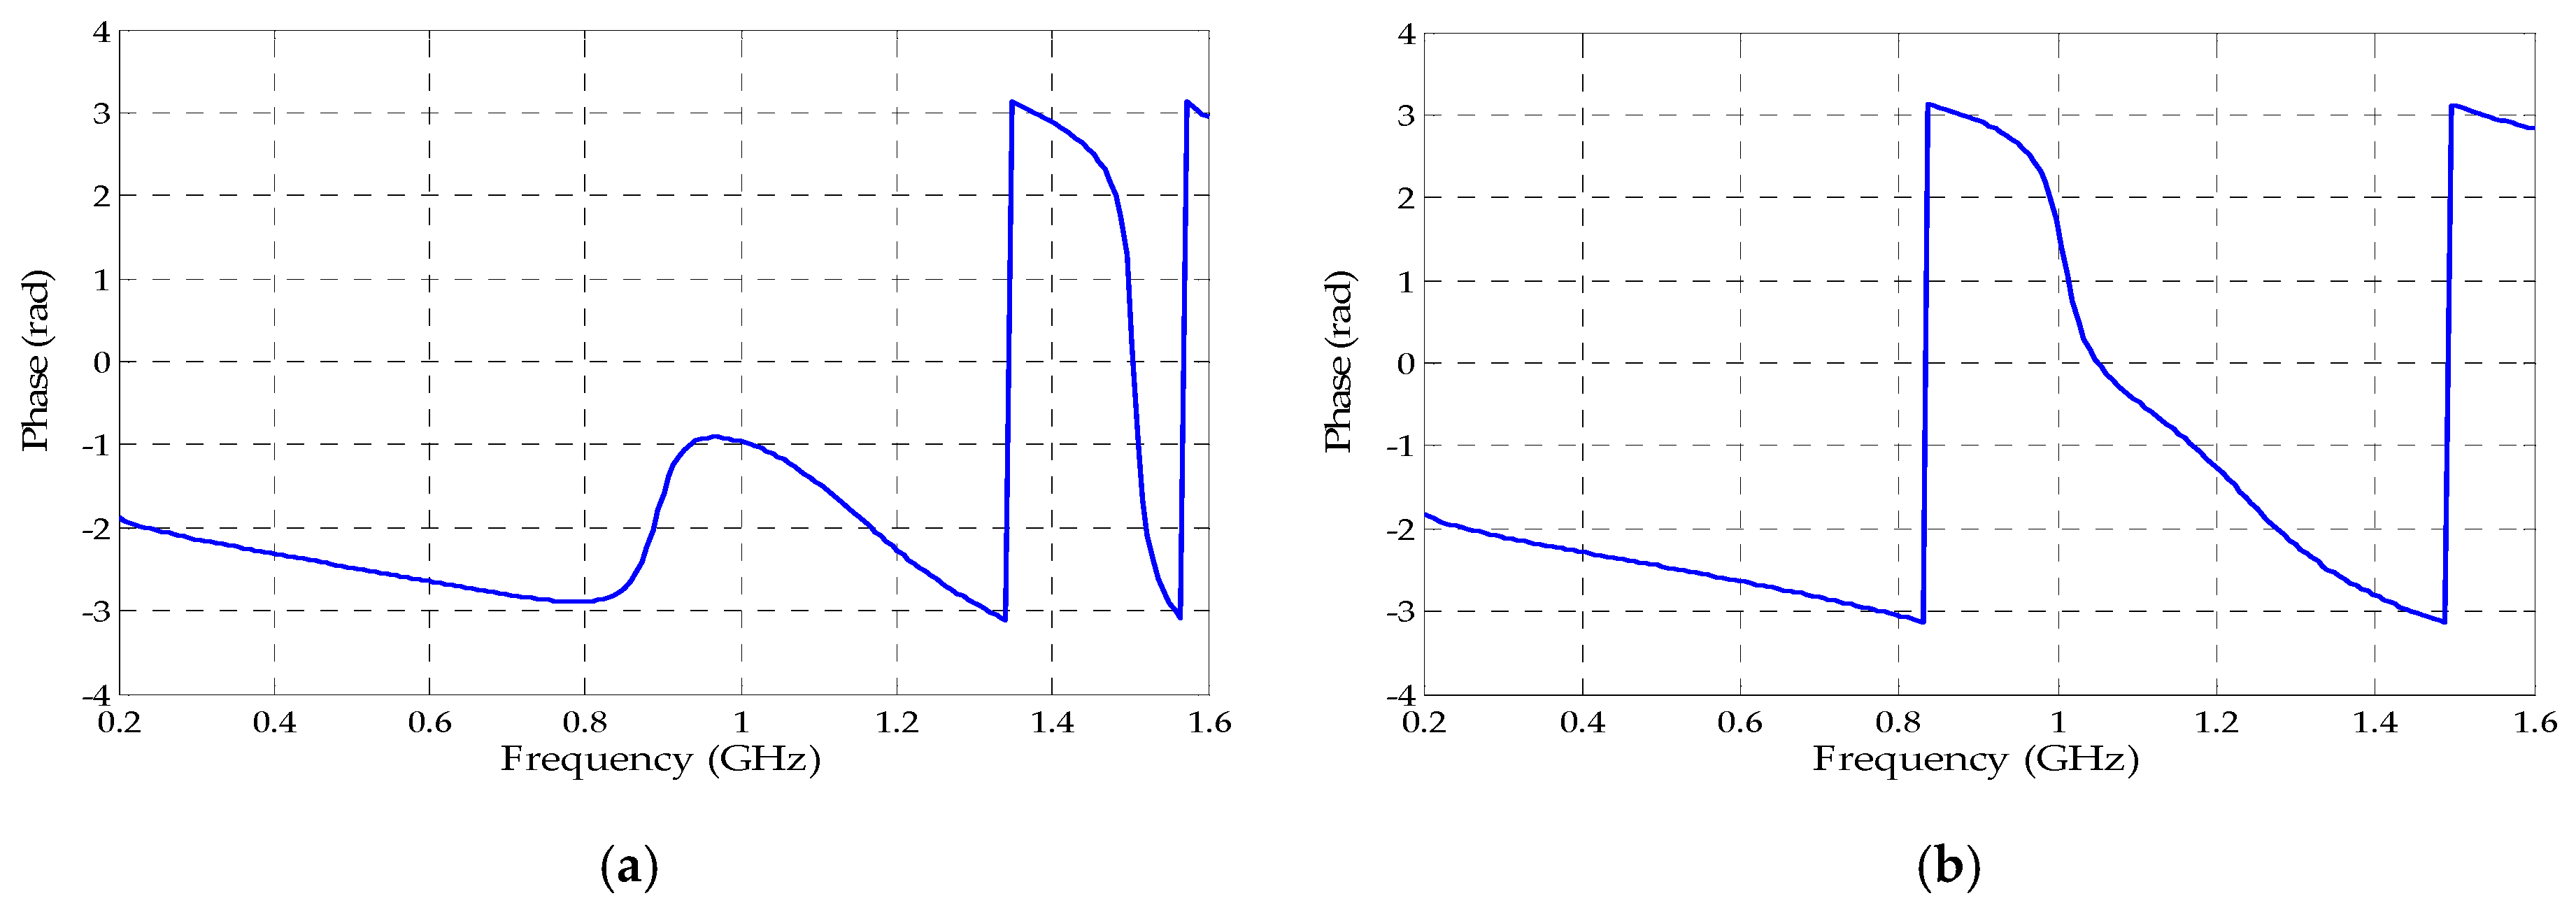
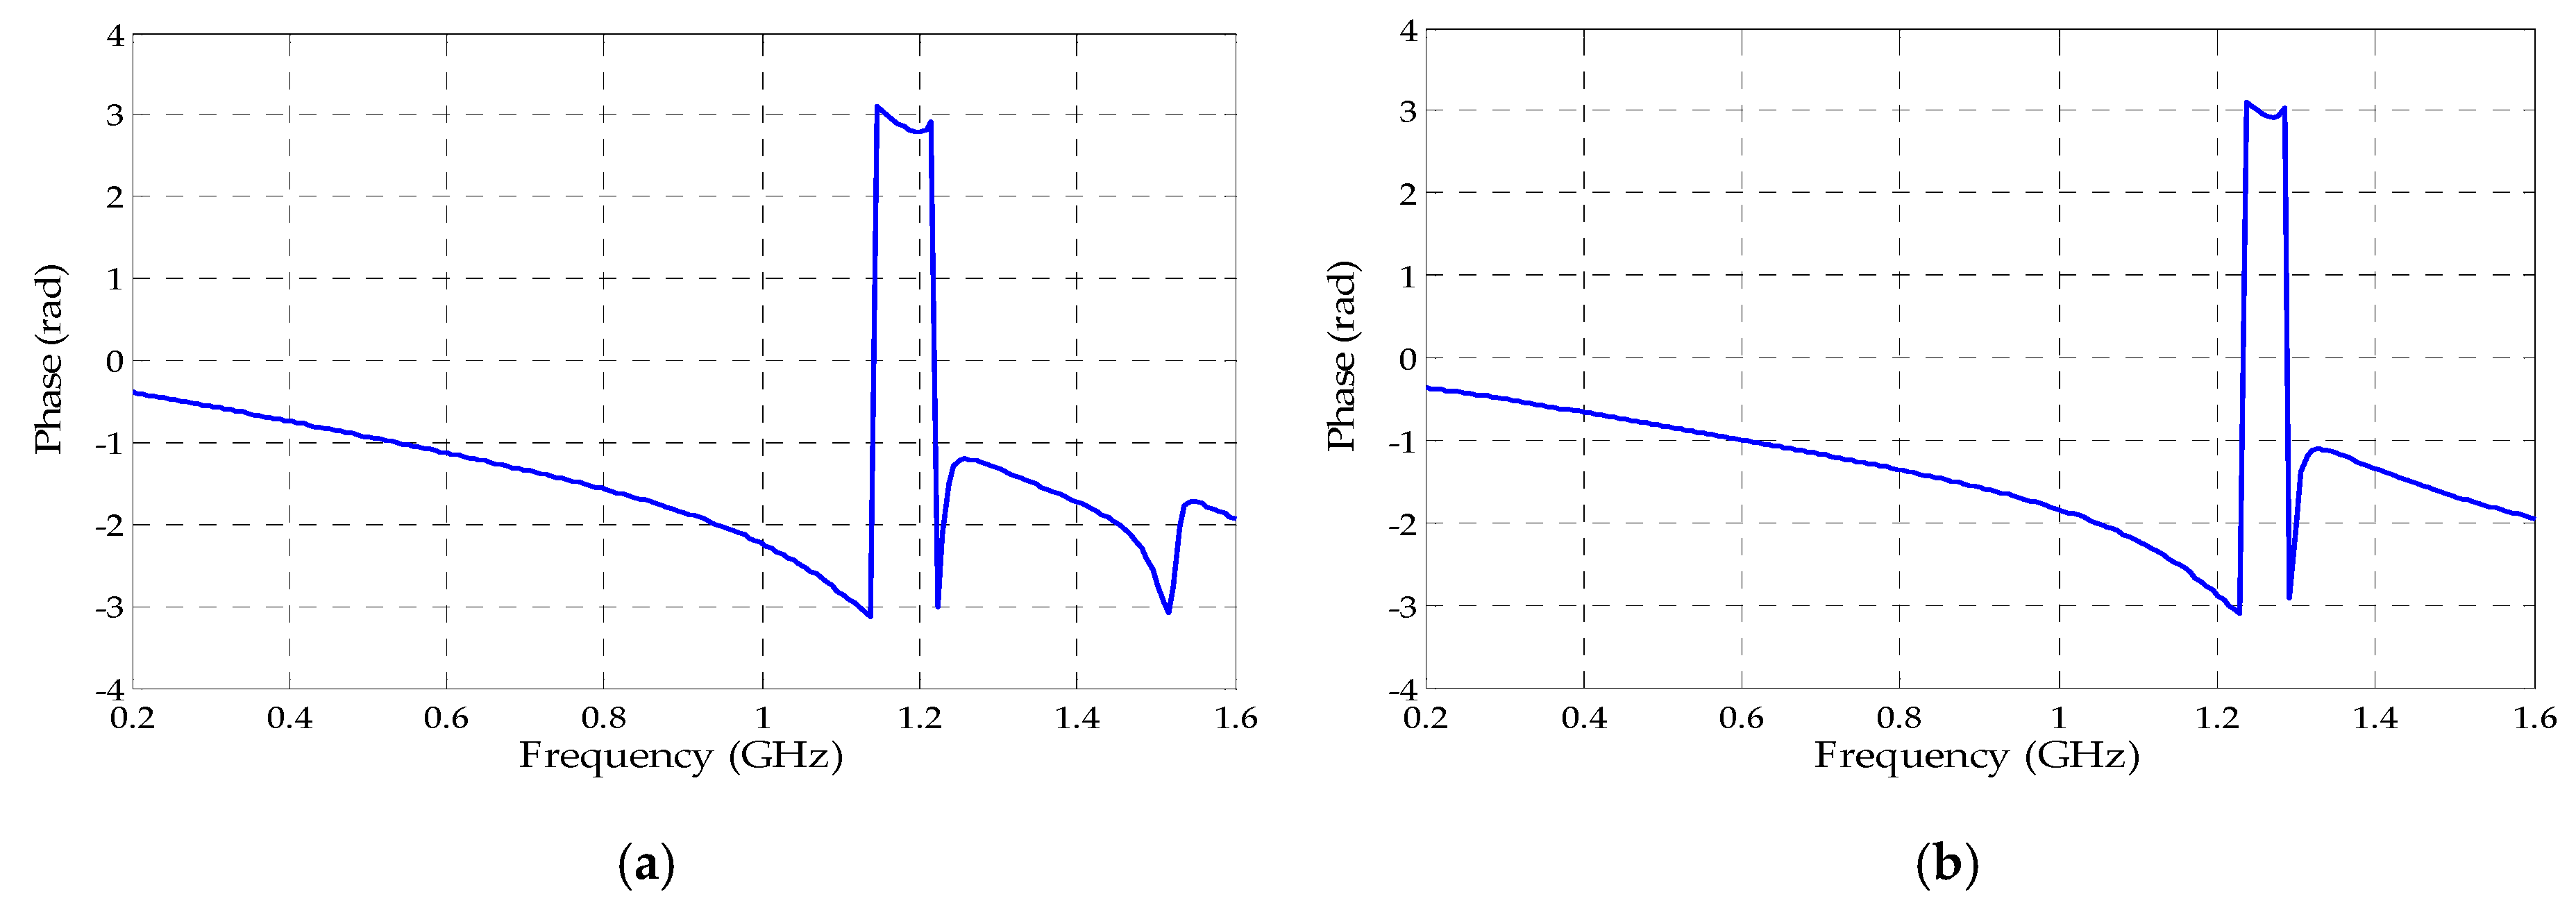
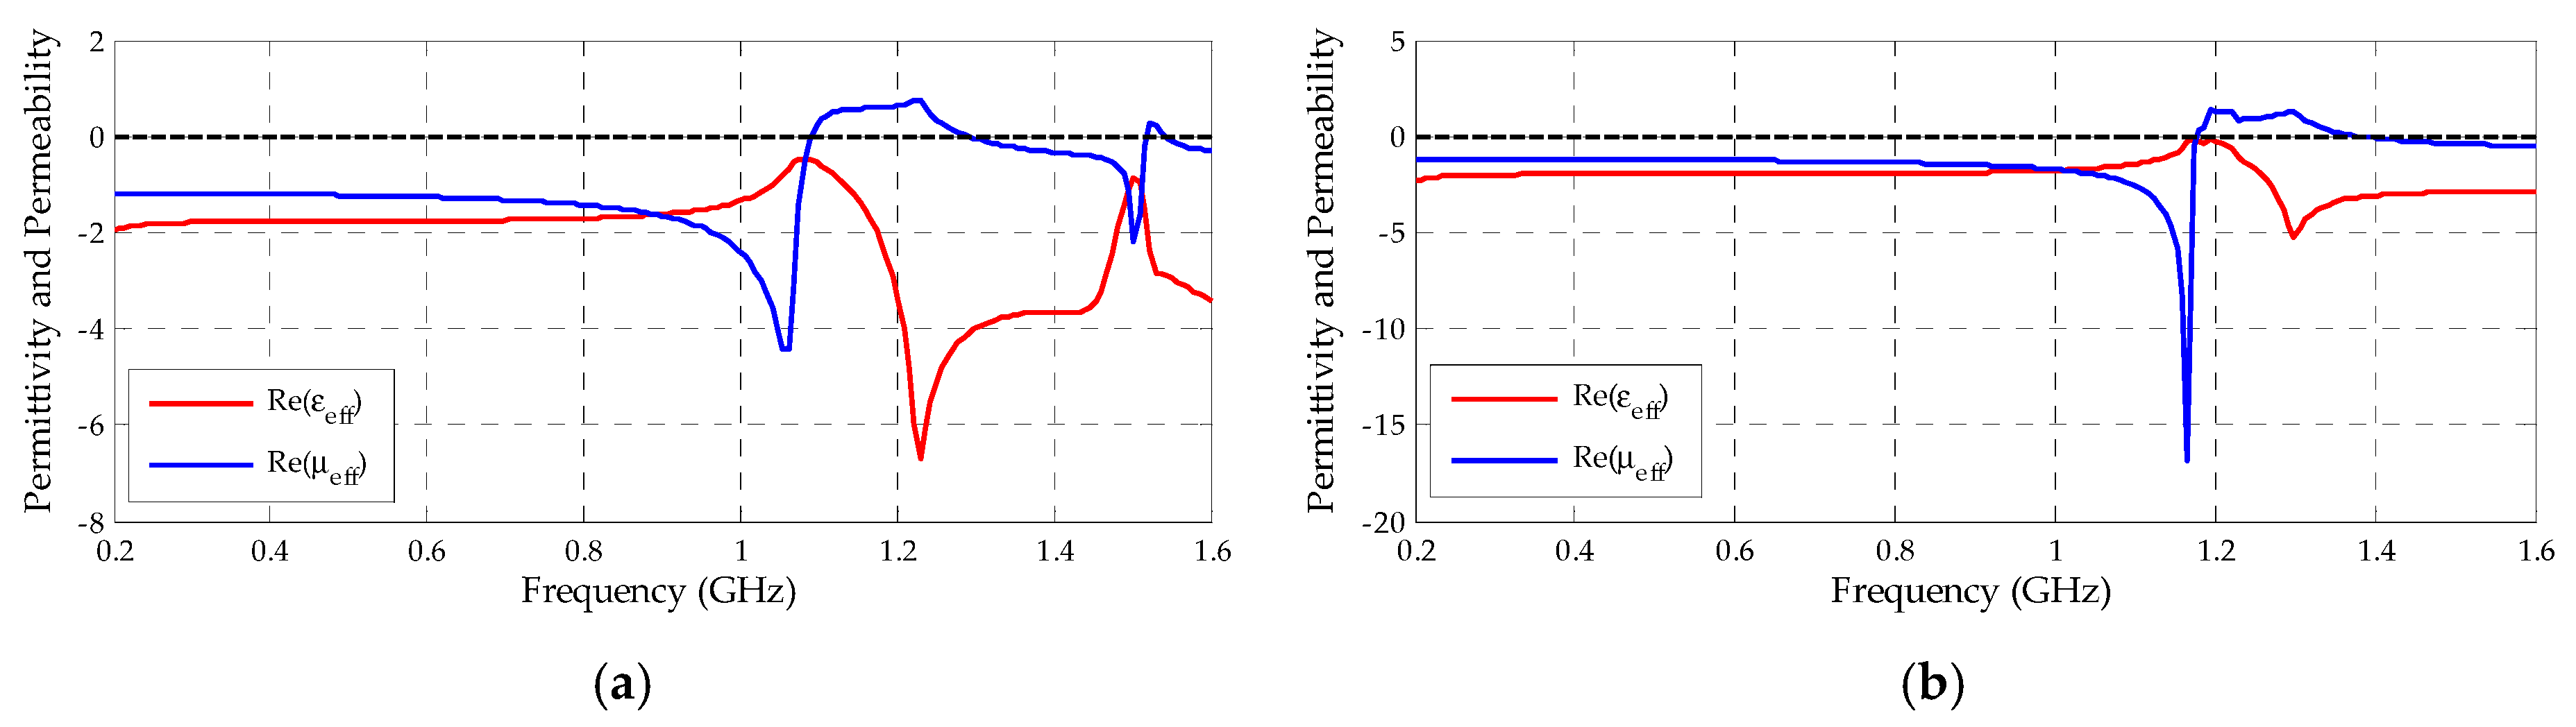
- Both the SRR-CLS designed unit cells presented the double negative behavior (µ < 0, ε < 0) for almost all the main frequency range of PD activity (300–1500 MHz). Therefore, both the SRR unit cells were classified as metamaterials applicable as superstrate for the designed bio-inspired PMA;
- (2)
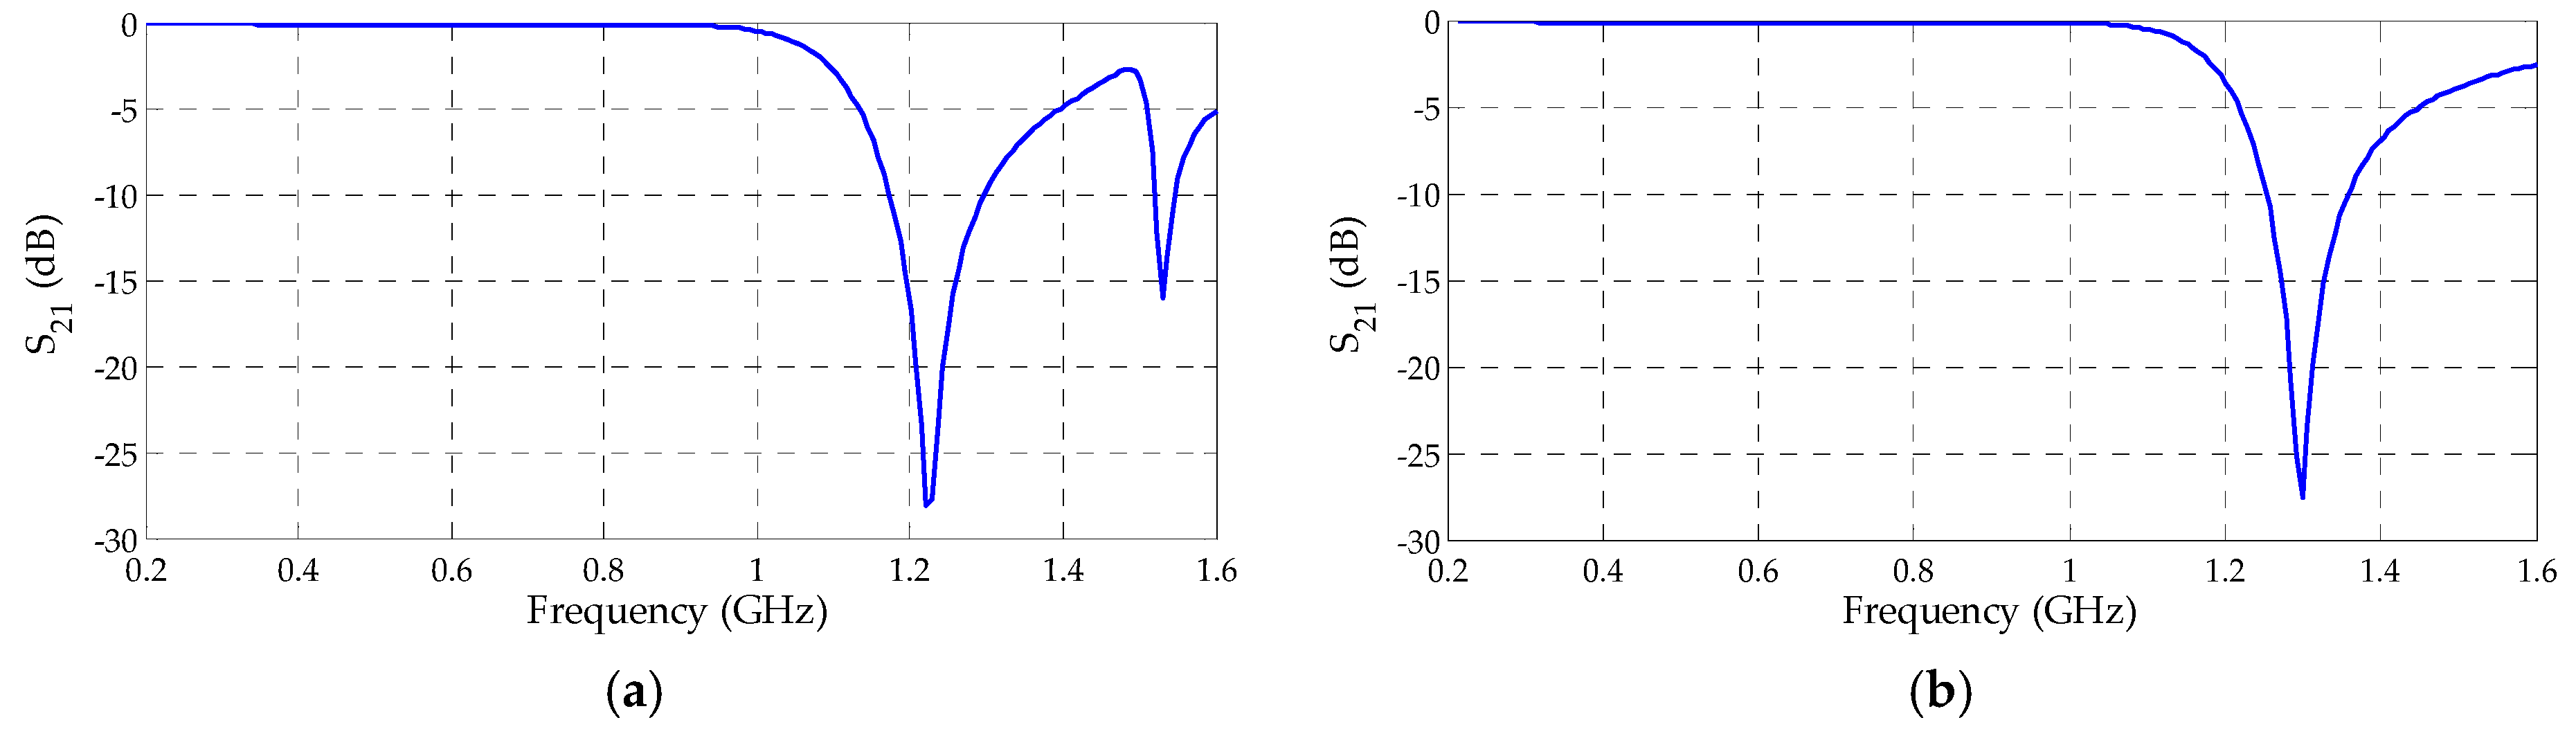
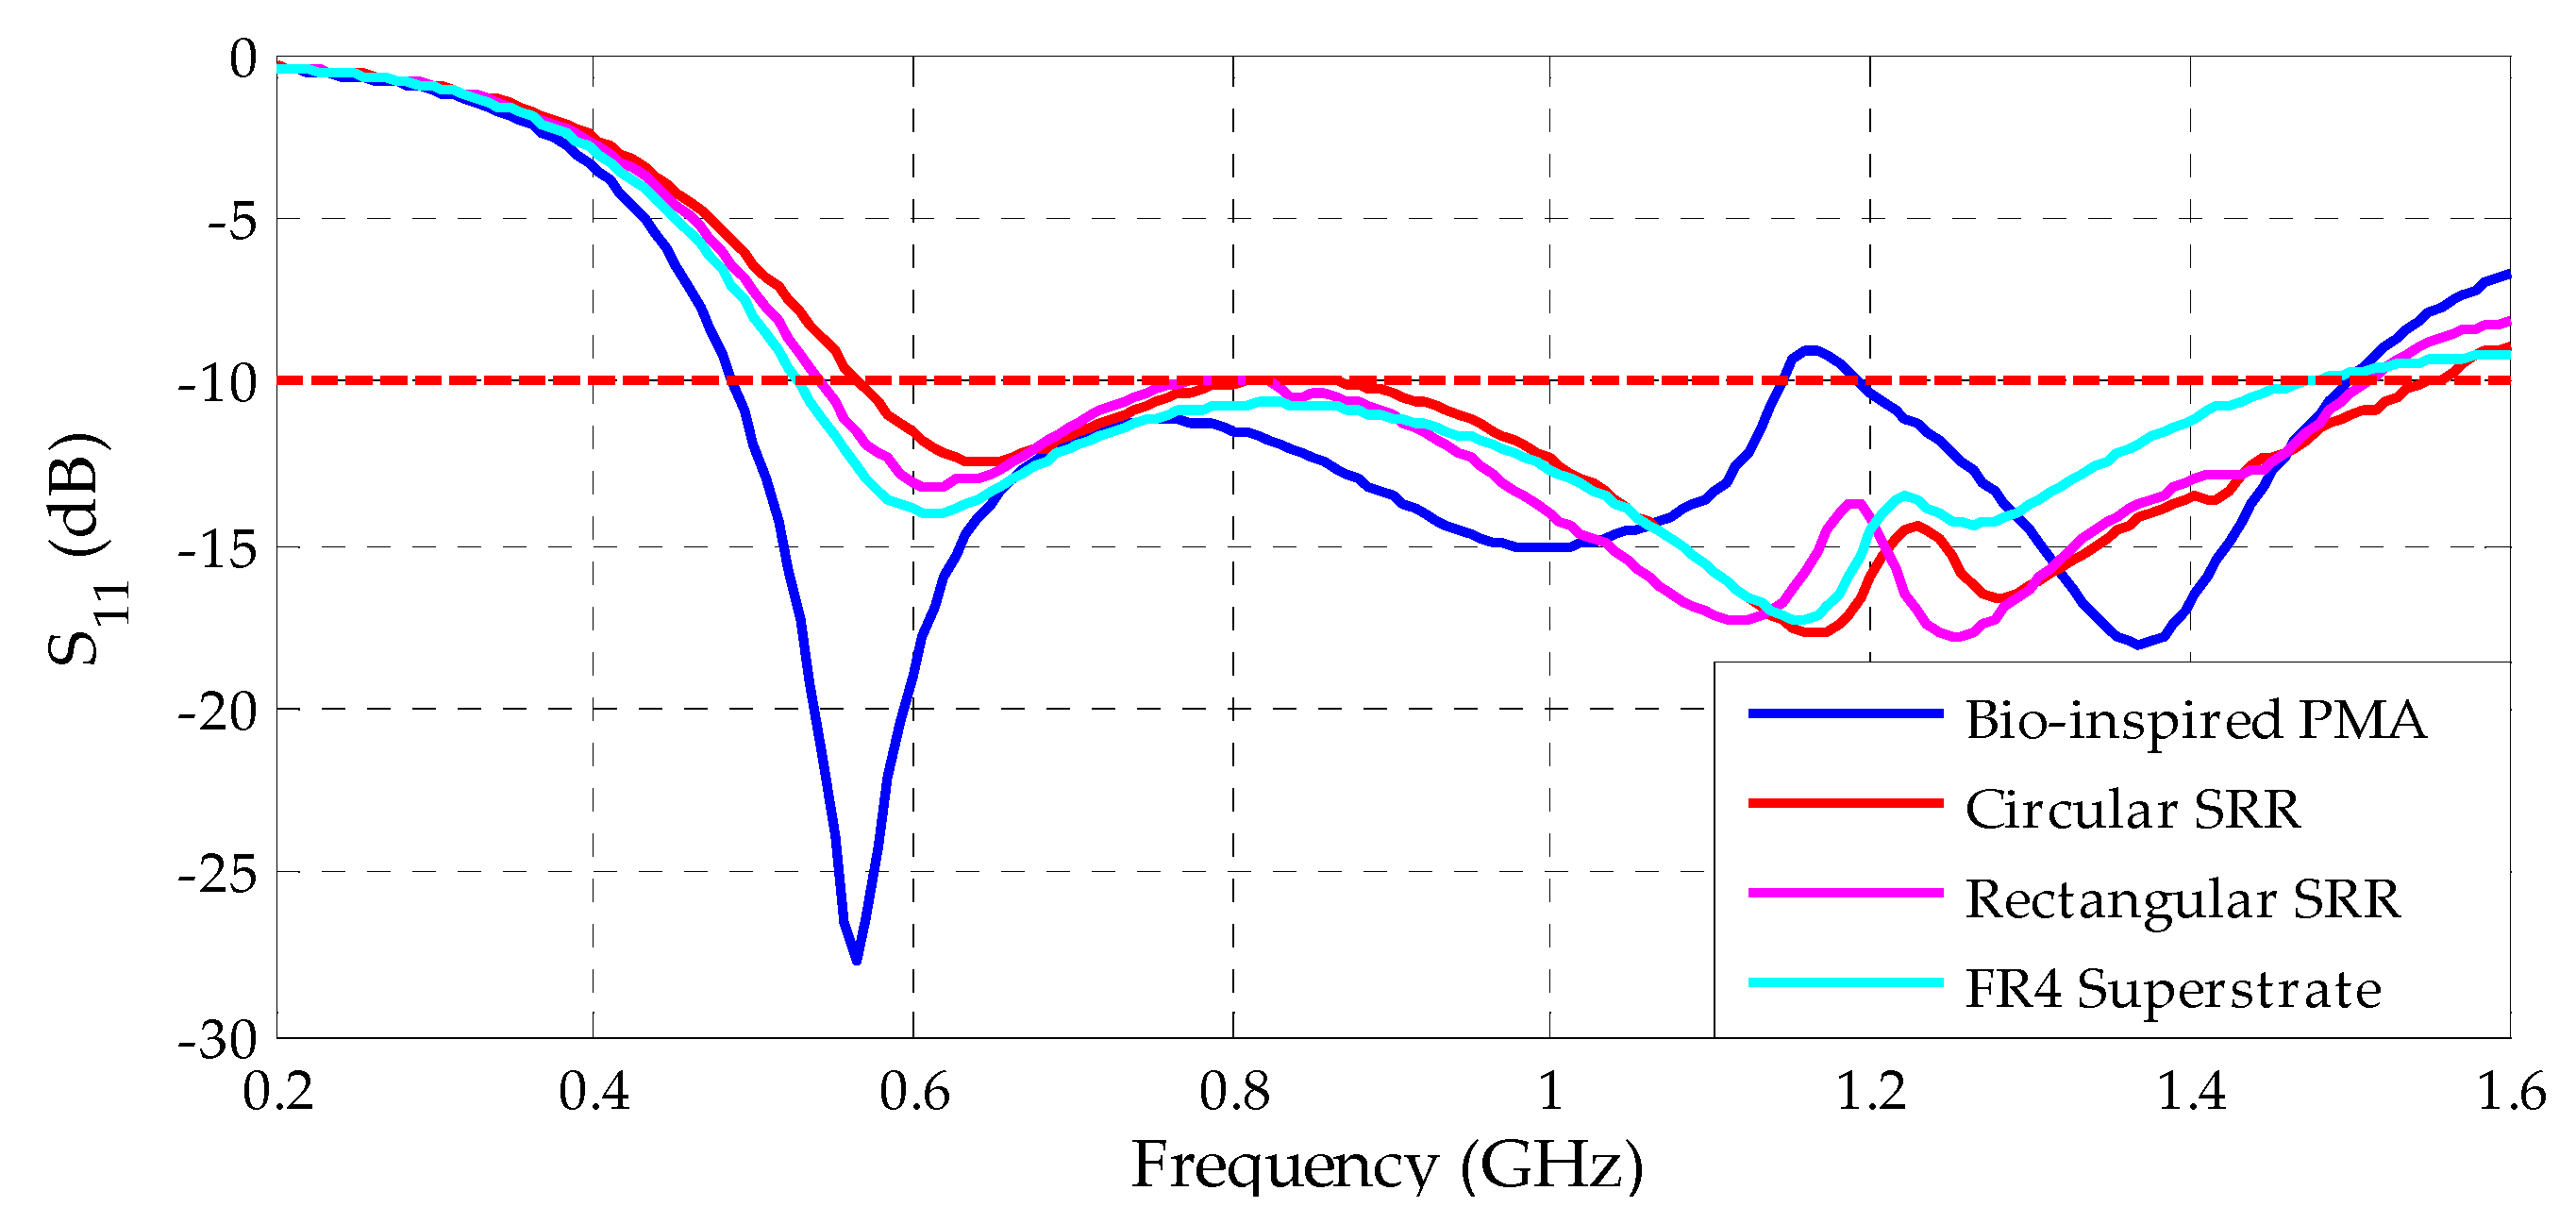
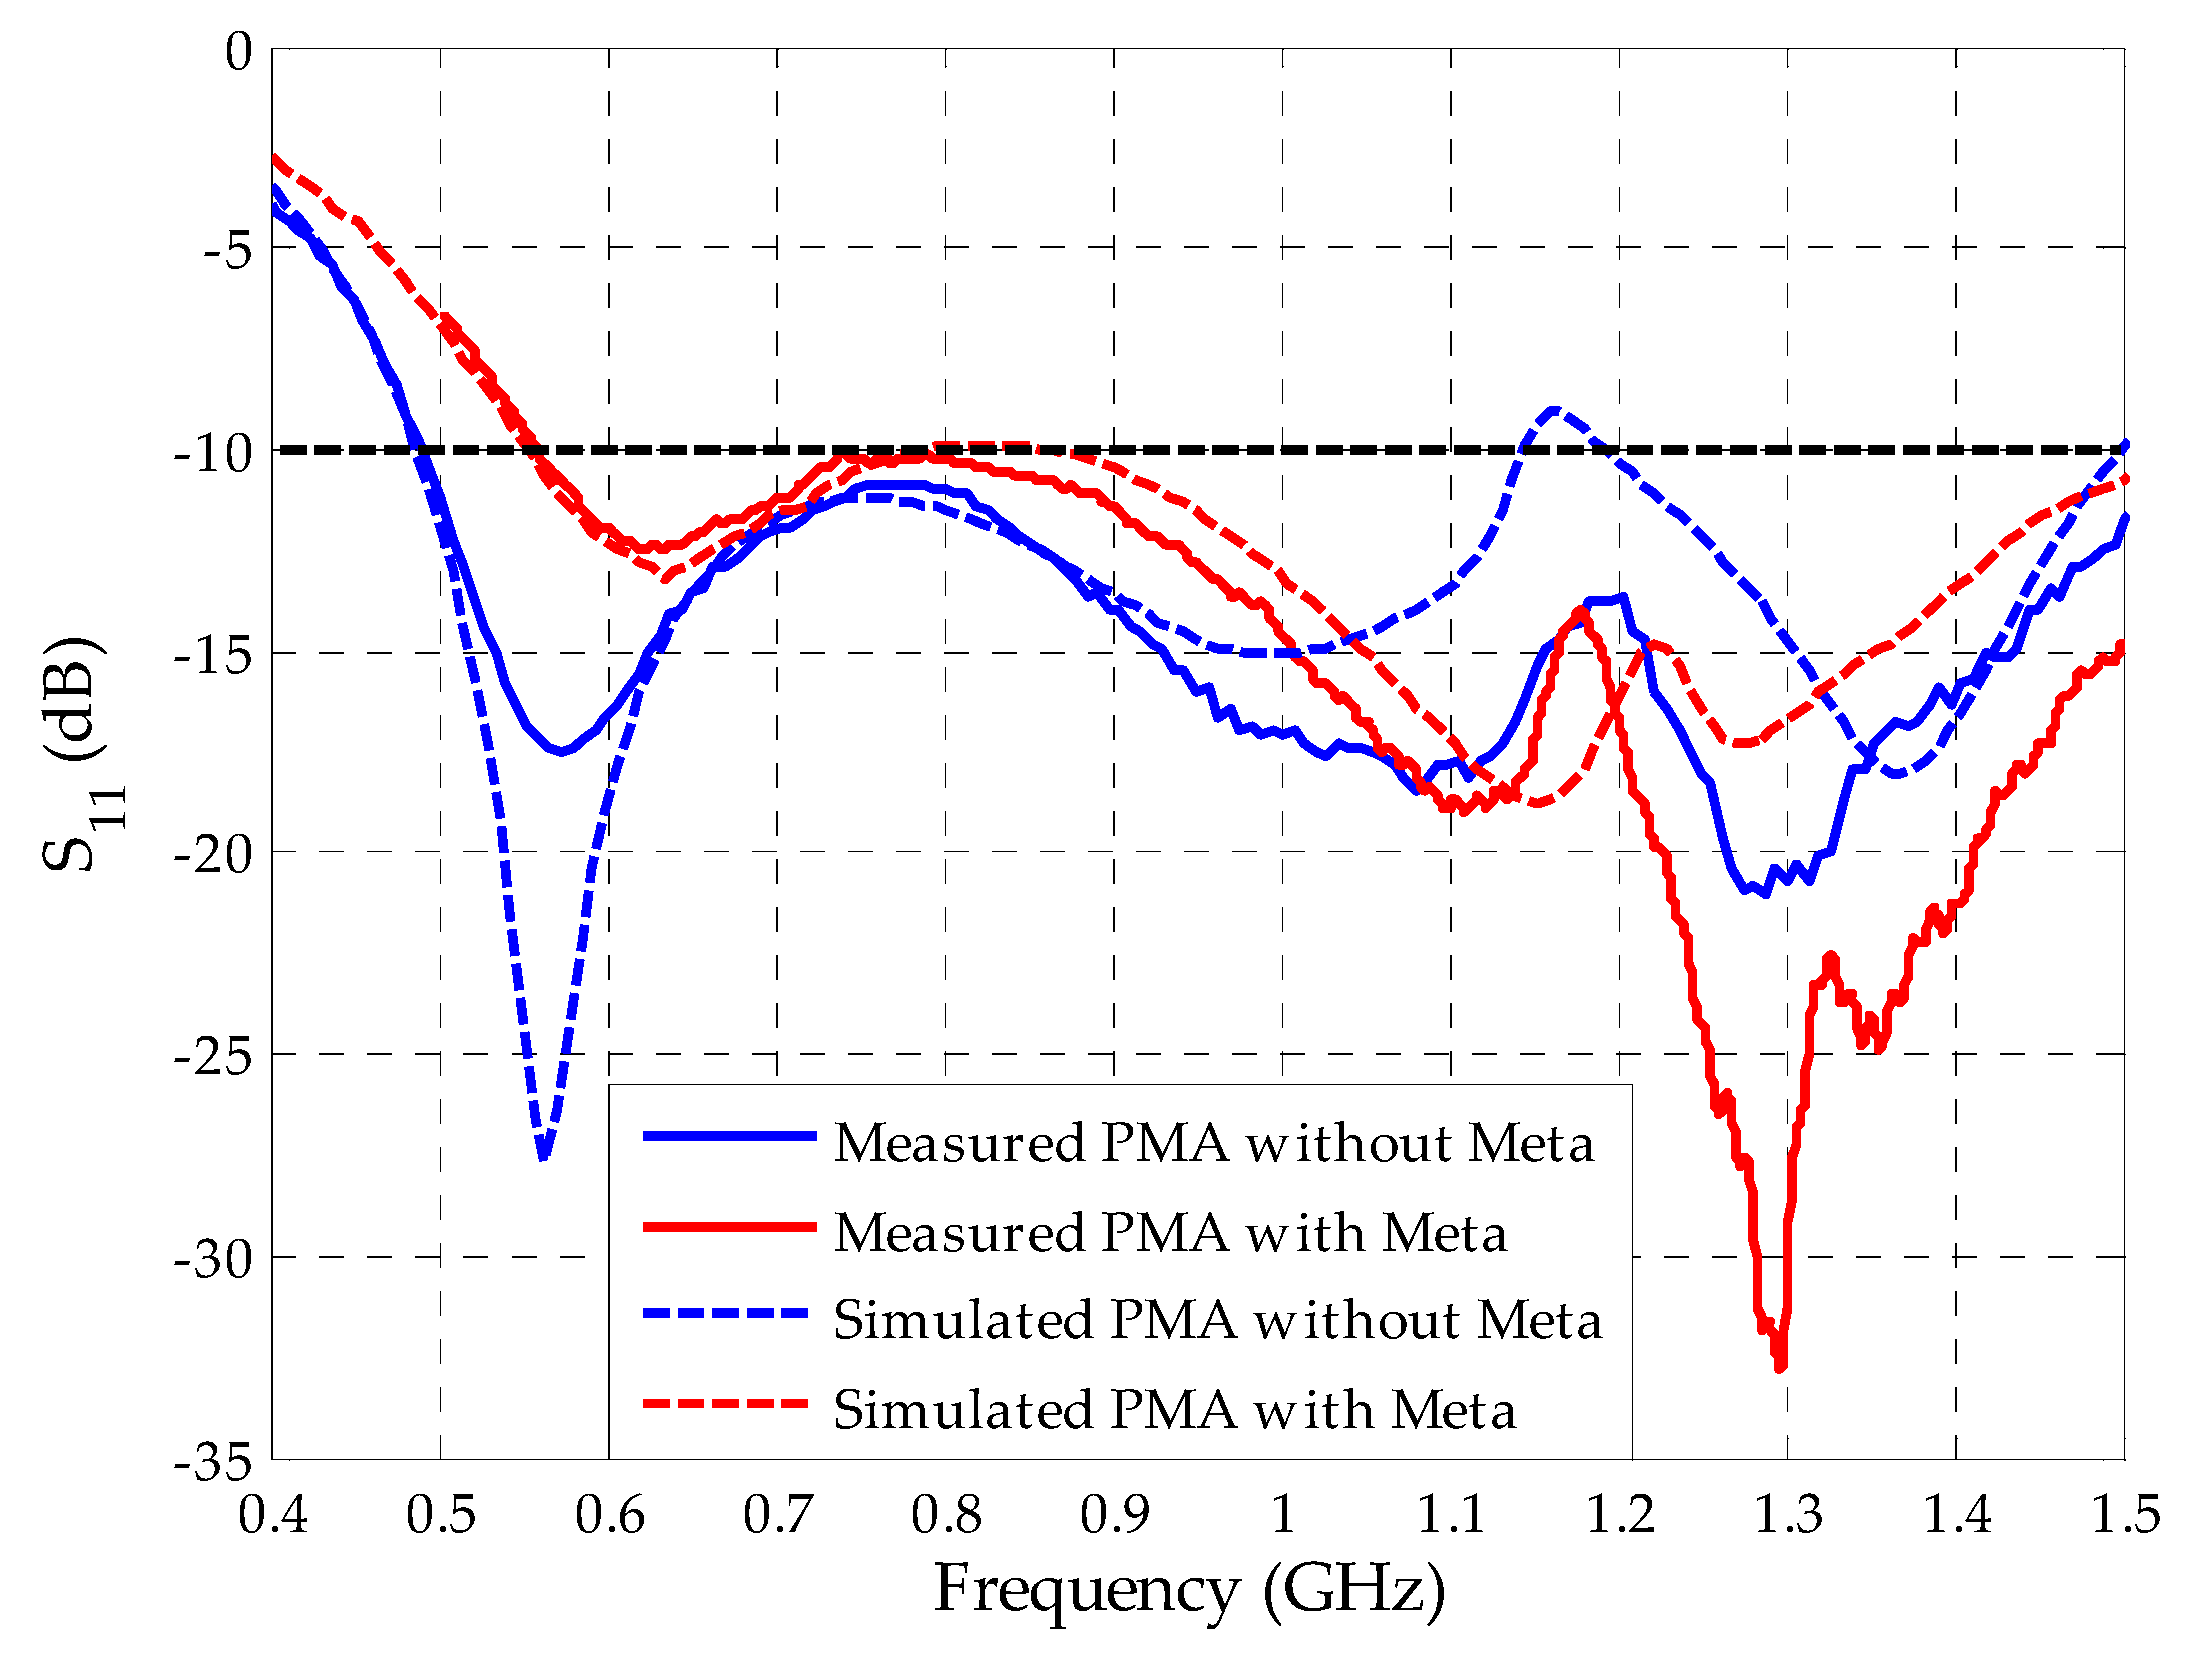
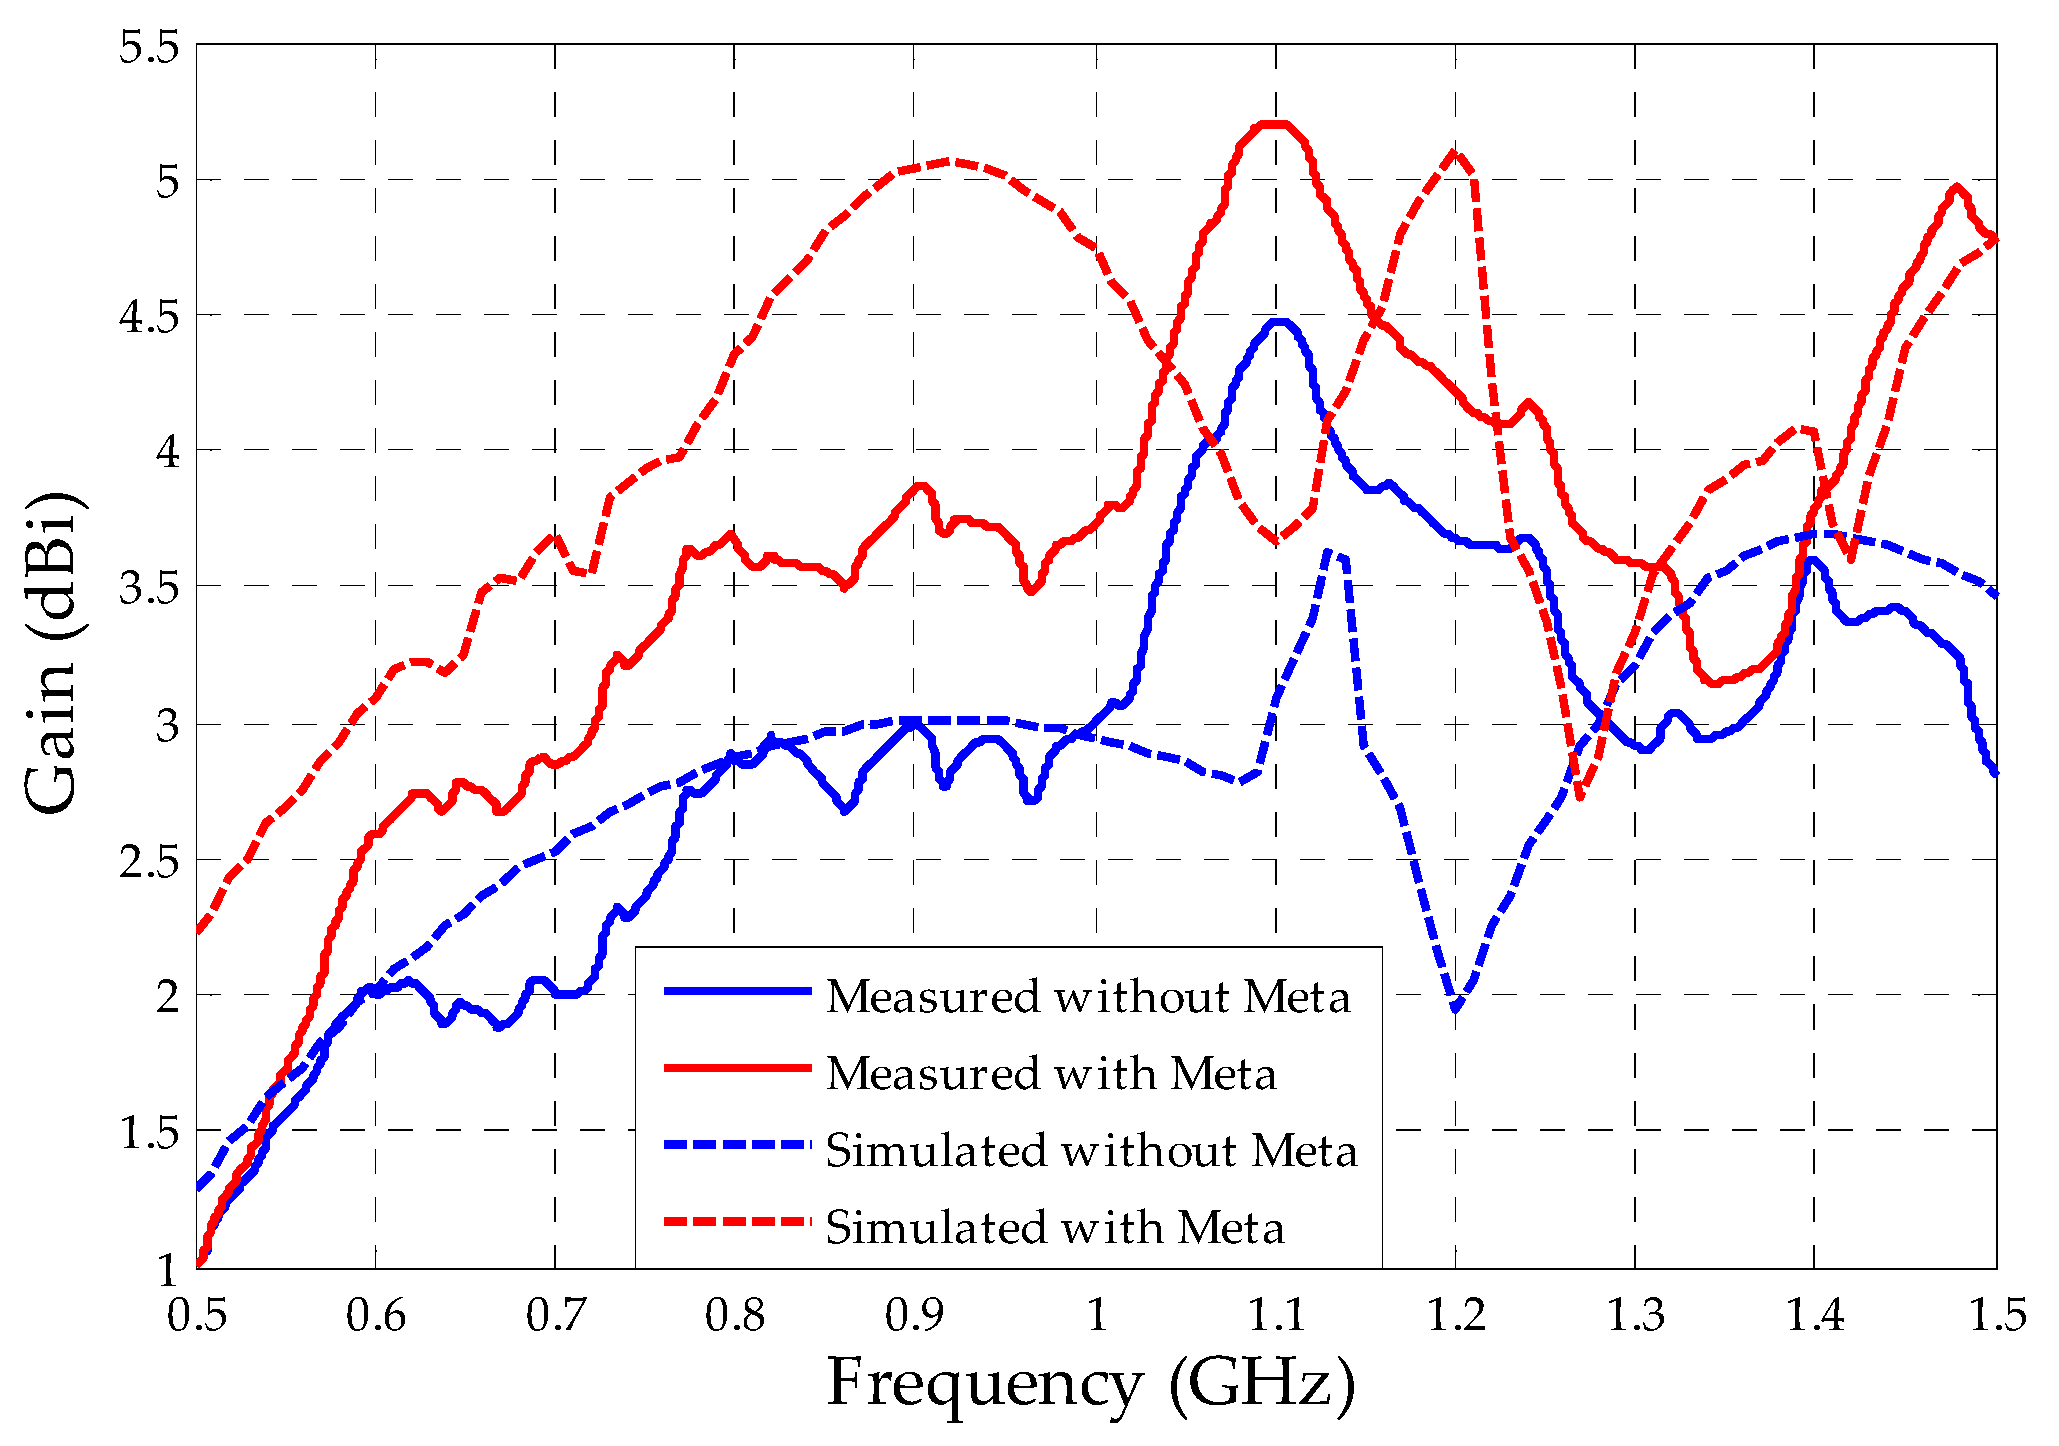
- The application of a metamaterial superstrate resulted in displacements in the bio-inspired PMA operating frequency range, resulting in a 3.9% and 1.8% bandwidth reduction for the circular and rectangular SRRs, respectively;
- (3)
- Although there was a bandwidth reduction regarding the bio-inspired PMA, the application of the both metamaterial superstrates resulted in higher reflection coefficient values for the frequency range of 1100–1500 MHz, in which some reflection coefficient values were lower than the threshold of −10 dB, improving the antenna power transmission/reception capacity for this frequency range;
- (4)
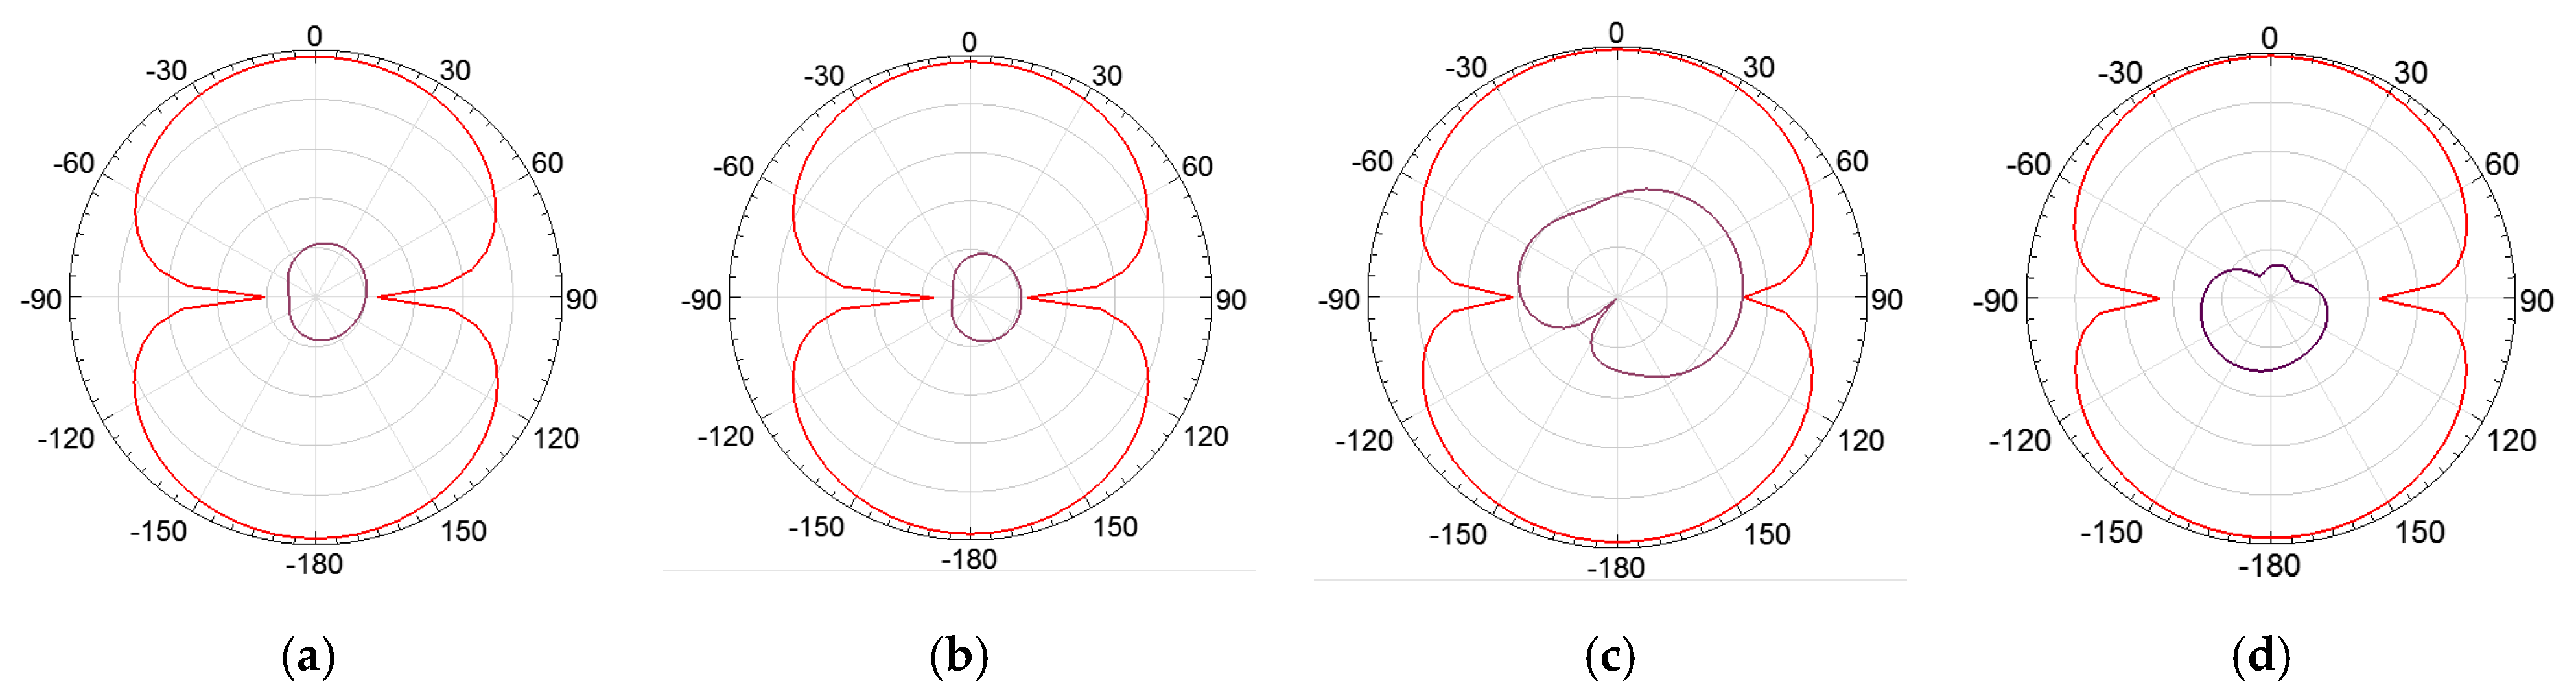
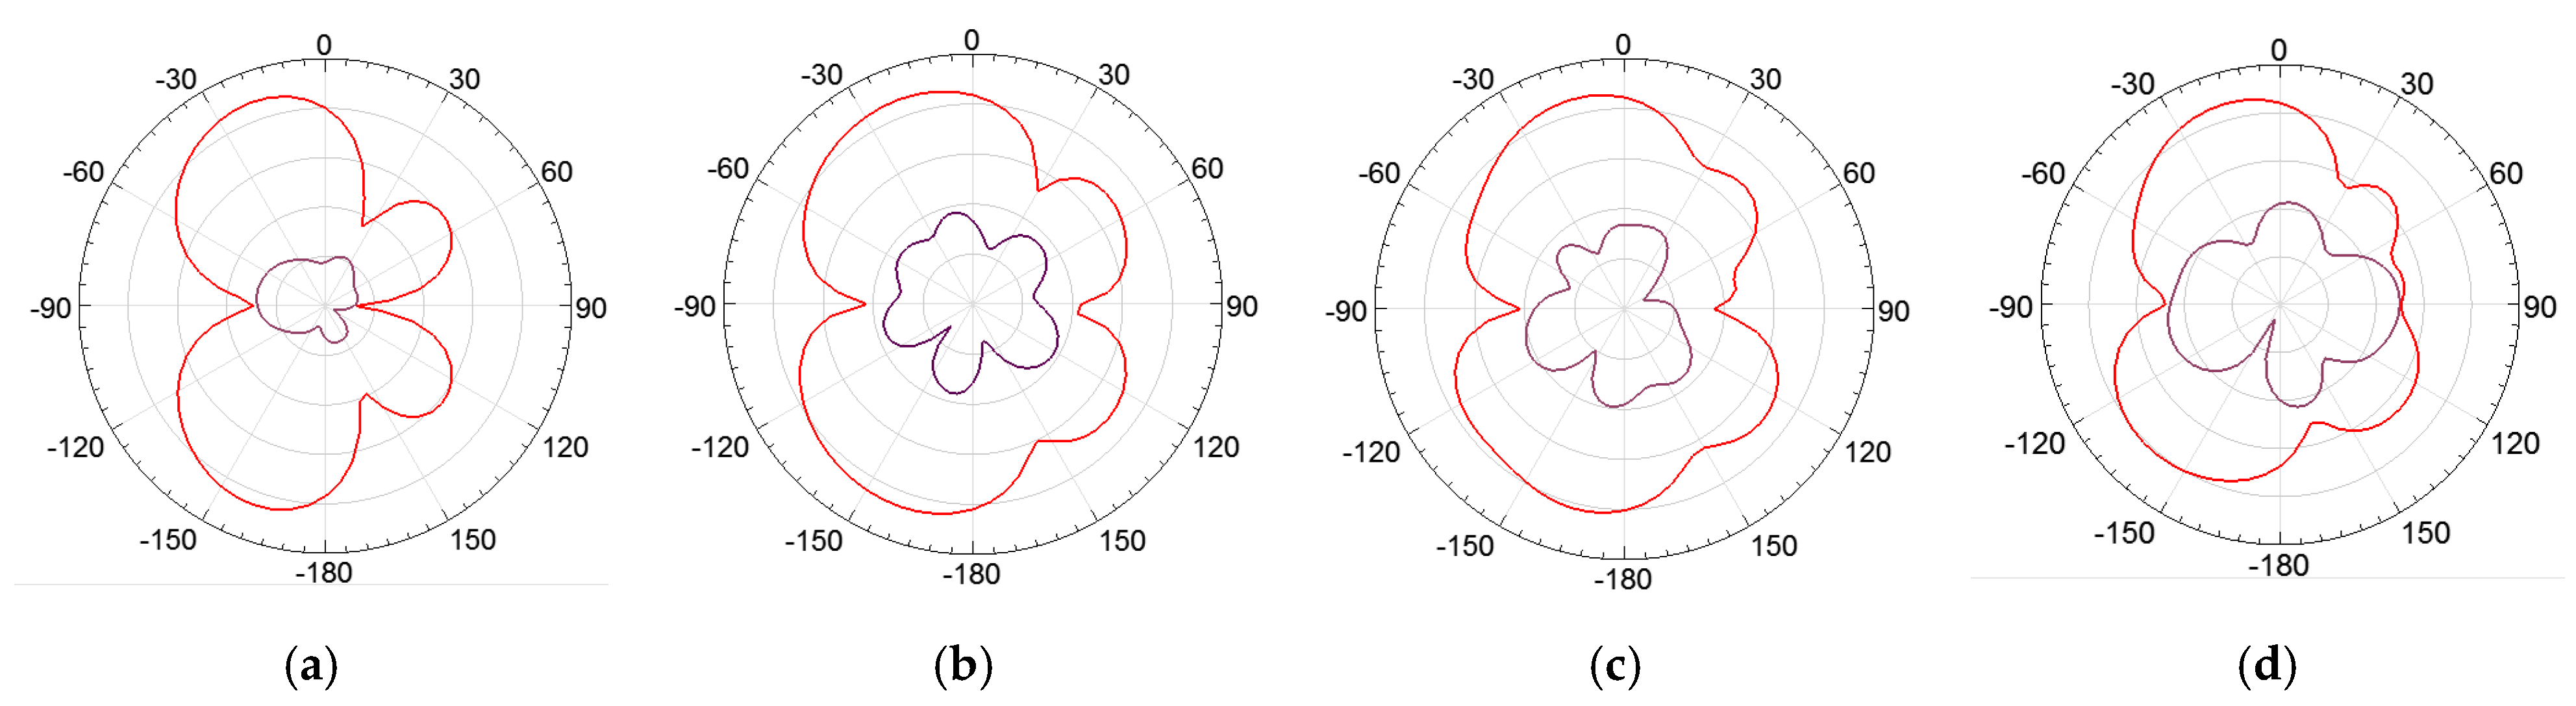
- Radiation patterns distortions were observed at the upper bio-inspired PMA operating frequencies for both metamaterial superstrates, in which the rectangular SRR presented lower radiation patterns distortions than the circular one for the upper frequencies, mainly at the back lobe direction;
- (5)
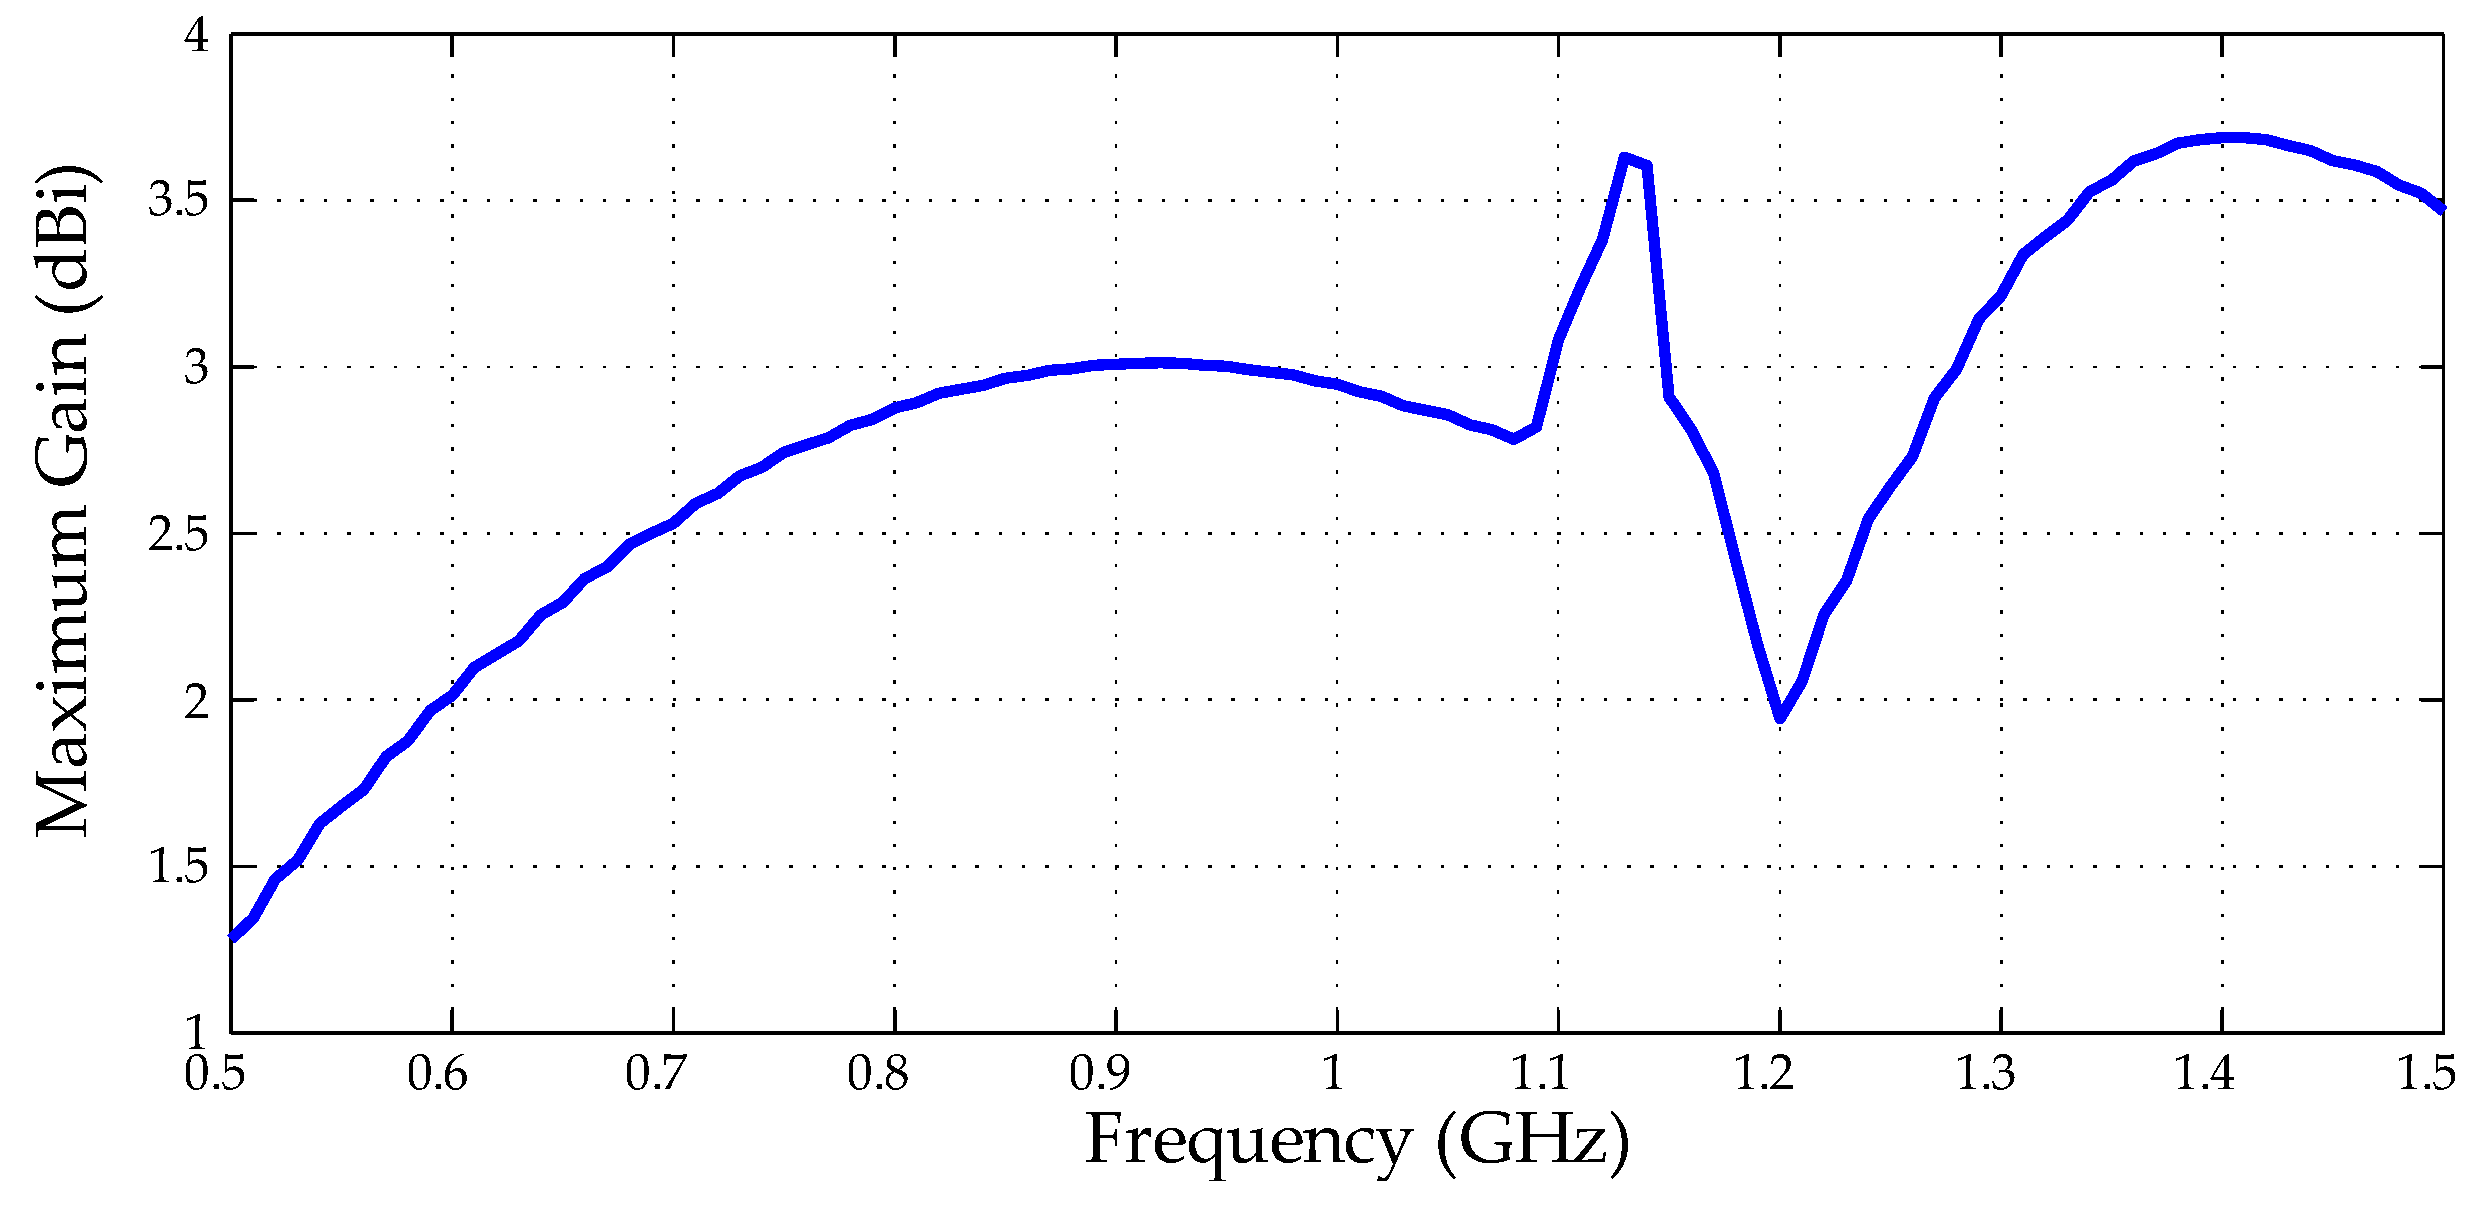
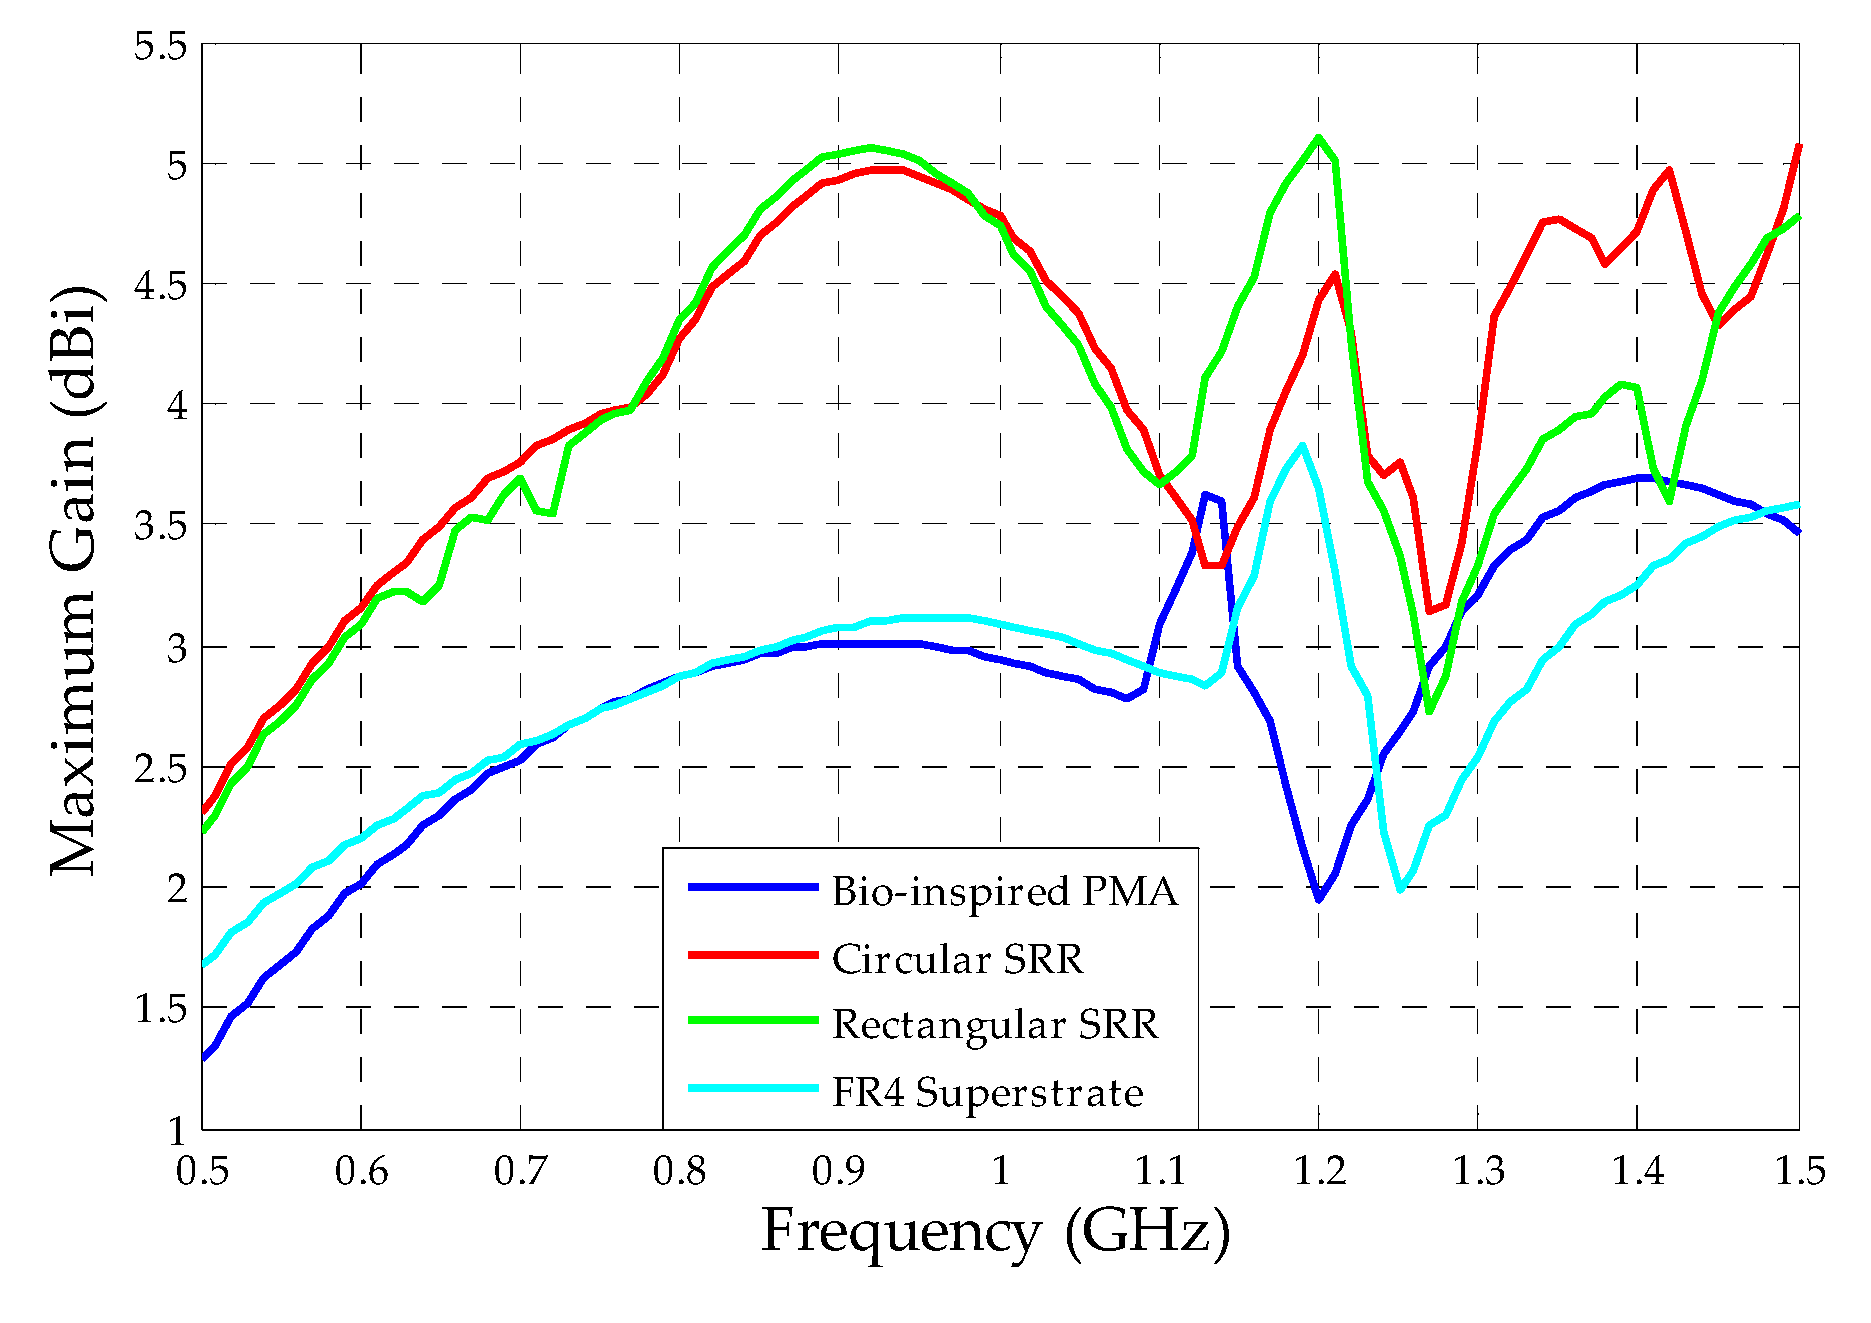
- The application of both designed superstrates resulted in maximum gain values almost increased in double regarding the reference bio-inspired PMA for the frequency range of 500–1000 MHz, resulting in a mean gain improvement higher than 1 dBi;
- (6)
- The practical application of the rectangular SRR superstrate resulted in a UHF sensor with an operating bandwidth (540–1500 MHz) that covers 80% of the main frequency range of PD activity (300–1500 MHz);
- (7)
- The measured mean gain for the bio-inspired PMA-metamaterial set was equal to 3.61 dBi, resulting in an enhancement of 0.7 dBi regarding the bio-inspired PMA (2.92 dBi) and representing a good detection sensitivity for PD application;
- (8)
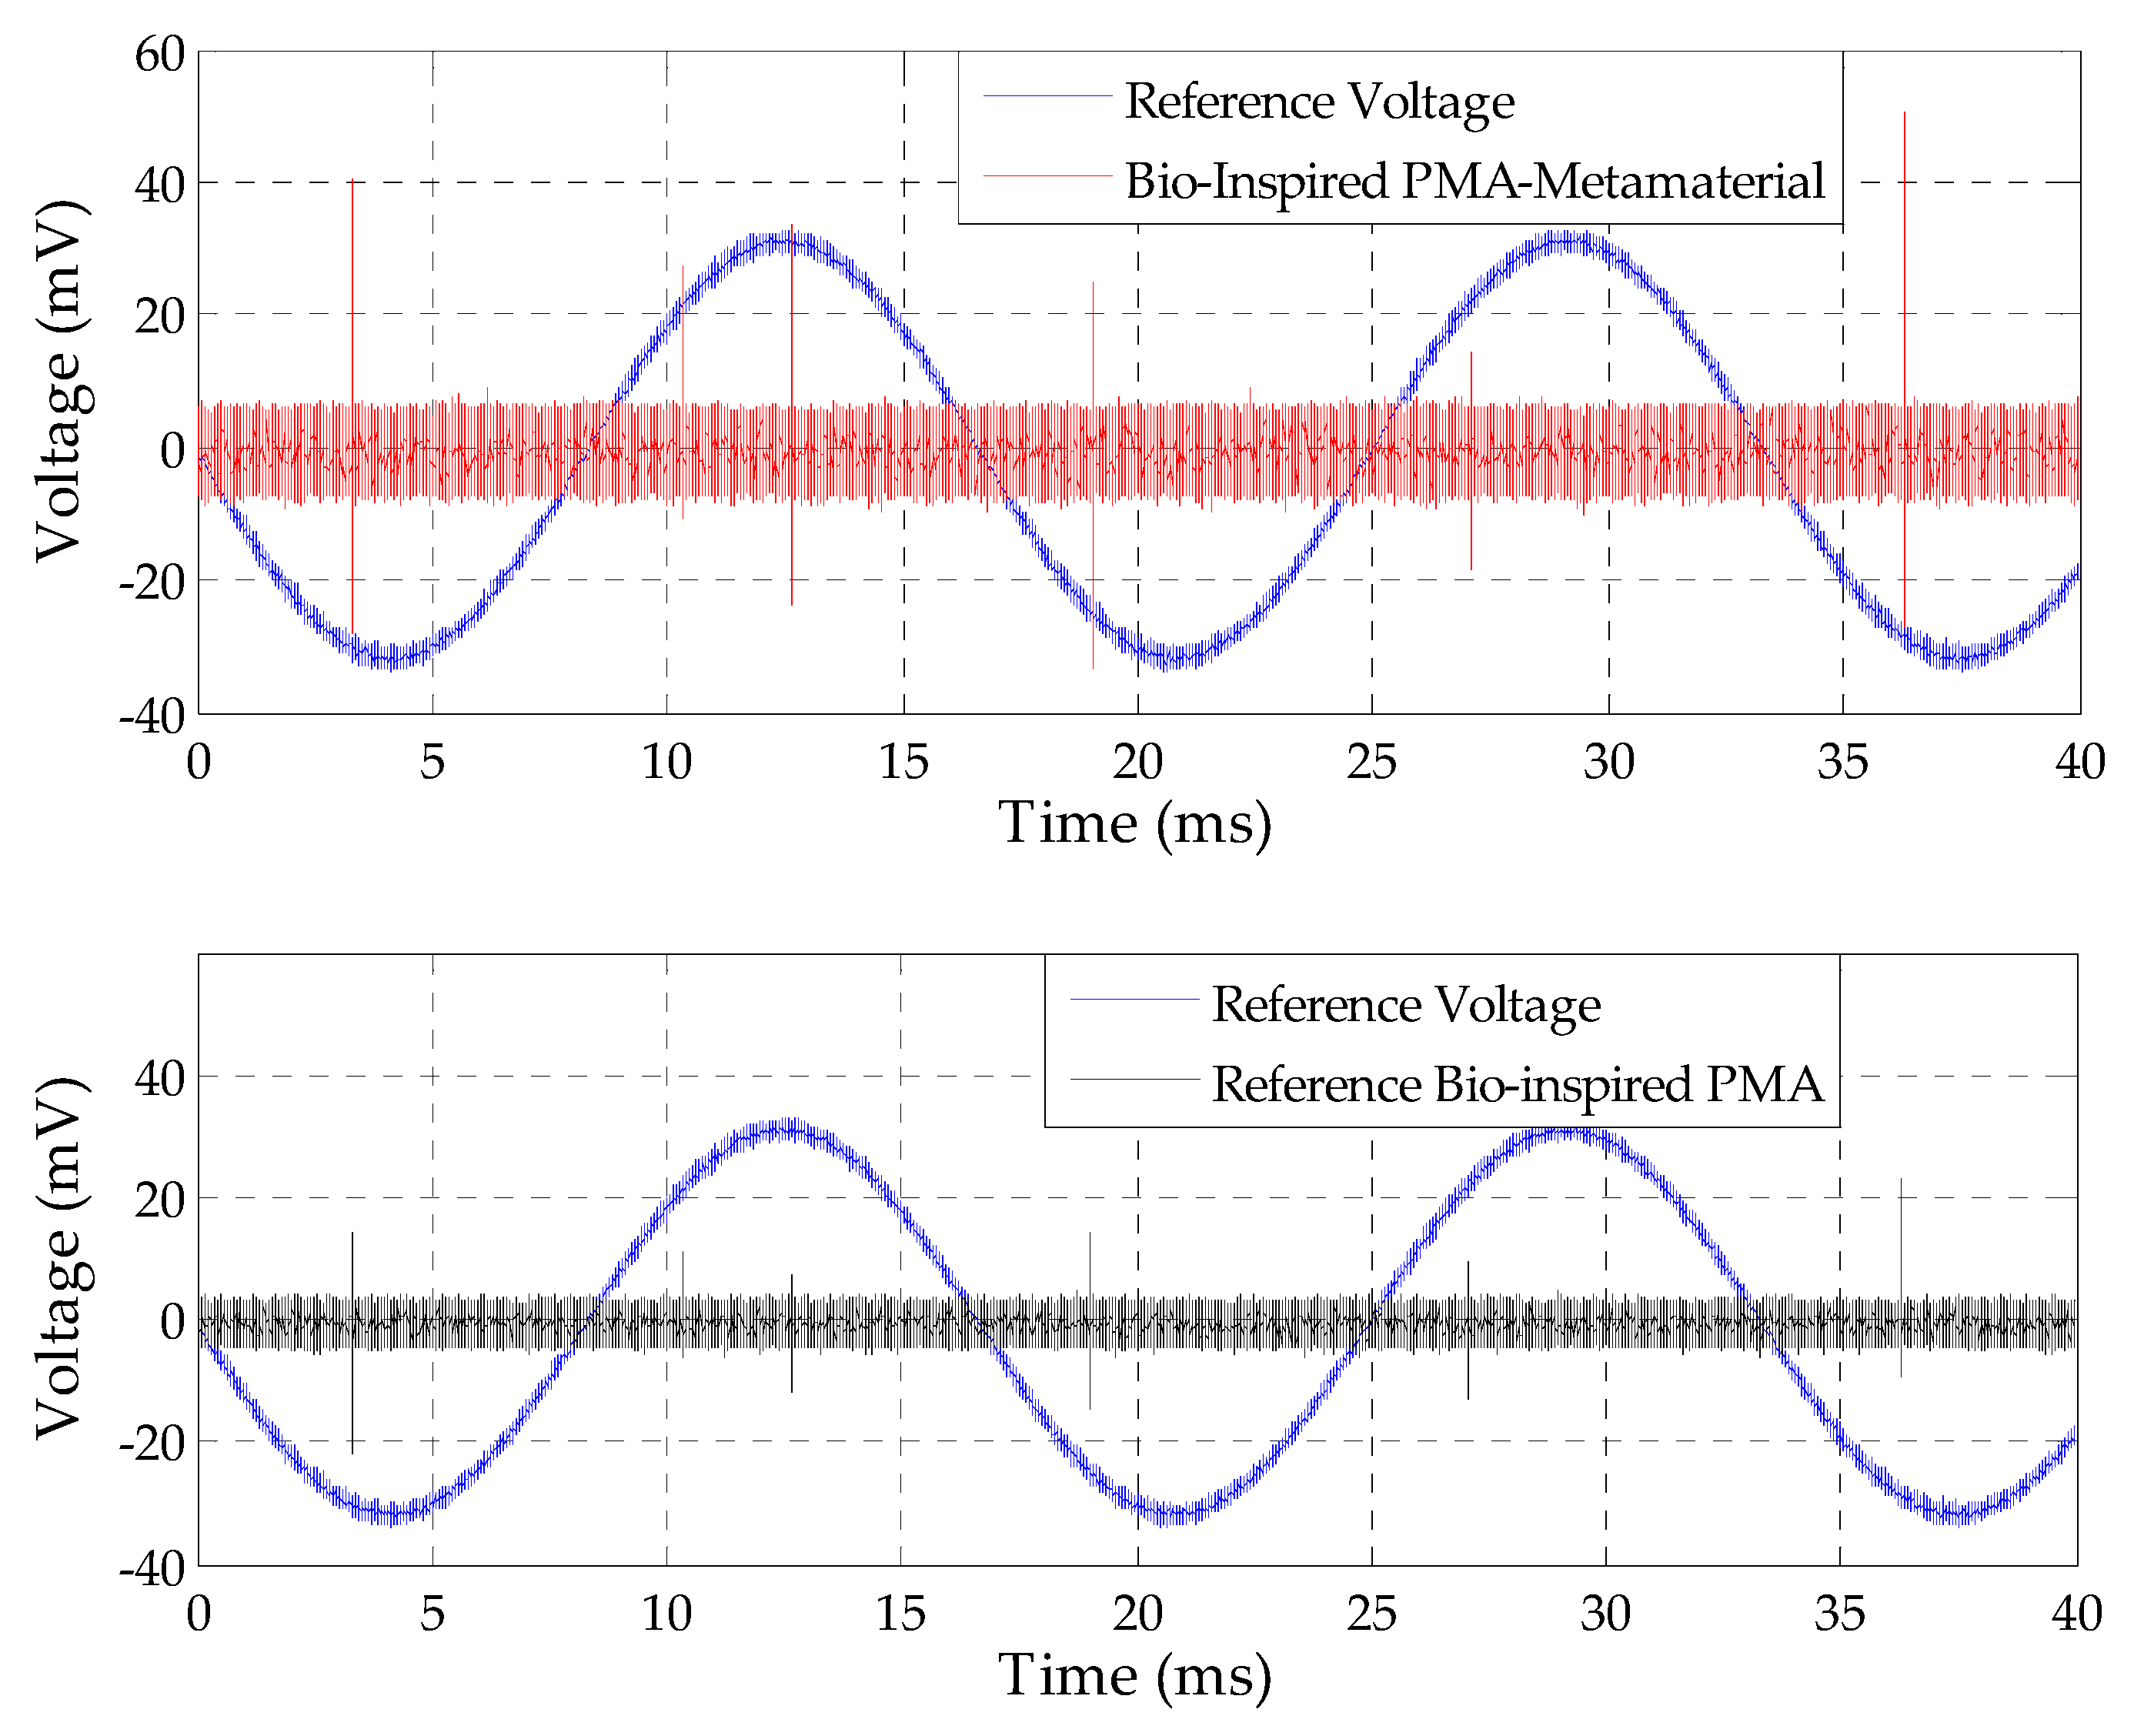
- In PD laboratory tests, the bio-inspired PMA-metamaterial set was able to detect apparent charges above 15 pC, generated in a point-to-plane electrode configuration in an oil cell;
- (9)
- The bio-inspired PMA presented measured voltage values with half of the magnitude obtained from the IEC 60270 standard method, resulting in a high PD detection sensitivity for a radiometric based method;
- (10)
- Lastly, the bio-inspired PMA-metamaterial set presented itself as effective in the practical PD detection application, since it was possible to detect a significant level of PD activity in a 230 kV substation CT.
Author Contributions
Funding
Acknowledgments
Conflicts of Interest
References
- Natrass, D.A. Partial Discharge Measurement and Interpretation. IEEE Electr. Insul. Mag. 1988, 4, 10–23. [Google Scholar] [CrossRef]
- Kreuger, F.H.; Gulski, E.; Krivda, A. Classification of partial discharges. IEEE Trans. Electr. Insul. 1993, 28, 917–931. [Google Scholar] [CrossRef]
- International Electrotechnical Comission. High Voltage Test Techniques: Partial Discharge Measurements; Technical Repost No. 60270; International Electrotechnical Comission: Geneva, Svitzerland, 2000. [Google Scholar]
- Stone, G. Partial discharge diagnostics and electrical equipment insulation condition assessment. IEEE Trans. Dielectr. Electr. Insul. 2005, 12, 891–904. [Google Scholar] [CrossRef]
- Meira, M.; Ruschetti, C.R.; Álvarez, R.E.; Verucchi, C.J. Power transformers monitoring based on electrical measurements. IET Gener. Transm. Distrib. 2018, 12, 2805–2815. [Google Scholar] [CrossRef]
- Stone, G.C. Condition monitoring and diagnostics of motor and stator windings—A review. IEEE Trans. Dielectr. Electr. Insul. 2013, 20, 2073–2080. [Google Scholar] [CrossRef]
- Refaat, S.S.; Shams, M.A. A review of partial discharge detection, diagnosis techniques in high voltage power cables. In Proceedings of the 2018 IEEE 12th International Conference on Compatibility, Power Electronics and Power Engineering (CPE-POWERENG), Ad Dawhah, Qatar, 4–10 December 2018. [Google Scholar]
- Sahoo, A.; Subramaniam, A.; Bhandari, S.; Panda, S.K. A review on condition monitoring of GIS. In Proceedings of the 2017 International Symposium Electrical Insulating Materials (ISEIM), Toyohashi City, Japan, 12–15 September 2017. [Google Scholar]
- Tenbohlen, S.; Denissov, D.; Hoek, S.M.; Markalous, S.M. Partial discharge measurement in the ultra high frequency (UHF) range. IEEE Trans. Dielectr. Electr. Insul. 2008, 15, 1544–1552. [Google Scholar] [CrossRef]
- Judd, M.; Pryor, B.; Kelly, S.; Hampton, B. Transformer monitoring using the UHF technique. In Proceedings of the 11th International Symposium on High Voltage Engineering (ISH), London, UK, 23–27 August 1999. [Google Scholar]
- Hampton, B.F.; Meats, R.J. Diagnostic measurements at UHF in gas insulated substations. IEEE Proc. 1988, 135, 137–144. [Google Scholar] [CrossRef]
- Masaki, K.; Sakakibara, T.; Murase, H.; Akazaki, M.; Uehara, K.; Menju, S. On-site measurement for the development of on-line partial discharge monitoring system in GIS. IEEE Trans. Power Del. 1994, 9, 805–810. [Google Scholar] [CrossRef]
- Judd, M.; Farish, O.; Pearson, J. UHF couplers for gas-insulated substations: A calibration technique. IEEE Proc. Sci. Meas. Technol. 1997, 144, 117–122. [Google Scholar] [CrossRef]
- Judd, M.; Yang, L.; Hunter, I. Partial discharge monitoring for power transformer using UHF sensors. Part I: Sensors and signal interpretation. IEEE Electr. Insul. Mag. 2005, 21, 5–14. [Google Scholar] [CrossRef]
- Lee, C.H.; Lin, Y.C.; Chiu, M.Y.; Huang, C.H.; Yen, S.S.; Haeng, C. The study on diagnostics for aging trend of cable termination. In Proceedings of the International Conference on Condition Monitoring and Diagnosis, Beijing, China, 21–24 April 2008. [Google Scholar]
- Judd, M.; Farish, O.; Pearson, J.S.; Hampton, B.F. Dielectric Windows for UHF Partial Discharge Detection. IEEE Trans. Dielectr. Electr. Insul. 2001, 8, 953–958. [Google Scholar] [CrossRef]
- Judd, M. Locating Partial Discharges in Power Transformers. In Proceedings of the 10th Euro TechCon, Warwick, UK, 7–9 November 2011. [Google Scholar]
- Hoshino, T.; Nojima, K.; Hanai, M. Real-time PD identification in diagnosis of GIS using symmetric and asymmetric UHF sensors. IEEE Trans. Power Del. 2004, 19, 1072–1077. [Google Scholar] [CrossRef]
- Ju, T.; Zhongrong, X.; Xiaoxing, Z.; Caixin, S. GIS partial discharge quantitative measurements using UHF microstrip antenna sensors. In Proceedings of the Annual Report on Electrical Insulation and Dielectric Phenomena, Vancouver, BC, Canada, 14–17 October 2007. [Google Scholar]
- Balanis, C. Antenna Theory–Analysis and Design; Wiley: Hoboken, NJ, USA, 2005. [Google Scholar]
- Ahmed, O.M.H.; Sebak, A.R. A Novel Maple-Leaf Shaped UWB Antenna with a 5.0–6.0 GHz Band-Notch Characteristic. Prog. Electromagn. Res. 2009, 11, 39–49. [Google Scholar] [CrossRef]
- Ebnabbasi, K. A bio-inspired printed-antenna transmission-range detection systems. IEEE Antennas Propag. Mag. 2013, 55, 193–200. [Google Scholar] [CrossRef]
- Silva, P.F., Jr.; Freire, R.C.S.; Serres, A.J.R.; Silva, P.H.F.; Silva, J.C. Wearable Textile Bioinspired Antenna for 2G, 3G and 4G Systems. Microw. Opt. Technol. Lett. 2016, 58, 2018–2023. [Google Scholar] [CrossRef]
- Serres, A.J.R.; Serres, G.K.F.; Silva, P.F., Jr.; Freire, R.C.S.; Cruz, J.N.; Albuquerque, T.C.; Oliveira, M.A.; Silva, P.H.F. Bio-Inspired Microstrip Antenna. IntechOpen 2017. [Google Scholar] [CrossRef] [Green Version]
- Cruz, J.N.; Serres, A.J.R.; Oliveira, A.C.; Xavier, G.V.R.; Albuquerque, C.C.R.; Costa, E.G.; Freire, R.C.S. Bio-Inspired Monopole Antenna Applied to Partial Discharge Detection. Sensors 2019, 19, 628. [Google Scholar] [CrossRef]
- Nobrega, L.A.M.M.; Xavier, G.V.R.; Aquino, M.V.D.; Serres, A.J.R.; Albuquerque, C.C.R.; Costa, E.G. Design and Development of a Bio-Inspired UHF Sensor for Partial Discharge Detection in Power Transformers. Sensors 2019, 19, 653. [Google Scholar] [CrossRef]
- Yang, F.; Peng, C.; Yang, Q.; Luo, H.; Ullah, I.; Yang, Y. An UWB Printed Antenna for Partial Discharge UHF Detection in High Voltage Switchgears. Prog. Electromagn. Res. C 2016, 69, 105–114. [Google Scholar] [CrossRef]
- Veselago, V.G. The Electrodynamics of Substances with Simultaneously Negative Values of ε and µ. Sov. Phys. Uspekhi 1968, 10, 509–514. [Google Scholar] [CrossRef]
- Pendry, J.B.; Holden, A.J.; Stewart, W.J.; Youngs, I.I. Extremely Low Frequency Plasmons in Metallic Mesostructures. Phys. Rev. Lett. 1996, 76, 4773–4776. [Google Scholar] [CrossRef] [PubMed] [Green Version]
- Pendry, J.B.; Holden, A.J.; Robbins, D.J.; Stewart, W.J. Magnetism from Conductors and Enhanced Nonlinear Phenomena. IEEE Trans. Microw. Theory Tech. 1999, 47, 2075–2084. [Google Scholar] [CrossRef]
- Shelby, R.A.; Smith, D.R.; Schultz, S. Experimental Verification of a Negative Index of Refraction. Science 2001, 292, 77–79. [Google Scholar] [CrossRef] [PubMed] [Green Version]
- Enoch, S.; Tayeb, G.; Sabouroux, P.; Guerin, N.; Vincent, P. A Metamaterial for Directive Emission. Phys. Rev. Lett. 2002, 89, 213902. [Google Scholar] [CrossRef] [PubMed] [Green Version]
- Ziolkowski, R.W.; Erentok, A. Metamaterial-Based Efficient Electrically Small Antennas. IEEE Trans. Antennas Propag. 2006, 54, 2113–2130. [Google Scholar] [CrossRef]
- Islam, M.T.; Islam, M.M.; Samsuzzaman, M.; Faruque, M.R.I.; Misran, N. A Negative Index Metamaterial-Inspired UWB Antenna with an Integration of Complementary SRR and CLS Unit Cells for Microwave Imaging Sensor Applications. Sensors 2015, 15, 11601–11627. [Google Scholar] [CrossRef] [Green Version]
- Soffiati, A.; Max, Y.; Silva, S.G.; Mendonça, L.M. Microwave Metamaterial-Based Sensor for Dielectric Characterization of Liquids. Sensors 2018, 18, 1513. [Google Scholar] [CrossRef] [PubMed]
- Majid, H.A.; Rahim, M.K.A.; Masri, T. Microstrip Antenna’s Gain Enhancement of Circular Microstrip Antenna with Left-Handed Metamaterial Structure. Prog. Electromagn. Res. 2009, 8, 235–247. [Google Scholar] [CrossRef]
- Srivastava, K.; Kumar, A.; Chadhary, P.; Kanaujia, B.K.; Dwari, S.; Verma, A.K.; Esselle, K.P.; Mittra, R. Wideband and High-Gain Circularly Polarized Microstrip Antenna Design Using Sandwiched Metasurfaces and Partially Reflecting Surface. IET Microw. Antennas Propag. 2018, 13, 305–312. [Google Scholar] [CrossRef]
- Das, S.; Mitra, D. A Compact Wideband Flexible Implantable Slot Antenna Design with Enhanced Gain. IEEE Trans. Antennas Propag. 2018, 66, 409–4314. [Google Scholar] [CrossRef]
- Singh, A.K.; Abegaonkar, M.P.; Koul, S.K. High Gain and High Aperture Efficiency Cavity Resonator Antenna Using Metamaterial Superstrate. IEEE Antennas Wirel. Propag. Lett. 2017, 16, 2388–2391. [Google Scholar] [CrossRef]
- Venkatesan, R.; Singaravelu, R. An Overview of Metamaterials in Biomedical Applications. In Proceedings of the Progress in Electromagnetics Research Symposium (PIERS), Stockholm, Sweden, 12–15 August 2013. [Google Scholar]
- Ramakrishna, S.A. Physics of negative refractive index materials. Rep. Prog. Phys. 2005, 68, 449. [Google Scholar] [CrossRef]
- Ojaroudiparchim, N.; Sheng, M.; Pedersen, G.F. Low-Profile Fabry-Pérot Cavity Antenna with Metamaterial SRR Cells for Fifth Generation Systems. In Proceedings of the 2016 21st International Conference on Microwave, Radar and Wireless Communications (MIKON), Krakow, Poland, 9–11 May 2016. [Google Scholar]
- Singh, A.K.; Abegaonkar, M.P.; Koul, S.K. A Negative Index Metamaterial Lens for Antenna Gain Enhancement. In Proceedings of the 2017 International Symposium on Antennas and Propagation (ISAP), Phuket, Thailand, 30 October–2 November 2017. [Google Scholar]
- Paleti, S.; Bhattacharjee, A. Design of PIFA Antenna with Metamaterial Superstrate at 2.4 GHz Using HFSS. In Proceedings of the International Conference on Communication and Signal Processing, Gold Coast, Australia, 13–15 December 2017. [Google Scholar]
- Priyadharisini, S.G.; Rufus, E. A Double Negative Metamaterial Inspired Miniaturized Rectangular Patch Antenna with Improved Gain and Bandwidth. In Proceedings of the Progress in Electromagnetics Research Symposium (PIERS), Singapore, 19–22 November 2017. [Google Scholar]
- Alhawari, A.R.H.; Ismail, A.; Mahdi, M.A. Compact Ultra-Wideband Metamaterial Antenna. In Proceedings of the Asia-Pacific Conference on Communications (APCC), Yogyakarta, Indonesia, 25–27 August 2016. [Google Scholar]
- Kumar, U.; Upadhyay, D.K.; Shahu, B.L. Improvement of performance parameters of rectangular patch antenna using metamaterial. In Proceedings of the IEEE International Conference on Recent Trends in Electronics Information Communication Technology, Bangalore, India, 20–21 May 2016. [Google Scholar]
- Smith, D.R.; Padilla, W.J.; Vier, D.C.; Nemat-Nasser, S.C.; Schultz, S. Composite Medium with Simultaneously Negative Permeability and Permittivity. Phys. Rev. Lett. 2000, 84, 4184–4187. [Google Scholar] [CrossRef] [PubMed] [Green Version]
- Ziolkowski, R.W. Design, Fabrication, and Testing of Double Negative Metamaterials. IEEE Trans. Antennas Propag. 2003, 51, 1516–1529. [Google Scholar] [CrossRef]
- Islam, M.T.; Ashraf, F.B.; Alam, T.; Misran, N.; Mat, K.B. A Compact Ultrawideband Antenna Based on Hexagonal Split-Ring Resonator for pH Sensor Application. Sensors 2018, 18, 2959. [Google Scholar] [CrossRef]
- Pandit, S.; Mohan, A.; Ray, P. A Low-Profile High-Gain Substrate Integrated Waveguide Slot Antenna with Suppressed Cross-Polarization using Metamaterial. IEEE Antennas Wirel. Propag. Lett. 2017, 16, 1614–1617. [Google Scholar] [CrossRef]
- Zheng, Y.; Gao, J.; Zhou, Y.; Cao, Z.; Yang, H.; Li, S.; Li, T. Wideband Gain Enhancement and RCS Reduction of Fabry-Perot Resonator Antenna with Chessboard Arranged Metamaterial Superstrate. IEEE Trans. Antennas Propag. 2017, 66, 590–599. [Google Scholar] [CrossRef]
- Hashemi, S.K. Microwave Devices and Techniques for Ultra Wideband (UWB) Communication Systems. Ph.D. Thesis, University of Essex, Colchester, UK, 2011. [Google Scholar]
- Smith, D.R.; Schultz, S.; Markos, P.; Soukoulis, C.M. Determination of effective permittivity and permeability of metamaterials from reflection and transmission coefficients. Phys. Rev. B 2002, 65, 195104. [Google Scholar] [CrossRef] [Green Version]
- Jaber, A.A.; Lazaridis, P.I.; Moradzadeh, M.; Glover, I.A.; Zharis, Z.D.; Vieira, M.F.; Judd, M.D.; Atkinson, R.C. Calibration of Free-space Radiometric Partial Discharge Measurements. IEEE Trans. Dielectr. Electr. Insul. 2017, 24, 3004–3014. [Google Scholar] [CrossRef]
- Bartnikas, R.; McMahon, E. Engineering Dielectrics 1: Corona Measurement and Interpretation; ASTM International: West Conshohocken, PA, USA, 1979. [Google Scholar]
- Ogihara, H. Detection and location of coronas in oil immersed transformers with corona detector. Electr. Eng. Jpn. 1964, 84, 12–21. [Google Scholar]
- International Electrotechnical Commission (IEC). Power Transformer–Part 1: General; IEC: Geneva, Switzerland, 2011. [Google Scholar]
- Wang, M.; Vandermaar, A.J.; Srivastava, K.D. Review of condition assessment of power transformers in service. IEEE Electr. Insul. Mag. 2002, 18, 12–25. [Google Scholar] [CrossRef]
- Jaber, A.; Lazaridis, P.; Saeed, B.; Zhang, Y.; Khan, U.; Upton, D.; Ahmed, H.; Upton, D.; Mather, P.J.; Atkinson, R.C.; et al. Frequency spectrum analysis of radiated partial discharge signals. In Proceedings of the EUROEM 2016, London, UK, 11–14 July 2016. [Google Scholar]
- Chai, H.; Phung, B.T.; Zhang, D. Development of UHF Sensors for Partial Discharge Detection in Power Transformer. In Proceedings of the 2018 Condition Monitoring and Diagnosis (CMD), Perth, WA, Australia, 23–26 September 2018. [Google Scholar]
- Zhang, Y.; Lazaridis, P.; ABD-Alhameed, R.; Glover, I. A compact wideband printed antenna for free-space radiometric detection of partial discharge. Turk. J. Electr. Eng. Comput. Sci. 2017, 25, 1291–1299. [Google Scholar] [CrossRef]
- Mukhtar, S.M.; Isa, M.; Al-Hadi, A.A. Design of UHF Antenna Sensor for Partial Discharge Detection in High Voltage Substation. IOP Conf. Ser. Mater. Sci. Eng. 2018, 318, 1–6. [Google Scholar] [CrossRef]
- Wang, Y.; Wu, J.; Chen, W.; Wang, Y. Design of a UHF Antenna for Partial Discharge Detection of Power Equipment. J. Sensors 2014, 1–8. [Google Scholar] [CrossRef]
- Zhang, Y.; Glover, I. Design of an Ultrawideband VHF/UHF Antenna for Partial Discharge Detection. In Proceedings of the 2014 IEEE International Conference on Signal Processing, Communications and Computing (ICSPCC), Guilin, China, 5–8 August 2014 2014. [Google Scholar]
- Marchal, A.; Monedero, M.; Le Thuc, P.; Staraj, R. Ultra-wide band antenna for partial discharge detection inside switchgear for on-line monitoring. In Proceedings of the 2018 IEEE Conference on Antenna Measurements & Applications (CAMA), Vasteras, Sweden, 3–6 September 2018. [Google Scholar]
- Bin, L.; Jingle, A.; Weidong, Z.; Youlin, X. A Design of Multi-band UHF Sensor for Partial Discharge Detection. Trans. Tech. Publ. Appl. Mech. Mater. 2013, 394, 435–440. [Google Scholar]
- Liu, J.; Zhang, G.; Dong, J.; Wang, J. Study on Miniaturized UHF Antennas for Partial Discharge Detection in High-Voltage Electrical Equipment. Sensors 2015, 15, 29434–29451. [Google Scholar] [CrossRef]
- Ye, H.; Qian, Y.; Dong, Y.; Sheng, G.; Jiang, X. Development of multi-band ultra-high-frequency sensor for partial discharge monitoring based on the meandering technique. IET Sci. Meas. Technol. 2014, 8, 327–335. [Google Scholar]
- Li, J.; Wang, P.; Jiang, T.; Bao, L.; He, Z. UHF stacked Hilbert antenna array for partial discharge detection. IEEE Trans. Antenn. Propag. 2013, 61, 5798–5801. [Google Scholar] [CrossRef]
- Yao, C.; Chen, P.; Huang, C.; Chen, Y.; Qiao, P. Study on the Application of an Ultra-High-Frequency Fractal Antenna to Partial Discharge Detection in Switchgears. Sensors 2013, 13, 17362–17378. [Google Scholar] [CrossRef] [Green Version]
- Yongqiang, W.; Zhuang, W.; Jianfang, L. UHF Moore Fractal Antenna for Online GIS PD Detection. IEEE Antennas Wirel. Propag. Lett. 2017, 16, 852–855. [Google Scholar]
- Lopez-Roldan, J.; Tang, T.; Gaskin, M. Optmisation of a sensor for onsite detection of partial discharges in power transformers by the UHF method. IEEE Trans. Dielect. Electr. Insul. 2008, 15, 1634–1639. [Google Scholar] [CrossRef]
- FT-RF 500 MHz to 8 GHz Double Ridged Broadband Waveguide Horn Antenna. Model: HA-05M08G-NF. Available online: http://www.ft-rf.com/front/bin/ptdetail.phtml?Part=500MHz-8GHz-Double-Ridge-Broadband-Antenna-N-Female&Category=359789 (accessed on 29 September 2019).
- EC Microwave Broadband Horn Antenna Operating From 500 MHz to 3 GHz Double Ridged. Available online: http://www.ecmicrowave.com/m_product/96-Broadband-Horn-Antenna-Operating-from-500MHz-to-3GHz-Double-Ridged.html (accessed on 29 September 2019).
- Bancroft, R.; Chou, R.C. Vivaldi Antenna Impedance Bandwidth Dpendence on Stripline to Bilateral Slotline Transition. Microwave Opt. Technol. Lett. 2013, 55, 937–941. [Google Scholar] [CrossRef]
- Biancheri-Astier, M.; Diet, A.; Le Bihan, Y.; Grzeskowiak, M. UWB Vivaldi Antenna Array Lower Band Improvement for Ground Penetrating Radar Applications. Radioengineering 2019, 28, 92–98. [Google Scholar] [CrossRef]
- Aaronia AG Active Highhend LogPer Antenne HyperLOG 30100X. Available online: https://www.aaronia.com/products/antennas/HyperLog-30100-X/ (accessed on 29 September 2019).


| Apparent Charge (pC) | Voltage (mV) |
|---|---|
| 20 | 25.6 |
| 100 | 121 |
| 500 | 584 |
| Model | Maximum Mean Gain (dBi) |
|---|---|
| Bio-inspired PMA | 2.81 |
| FR4 Superstrate | 2.83 |
| Rectangular SRR | 3.96 |
| Circular SRR | 4.07 |
| Antenna | Bandwidth (GHz) | Gain (dBi) | Size (mm) |
|---|---|---|---|
| Proposed PMA-Metamaterial Set | 0.5–1.5 | 3.61 (mean) | 200 × 200 × 135 (depth) |
| [74] (Hornet Antenna) | 0.5–8 | 3–17 | 418 × 318 × 645 (length) |
| [75] (Hornet Antenna) | 0.5–3 | 4–11 | 440 × 290 × 350 (length) |
| [76] (Vivaldi Antenna) | 0.5–6 | 3.07–7.7 | 120 (width) × 225 (length) |
| [77] (Vivaldi Antenna) | 0.5–4 | 2–11 | 173 (width) × 299 (length) |
| [78] (Reference Antenna–Hyperlog 30100X) | 0.4–10 | 4.5 (mean) | 360 (width) × 640 (length) |
© 2019 by the authors. Licensee MDPI, Basel, Switzerland. This article is an open access article distributed under the terms and conditions of the Creative Commons Attribution (CC BY) license (http://creativecommons.org/licenses/by/4.0/).
Share and Cite
Xavier, G.V.R.; Serres, A.J.R.; da Costa, E.G.; de Oliveira, A.C.; Nobrega, L.A.M.M.; de Souza, V.C. Design and Application of a Metamaterial Superstrate on a Bio-Inspired Antenna for Partial Discharge Detection through Dielectric Windows. Sensors 2019, 19, 4255. https://doi.org/10.3390/s19194255
Xavier GVR, Serres AJR, da Costa EG, de Oliveira AC, Nobrega LAMM, de Souza VC. Design and Application of a Metamaterial Superstrate on a Bio-Inspired Antenna for Partial Discharge Detection through Dielectric Windows. Sensors. 2019; 19(19):4255. https://doi.org/10.3390/s19194255
Chicago/Turabian StyleXavier, George Victor Rocha, Alexandre Jean René Serres, Edson Guedes da Costa, Adriano Costa de Oliveira, Luiz Augusto Medeiros Martins Nobrega, and Vladimir Cesarino de Souza. 2019. "Design and Application of a Metamaterial Superstrate on a Bio-Inspired Antenna for Partial Discharge Detection through Dielectric Windows" Sensors 19, no. 19: 4255. https://doi.org/10.3390/s19194255
APA StyleXavier, G. V. R., Serres, A. J. R., da Costa, E. G., de Oliveira, A. C., Nobrega, L. A. M. M., & de Souza, V. C. (2019). Design and Application of a Metamaterial Superstrate on a Bio-Inspired Antenna for Partial Discharge Detection through Dielectric Windows. Sensors, 19(19), 4255. https://doi.org/10.3390/s19194255