Realtime Tracking of Passengers on the London Underground Transport by Matching Smartphone Accelerometer Footprints


Abstract
:1. Introduction
- First and foremost, the whole system requires no additional infrastructure or hardware to be installed anywhere on the underground network. It leverages the user’s smartphone to provide the tracking service.
- The system is self-contained in the form of an app. The inputs will be recorded by the app, which also contains the training database and the route estimation mechanism.
- Only low-power accelerometers with minimal impact on battery consumption is used.
- Although privacy is not our primary focus, it is worth adding that no internet connection is needed for our system. The positioning service is delivered completely offline and locally via the app. Hence, the user may remain anonymous while using the service, if so wished.
2. Underground Transport Tracking with Smartphone Accelerometer
2.1. The Inspirations of Using Accelerometer for Passenger Tracking
- The rail-line infrastructure is fixed amongst stations All trains must go through the same predetermined route connecting 2 consecutive stations. Therefore, it is possible to record the shape of the underground infrastructure in terms of the sensor language into a training database. As the London underground network is over 150 years old, their structure does not change significantly over time, making it much easier to maintain such a database.
- London underground tubes are autonomous vehicles. Despite not being advertised widely, London tubes are programmed to operate automatically. This means the states of acceleration from a station, of deceleration until the destination, and of running between stations are reproducible and may be matched against the above training database. More importantly, there are currently 8 different rolling stocks operating on 11 London underground lines. Each of them accelerates and decelerates differently.
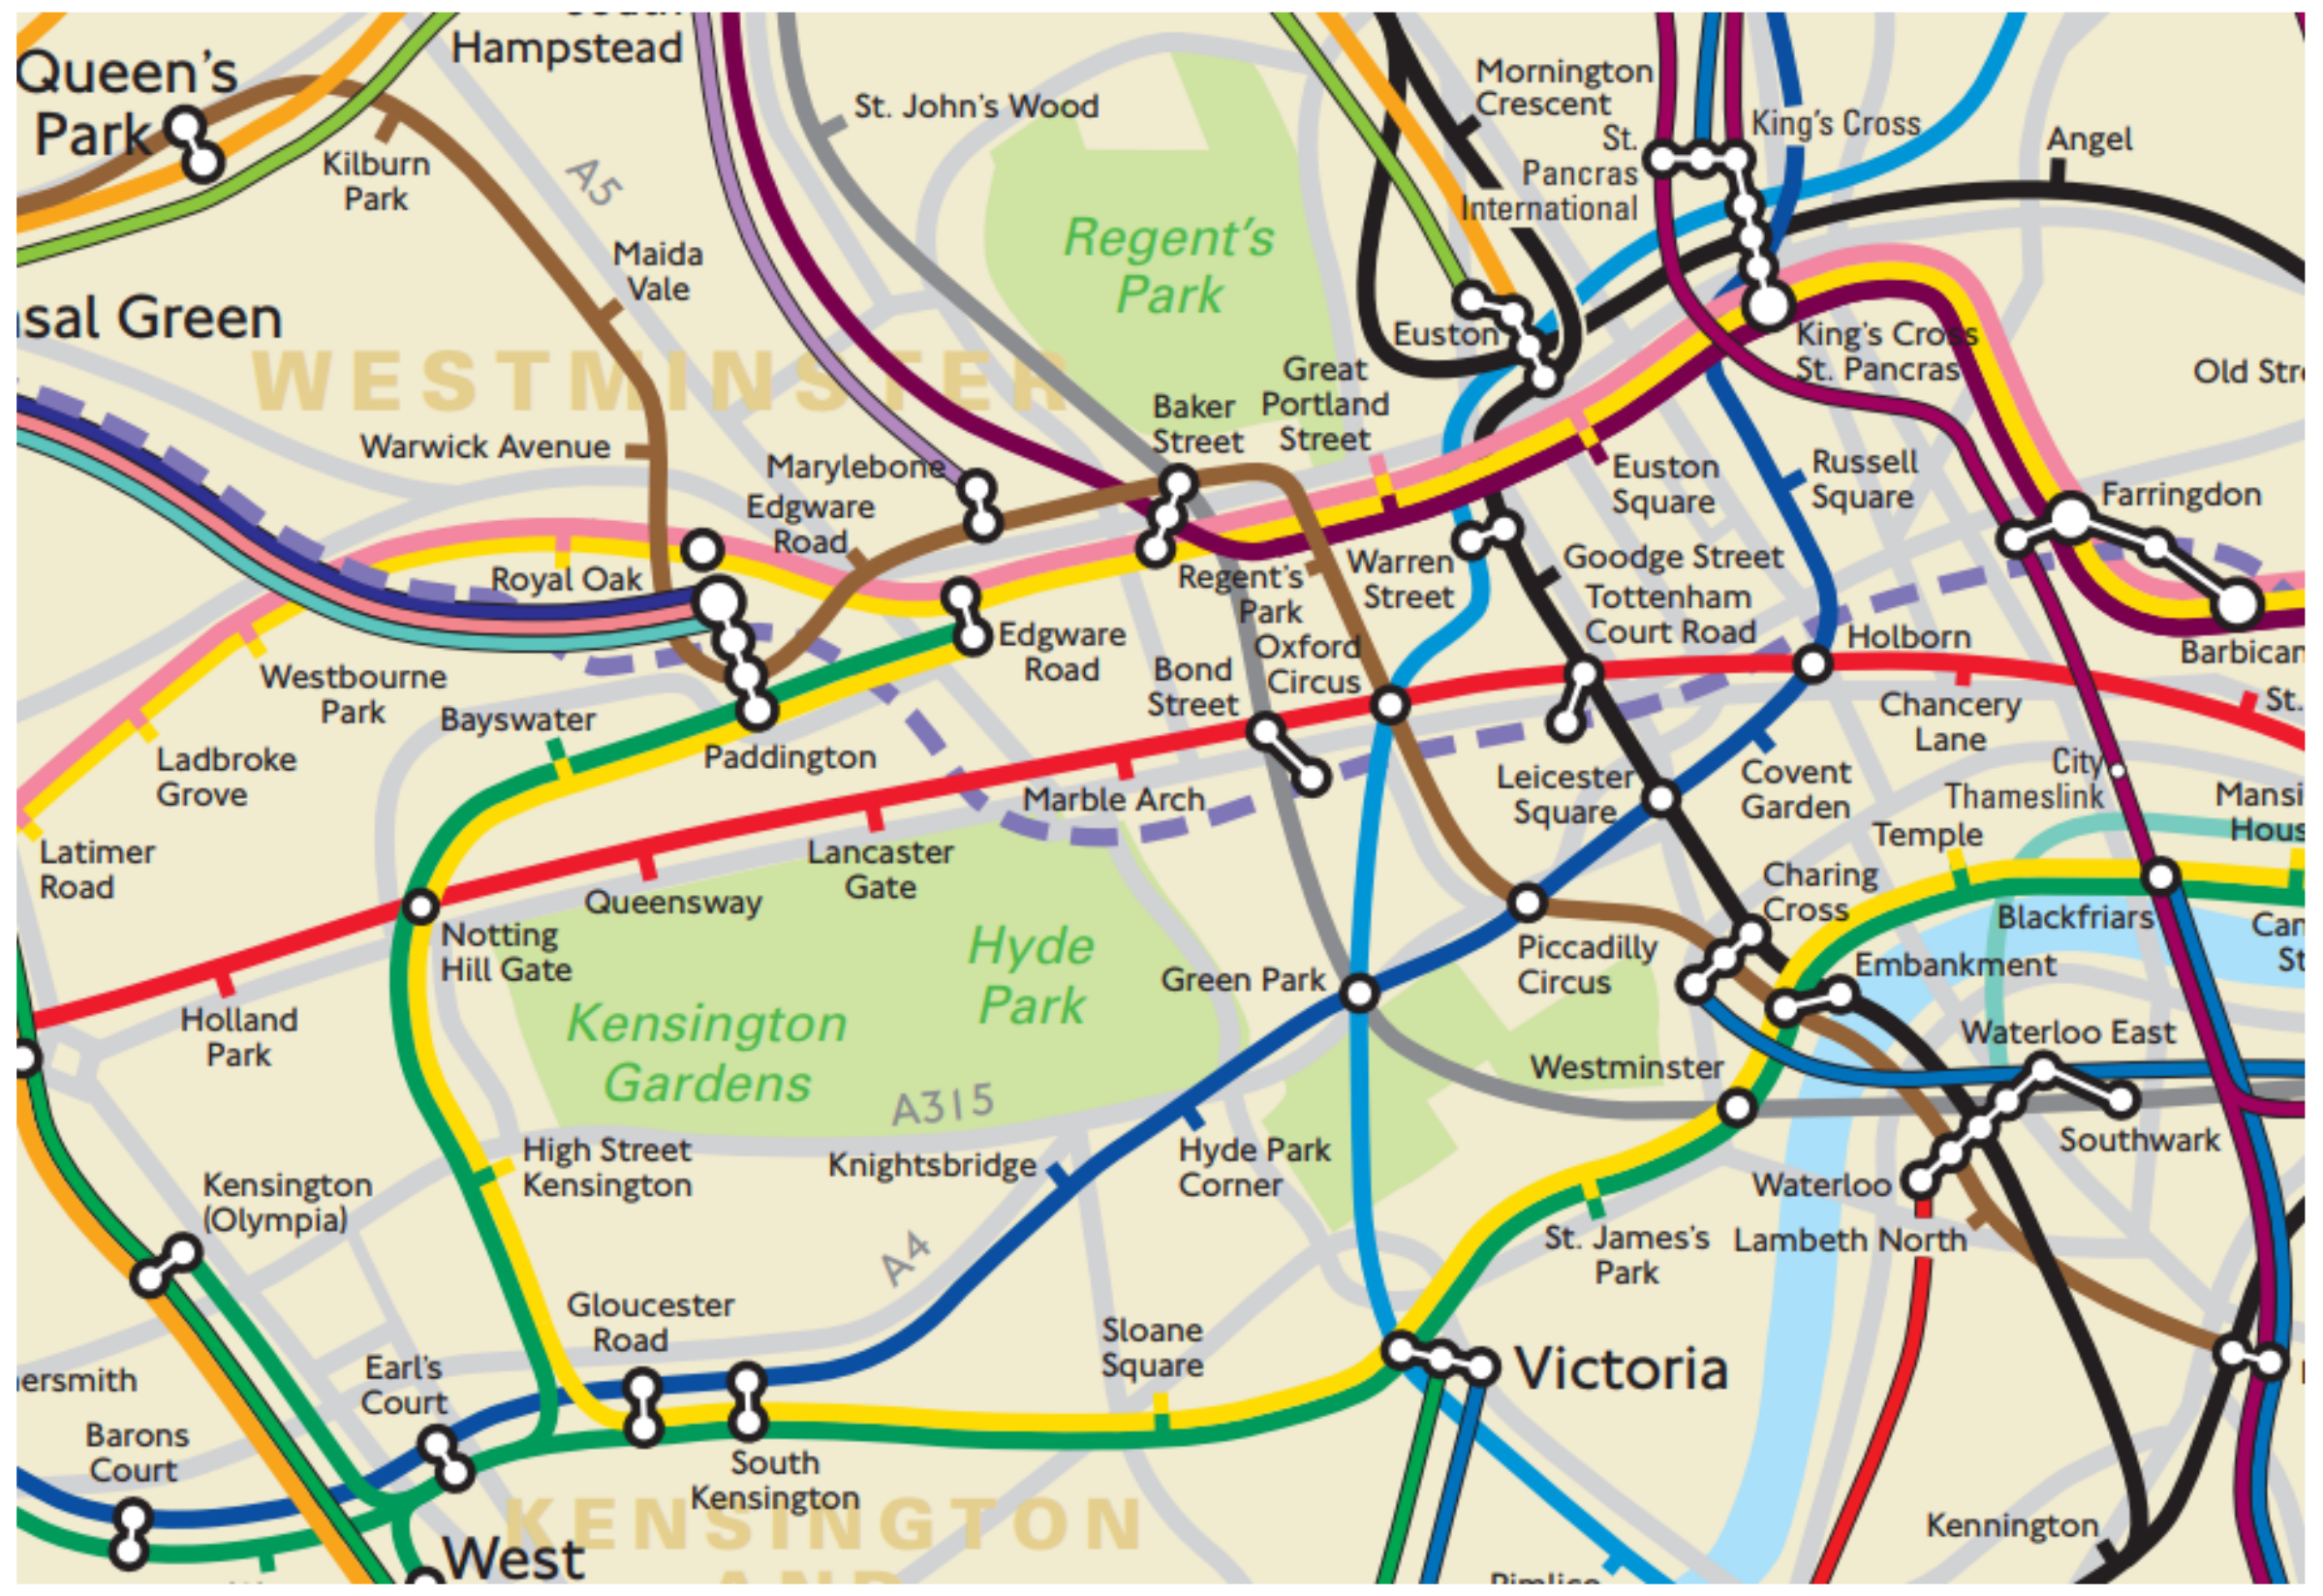
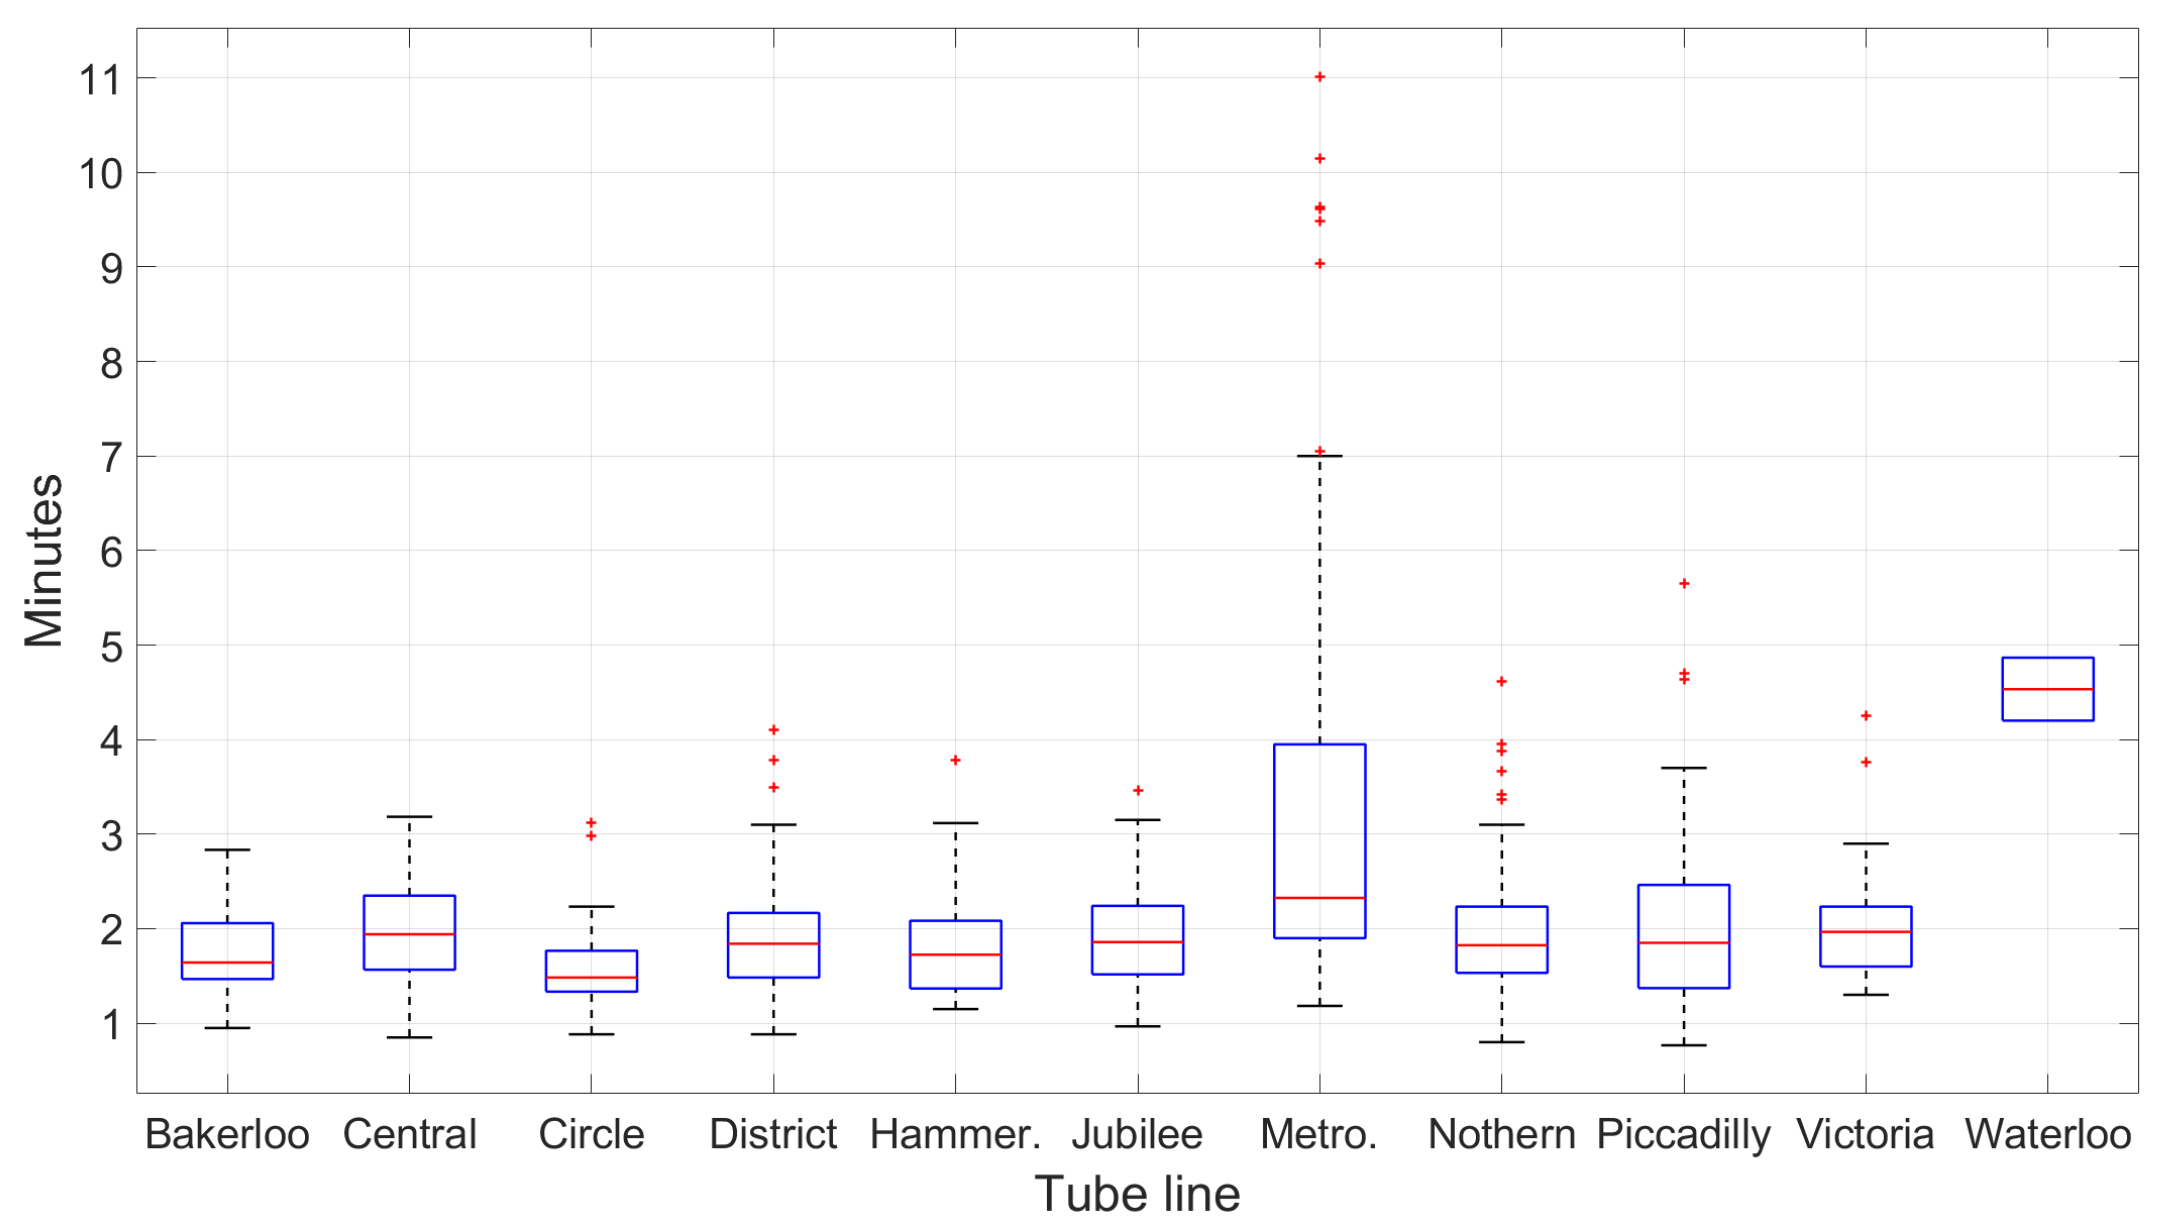
- The trip between two consecutive underground stations is short (see Figure 2). This characteristic is important to control the nature of sensor drifting, which will happen over time as error quickly accumulates.
- Underground carriages have limited space while running at high speed. Being in a confined environment would limit passengers’ movements. They would normally have to sit down or hang onto the handrails and hanging straps while standing still, which enables the phone to measure the true movements of the train (http://content.tfl.gov.uk/london-connections-map.pdf—last accessed in May 2019).
2.2. Mobile Accelerometer
2.3. The Challenges
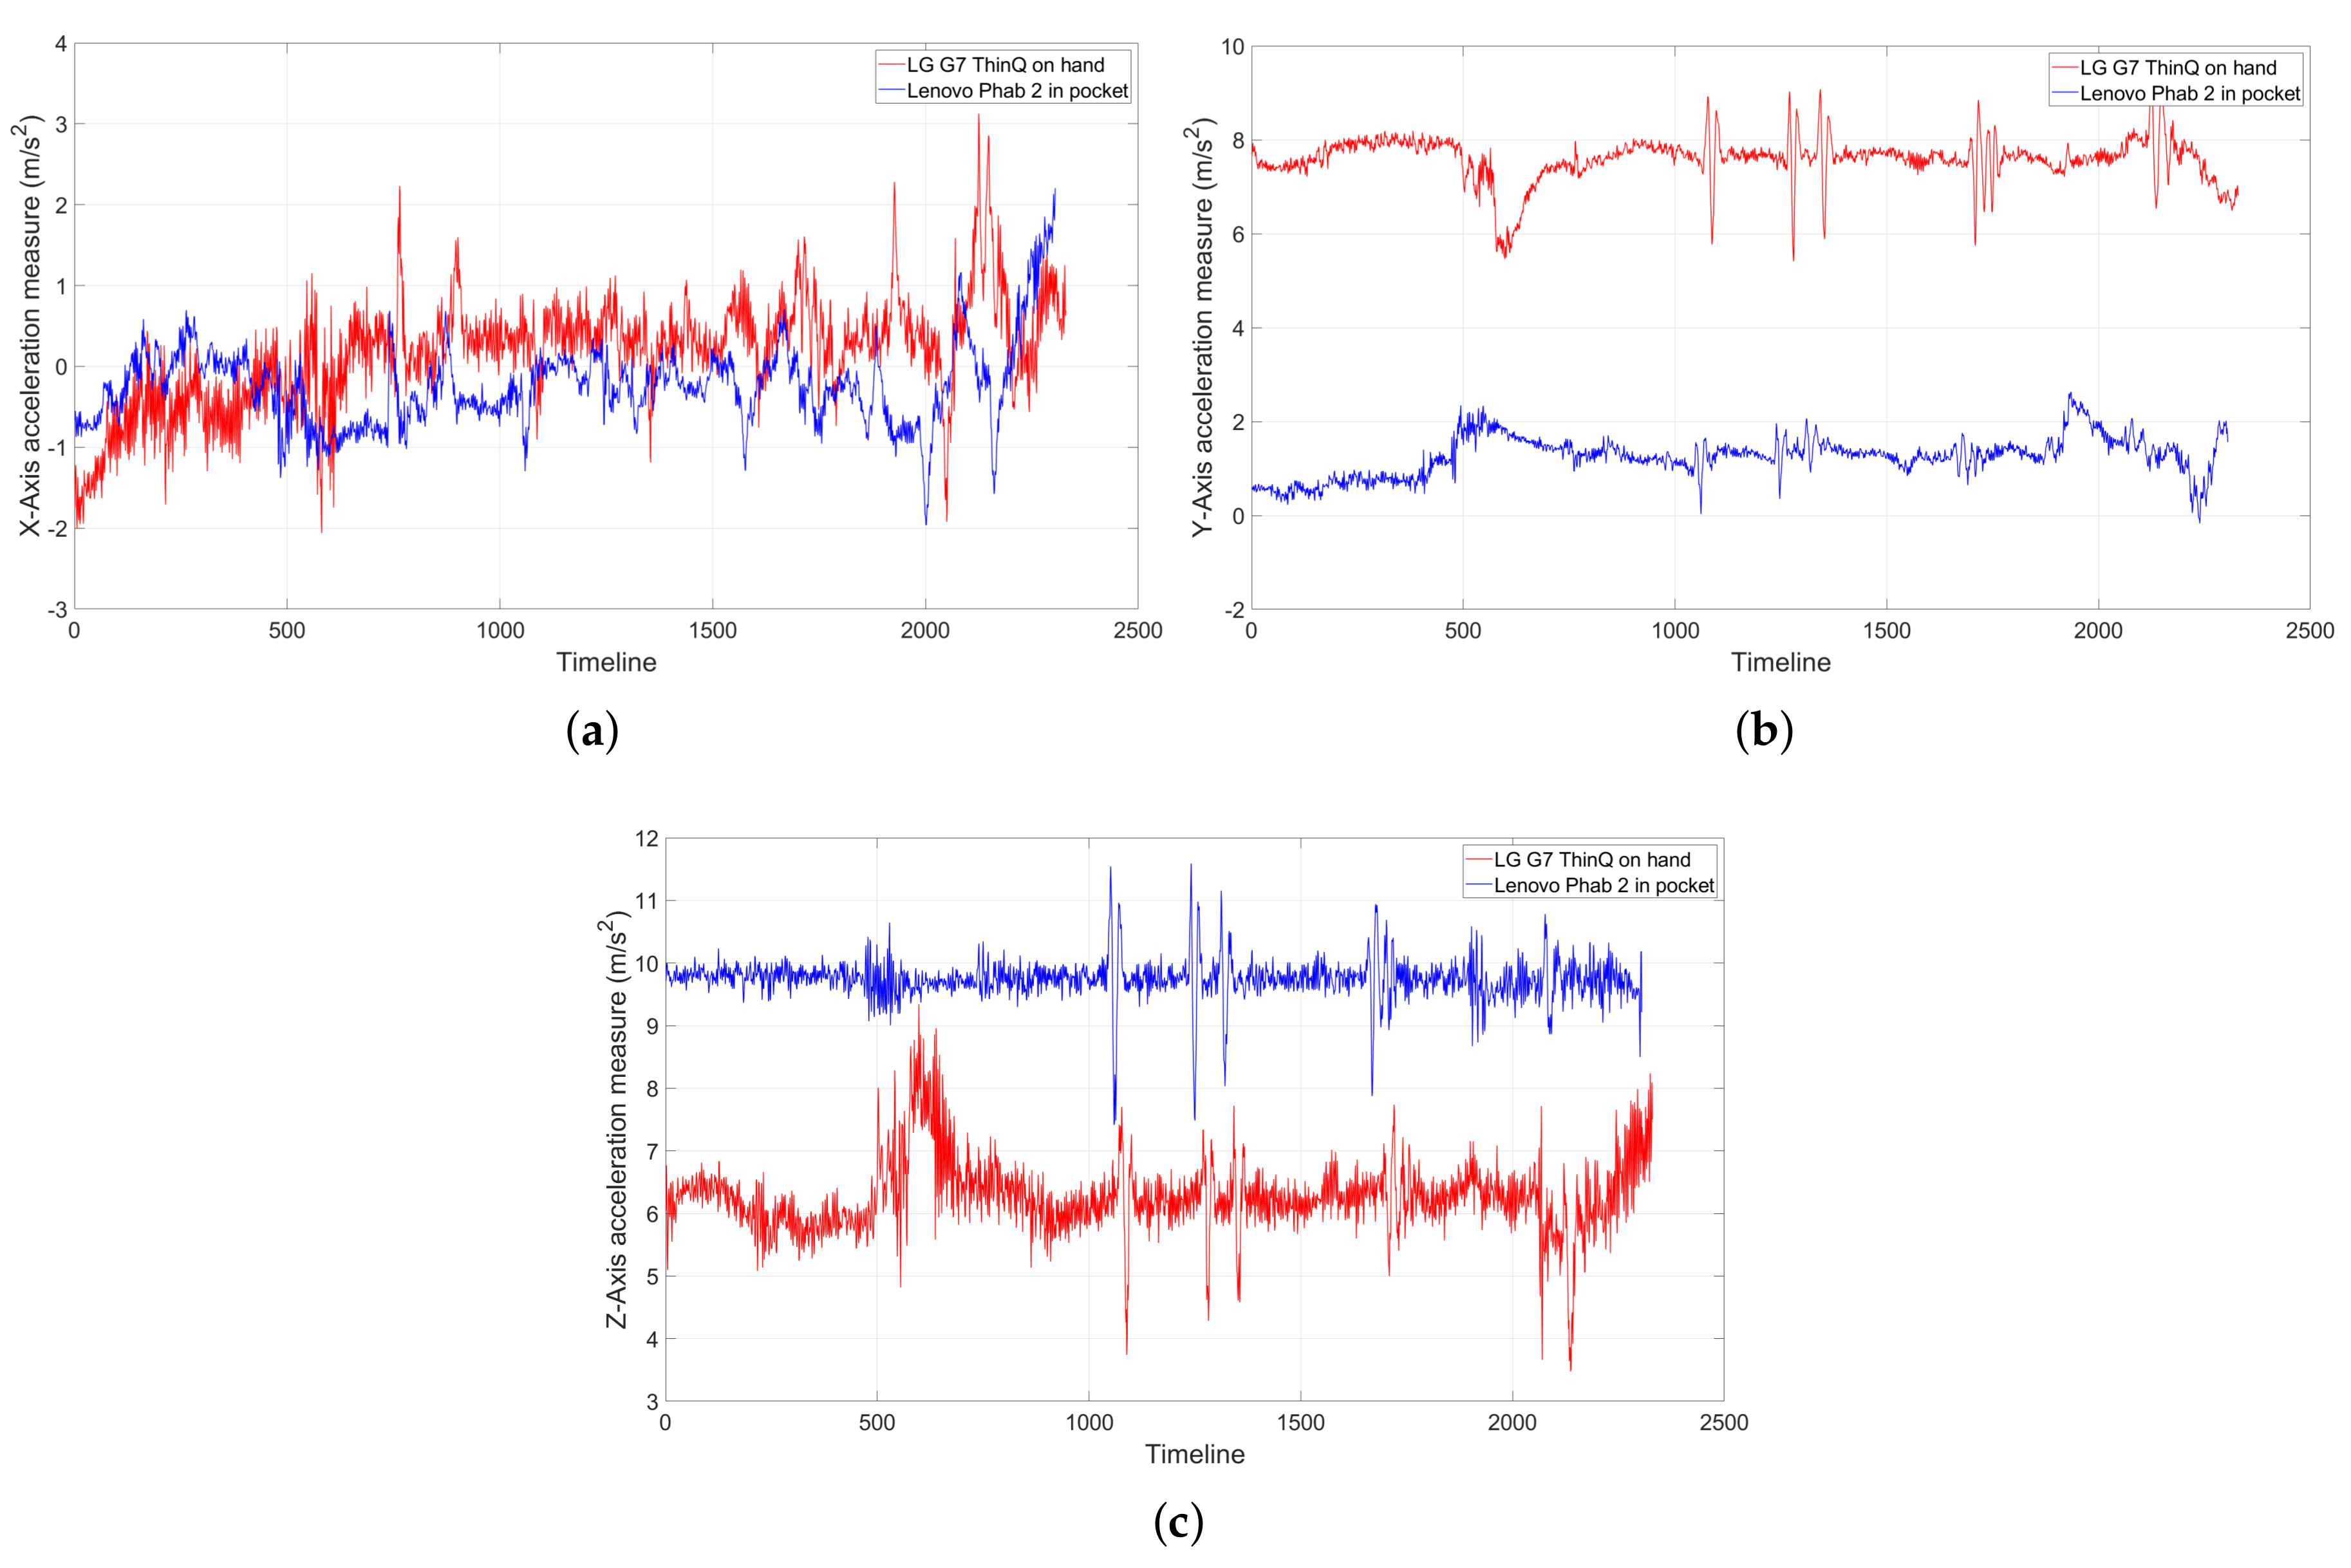
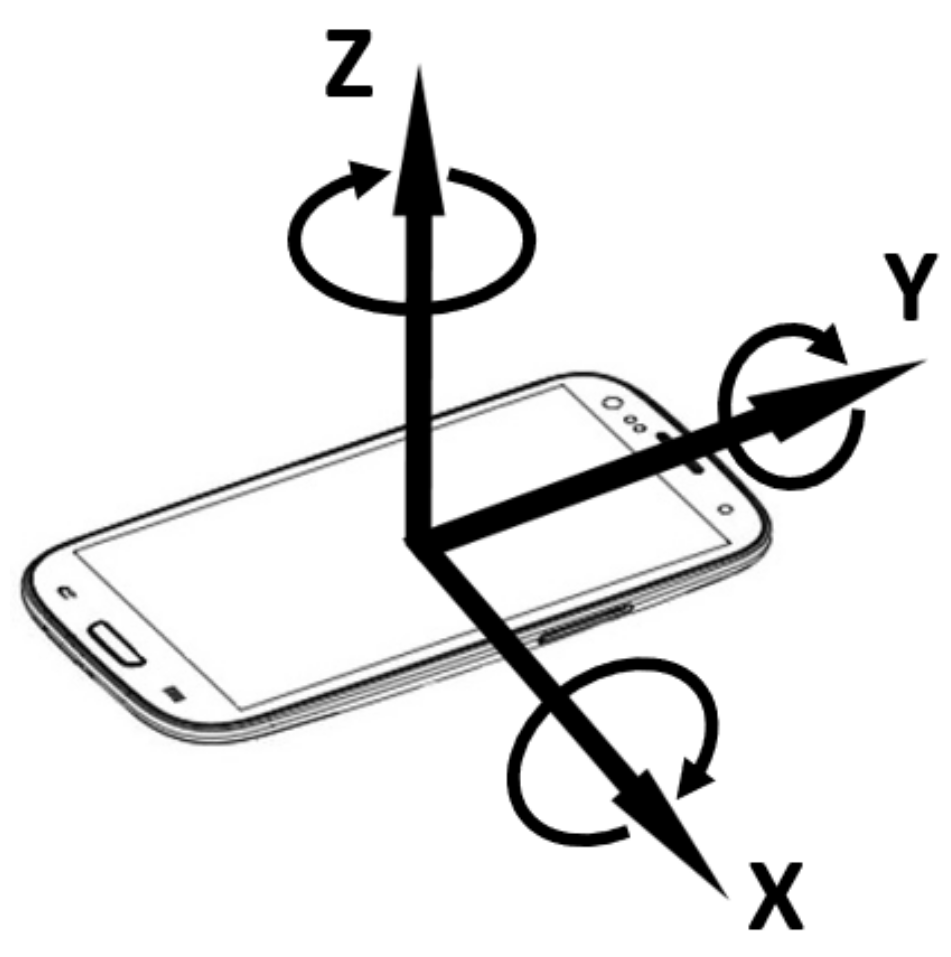
- Unconstrained sensor orientation. The accelerometer’s coordinates align with the phone’s 3-dimensional frame. As such, the measures vary as the phone’s orientation changes, despite being in the same position. The challenge is we do not know how the passenger is holding the phone. The magnetometer, often used to estimate true north, is unfortunately not usable in our case, as magnetic disturbance is too high underground.
- Unrelated measures. Small human gestures (e.g., leg shaking and swift arm moving) and electrical noises may be mistakenly as train movements.
- Unexpected train movements. During rush hours, trains may not adhere to scheduled movements by stopping midway due to congestion, which invalidates the use of our training database.
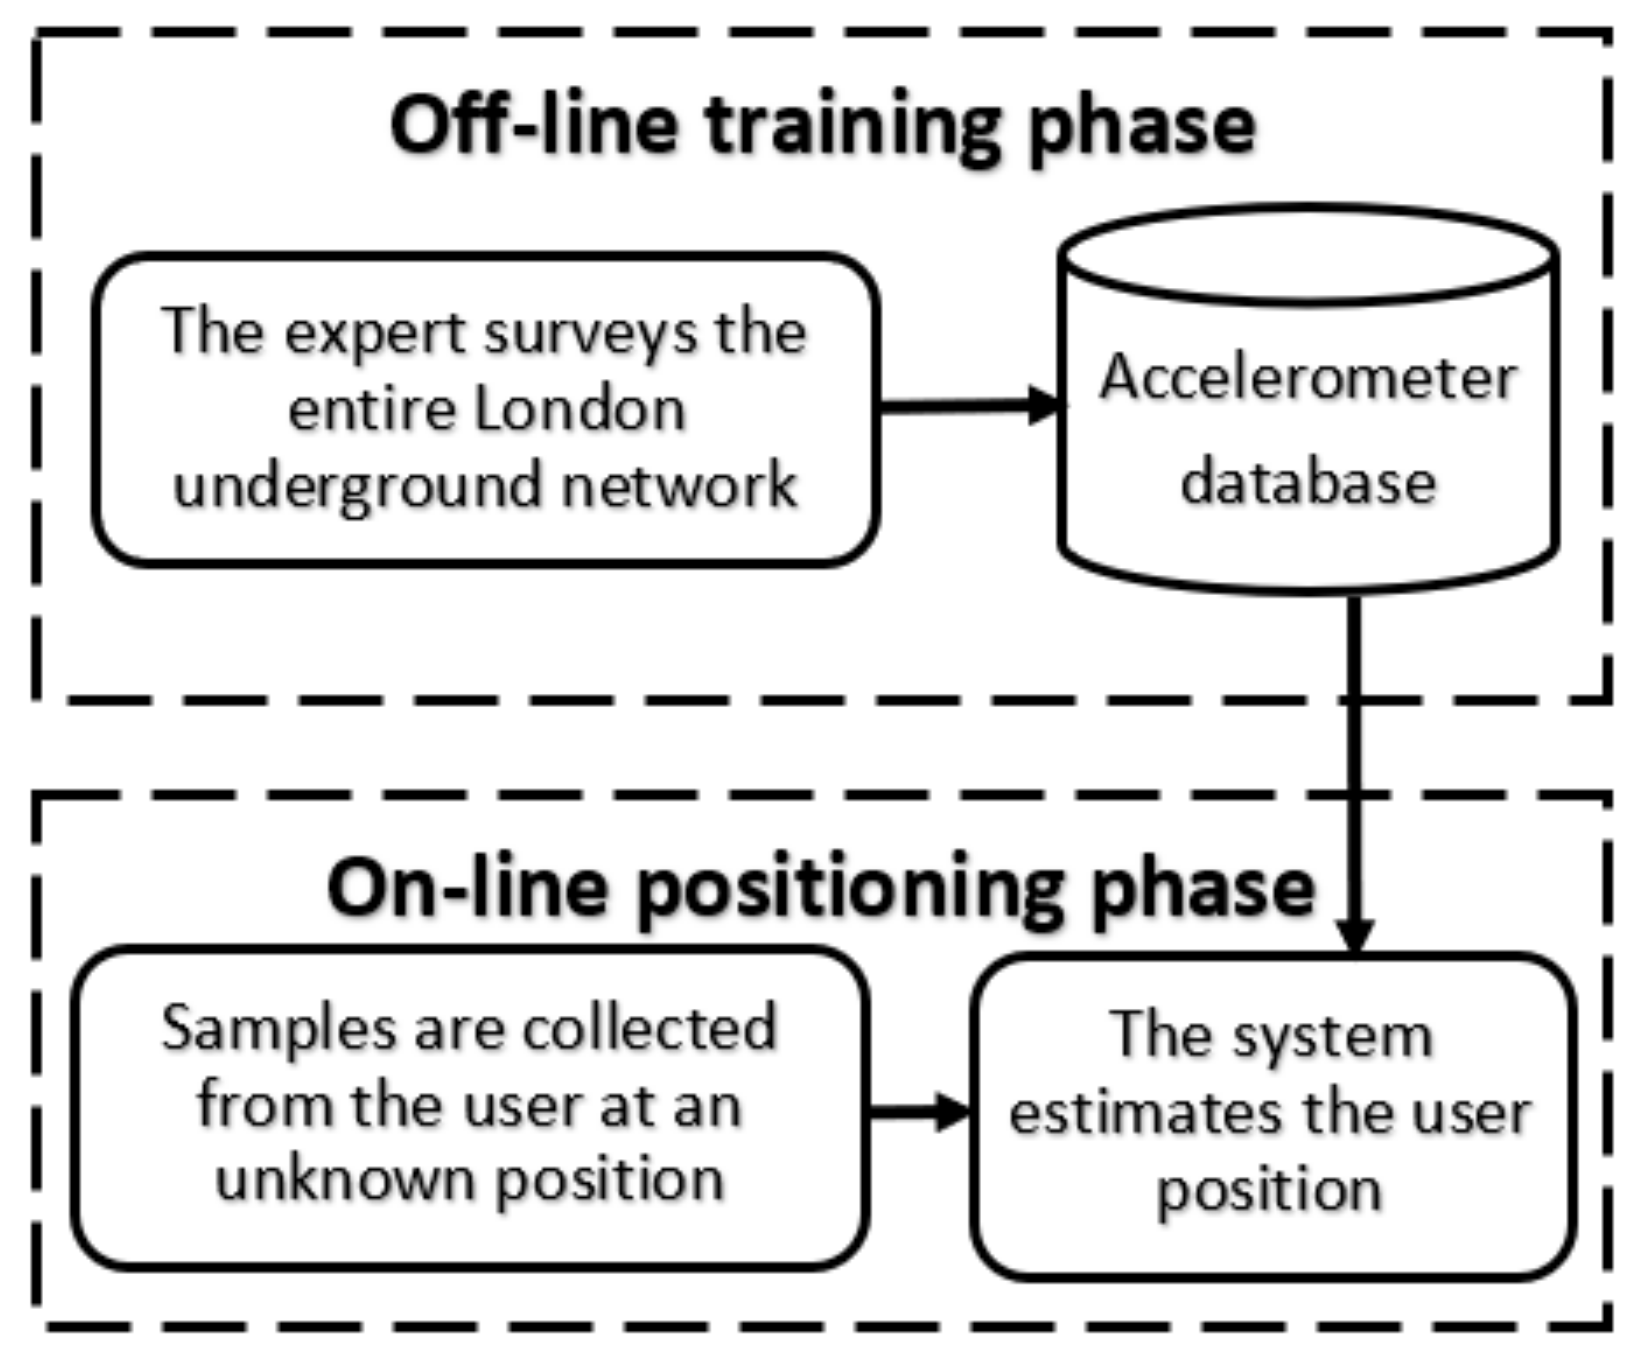
3. Compiling the Training Database
- The surveyor’s phone was rigidly attached to the seat. Throughout the surveillance, the phone was fixed to the train seat with tapes to avoid any external movements apart from that of the train.
- The phone accelerometer’sY-axis was aligned to the train’s heading. By positioning the phone flat in parallel with the carriage floor and by pointing to the moving direction, we enable the train movements to concentrate on the Y-axis and to leave the gravitational force on the Z-axis of the accelerometer.
- The accelerometer samples were labelled manually. As there is no other independent positioning system that works underground, we will manually examine the acceleration and decleration to convert them into velocity, which in turns reports the travelling distance from the last station, to be used as a label. Each sample is also accompanied by a time-stamp and labelled with the line and the station stop accordingly.
- Assessment time was late morning. This is the super off-peak hours where London trains run smoothly, without any incidents or delays.
- The database is fine-grained. Ideally, the accelerometer’s sampling rate should be as high as possible to record the slightest change in motion. However, the higher the sampling rate is, the bigger the training data, the higher the energy consumption, and the slower the positioning estimation will be. One of the first works in this domain tried to classify physical human activities that exhibit frequent changes of motion (e.g., walking, running, ascending stairs, etc.), which concluded that a 15–20 Hz was sufficient, with virtually no accuracy improvement with higher sampling rates [1]. Subsequently, most recent works in transportation mode detections with a smartphone accelerometer achieved high estimation accuracy with 35 Hz, 32 Hz, and 16 Hz respectively [2,3,4]. As such, we settled on a relatively safe, above-literature threshold of 50 Hz (50 samples per second) to generate our training database.
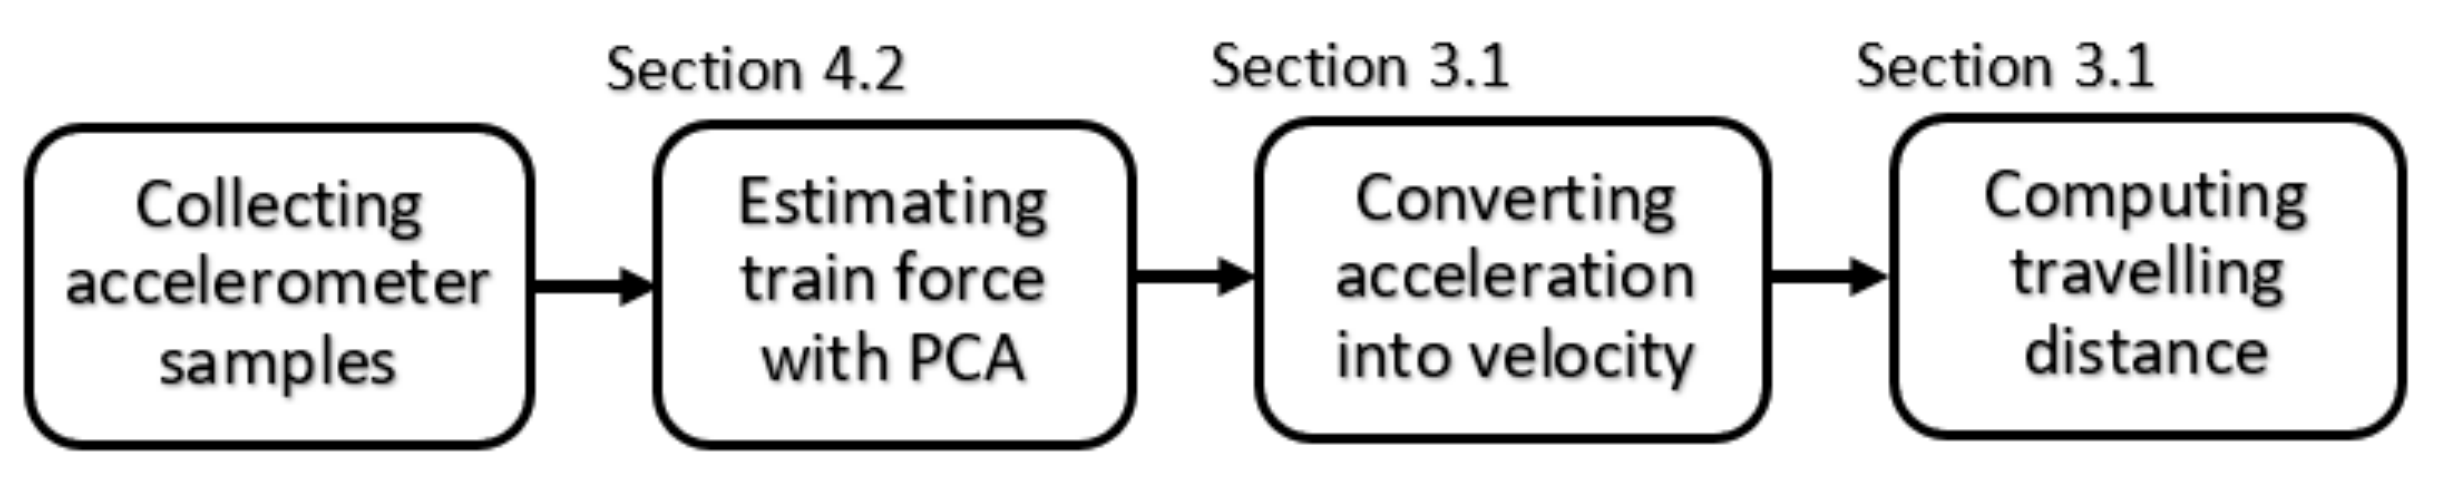
Labelling the Training Samples with Estimated Travelling Distance
4. Matching Passengers’ Accelerometer Footprints
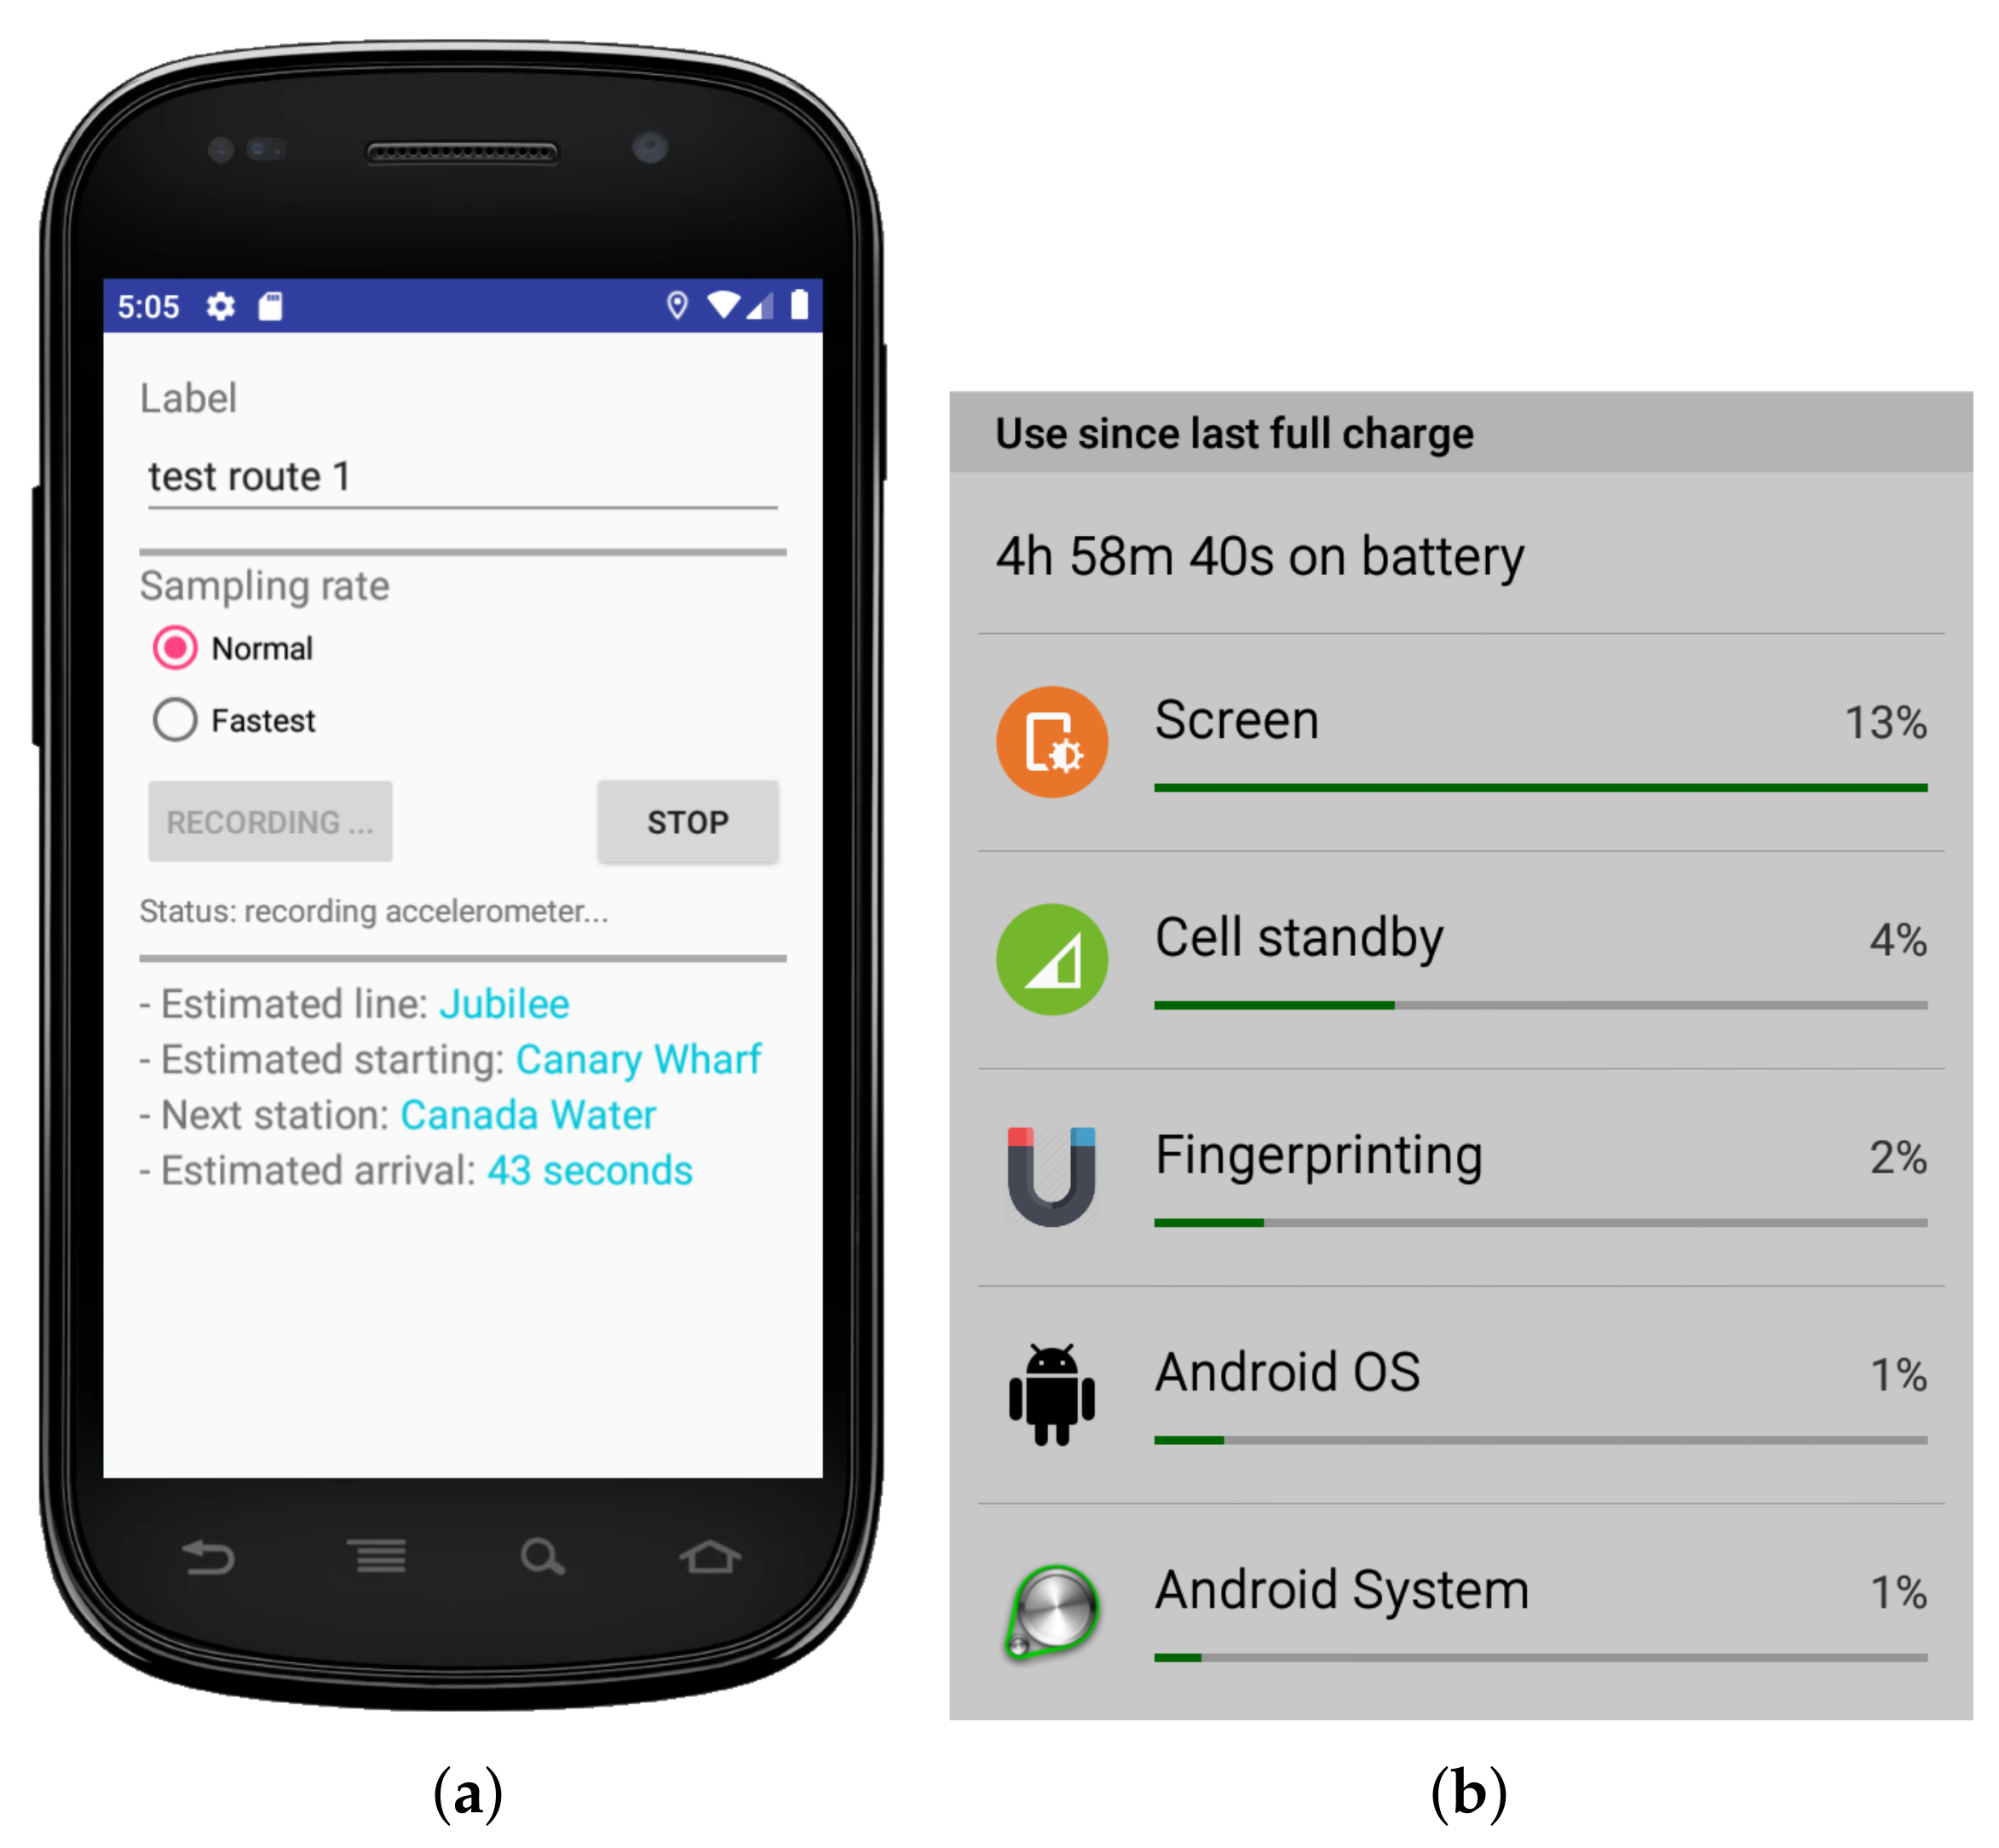
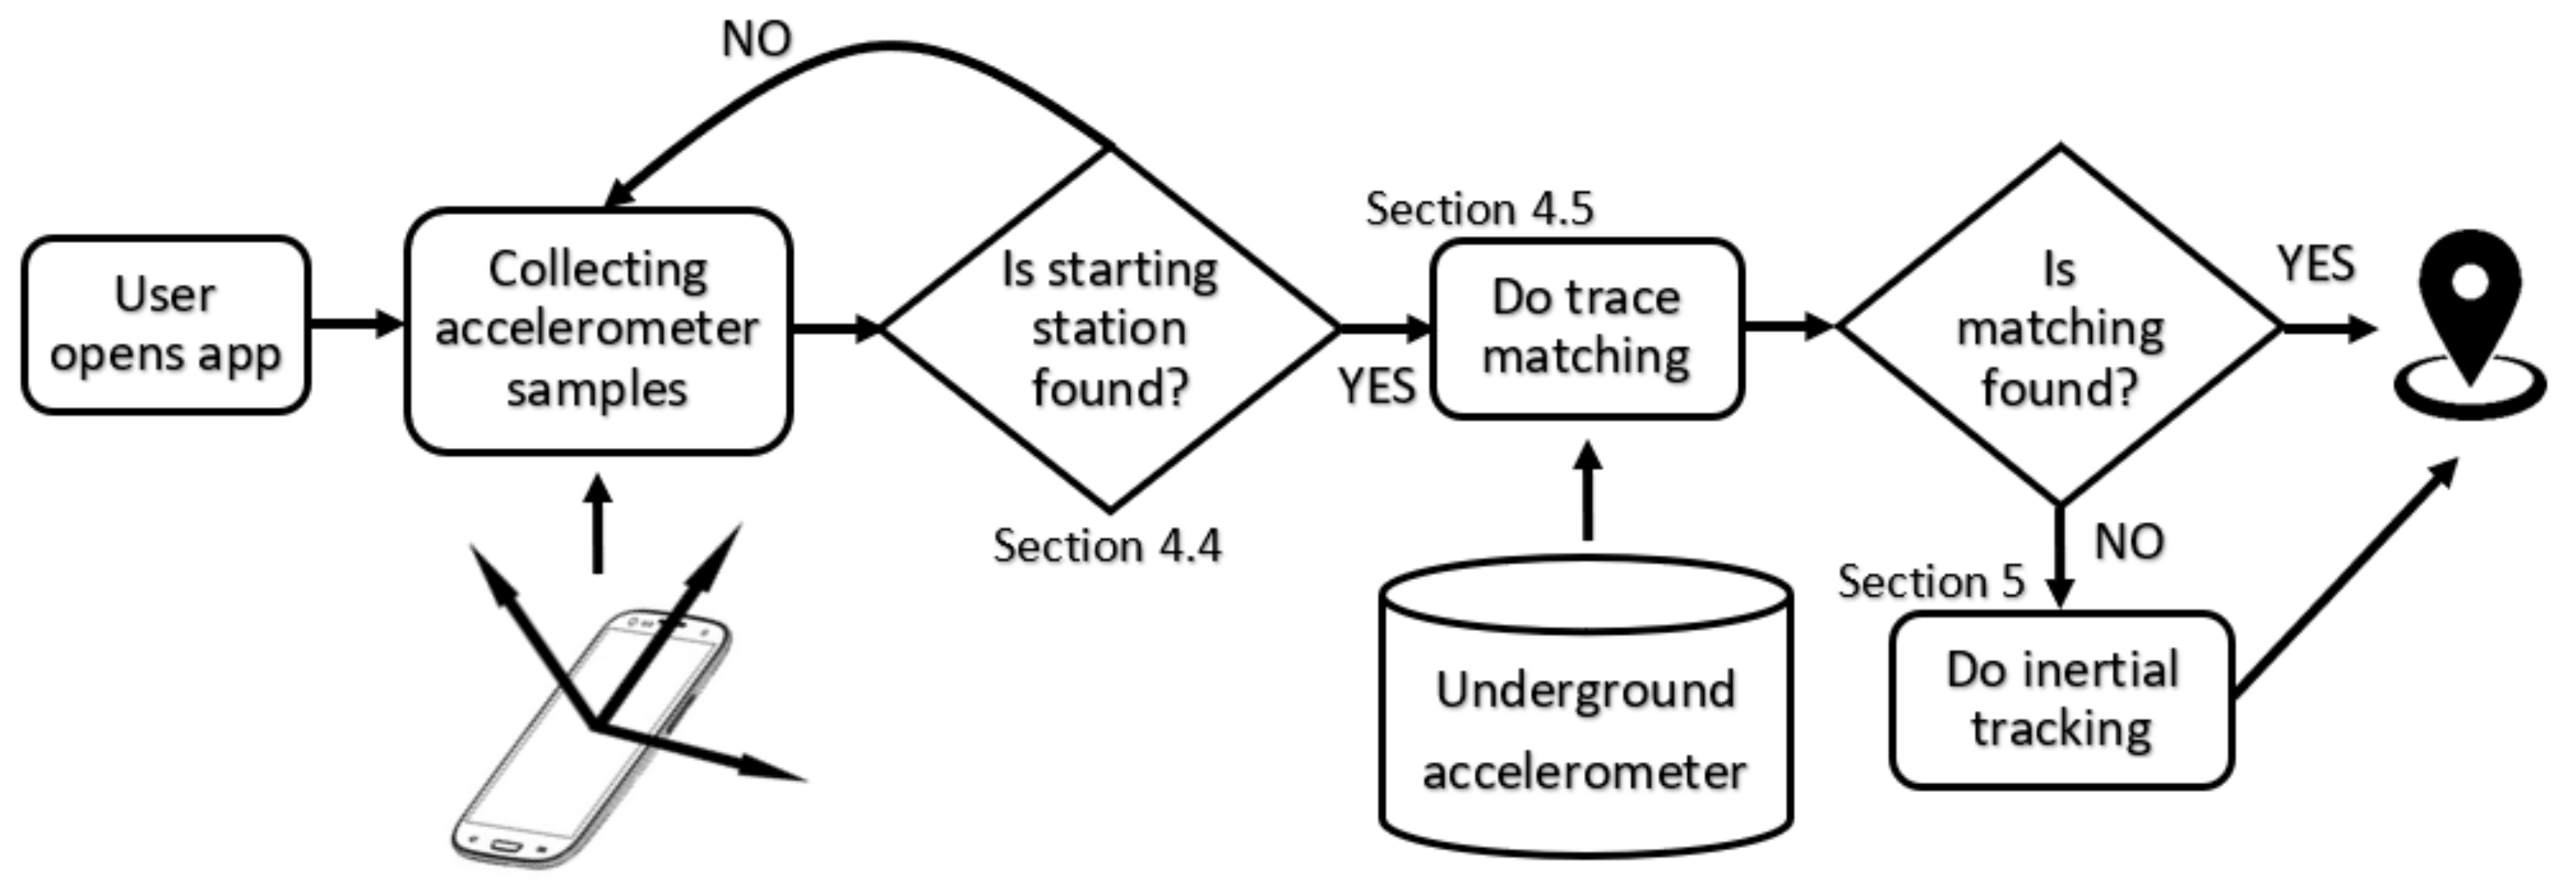
4.1. The Android App
- It stores the above training database.
- It silently collects the accelerometer data in the background, while freeing the user to carry on with daily activities.
- It performs realtime matching of passenger data to estimate the travelling route to be discussed below.
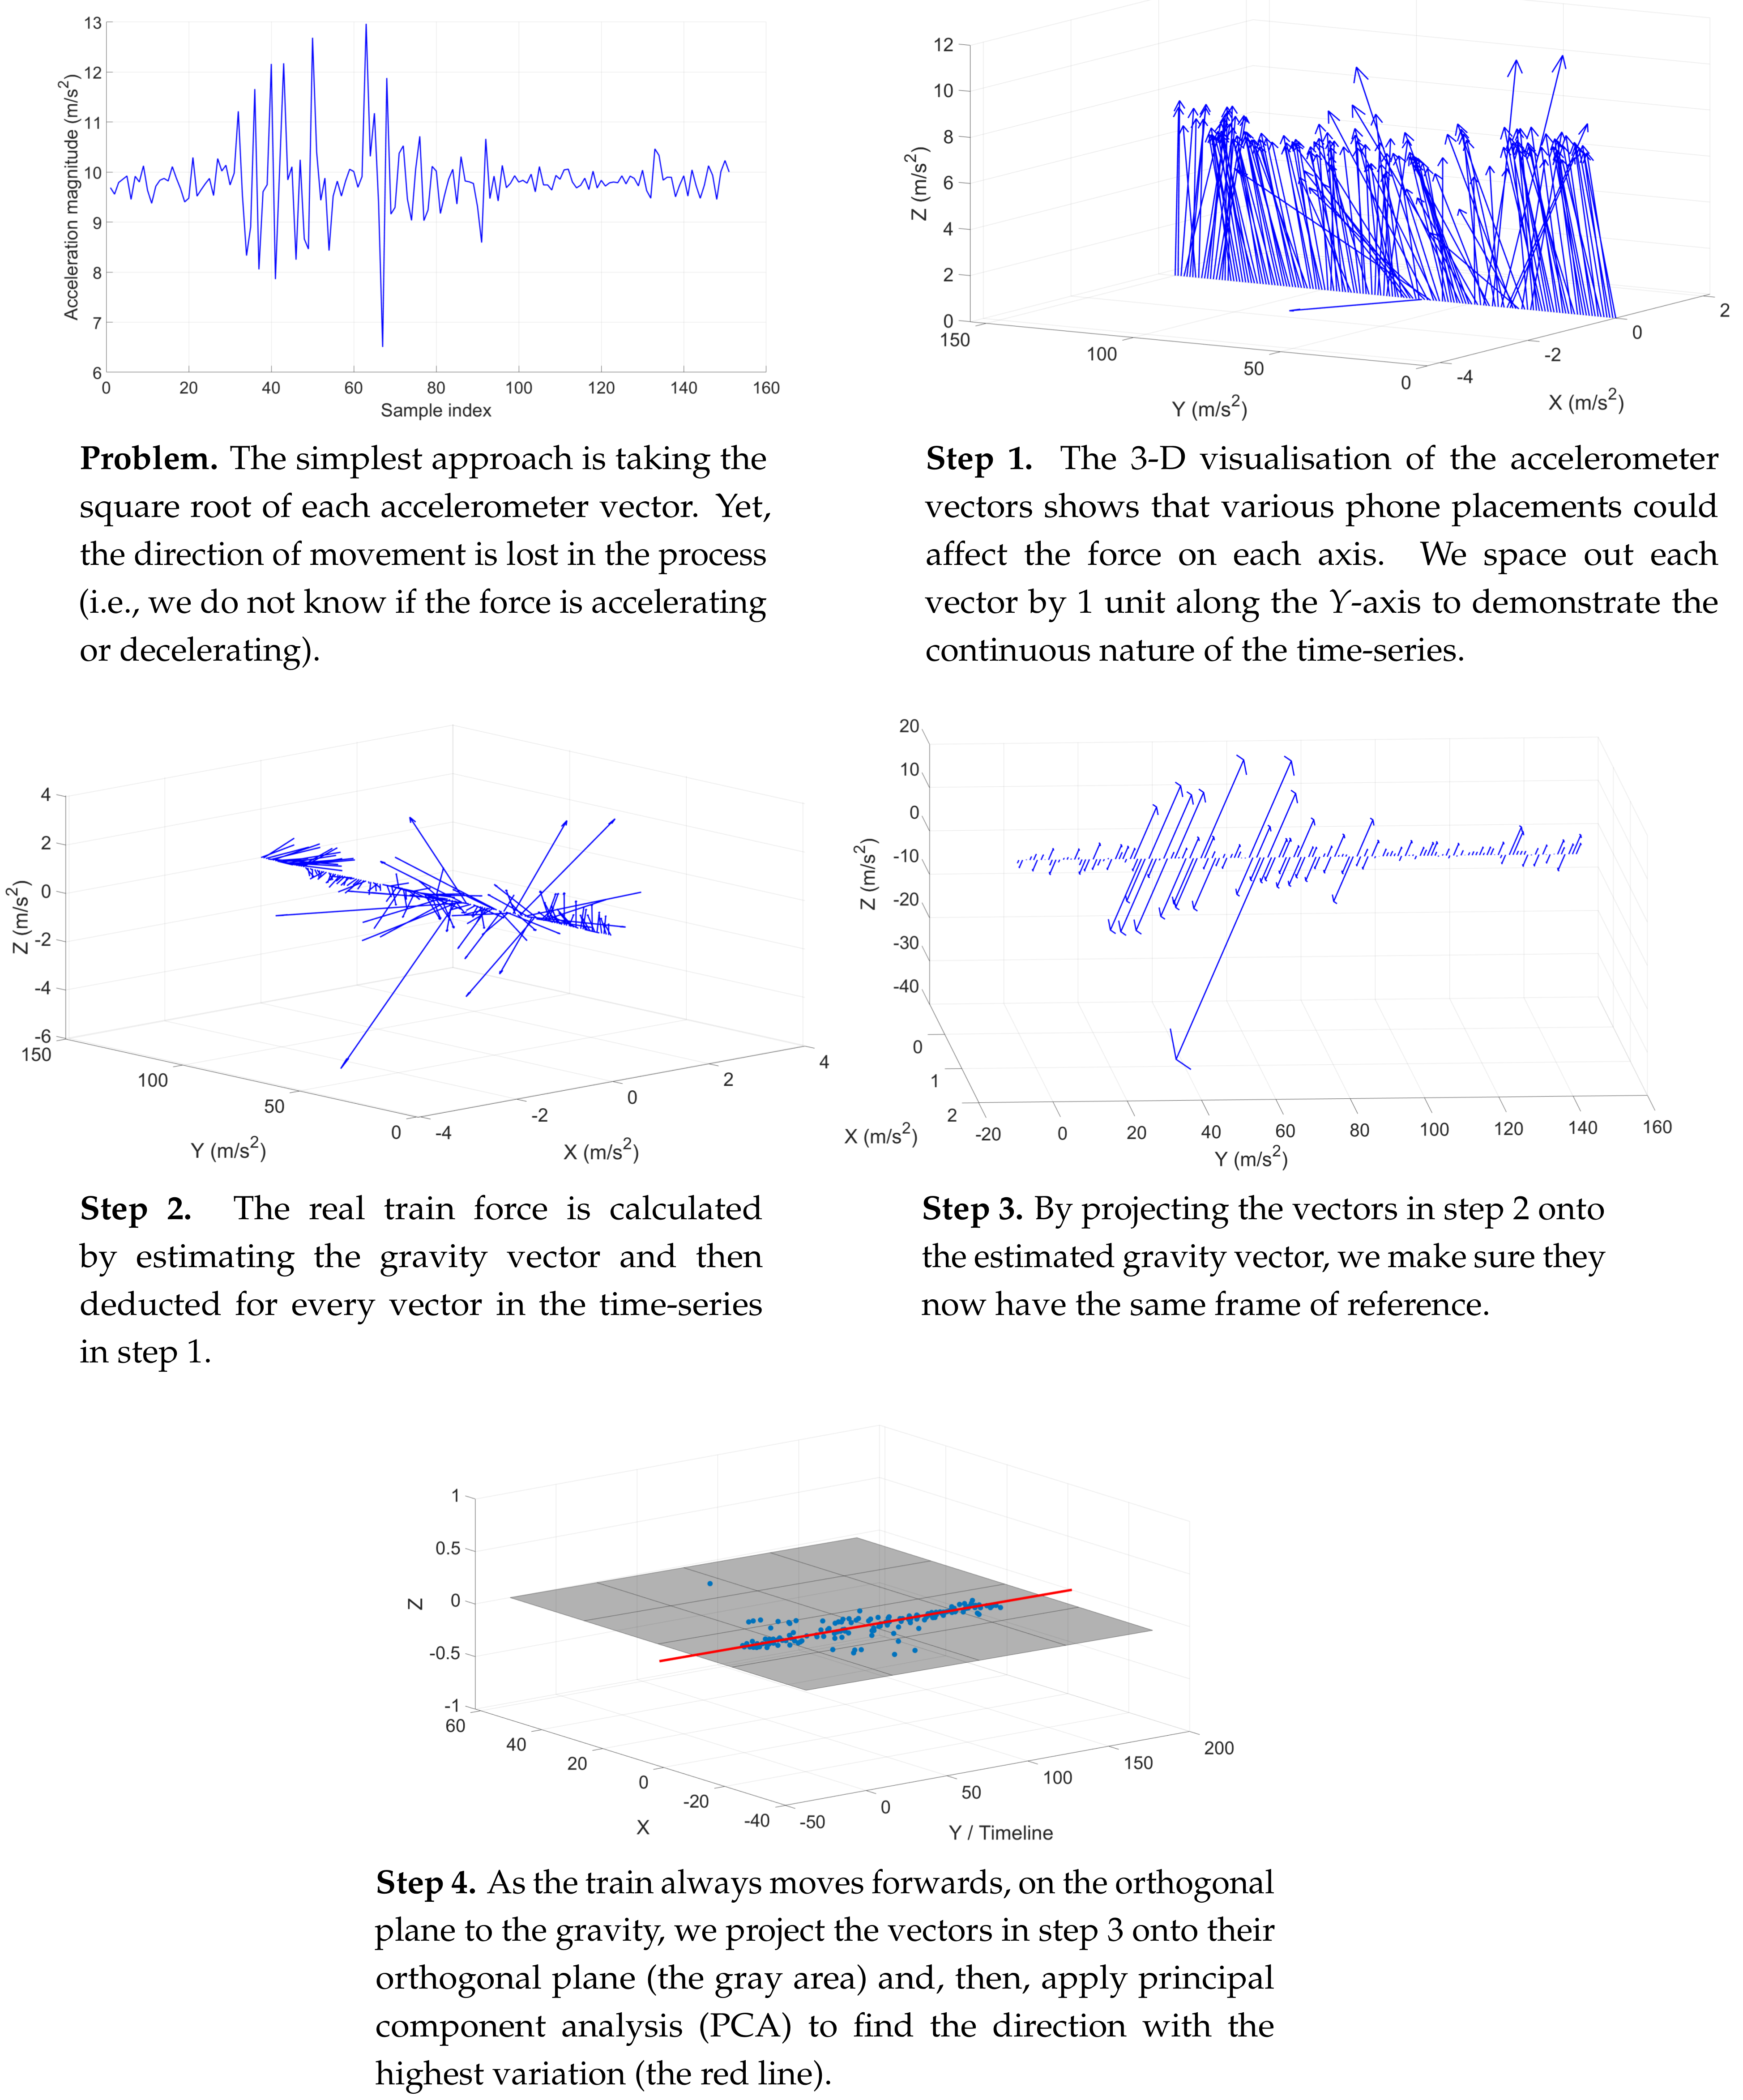
4.2. Handling Unconstrained Phone Placements
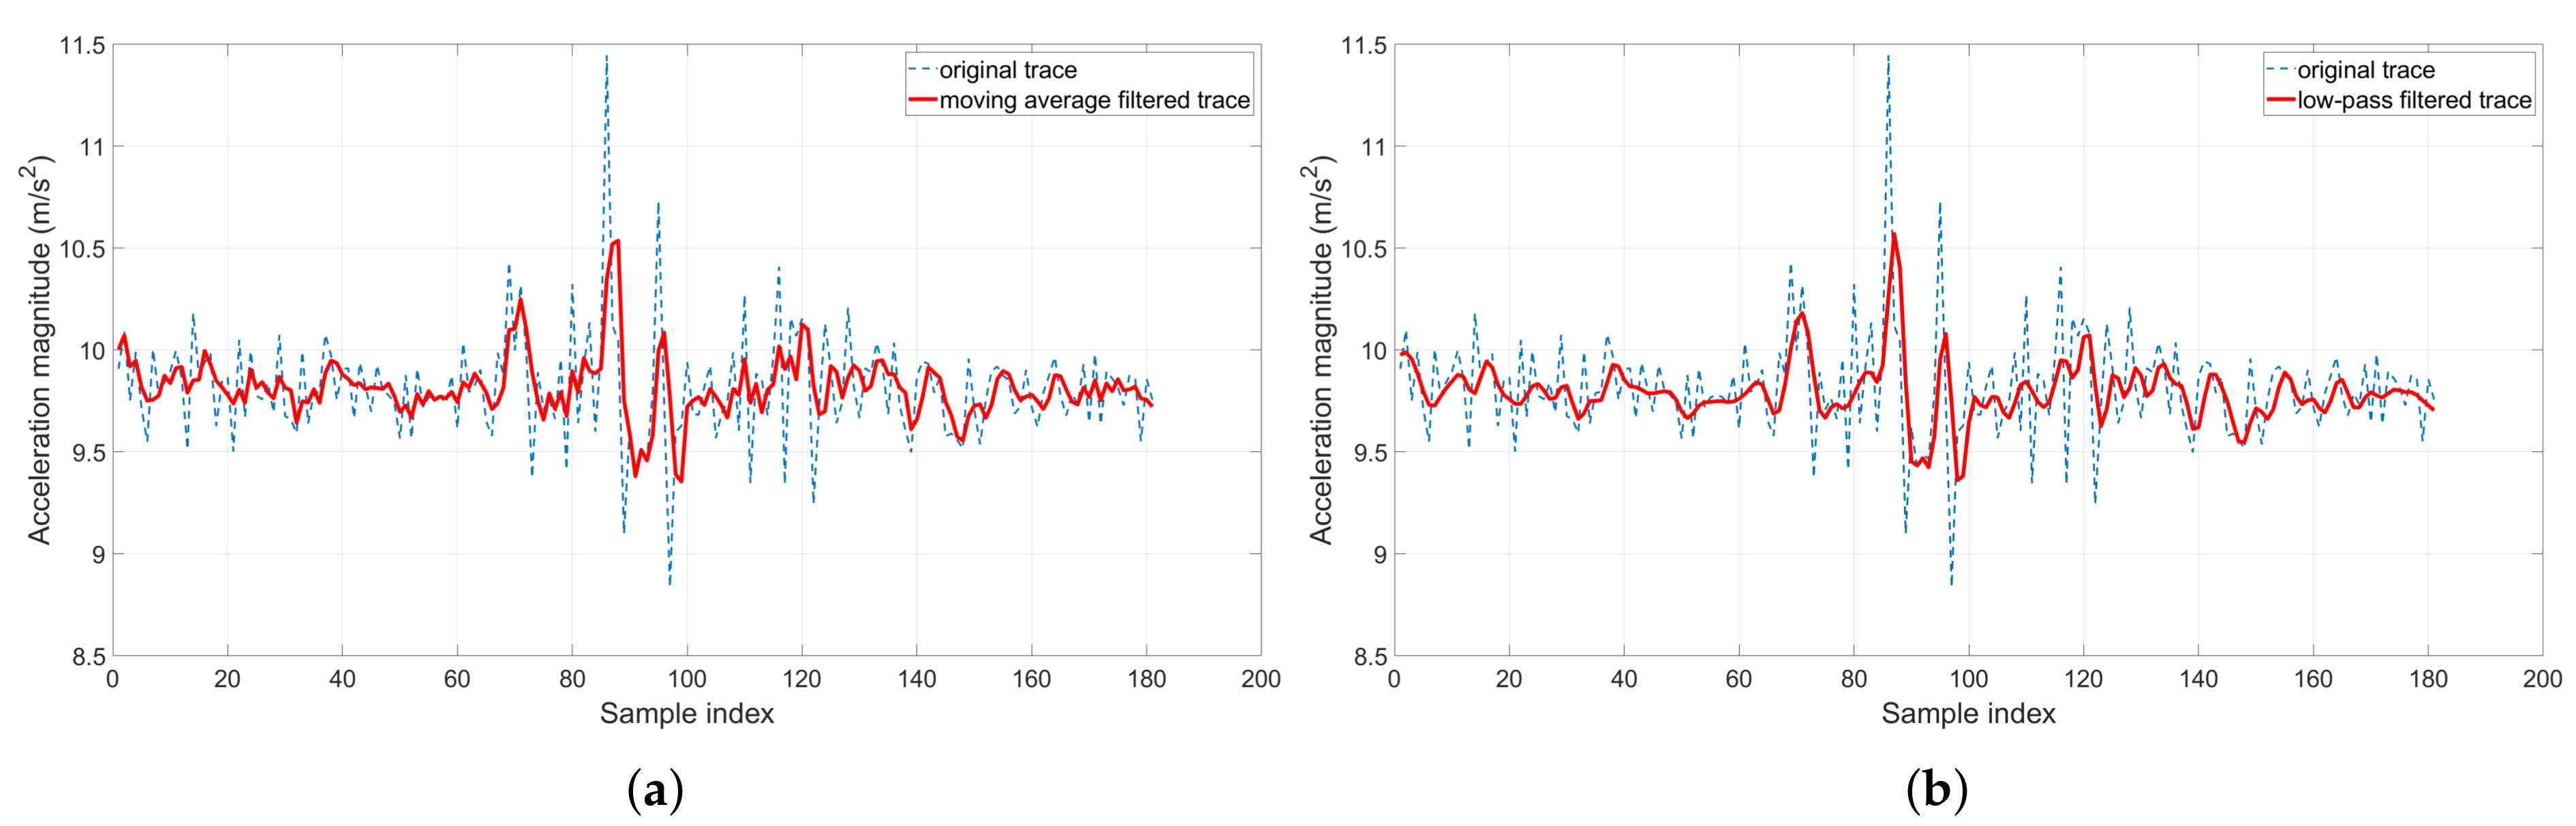
4.3. Filtering the Noises
4.4. Extracting the Train Traces from the Passenger’s Sensor Recording
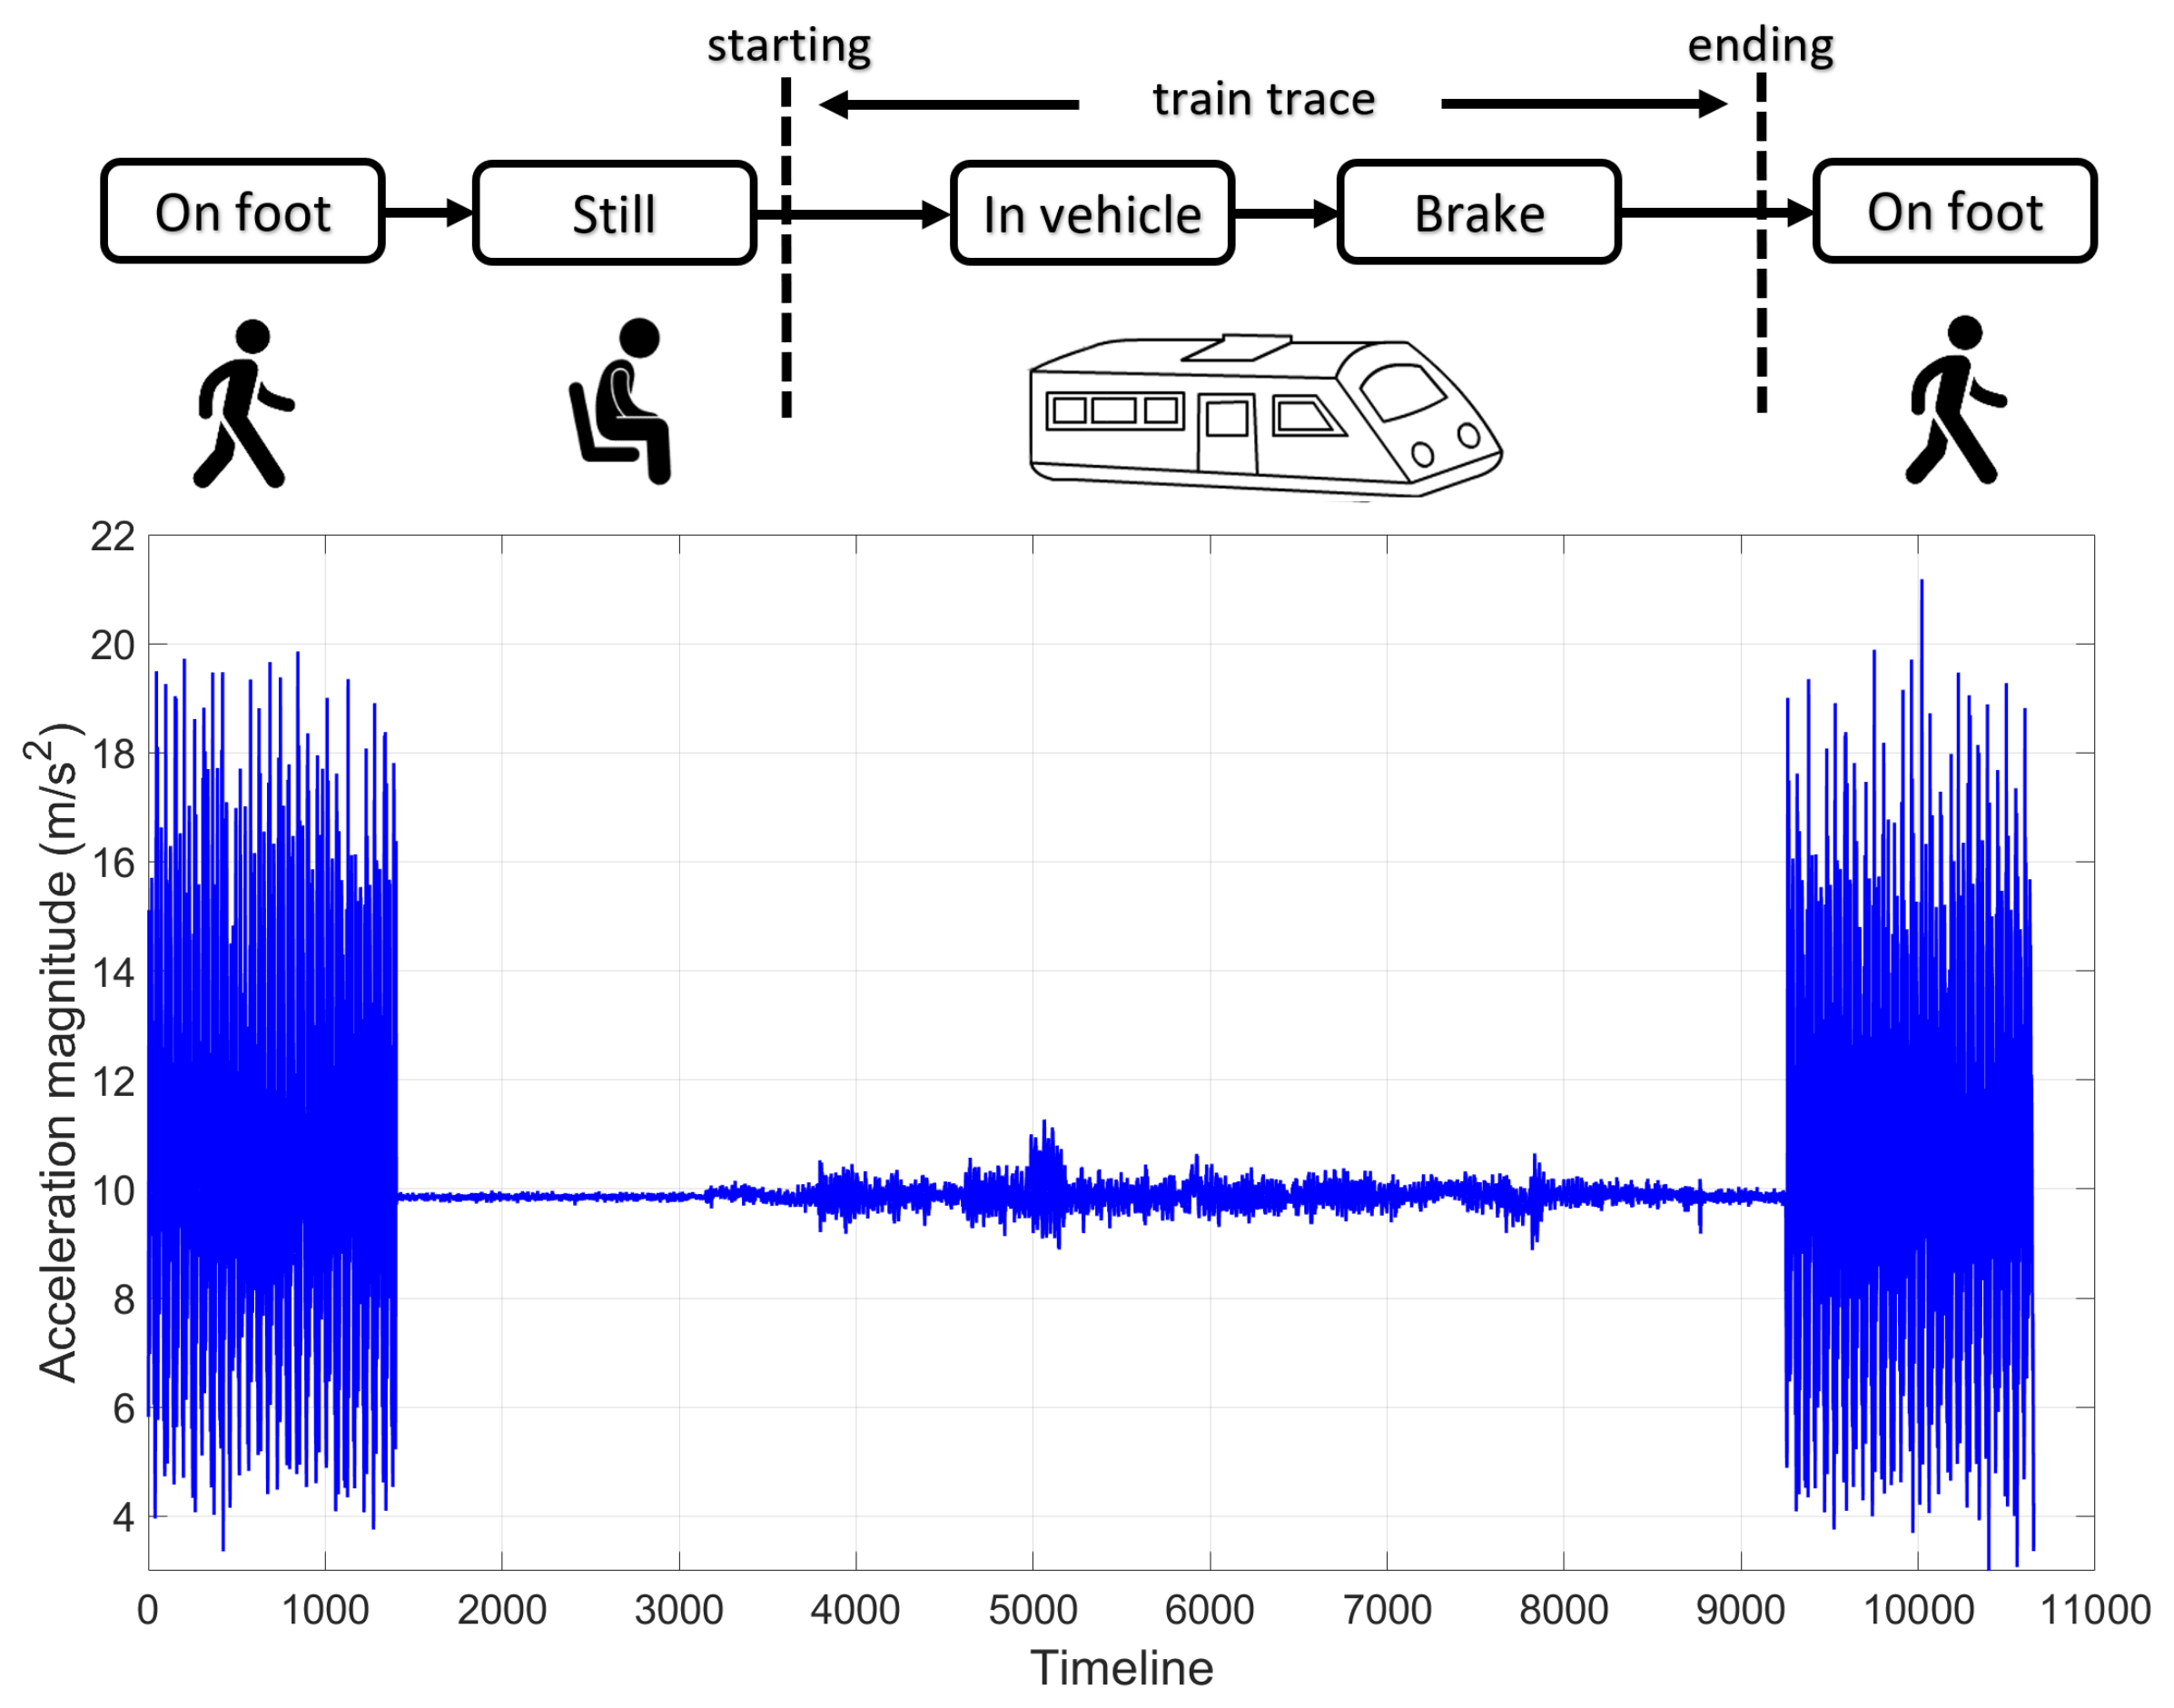
- On foot state. This motion corresponds to the passenger walking from the station concourse onto the train and vice-versa. It has the distinctive shape as visualised in Figure 8.
- Still state. This is the state where the passenger is motionless and is easily detected when no acceleration (minus the constant gravity force) is reported by the accelerometer.
- In-vehicle state. This motion is triggered when the passenger is on the train and is detected by the fast accelerations at the beginning of the trip.
- Starting point. The passenger must walk from the station platform onto the train. This is followed by a brief period of inactivity and ends with the train moving forwards.
- Ending point. London underground tubes always brake to a swift stop by the end of the trip. This motion is followed by the passenger walking off the train.
4.5. Finding the Single Matching Training Route
4.6. Matching Continuous Trip
4.7. Validating the Matching Route
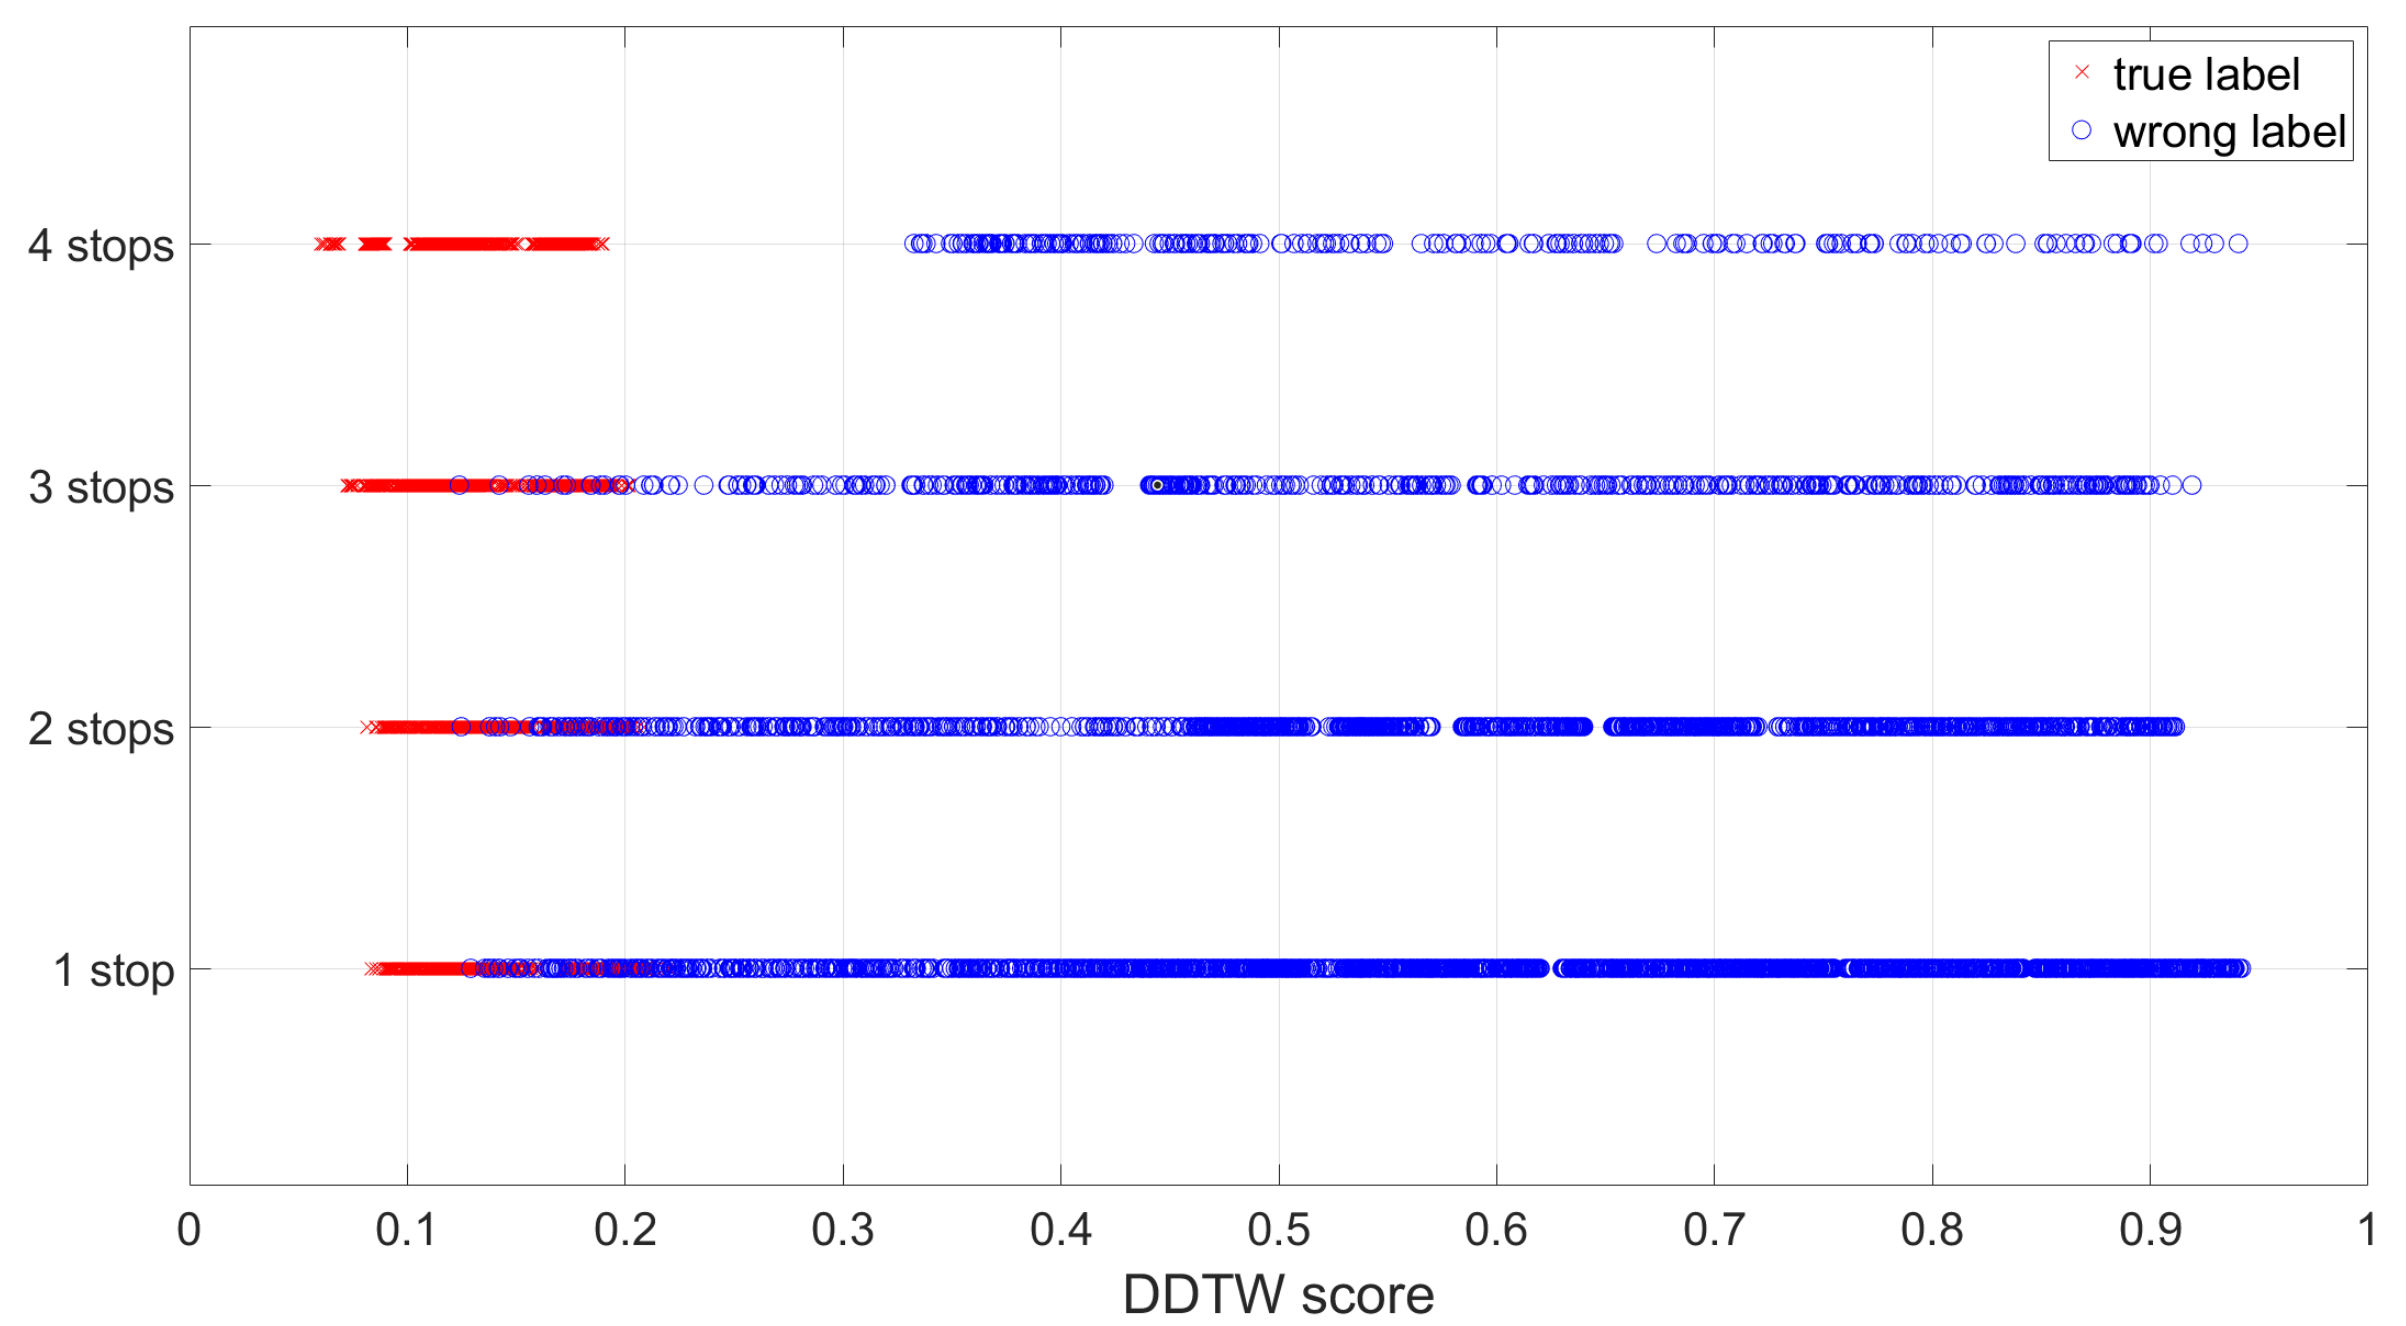
- The passenger trace length is equivalent to at least 1 stop. This empirical threshold ensures that the sensor trace is distinctive enough and avoids too many similar false matchings; this will be evaluated in Section 7.6.
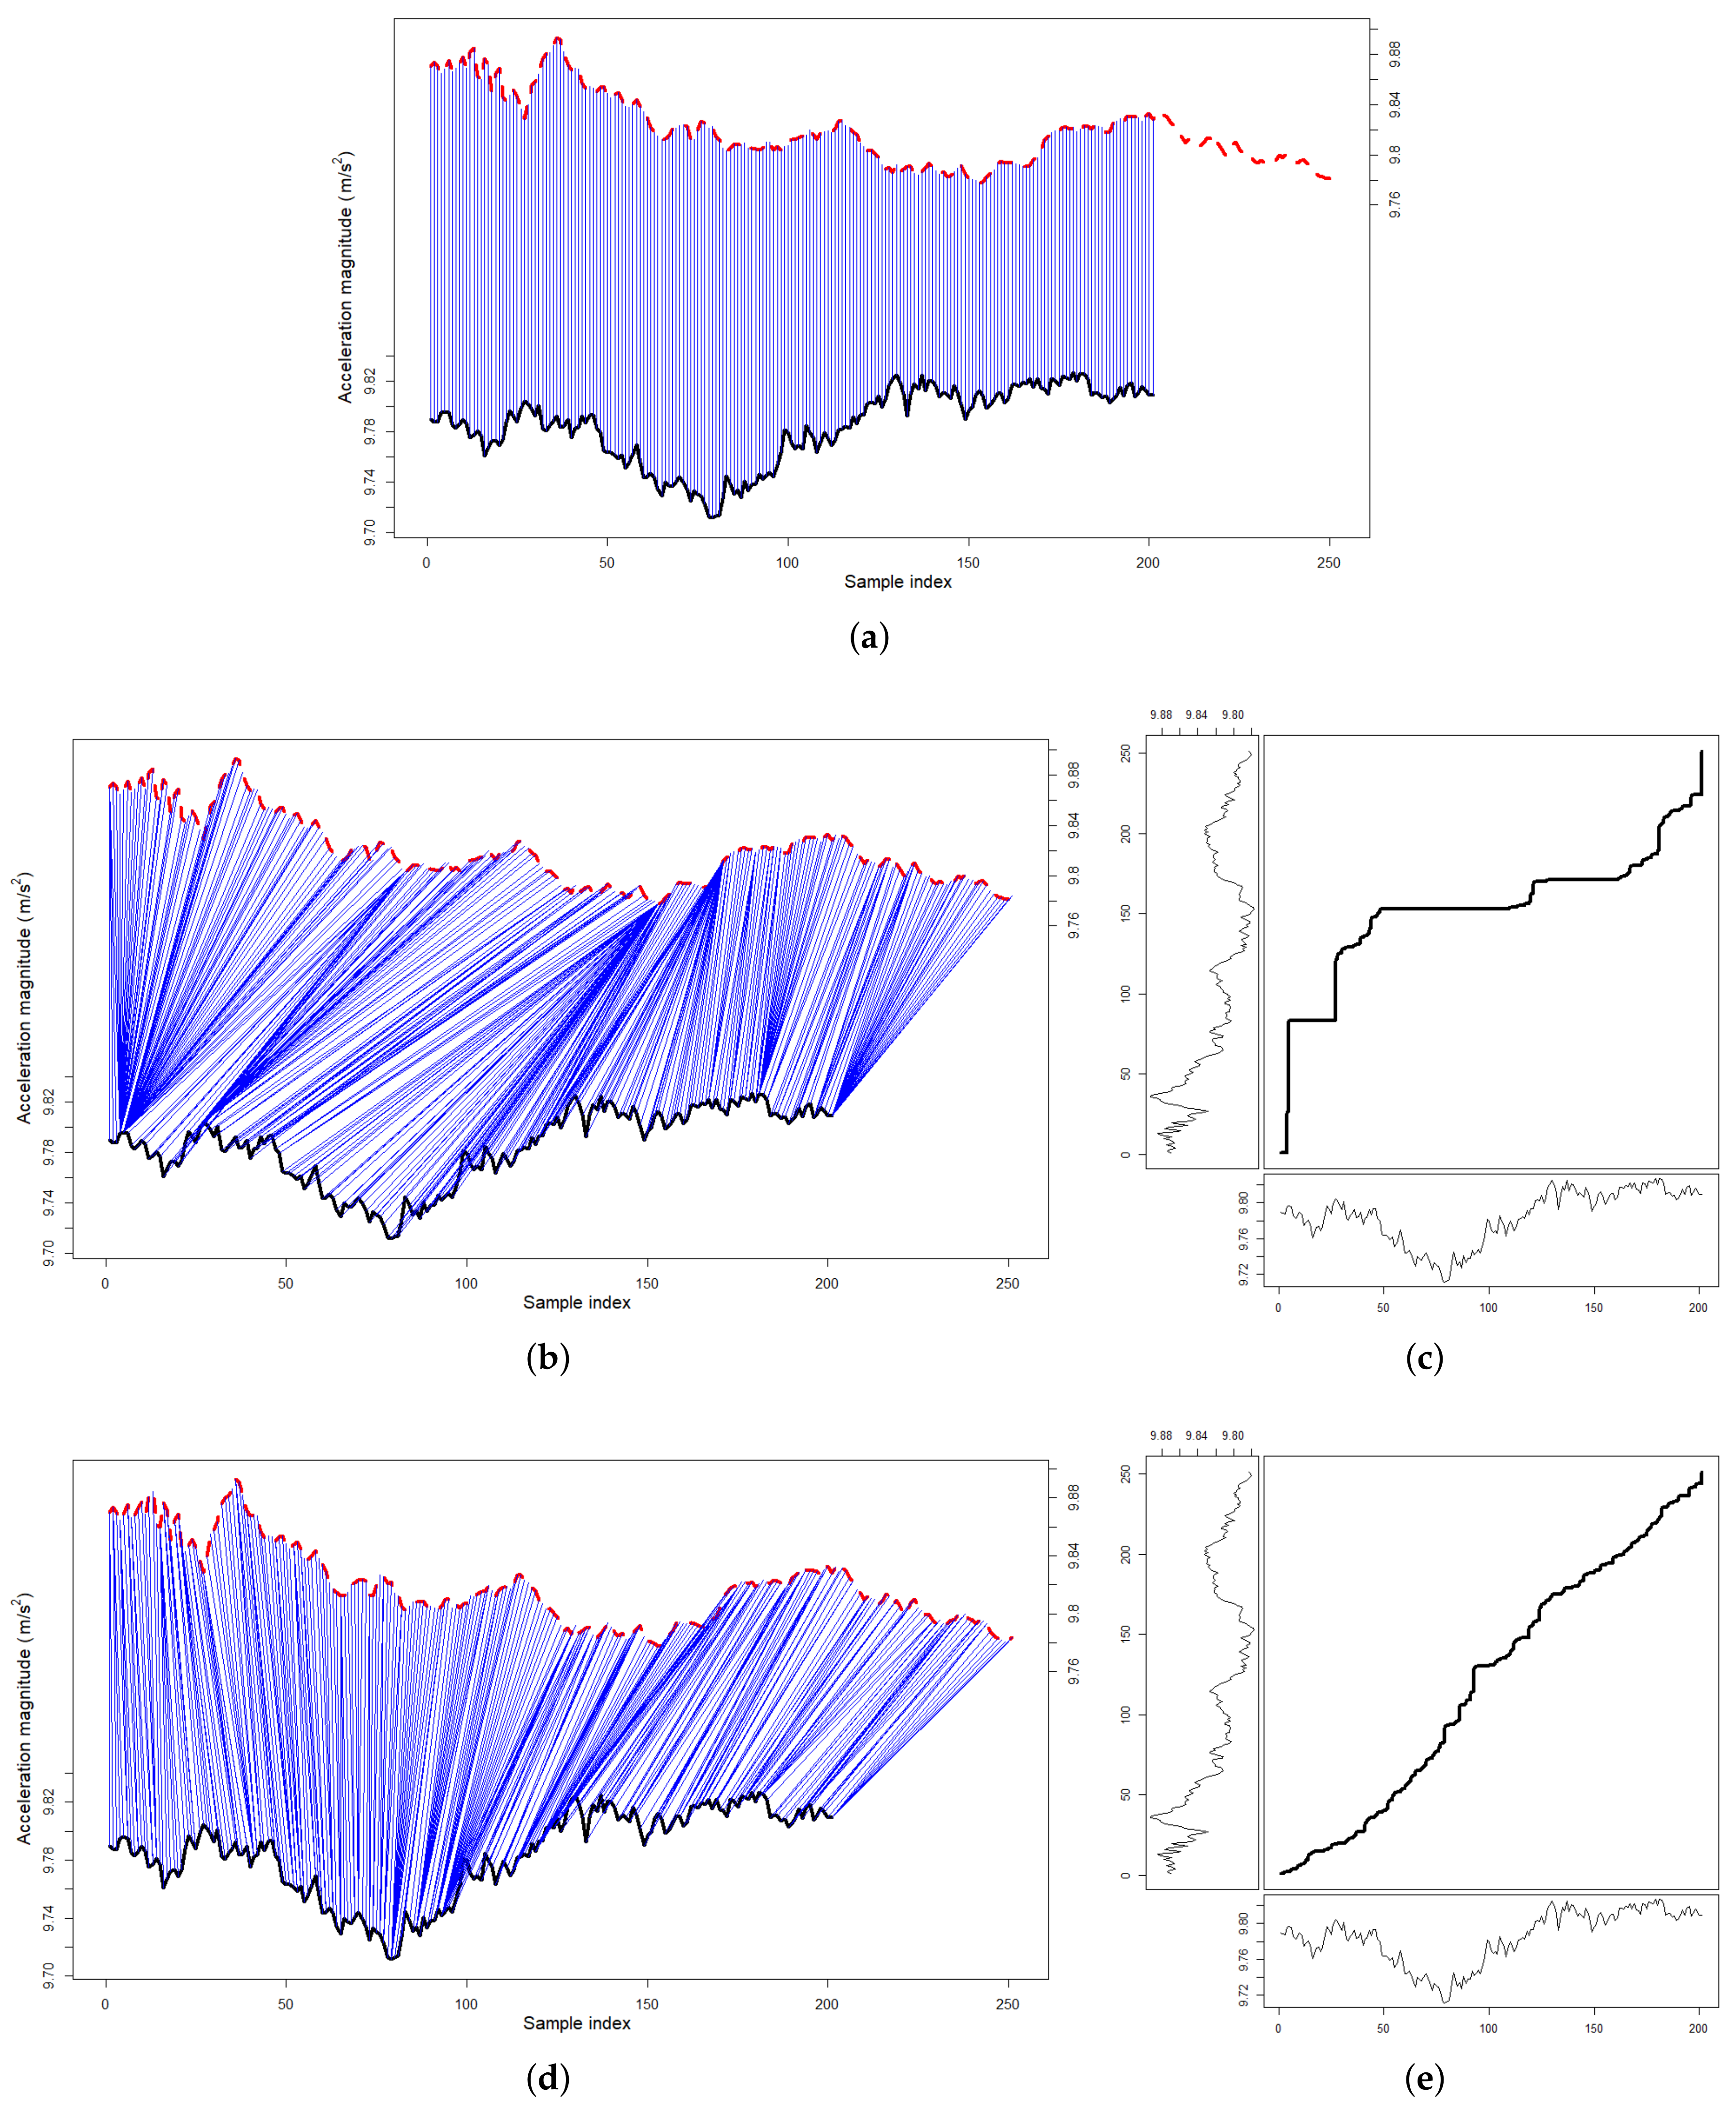
- The DDTW score is below an empirical constant of 0.3. This score is calculated by adding up the differences between all aligned samples on the accelerometer trace, divided by the length of the optimal warped path; this will be evaluated in Section 7.5.
5. Estimating the Passenger Position with Inertial Tracking
6. Bringing It All Together
7. Experimental Results
7.1. Research Questions
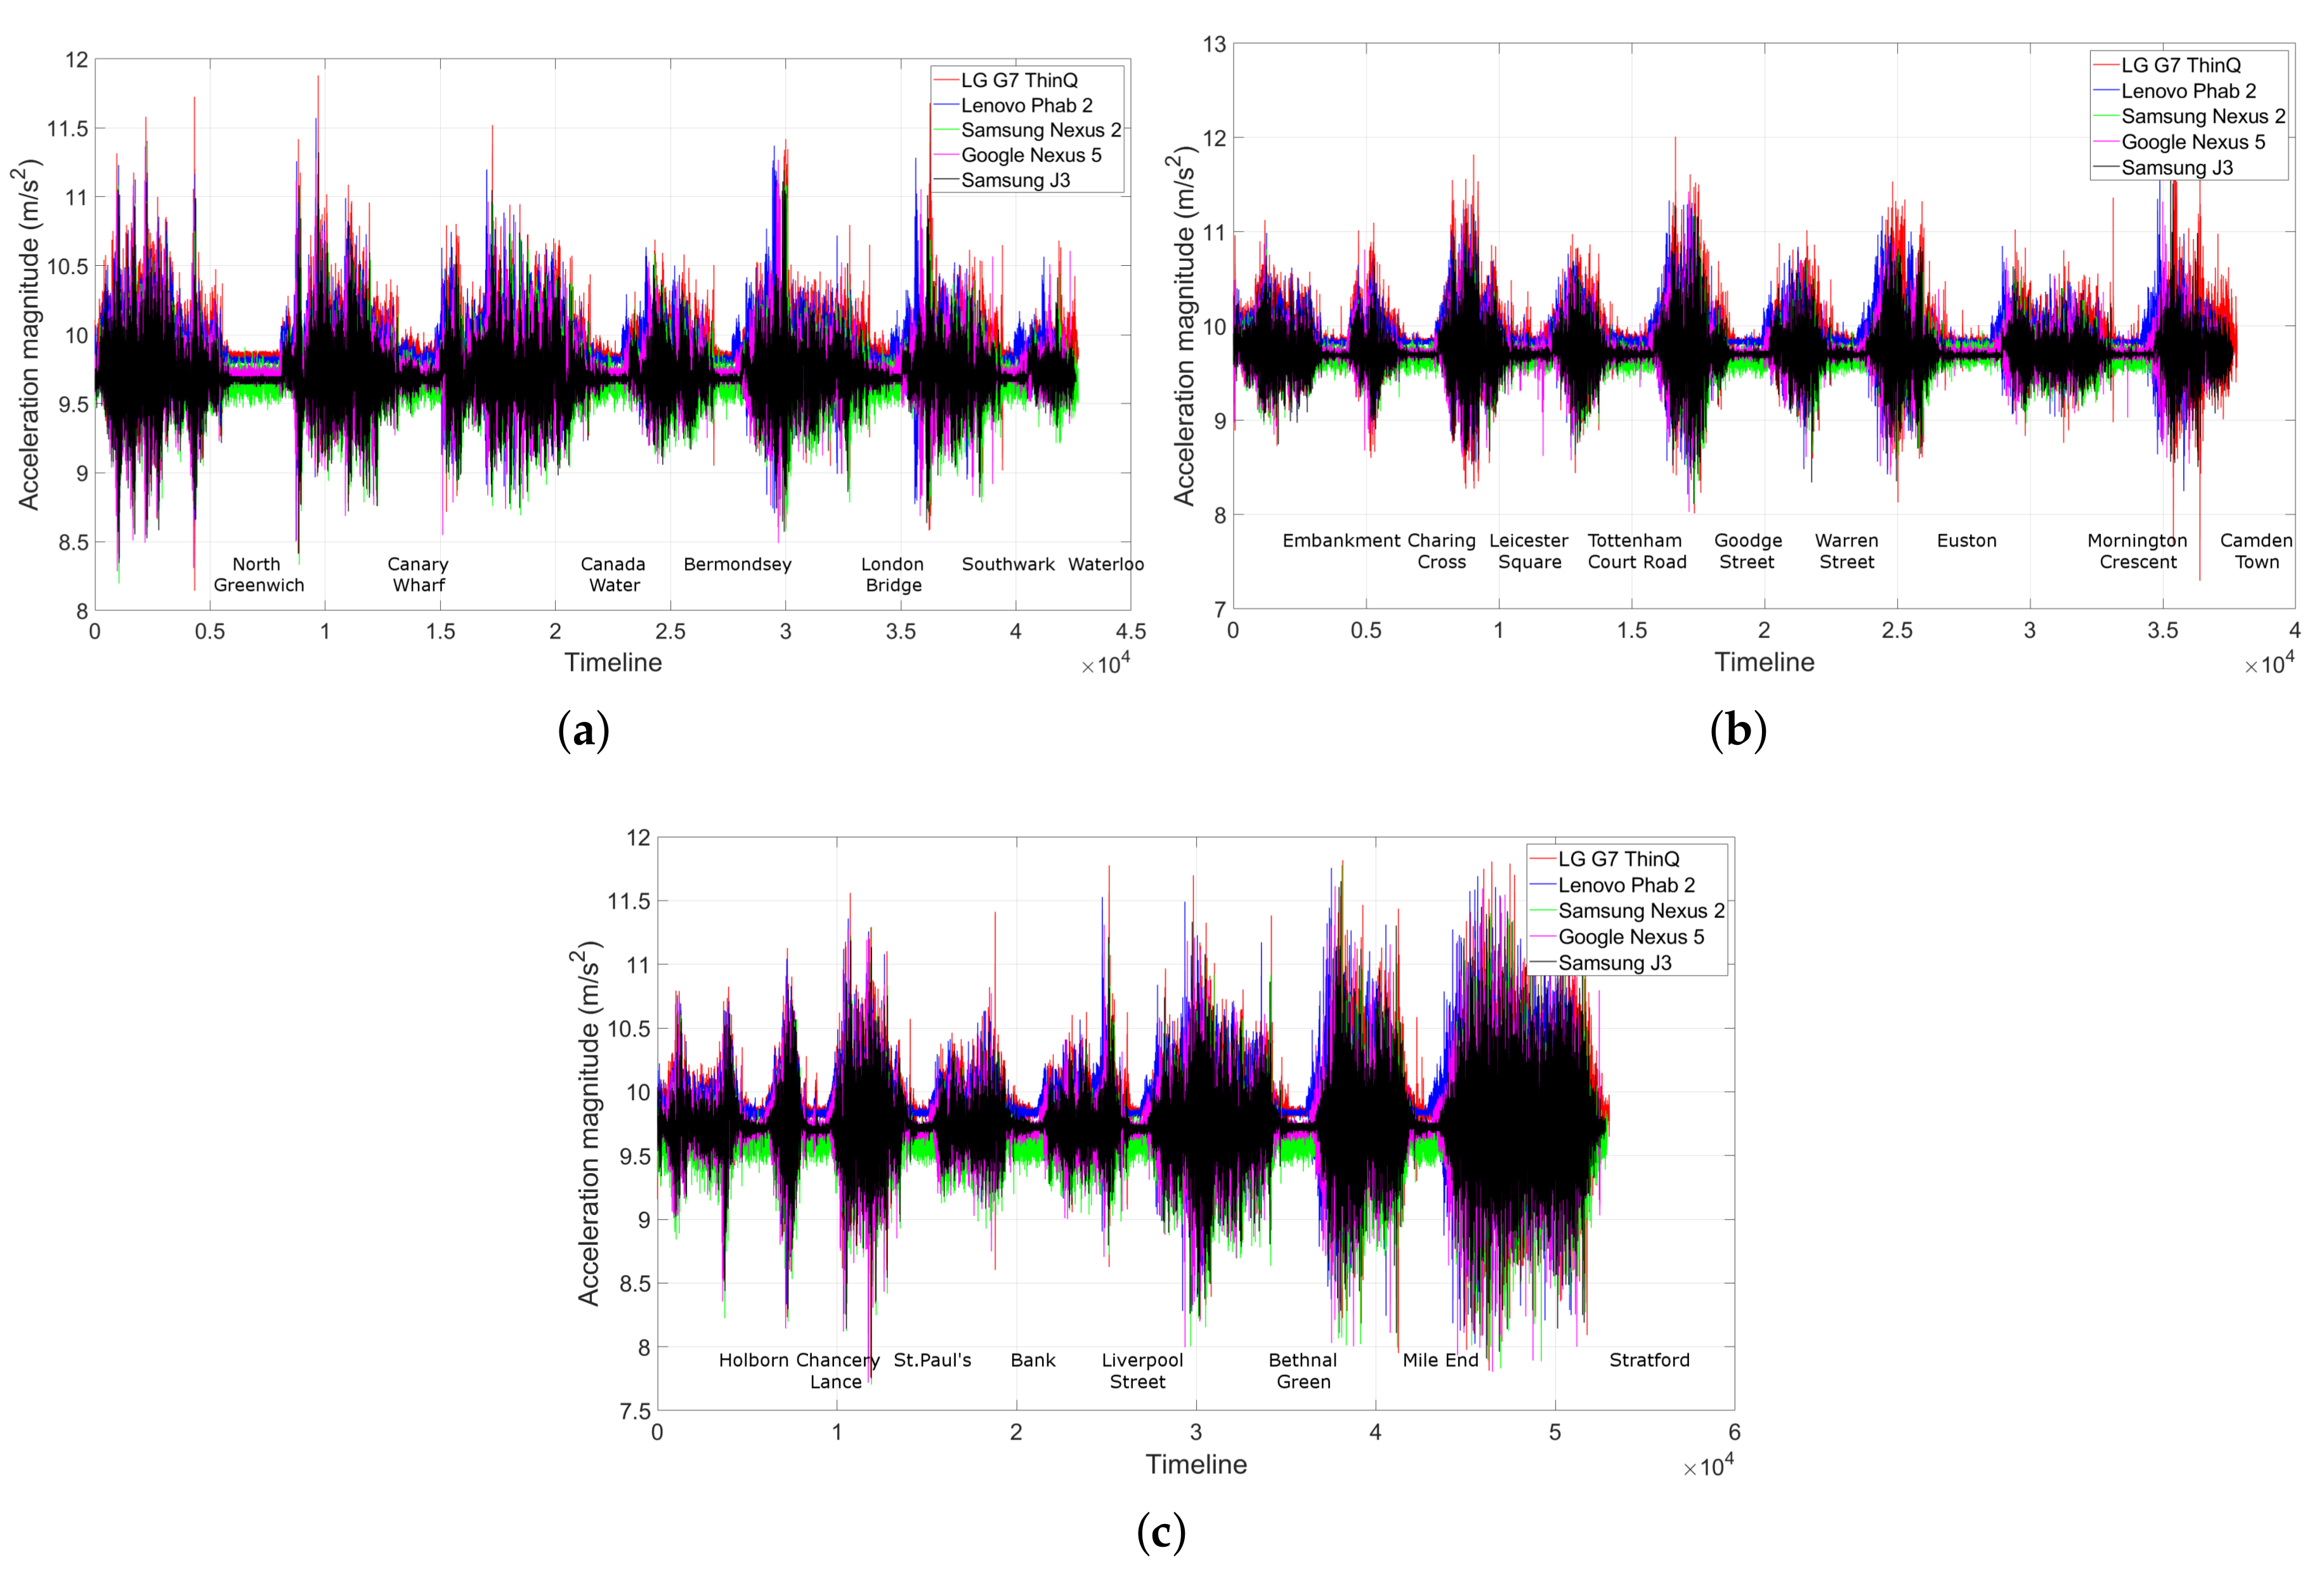
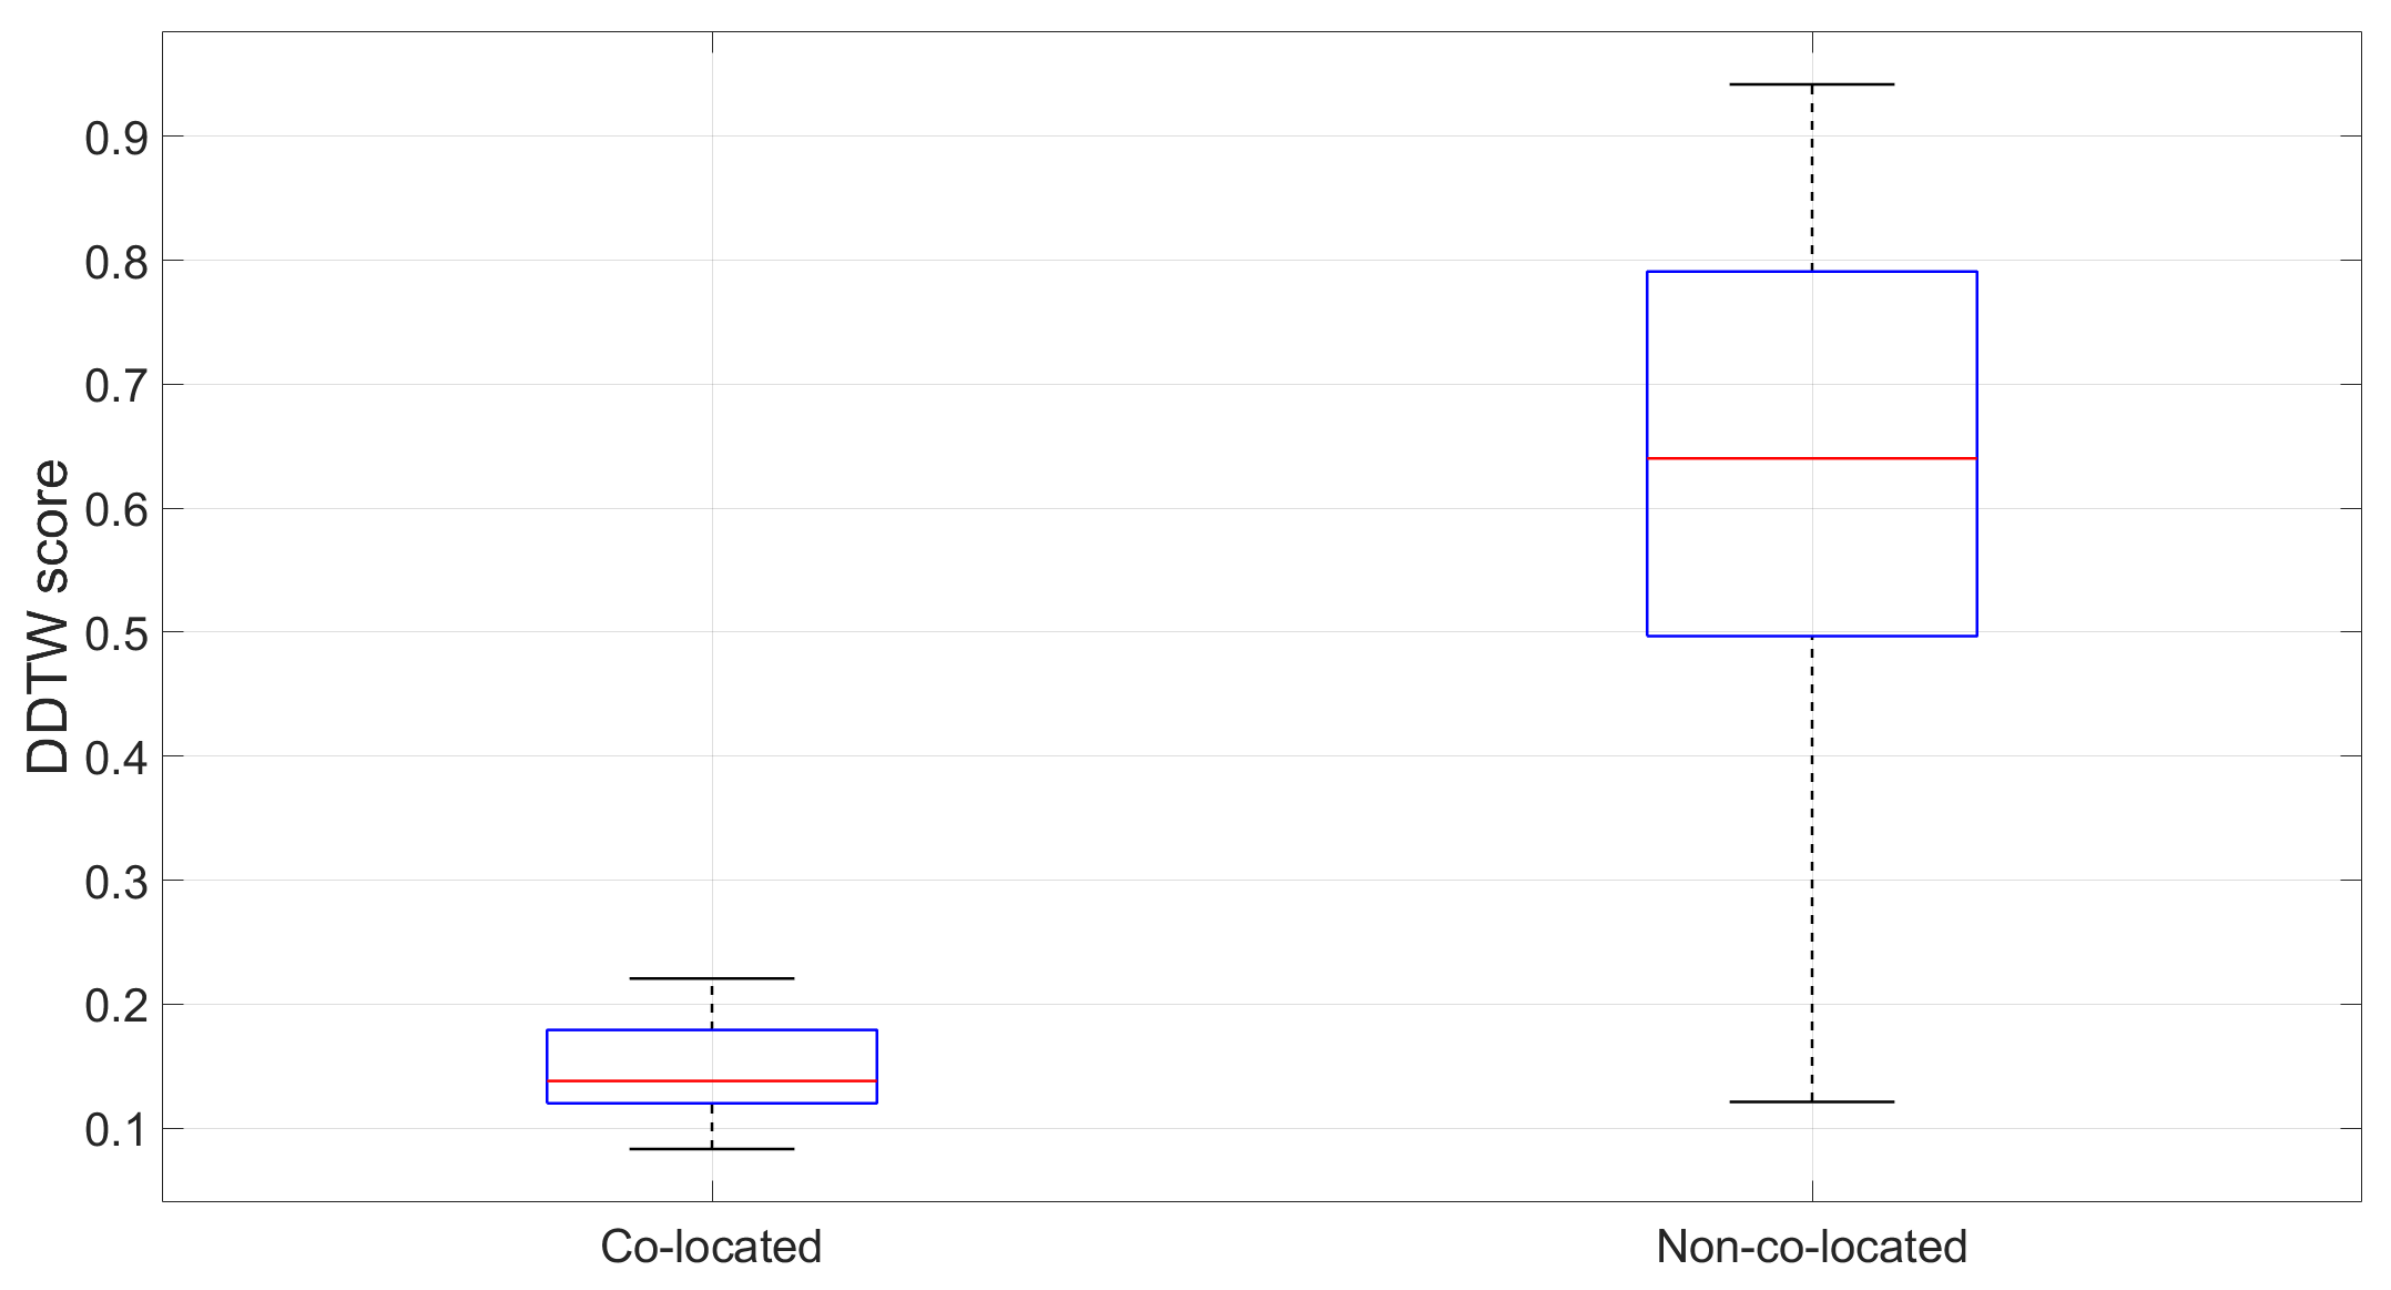
- How much temporal variation of the accelerometer trace is on the same route? Ideally, we should observe a similar trace whenever the train travels on the same route because the transport is autonomous.
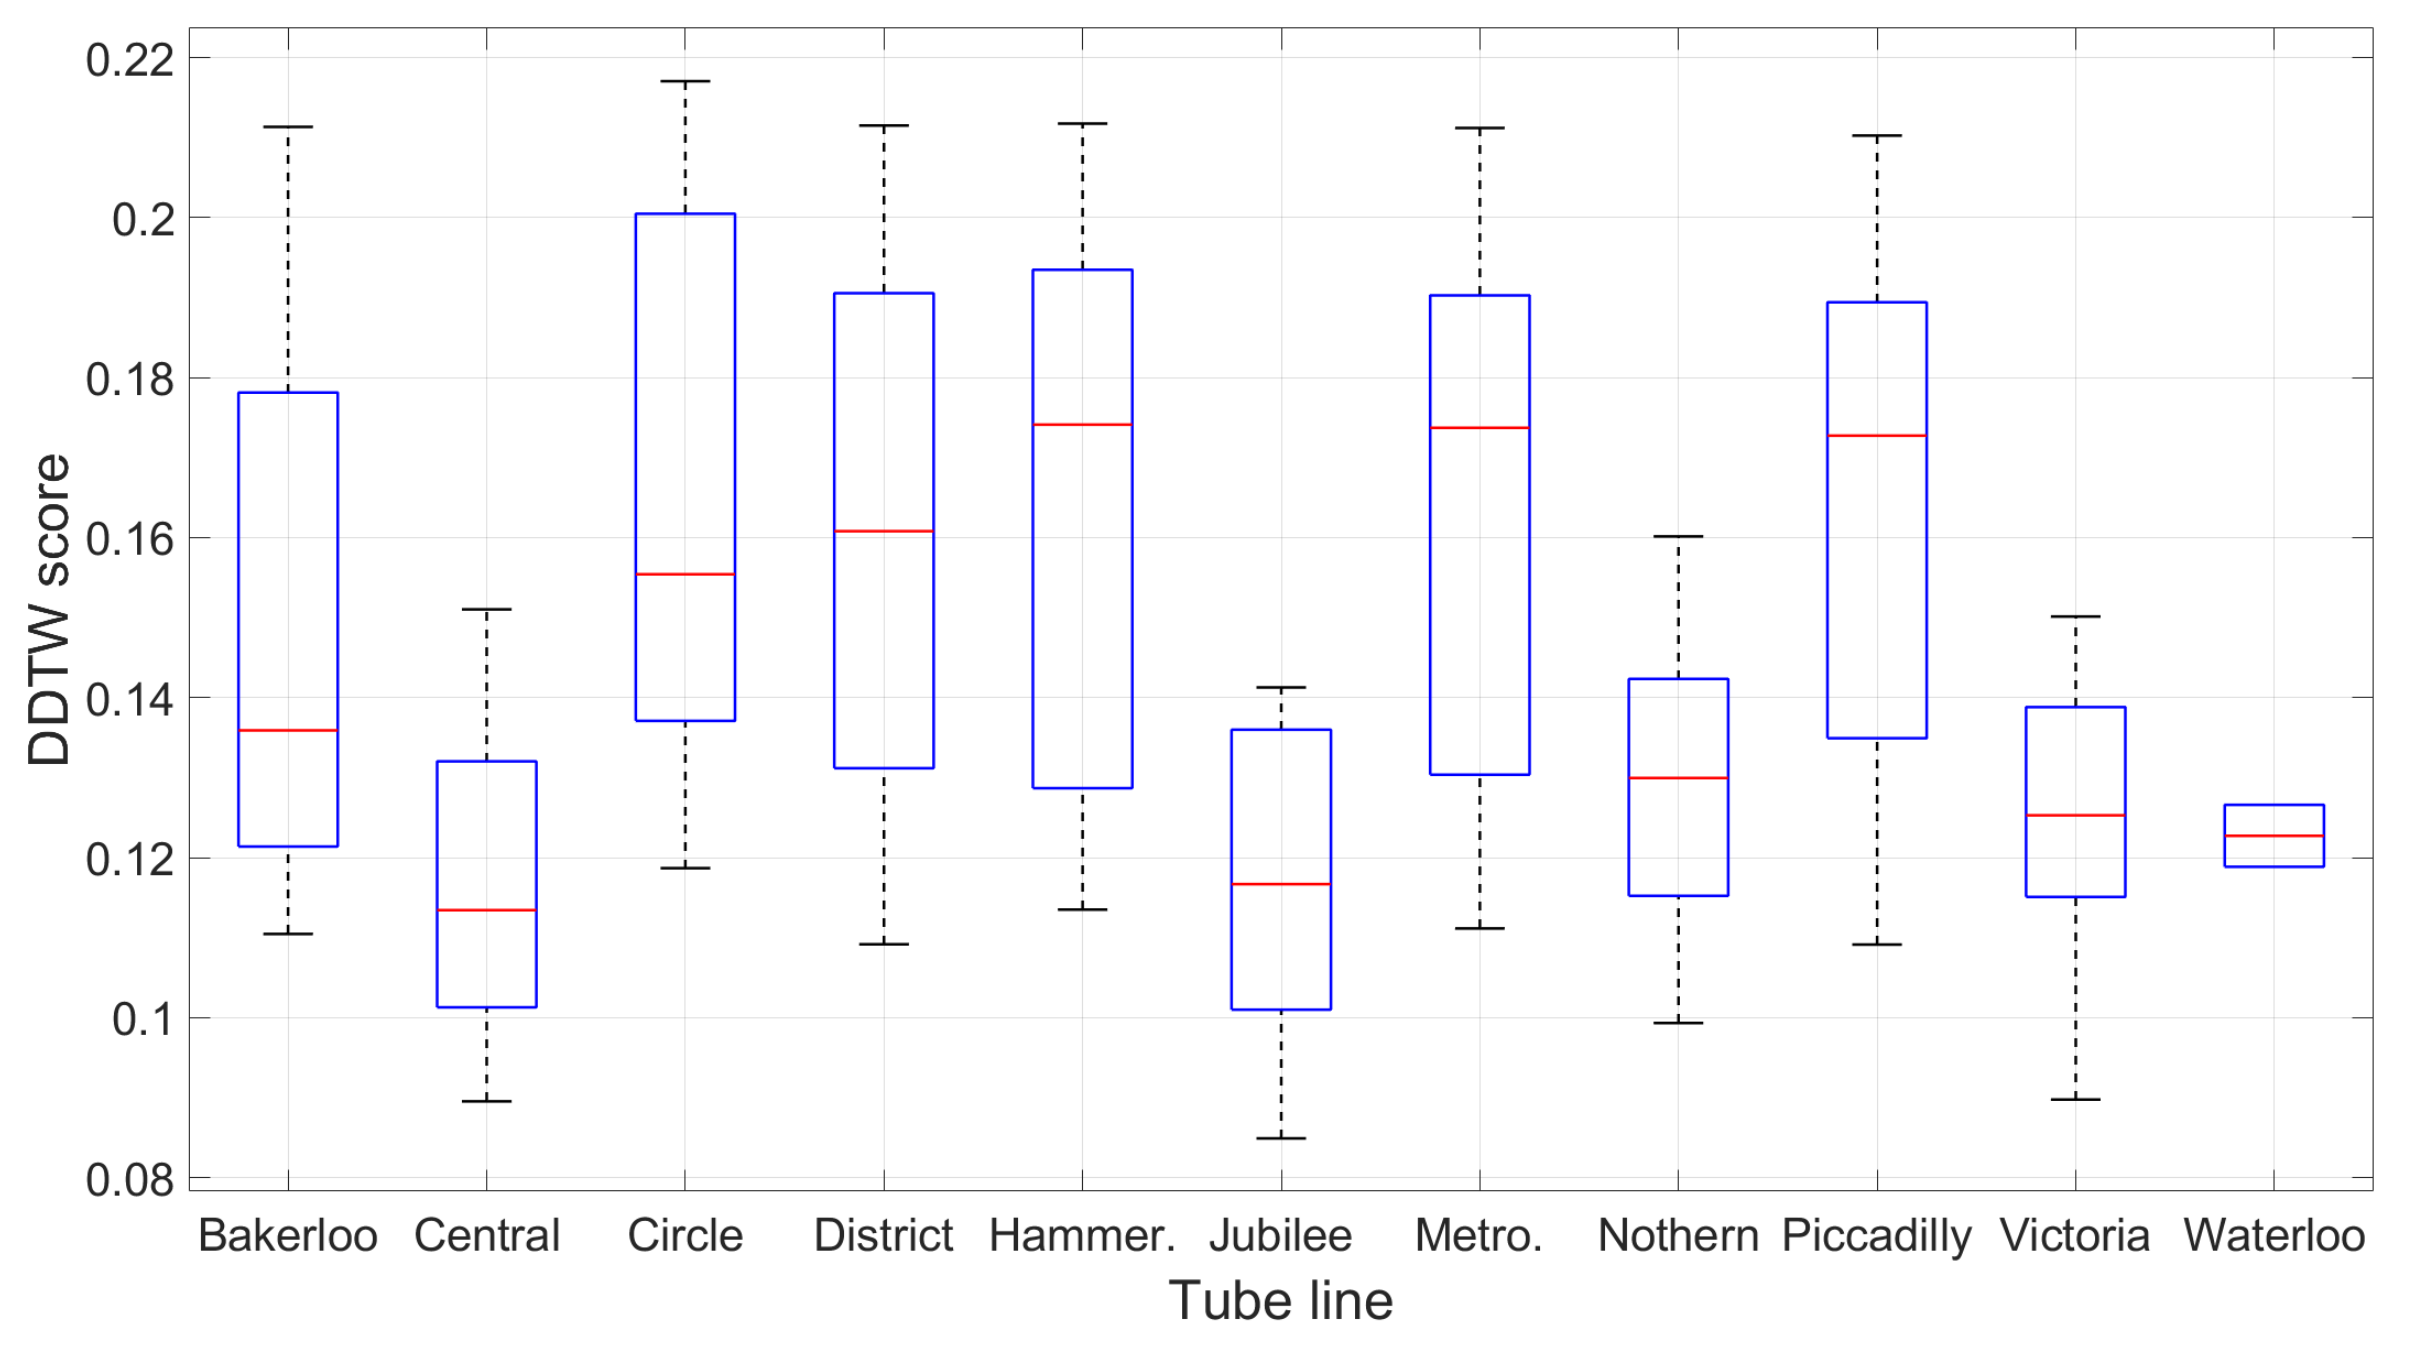
- How distinguishable are the accelerometer footprints on all routes? This question is useful in finding which route the passenger has been or is travelling on without being explicitly told by the user. Since trains accelerate and decelerate differently on each line and the underground tunnels have unique bumps and curves, we surmise that each route has a different accelerometer signature.
- How fast and accurate is the rail line positioning? How quickly and how accurately can the system pinpoint the rail line that the passenger is travelling on amongst 11 different lines with our matching engine.
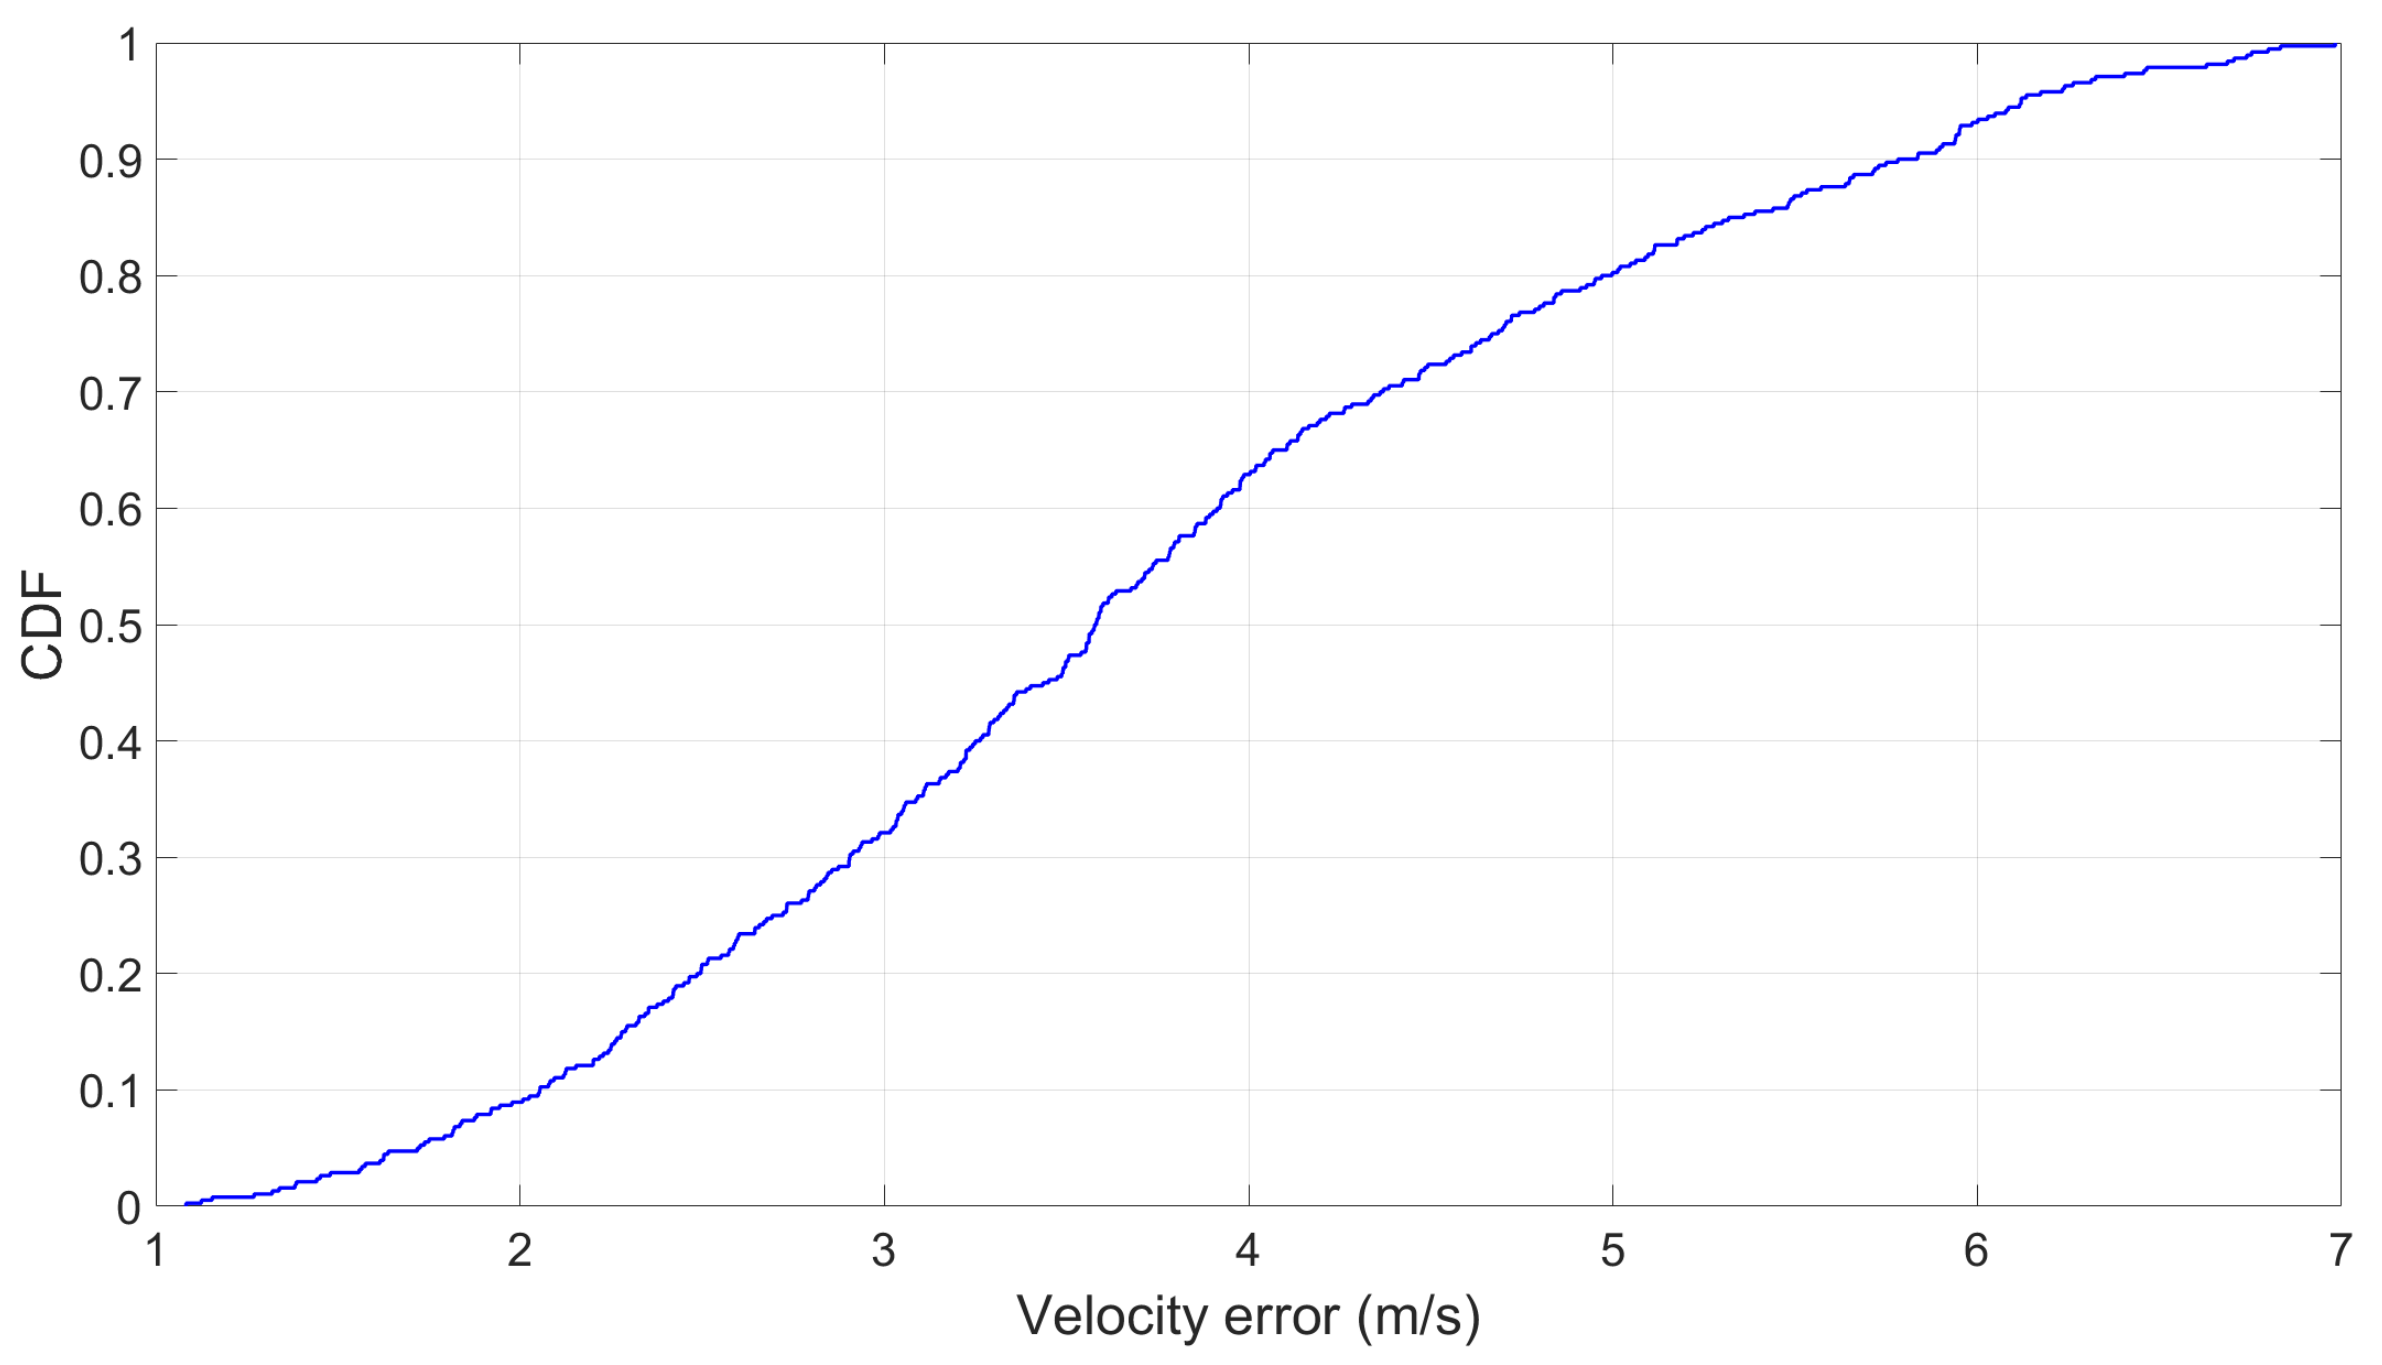
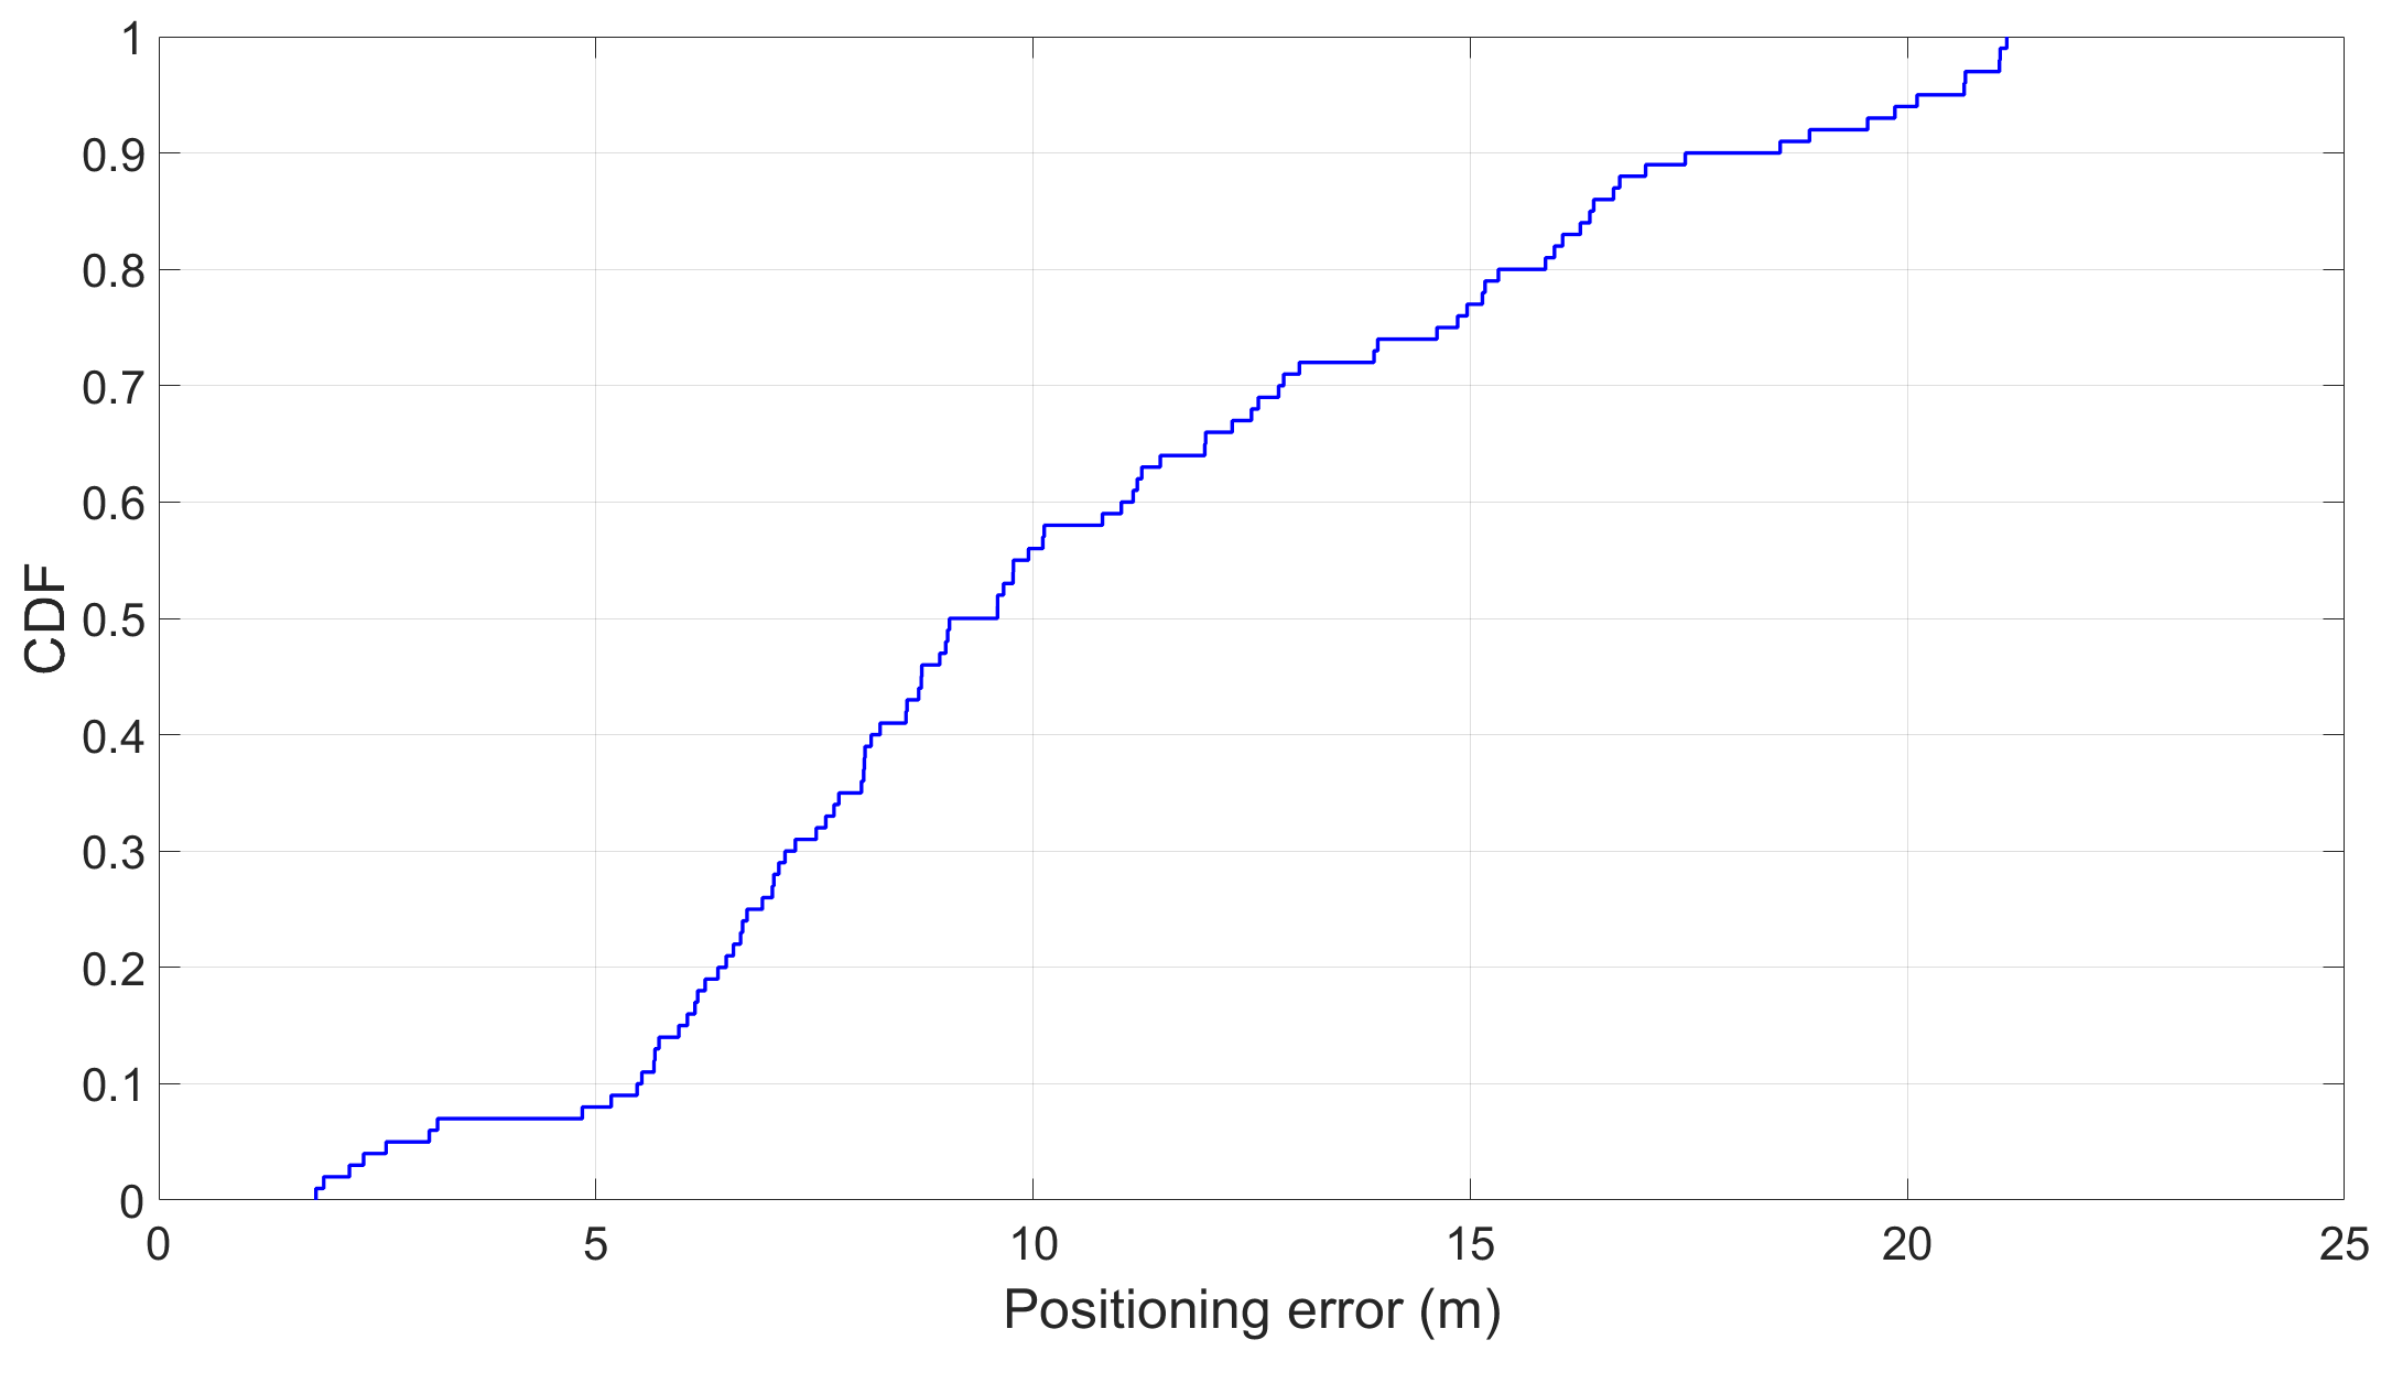
- How accurate is the passenger positioning estimation along the line? As the accelemerometer drifts over time, it is interesting to evaluate the positioning result with our inertial tracking mechanism.
7.2. Validation of Results
- Stopping reference. Trains always stop at each station, which allows us to verify if the estimated speed by the system is indeed zero. In particular, we have 381 such references.
- Landmark reference. Some parts of the tunnels are exposed to open air. The interchanges when the train goes in/out of the tunnel can be identified on Google Maps, which provides us the ground-truth distance to the next station. In particular, we manually observed 38 such landmarks (see Table 2).
7.3. Test Devices
7.4. Test Data
7.5. Temporal and Spatial Variation of the Accelerometer Trace across the Underground Network
7.6. Rail Line and Station Estimation Results
7.7. Speed and Positioning Estimation Results
8. Related Work
9. Conclusions and Further Work
Author Contributions
Acknowledgments
Conflicts of Interest
References
- Maurer, U.; Smailagic, A.; Siewiorek, D.; Deisher, M. Activity recognition and monitoring using multiple sensors on different body positions. In Proceedings of the International Workshop on Wearable and Implantable Body Sensor Networks (BSN’06), Cambridge, MA, USA, 3–5 April 2006. [Google Scholar]
- Wang, S.; Chen, C.; Ma, J. Accelerometer based transportation mode recognition on mobile phones. In Proceedings of the 2010 Asia-Pacific Conference on Wearable Computing Systems, Shenzhen, China, 17–18 April 2010; pp. 44–46. [Google Scholar]
- Reddy, S.; Mun, M.; Burke, J.; Estrin, D.; Hansen, M.; Srivastava, M. Using mobile phones to determine transportation modes. ACM Trans. Sensor Netw. (TOSN) 2010, 6, 13. [Google Scholar] [CrossRef]
- Shafique, M.A.; Hato, E. Use of acceleration data for transportation mode prediction. Transportation 2015, 42, 163–188. [Google Scholar] [CrossRef]
- Mizell, D. Using Gravity to Estimate Accelerometer Orientation. In Proceedings of the 7th IEEE International Symposium on Wearable Computers, White Plains, NY, USA, 21–23 October 2003; p. 252. [Google Scholar]
- Kunze, K.; Lukowicz, P.; Partridge, K.; Begole, B. Which way am I facing: Inferring horizontal device orientation from an accelerometer signal. In Proceedings of the 2009 International Symposium on Wearable Computers, Linz, Austria, 4–7 September 2009; pp. 149–150. [Google Scholar]
- Abdi, H.; Williams, L.J. Principal component analysis. Wiley Interdiscip. Rev. Comput. Stat. 2010, 2, 433–459. [Google Scholar] [CrossRef]
- Jolliffe, I. Principal Component Analysis; Springer: New York, NY, USA, 2011. [Google Scholar]
- Keogh, E.J.; Pazzani, M.J. Derivative dynamic time warping. In Proceedings of the 2001 SIAM International Conference on Data Mining, Chicago, IL, USA, 5–7 April 2001; pp. 1–11. [Google Scholar]
- Jeong, Y.S.; Jeong, M.K.; Omitaomu, O.A. Weighted dynamic time warping for time series classification. Pattern Recognit. 2011, 44, 2231–2240. [Google Scholar] [CrossRef]
- Senin, P. Dynamic time warping algorithm review. Inf. Comput. Sci. Dep. Univ. Hawaii Manoa Honol. USA 2008, 855, 40. [Google Scholar]
- Hu, N.; Dannenberg, R.B.; Tzanetakis, G. Polyphonic audio matching and alignment for music retrieval. In Proceedings of the 2003 IEEE Workshop on Applications of Signal Processing to Audio and Acoustics, New Paltz, NY, USA, 19–22 October 2003; pp. 185–188. [Google Scholar]
- Lütkepohl, H. New Introduction to Multiple Time Series Analysis; Springer Science & Business Media: Berlin, Germany, 2005. [Google Scholar]
- Rani, S.; Sikka, G. Recent techniques of clustering of time series data: A survey. Int. J. Comput. Appl. 2012, 52, 1–9. [Google Scholar] [CrossRef]
- Mansour, A.H.; Salh, G.Z.A.; Mohammed, K.A. Voice recognition using dynamic time warping and mel-frequency cepstral coefficients algorithms. Int. J. Comput. Appl. 2015, 116, 34–41. [Google Scholar] [CrossRef]
- Cheadle, C.; Vawter, M.P.; Freed, W.J.; Becker, K.G. Analysis of microarray data using Z score transformation. J. Mol. Diagn. 2003, 5, 73–81. [Google Scholar] [CrossRef]
- Mueen, A.; Keogh, E. Extracting optimal performance from dynamic time warping. In Proceedings of the 22nd ACM SIGKDD International Conference on Knowledge Discovery and Data Mining, San Francisco, CA, USA, 13–17 August 2016; pp. 2129–2130. [Google Scholar]
- Rakthanmanon, T.; Campana, B.; Mueen, A.; Batista, G.; Westover, B.; Zhu, Q.; Zakaria, J.; Keogh, E. Addressing big data time series: Mining trillions of time series subsequences under dynamic time warping. ACM Trans. Knowl. Discov. Data (TKDD) 2013, 7, 10. [Google Scholar] [CrossRef]
- Wang, X.; Mueen, A.; Ding, H.; Trajcevski, G.; Scheuermann, P.; Keogh, E. Experimental comparison of representation methods and distance measures for time series data. Data Min. Knowl. Discov. 2013, 26, 275–309. [Google Scholar] [CrossRef]
- Lee, G.; Han, D. Subway train stop detection using magnetometer sensing data. In Proceedings of the 2014 International Conference on Indoor Positioning and Indoor Navigation (IPIN), Busan, Korea, 27–30 October 2014; pp. 766–769. [Google Scholar]
- Higuchi, T.; Yamaguchi, H.; Higashino, T. Tracking motion context of railway passengers by fusion of low-power sensors in mobile devices. In Proceedings of the 2015 ACM International Symposium on Wearable Computers, Osaka, Japan, 7–11 September 2015; pp. 163–170. [Google Scholar]
- Nguyen, K.A.; Watkins, C.; Luo, Z. Co-location epidemic tracking on London public transports using low power mobile magnetometer. In Proceedings of the 2017 International Conference on Indoor Positioning and Indoor Navigation (IPIN), Sapporo, Japan, 18–21 September 2017; pp. 1–8. [Google Scholar]
- Stockx, T.; Hecht, B.; Schöning, J. SubwayPS: Towards smartphone positioning in underground public transportation systems. In Proceedings of the 22nd ACM SIGSPATIAL International Conference on Advances in Geographic Information Systems, Dallas, TX, USA, 4–7 November 2014; pp. 93–102. [Google Scholar]
- Hyuga, S.; Ito, M.; Iwai, M.; Sezaki, K. Estimate a user’s location using smartphone’s barometer on a subway. In Proceedings of the 5th International Workshop on Mobile Entity Localization and Tracking in GPS-less Environments, Seattle, VA, USA, 3 November 2015; p. 2. [Google Scholar]
- Watanabe, T.; Kamisaka, D.; Muramatsu, S.; Yokoyama, H. At which station am I?: Identifying subway stations using only a pressure sensor. In Proceedings of the 2012 16th International Symposium on Wearable Computers, Newcastle, UK, 18–22 June 2012; pp. 110–111. [Google Scholar]
- Lee, I.; Yoon, G.; Han, D. Nerimi: Wi-Fi-based subway navigation system. In Proceedings of the 2011 IEEE MTT-S International Microwave Workshop Series on Intelligent Radio for Future Personal Terminals, Daejeon, Korea, 24–25 August 2011; pp. 1–2. [Google Scholar]
- Nguyen, K.A.; Luo, Z.; Watkins, C. On the feasibility of using two mobile phones and WLAN signal to detect co-location of two users for epidemic prediction. In Progress in Location-Based Services 2014; Springer: Berlin, Germany, 2015; pp. 63–78. [Google Scholar]
- Gu, W.; Zhang, K.; Zhou, Z.; Jin, M.; Zhou, Y.; Liu, X.; Spanos, C.J.; Shen, Z.J.M.; Lin, W.H.; Zhang, L. Measuring fine-grained metro interchange time via smartphones. Trans. Res. Part C Emerg. Technol. 2017, 81, 153–171. [Google Scholar] [CrossRef]
- Hur, T.; Bang, J.; Kim, D.; Banos, O.; Lee, S. Smartphone location-independent physical activity recognition based on transportation natural vibration analysis. Sensors 2017, 17, 931. [Google Scholar] [CrossRef] [PubMed]
- Maier, M.; Dorfmeister, F. Fine-grained activity recognition of pedestrians travelling by subway. In Proceedings of the International Conference on Mobile Computing, Applications, and Services, Paris, France, 7–8 November 2013; pp. 122–139. [Google Scholar]
- Mongia, A.; Gunturi, V.M.; Naik, V. Detecting activities at metro stations using smartphone sensors. In Proceedings of the 2018 10th International Conference on Communication Systems & Networks (COMSNETS), Bengaluru, India, 3–7 January 2018; pp. 57–65. [Google Scholar]
- Thiagarajan, A.; Biagioni, J.; Gerlich, T.; Eriksson, J. Cooperative transit tracking using smart-phones. In Proceedings of the 8th ACM Conference on Embedded Networked Sensor Systems, Zurich, Switzerland, 3–5 November 2010; pp. 85–98. [Google Scholar]


| Line Name | Length (km) | Stations (km) | Shortest Stop | Longest Stop (km) | Train Stock |
|---|---|---|---|---|---|
| Bakerloo | 23.2 | 25 | 0.37 | 1.74 | 1972 |
| Central | 74 | 49 | 0.4 | 3.34 | 1992 |
| Circle | 27.2 | 36 | 0.31 | 1.85 | S7 |
| District | 64 | 60 | 0.31 | 2.37 | S7 |
| Hammersmith & City | 25.5 | 29 | 0.51 | 2.29 | S7 |
| Jubilee | 36.2 | 27 | 0.44 | 2.85 | 1996 |
| Metropolitan | 66.7 | 34 | 0.51 | 11.63 | S8 |
| Northern | 58 | 50 | 0.27 | 2.46 | 1995 |
| Piccadilly | 71 | 53 | 0.25 | 4.42 | 1973 |
| Victoria | 21 | 16 | 0.74 | 3.15 | 2009 |
| Waterloo & City | 2.5 | 2 | 2.37 | 2.37 | 1992 |
| Line | Landmarks | Comments |
|---|---|---|
| Bakerloo | 3 | by Willesden Junction, Queen’s Park, Wembley Central stations |
| Central | 3 | by White City, Leyton, Newbury Park stations |
| Circle | 8 | by Edgware Road, Bayswater, Notting Hill Gate, High Street Kensington, South Kensington, Sloane Square, Farringdon, Barbican stations |
| District | 5 | by Ravenscourt Park, South Kensington, Sloane Square, Whitechapel, Bow Road stations |
| Hammersmith & City | 5 | by Edgware Road, Farringdon, Barbican, Whitechapel, Bow Road stations |
| Jubilee | 2 | by Finchley Road, Canning Town stations |
| Metropolitan | 3 | by Finchley Road, Farringdon, Barbican stations |
| Northern | 4 | by Hendon Central, Hampstead, East Finchley, Morden stations |
| Piccadily | 5 | by Hounslow West, Hammersmith, Baron Courts, Bounds Green, Southgate stations. |
| Victoria | 0 | the entire tunnel is underground |
| Waterloo & City | 0 | the entire tunnel is underground |
| Phone Model | Accelerometer Vendor | Chip Revision | Year Made | Sampling Rate |
|---|---|---|---|---|
| LG G7 ThinQ | Invensense | 32 | 2018 | 50 Hz |
| Samsung J3 | Bosch | 1 | 2017 | 10 Hz |
| Lenovo Phab 2 | Bosch | 1,173,700 | 2016 | 20 Hz |
| Google Nexus 5 | Invensense | 1 | 2013 | 30 Hz |
| Samsung Nexus 2 | Invensense | 1 | 2011 | 40 Hz |
| Test Samples | Stations | Lines | |
|---|---|---|---|
| Normal instance | 2960 | 381 | 11 |
| Rush-hour instance | 104 | 28 | 6 |
| Line Estimation | Station Estimation | |||||||
|---|---|---|---|---|---|---|---|---|
| 1 Stop | 2 Stops | 3 Stops | 4 Stops | 1 Stop | 2 Stops | 3 Stops | 4 Stops | |
| Bakerloo | 41.67% | 73.9% | 100% | 100% | 35.42% | 67.39% | 100% | 100% |
| Central | 53.13% | 74.4% | 100% | 100% | 45.83% | 70.21% | 100% | 100% |
| Circle | 32.86% | 60.3% | 91.43% | 100% | 15.71% | 57.35% | 84.29% | 100% |
| District | 48.3% | 62.1% | 93.22% | 100% | 33.9% | 56.9% | 90.68% | 100% |
| Hammersmith & City | 19.64% | 46.3% | 100% | 100% | 16.1% | 44.4% | 100% | 100% |
| Jubilee | 46.15% | 70% | 100% | 100% | 40.38% | 62% | 100% | 100% |
| Metropolitan | 21.2% | 43.8% | 100% | 100% | 16.7% | 40.6% | 100% | 100% |
| Northern | 63.27% | 79.2% | 100% | 100% | 54.1% | 74% | 100% | 100% |
| Piccadilly | 44.23% | 65.7% | 100% | 100% | 34.62% | 62.75% | 100% | 100% |
| Victoria | 53.3% | 85.7% | 100% | 100% | 46.67% | 78.6% | 100% | 100% |
| Waterloo & City | 100% | 100% | 100% | 100% | 100% | 100% | 100% | 100% |
| 1 stop | ||||||||||||
|---|---|---|---|---|---|---|---|---|---|---|---|---|
| Bakerloo | Central | Circle | District | Hammer. | Jubilee | Metro. | Northern | Piccadilly | Victoria | Waterloo | Total | |
| Bakerloo | 80 (68) | 8 | 16 | 40 | 16 | 12 | 8 | 4 | 8 | 0 | 0 | 192 |
| Central | 0 | 204 (176) | 0 | 56 | 4 | 28 | 8 | 48 | 24 | 12 | 0 | 384 |
| Circle | 12 | 4 | 92 (44) | 76 | 20 | 0 | 44 | 4 | 28 | 0 | 0 | 280 |
| District | 52 | 16 | 68 | 228 (160) | 44 | 4 | 52 | 0 | 8 | 0 | 0 | 472 |
| Hammer. | 12 | 0 | 32 | 56 | 44 (36) | 0 | 32 | 8 | 36 | 4 | 0 | 224 |
| Jubilee | 4 | 36 | 0 | 16 | 0 | 96 (84) | 0 | 52 | 0 | 4 | 0 | 208 |
| Metro. | 8 | 0 | 52 | 64 | 36 | 0 | 56 (44) | 0 | 48 | 0 | 0 | 264 |
| Northern | 0 | 36 | 12 | 20 | 8 | 48 | 0 | 248 (212) | 12 | 8 | 0 | 392 |
| Piccadilly | 8 | 16 | 52 | 40 | 52 | 0 | 60 | 4 | 184 (144) | 0 | 0 | 416 |
| Victoria | 0 | 8 | 0 | 0 | 8 | 16 | 0 | 24 | 0 | 64 (56) | 0 | 120 |
| Waterloo | 0 | 0 | 0 | 0 | 0 | 0 | 0 | 0 | 0 | 0 | 8 (8) | 8 |
| Total | 176 | 328 | 324 | 596 | 232 | 204 | 260 | 392 | 348 | 92 | 8 | 2960 |
| 2 stops | ||||||||||||
| Bakerloo | Central | Circle | District | Hammer. | Jubilee | Metro. | Northern | Piccadilly | Victoria | Waterloo | Total | |
| Bakerloo | 136 (124) | 4 | 0 | 24 | 4 | 12 | 0 | 0 | 4 | 0 | 0 | 184 |
| Central | 0 | 280 (264) | 0 | 32 | 0 | 16 | 4 | 24 | 12 | 8 | 0 | 376 |
| Circle | 0 | 0 | 164 (156) | 60 | 8 | 0 | 24 | 0 | 16 | 0 | 0 | 272 |
| District | 32 | 16 | 52 | 288 (264) | 36 | 0 | 36 | 0 | 4 | 0 | 0 | 464 |
| Hammer. | 0 | 0 | 16 | 48 | 100 (96) | 0 | 20 | 4 | 28 | 0 | 0 | 216 |
| Jubilee | 0 | 20 | 0 | 8 | 0 | 140 (124) | 0 | 28 | 0 | 4 | 0 | 200 |
| Metro. | 0 | 0 | 36 | 48 | 28 | 0 | 112 (104) | 0 | 32 | 0 | 0 | 256 |
| Northern | 0 | 16 | 8 | 12 | 8 | 24 | 0 | 304 (284) | 4 | 8 | 0 | 384 |
| Piccadilly | 0 | 0 | 36 | 28 | 32 | 0 | 44 | 0 | 268 (256) | 0 | 0 | 408 |
| Victoria | 0 | 0 | 0 | 0 | 0 | 4 | 0 | 12 | 0 | 96 (88) | 0 | 112 |
| Waterloo | 0 | 0 | 0 | 0 | 0 | 0 | 0 | 0 | 0 | 0 | 8 (8) | 8 |
| Total | 168 | 336 | 312 | 548 | 216 | 196 | 240 | 372 | 368 | 116 | 8 | 2880 |
© 2019 by the authors. Licensee MDPI, Basel, Switzerland. This article is an open access article distributed under the terms and conditions of the Creative Commons Attribution (CC BY) license (http://creativecommons.org/licenses/by/4.0/).
Share and Cite
Nguyen, K.A.; Wang, Y.; Li, G.; Luo, Z.; Watkins, C. Realtime Tracking of Passengers on the London Underground Transport by Matching Smartphone Accelerometer Footprints. Sensors 2019, 19, 4184. https://doi.org/10.3390/s19194184
Nguyen KA, Wang Y, Li G, Luo Z, Watkins C. Realtime Tracking of Passengers on the London Underground Transport by Matching Smartphone Accelerometer Footprints. Sensors. 2019; 19(19):4184. https://doi.org/10.3390/s19194184
Chicago/Turabian StyleNguyen, Khuong An, You Wang, Guang Li, Zhiyuan Luo, and Chris Watkins. 2019. "Realtime Tracking of Passengers on the London Underground Transport by Matching Smartphone Accelerometer Footprints" Sensors 19, no. 19: 4184. https://doi.org/10.3390/s19194184
APA StyleNguyen, K. A., Wang, Y., Li, G., Luo, Z., & Watkins, C. (2019). Realtime Tracking of Passengers on the London Underground Transport by Matching Smartphone Accelerometer Footprints. Sensors, 19(19), 4184. https://doi.org/10.3390/s19194184