Evaluation of Bipolar, Tripolar, and Quadripolar Laplacian Estimates of Electrocardiogram via Concentric Ring Electrodes


Abstract
1. Introduction
2. Materials and Methods
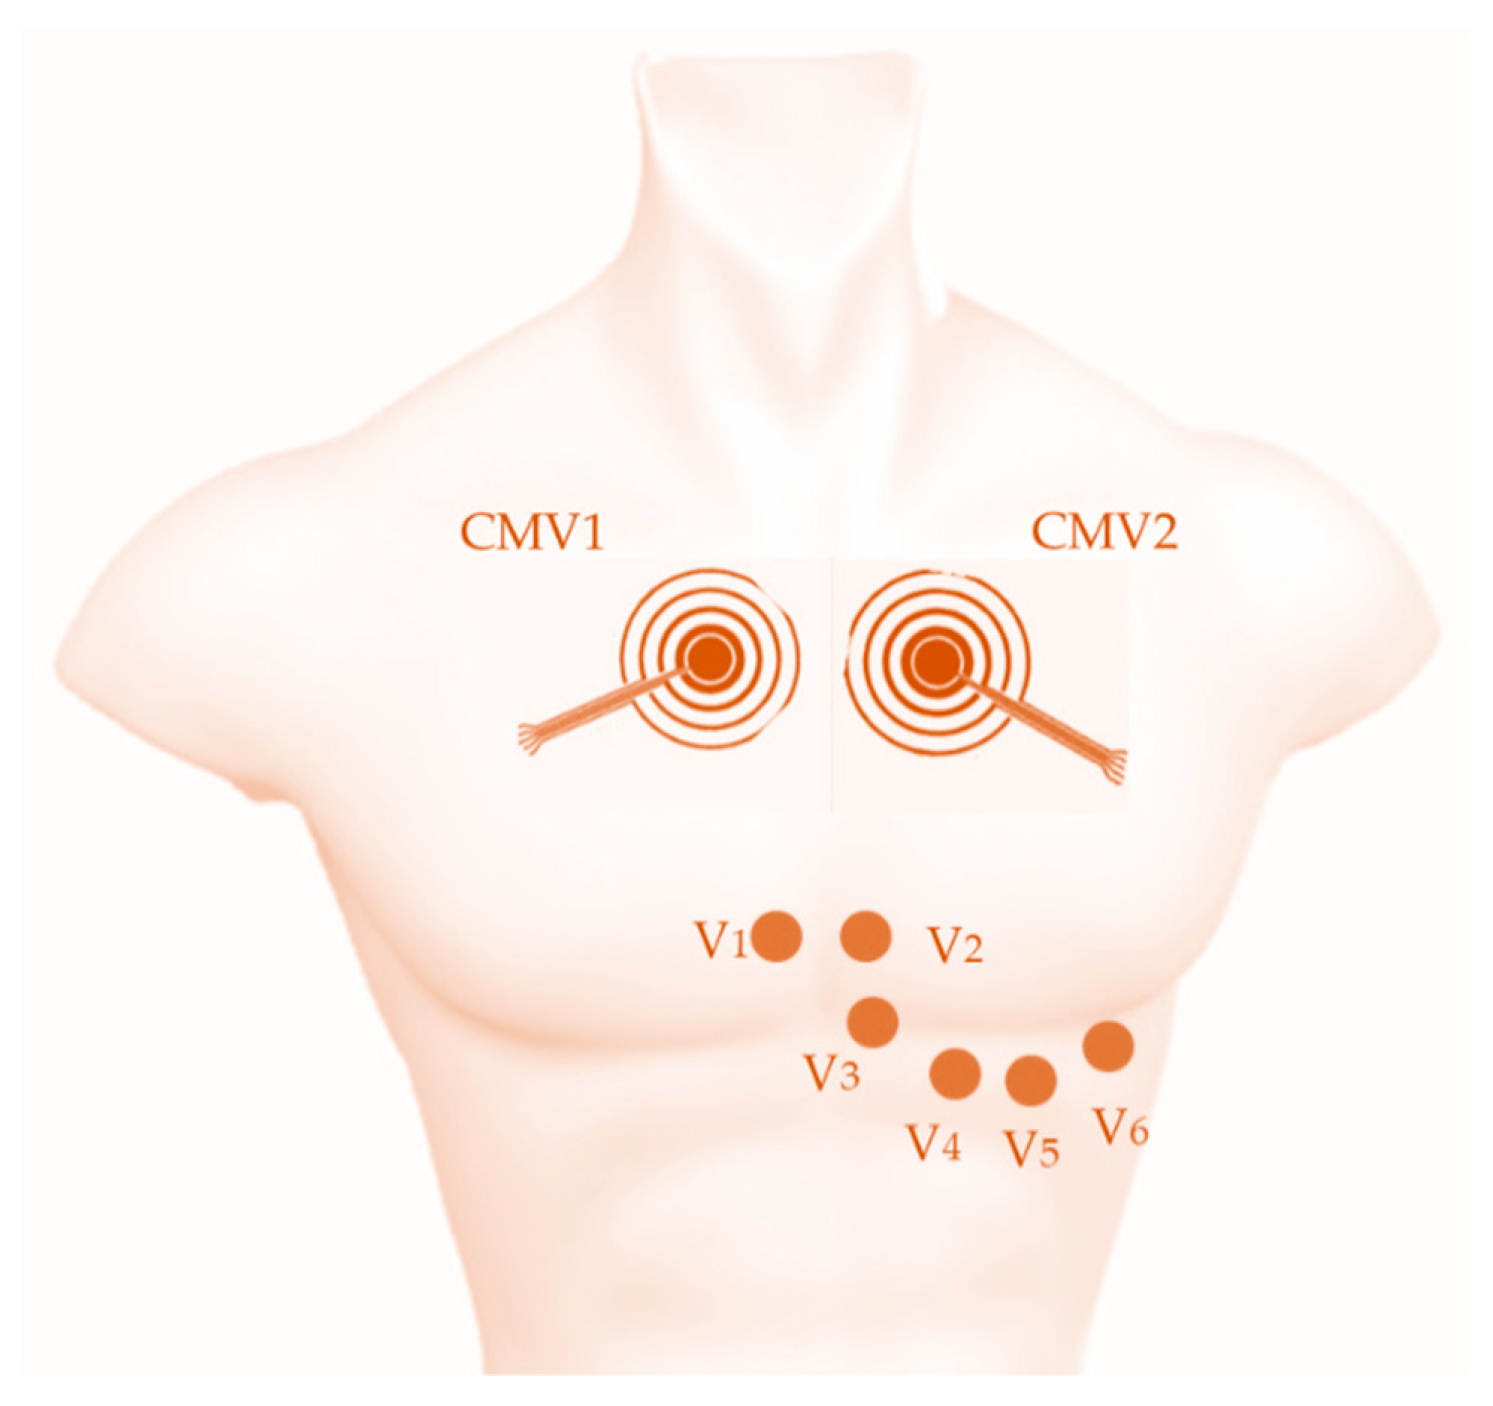
2.1. ECG Recording
2.2. Laplacian Estimates
2.3. Data Analysis
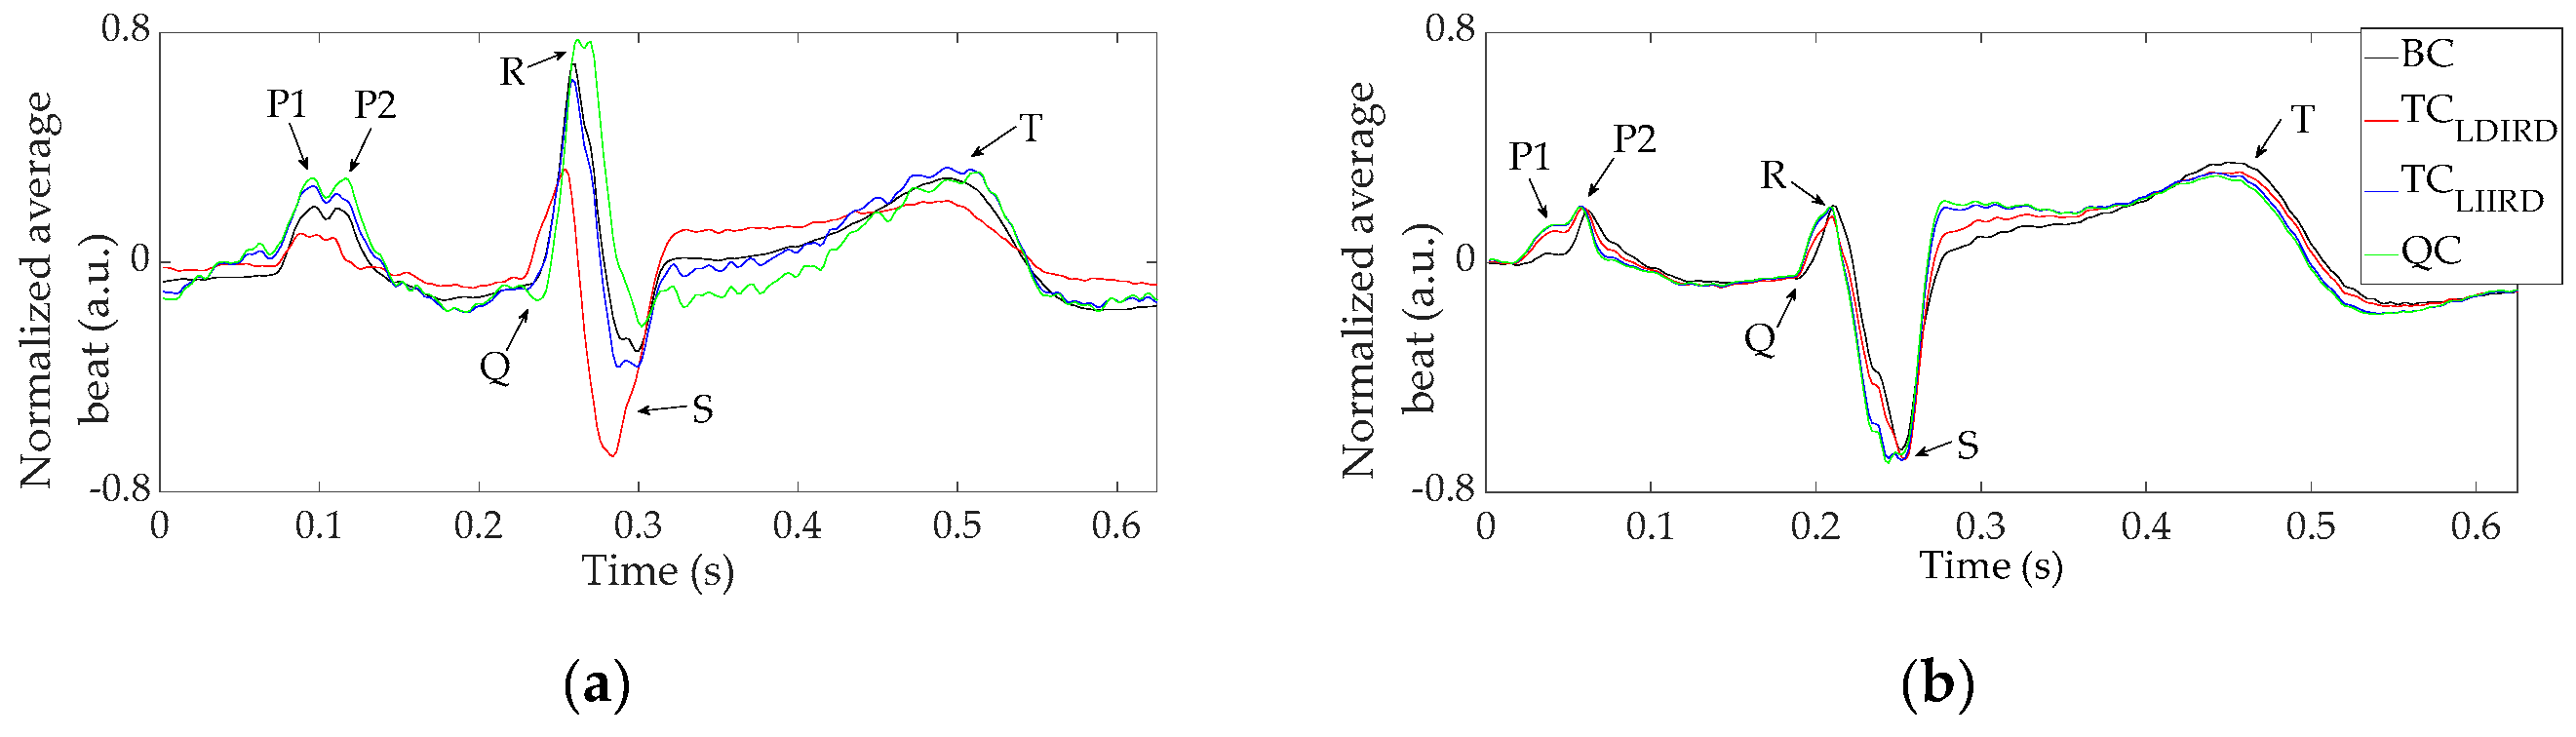
3. Results
3.1. Laplacian Estimates of ECG via CRE
3.2. Comparison with the Standard 12-Lead ECG
4. Discussion
Author Contributions
Funding
Acknowledgments
Conflicts of Interest
References
- Roth, G.A.; Johnson, C.; Abajobir, A.; Abd-Allah, F.; Abera, S.F.; Abyu, G.; Ahmed, M.; Aksut, B.; Alam, T.; Alam, K.; et al. Global, Regional, and National Burden of Cardiovascular Diseases for 10 Causes, 1990 to 2015. J. Am. Coll. Cardiol. 2017, 70, 1–25. [Google Scholar] [CrossRef] [PubMed]
- Lopez, A.D.; Mathers, C.D.; Ezzati, M.; Jamison, D.T.; Murray, C.J. Global and regional burden of disease and risk factors, 2001: Systematic analysis of population health data. Lancet 2006, 367, 1747–1757. [Google Scholar] [CrossRef]
- Bhatnagar, P.; Wickramasinghe, K.; Wilkins, E.; Townsend, N. Trends in the epidemiology of cardiovascular disease in the UK. Heart 2016, 102, 1945–1952. [Google Scholar] [CrossRef] [PubMed]
- Available online: https://healthmetrics.heart.org/cardiovascular-disease-a-costly-burden/ (accessed on 31 August 2019).
- Leal, J.; Luengo-Fernández, R.; Gray, A.; Petersen, S.; Rayner, M. Economic burden of cardiovascular diseases in the enlarged European Union. Eur. Heart J. 2006, 27, 1610–1619. [Google Scholar] [CrossRef] [PubMed]
- Malmivuo, J. The Basis of ECG Diagnosis. In Bioelectromagnetism Principles and Applications of Bioelectric and Biomagnetic Fields; Oxford University Press: Oxford, UK, 1995; pp. 320–335. [Google Scholar]
- Wang, Y.; Cuculich, P.S.; Zhang, J.; Desouza, K.A.; Vijayakumar, R.; Chen, J.; Faddis, M.N.; Lindsay, B.D.; Smith, T.W.; Rudy, Y. Noninvasive Electroanatomic Mapping of Human Ventricular Arrhythmias with Electrocardiographic Imaging. Sci. Transl. Med. 2011, 3, 98ra84. [Google Scholar] [CrossRef] [PubMed]
- He, B.; Wu, D. Laplacian electrocardiography. Crit. Rev. Biomed. Eng. 1999, 27, 285–338. [Google Scholar] [PubMed]
- SippensGroenewegen, A.; Peeters, H.A.; Jessurun, E.R.; Linnenbank, A.C.; Robles de Medina, E.O.; Lesh, M.D.; van Hemel, N.M. Body surface mapping during pacing at multiple sites in the human atrium: P-wave morphology of ectopic right atrial activation. Circulation 1998, 97, 369–380. [Google Scholar] [CrossRef] [PubMed][Green Version]
- Kornreich, F.; MacLeod, R.S.; Lux, R.L. Supplemented standard 12-lead electrocardiogram for optimal diagnosis and reconstruction of significant body surface map patterns. J. Electrocardiol. 2008, 41, 251–256. [Google Scholar] [CrossRef] [PubMed]
- Fereniec, M.; Stix, G.; Kania, M.; Mroczka, T.; Maniewski, R. An Analysis of the U-Wave and Its Relation to the T-Wave in Body Surface Potential Maps for Healthy Subjects and MI Patients. Ann. Noninvasive Electrocardiol. 2014, 19, 145–156. [Google Scholar] [CrossRef]
- Lian, J.; Li, G.; Cheng, J.; Avitall, B.; He, B. Body surface Laplacian mapping of atrial depolarization in healthy human subjects. Med. Biol. Eng. Comput. 2002, 40, 650–659. [Google Scholar] [CrossRef]
- Wu, D.; Tsai, H.C.; He, B. On the estimation of the Laplacian electrocardiogram during ventricular activation. Ann. Biomed. Eng. 1999, 27, 731–745. [Google Scholar] [CrossRef] [PubMed]
- He, B.; Cohen, R.J. Body surface Laplacian mapping of cardiac electrical activity. Am. J. Cardiol. 1992, 70, 1617–1620. [Google Scholar] [CrossRef]
- He, B.; Cohen, R.J. Body surface Laplacian ECG mapping. IEEE Trans. Biomed. Eng. 1992, 39, 1179–1191. [Google Scholar] [CrossRef] [PubMed]
- He, B.; Cohen, R.J. Body surface Laplacian electrocardiographic mapping—A review. Crit. Rev. Biomed. Eng. 1995, 23, 475–510. [Google Scholar] [CrossRef]
- Umetani, K.; Okamoto, Y.; Mashima, S.; Ono, K.; Hosaka, H.; He, B. Body Surface Laplacian Mapping in Patients with Left or Right Ventricular Bundle Branch Block. Pacing Clin. Electrophysiol. 1998, 21, 2043–2054. [Google Scholar] [CrossRef]
- He, B.; Li, G.; Lian, J. A spline Laplacian ECG estimator in a realistic geometry volume conductor. IEEE Trans. Biomed. Eng. 2002, 49, 110–117. [Google Scholar] [PubMed]
- Besio, W.G.; Koka, K.; Aakula, R.; Dai, W. Tri-polar concentric ring electrode development for laplacian electroencephalography. IEEE Trans. Biomed. Eng. 2006, 53, 926–933. [Google Scholar] [CrossRef]
- Besio, W.; Aakula, R.; Koka, K.; Dai, W. Development of a tri-polar concentric ring electrode for acquiring accurate Laplacian body surface potentials. Ann. Biomed. Eng. 2006, 34, 426–435. [Google Scholar] [CrossRef]
- Besio, W.; Chen, T. Tripolar Laplacian electrocardiogram and moment of activation isochronal mapping. Physiol. Meas. 2007, 28, 515–529. [Google Scholar] [CrossRef]
- Lu, C.C.; Tarjan, P.P. An ultra-high common-mode rejection ratio (CMRR) AC instrumentation amplifier for Laplacian electrocardiographic measurement. Biomed. Instrum. Technol. 1999, 33, 76–83. [Google Scholar]
- Prats-Boluda, G.; Garcia-Casado, J.; Martinez-de-Juan, J.L.; Ye-Lin, Y. Active concentric ring electrode for non-invasive detection of intestinal myoelectric signals. Med. Eng. Phys. 2011, 33, 446–455. [Google Scholar] [CrossRef] [PubMed]
- Prats-Boluda, G.; Ye-Lin, Y.; Bueno-Barrachina, J.M.; Rodriguez De Sanabria, R.; Garcia-Casado, J. Towards the clinical use of concentric electrodes in ECG recordings: Influence of ring dimensions and electrode position. Meas. Sci. Technol. 2016, 27, 025705. [Google Scholar] [CrossRef]
- Zena-Giménez, V.; Garcia-Casado, J.; Ye-Lin, Y.; Garcia-Breijo, E.; Prats-Boluda, G. A flexible multiring concentric electrode for non-invasive identification of intestinal slow Waves. Sensors 2018, 18, 396. [Google Scholar] [CrossRef] [PubMed]
- Ye-Lin, Y.; Alberola-Rubio, J.O.; Prats-boluda, G.; Perales, A.; Desantes, D.; Garcia-Casado, J. Feasibility and Analysis of Bipolar Concentric Recording of Electrohysterogram with Flexible Active Electrode. Ann. Biomed. Eng. 2015, 43, 968–976. [Google Scholar] [CrossRef] [PubMed]
- Wang, K.; Parekh, U.; Pailla, T.; Garudadri, H.; Gilja, V.; Ng, T.N. Stretchable Dry Electrodes with Concentric Ring Geometry for Enhancing Spatial Resolution in Electrophysiology. Adv. Healthc. Mater. 2017, 2017 6, 1700552. [Google Scholar] [CrossRef]
- Lidón-Roger, J.V.; Prats-Boluda, G.; Ye-Lin, Y.; Garcia-Casado, J.; Garcia-Breijo, E. Textile concentric ring electrodes for ECG recording based on screen-printing technology. Sensors 2018, 18, 300. [Google Scholar] [CrossRef]
- Makeyev, O.; Ding, Q.; Besio, W.G. Improving the accuracy of Laplacian estimation with novel multipolar concentric ring electrodes. Measurement 2016, 80, 44–52. [Google Scholar] [CrossRef] [PubMed]
- Makeyev, O.; Besio, W. Improving the Accuracy of Laplacian Estimation with Novel Variable Inter-Ring Distances Concentric Ring Electrodes. Sensors 2016, 16, 858. [Google Scholar] [CrossRef]
- Makeyev, O. Solving the general inter-ring distances optimization problem for concentric ring electrodes to improve Laplacian estimation. Biomed. Eng. Online 2018, 17, 117. [Google Scholar] [CrossRef]
- Makeyev, O.; Lee, C.; Besio, W.G. Proof of concept Laplacian estimate derived for noninvasive tripolar concentric ring electrode with incorporated radius of the central disc and the widths of the concentric rings. In Proceedings of the 2017 39th Annual International Conference of the IEEE Engineering in Medicine and Biology Society (EMBC), Jeju Island, Korea, 11–15 July 2017; pp. 841–844. [Google Scholar]
- Ye-Lin, Y.; Bueno-Barrachina, J.M.; Prats-boluda, G.; Rodriguez de Sanabria, R.; Garcia-Casado, J. Wireless sensor node for non-invasive high precision electrocardiographic signal acquisition based on a multi-ring electrode. Meas. J. Int. Meas. Confed. 2017, 97, 195–202. [Google Scholar] [CrossRef]
- Prats-Boluda, G.; Ye-Lin, Y.; Pradas-Novella, F.; Garcia-Breijo, E.; Garcia-Casado, J. Textile Concentric Ring Electrodes: Influence of Position and Electrode Size on Cardiac Activity Monitoring. J. Sens. 2018, 2018, 1–9. [Google Scholar] [CrossRef]
- Huiskamp, G. Difference formulas for the surface Laplacian on a triangulated surface. J. Comput. Phys. 1991, 95, 477–496. [Google Scholar] [CrossRef]
- Hamilton, P.S.; Tompkins, W.J. Quantitative investigation of QRS detection rules using the MIT/BIH arrhythmia database. IEEE Trans. Biomed. Eng. 1986, 33, 1157–1165. [Google Scholar] [CrossRef] [PubMed]
- Lu, C.C.; Tarjan, P.P. Pasteless, Active, Concentric Ring Sensors for Directly Obtained Laplacian Cardiac Electrograms. J. Med. Biol. Eng. 2002, 22, 199–203. [Google Scholar]
- Koka, K.; Besio, W.G. Improvement of spatial selectivity and decrease of mutual information of tri-polar concentric ring electrodes. J. Neurosci. Methods 2007, 165, 216–222. [Google Scholar] [CrossRef]
- Prats-Boluda, G.; Ye-Lin, Y.; Barrachina, J.B.; Senent, E.; de Sanabria, R.R.; Garcia-Casado, J. Development of a portable wireless system for bipolar concentric ECG recording. Meas. Sci. Technol. 2015, 26, 075102. [Google Scholar] [CrossRef]
- Kaufer, M.; Rasquinha, L.; Tarjan, P. Optimization of multi-ring sensing electrode set. In Proceedings of the 12th Annual International Conference of the IEEE Engineering in Medicine and Biology Society, Philadelphia, PA, USA, 1–4 November 1990. [Google Scholar]


| CRE Position | Laplacian Estimate | SNR (dB) | NAP | CV_NAP (%) |
|---|---|---|---|---|
| CMV1 | BC | 29.56 ± 5.62 | 0.19 ± 0.09 | 26.43 ± 20.03 |
| TCLDIRD | 23.53 ± 5.29 | 0.21 ± 0.11 | ||
| TCLIIRD | 19.94 ± 8.48 | 0.25 ± 0.14 | ||
| QC | 19.71 ± 7.38 | 0.22 ± 0.10 | ||
| CMV2 | BC | 36.99 ± 4.70 | 0.081 ± 0.034 | 20.11 ± 11.20 |
| TCLDIRD | 34.49 ± 4.56 | 0.090 ± 0.046 | ||
| TCLIIRD | 30.66 ± 5.54 | 0.095 ± 0.041 | ||
| QC | 27.44 ± 6.83 | 0.101 ± 0.048 |
| CRE Posit. | Laplac. Estim. | V1 | V2 | V3 | V4 | V5 | V6 | I | II | III | aVR | aVL | aVF |
|---|---|---|---|---|---|---|---|---|---|---|---|---|---|
| CMV1 | BC | *** | *** | *** | *** | *** | *** | * | ** | ** | * | * | |
| TCLDIRD | *** | *** | *** | *** | *** | *** | *** | *** | ** | *** | ** | ** | |
| TCLIIRD | *** | *** | *** | *** | *** | *** | ** | ** | * | *** | ** | ** | |
| QC | *** | *** | *** | *** | *** | *** | ** | *** | * | *** | ** | ** | |
| CMV2 | BC | ** | ** | *** | * | ||||||||
| TCLDIRD | ** | ** | *** | * | |||||||||
| TCLIIRD | ** | * | *** | *** | ** | ||||||||
| QC | *** | * | *** | *** | ** |
© 2019 by the authors. Licensee MDPI, Basel, Switzerland. This article is an open access article distributed under the terms and conditions of the Creative Commons Attribution (CC BY) license (http://creativecommons.org/licenses/by/4.0/).
Share and Cite
Garcia-Casado, J.; Ye-Lin, Y.; Prats-Boluda, G.; Makeyev, O. Evaluation of Bipolar, Tripolar, and Quadripolar Laplacian Estimates of Electrocardiogram via Concentric Ring Electrodes. Sensors 2019, 19, 3780. https://doi.org/10.3390/s19173780
Garcia-Casado J, Ye-Lin Y, Prats-Boluda G, Makeyev O. Evaluation of Bipolar, Tripolar, and Quadripolar Laplacian Estimates of Electrocardiogram via Concentric Ring Electrodes. Sensors. 2019; 19(17):3780. https://doi.org/10.3390/s19173780
Chicago/Turabian StyleGarcia-Casado, Javier, Yiyao Ye-Lin, Gema Prats-Boluda, and Oleksandr Makeyev. 2019. "Evaluation of Bipolar, Tripolar, and Quadripolar Laplacian Estimates of Electrocardiogram via Concentric Ring Electrodes" Sensors 19, no. 17: 3780. https://doi.org/10.3390/s19173780
APA StyleGarcia-Casado, J., Ye-Lin, Y., Prats-Boluda, G., & Makeyev, O. (2019). Evaluation of Bipolar, Tripolar, and Quadripolar Laplacian Estimates of Electrocardiogram via Concentric Ring Electrodes. Sensors, 19(17), 3780. https://doi.org/10.3390/s19173780