Article

Intelligent 3D Perception System for Semantic Description and Dynamic Interaction

by
Marco Antonio Simoes Teixeira
1,*,
Rafael de Castro Martins Nogueira
1,
Nicolas Dalmedico
1,
Higor Barbosa Santos
1,
Lucia Valeria Ramos de Arruda
1,
Flavio Neves-Jr
1,
Daniel Rodrigues Pipa
1,
Julio Endress Ramos
2 and
Andre Schneider de Oliveira
1
1
Graduate School of Electrical Engineering and Computer Science (CPGEI), Federal University of Technology-Paraná (UTFPR), Avenida 7 de Setembro 3165, Curitiba 80230-901, Brazil
2
CENPES, Rio de Janeiro 21941-915, Brazil
*
Author to whom correspondence should be addressed.
Sensors 2019, 19(17), 3764; https://doi.org/10.3390/s19173764
Submission received: 30 June 2019 / Revised: 7 August 2019 / Accepted: 13 August 2019 / Published: 30 August 2019
(This article belongs to the Special Issue Semantic Representations for Behavior Analysis in Robotic System)

Abstract

:
This work proposes a novel semantic perception system based on computer vision and machine learning techniques. The main goal is to identify objects in the environment and extract their characteristics, allowing a dynamic interaction with the environment. The system is composed of a GPU processing source and a 3D vision sensor that provides RGB image and PointCloud data. The perception system is structured in three steps: Lexical Analysis, Syntax Analysis and finally an Analysis of Anticipation. The Lexical Analysis detects the actual position of the objects (or tokens) in the environment, through the combination of RGB image and PointCloud, surveying their characteristics. All information extracted from the tokens will be used to retrieve relevant features such as object velocity, acceleration and direction during the Syntax Analysis step. The anticipation step predicts future behaviors for these dynamic objects, promoting an interaction with them in terms of collisions, pull, and push actions. As a result, the proposed perception source can assign relevant information to mobile robots, not only about distances as traditional sensors, but about other environment characteristics and object behaviors. This novel perception source introduces a new class of skills to mobile robots. Experimental results obtained with a real robot are presented, showing the proposed perception source efficacy and potential.

1. Introduction

Nowadays, mobile robotics is one of the most prominent research areas [1,2]. Robots with the ability to freely move through an environment, knowing their positions and able to sense the world can execute intelligent tasks. Such robots may develop tasks, for example, in industries [3,4,5] and in rescue tasks [6,7,8], or replacing humans in hazardous work.
Such robots need to perceive the environment around them to identify obstacles and execute actions without collisions. That is, the robot needs to see the world before making some decision. For this, it uses sensors that allow for converting real-world data into digital information that can be used by robots and promote actions [9,10].
There are numerous types of sensors for mobile robotics. Some are popular due to their low cost and easy data manipulation, such as color image (RGB image) provided by cameras. These sensors can be used to identify Augmented Reality Tags (AR-Tags) [11,12], among other computational vision tasks [13,14,15]. Despite its worldwide use, the RGB sensor provides a simple image of the environment, without any specific characteristic that allows smart actions.
Intelligent behaviors are not achieved without a detailed understanding of the environment that allows a reliable mapping and safe obstacle avoidance. The depth sense is primordial to obtain a three-dimensional insight and execute instantaneous reactions in the presence of obstacles or planned deviations. RGB sensors provide a cloud of points (or PointClouds), which can collect spatial information from the environment. They are used in numerous works in mobile robotics [16,17,18], mainly towards obstacles avoidance and environment mapping.
However, this type of sensor provides only the notion of distance between the robot and nearby objects without identifying them. This lack of information causes the robot to consider all objects (dynamic, static, animate, or inanimate ones) in the same way. In summary, all objects are understood as a static obstacle in a scene simplification. In fact, the environment is commonly composed of a lot of moving objects, and a static sensing compromises the robot navigation since planning must consider instantaneous information that changes over time.
For example, consider a person walking inside the same room where a robot must navigate from point A to B. This robot has a depth sensor which sees all objects in the environment (including the person) and can plan the path to achieve point B avoiding all obstacles. Nevertheless, the person crosses the robot’s path, and a new path is computed to avoid collision. This process can be eternal if the person continues to move and the robot always chooses the same side to implement an avoidance maneuver. To prevent such situation, It is primordial that more detailed information about the environment (for example, person motion forecast) is available to enhance intelligent behaviors, such as [19,20,21].
In addition to RGB sensors and depth sensors, other sensors can be used to add extra information to robots, such as temperature and localization, among others. The usefulness of this additional information requires a correlation analysis with primary sensors or simply a data fusion procedure that enhances a robot’s understanding and or improves specific sensing. In fact, the use of a group of sensors does not effectively increase the robot knowledge about the environment, but only provides several independent information sources.
The transformation of raw information from the sensors into useful information for robots requires the execution of several procedures based on different techniques. Such procedures compose the so-called perception system that helps robots perform a dynamic interaction with scene elements to make inferences about features of the environment.
For instance, some papers use data from the RGB sensor to identify objects, and others combine such data with methods to segment objects in environments with 3D sensors [22,23]. These works manipulate raw sensor data to extract some useful information. The problem with this approach is that it should be done to each robot and a specific task, without any generalization.
There have been several object recognition techniques developed in recent years [24,25,26]. Deep learning techniques stand out as the best choice due to the best accuracy for object detection tasks [27,28,29,30,31,32]. Among them, one that stands out is YOLO (You Only Look Once) [33] due to its high accuracy and quickness in object recognition tasks. Such characteristics make YOLO a potential tool for being integrated into a sensor allowing a more detailed information catch.
This work proposes a novel intelligent perception source that introduces a new class of mobile robots skills through a detailed sensing of environment components. The approach rigorously decomposes RGB-D camera data through three analysis: lexical, syntax, and anticipation. Thus, decomposition is based on Semantic Description and Dynamic Interaction (SD2I). Mobile robots with SD2I perception will identify objects from the environment and understand the dynamic behavior of time-variant elements, allowing intelligent interaction.
This paper is organized as follows. A brief description of the used 3D perception sources is carried out in Section 2. The proposed perception system is developed in Section 3. Section 4 brings practical experiments and results and a discussion about the efficacy of the proposed system. Section 5 concludes the paper presenting an overview of the work.

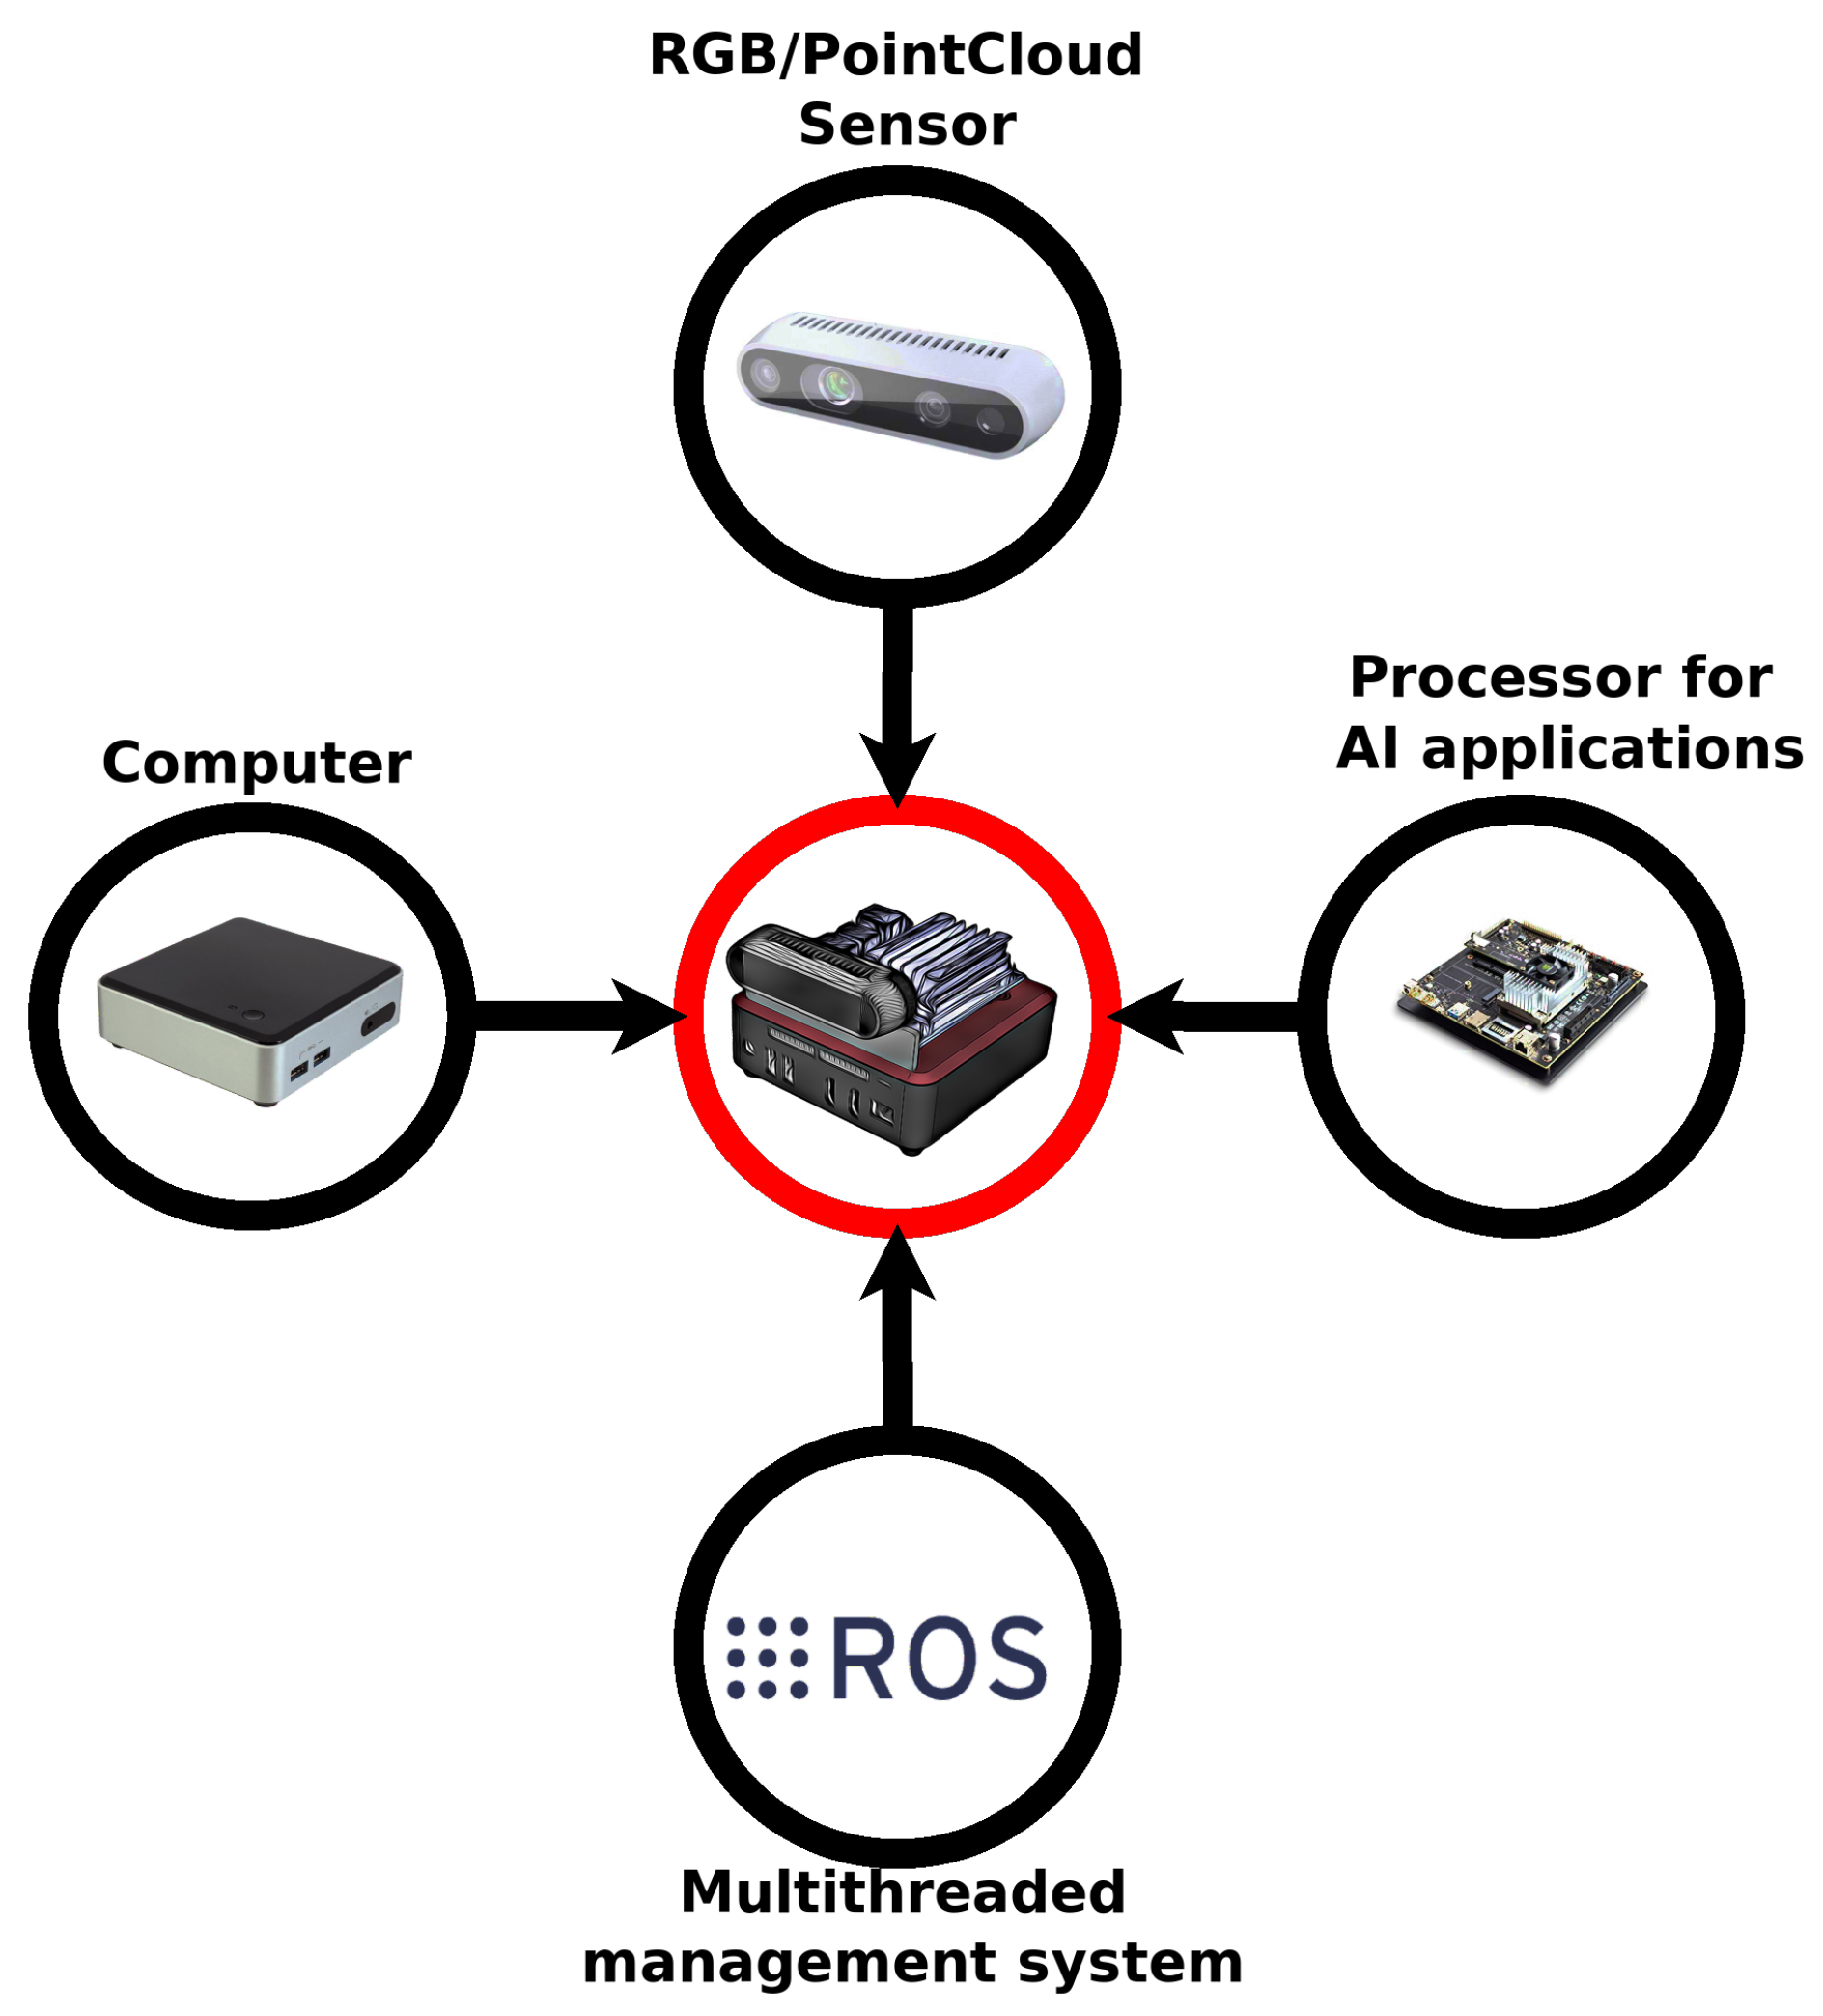
2. Overview of Used 3D Perception Sources

The approach developed in this paper applies Semantic Description and Dynamic Interaction (SD2I) to collect information from the environment through RGB-D sensors and convert them into useful and intelligent information for a robot. In addition, we also present a compatible embedded hardware supporting such approach. An illustration of the proposed system, called the Intelligent 3D Perception (I3P) system, can be seen in Figure 1.
The SD2I methodology is based on an embedded system with a 3D sensor. The PointCloud is acquired through an RGB-D sensor, which can be Intel RealSense [34], Kinect v1 or Kinect v2 [35], among others.
I3P system uses YOLO (You Only Look Once) to identify the objects by the RGB image from the source of perception. The third version of YOLO is available since 2018 [33]. In addition to the standard version, there is the “tiny-YOLO” version, which makes it possible to identify the same objects with lower precision. The main advantage of “tiny-YOLO” is a reduced number of layers, which makes it ideal to be embedded. Moreover, YOLO has showed good results when used with several different datasets, such as COCO [36], PASCAL VOC [37], and the KITTY dataset [38]. In this way, YOLO becomes suitable for object recognition in any previously cited databases.
A robot embedded device using YOLOv3 must have processing capacity to run a Convolutional Neural Network (CNN) [29]. Such devices make use of GPUs to execute these tasks; some examples are Jetson Tx1, Jetson Tx2, Jetson Nano or Jetson Xavier [39]. For the I3P system, this device is corresponding to Processor for Ai application in Figure 1.
The I3P required processor must be capable of collecting information from Points Cloud and from the Processor for the AI application, processing and returning information in a time period useful to the robot. A mini computer is chosen due to its processing power since the information delay due to an RGB-D sensor affects the run time of the proposed strategy. A suggested piece of equipment is Intel Nuc I5 (Santa Clara, CA, USA) [40] or similar.
The perception sensor is a distributed system composed of two processing sources and a 3D sensor. The I3P system management is based on an Robot Operating System (ROS) [41] to gather all information coming from different sources. ROS is a framework with tools that allow the use of parallel programming and distributed systems. Thus, the I3P system can operate with various sources of processing, and perception, as well as providing a method for the robot to read the information from the sensor in a comfortable and agile way.
All components presented herein compose the hardware supporting the application of the approach proposed by this paper.This will be further detailed in Section 3, where the developed methodology for I3P system will be presented in detail.

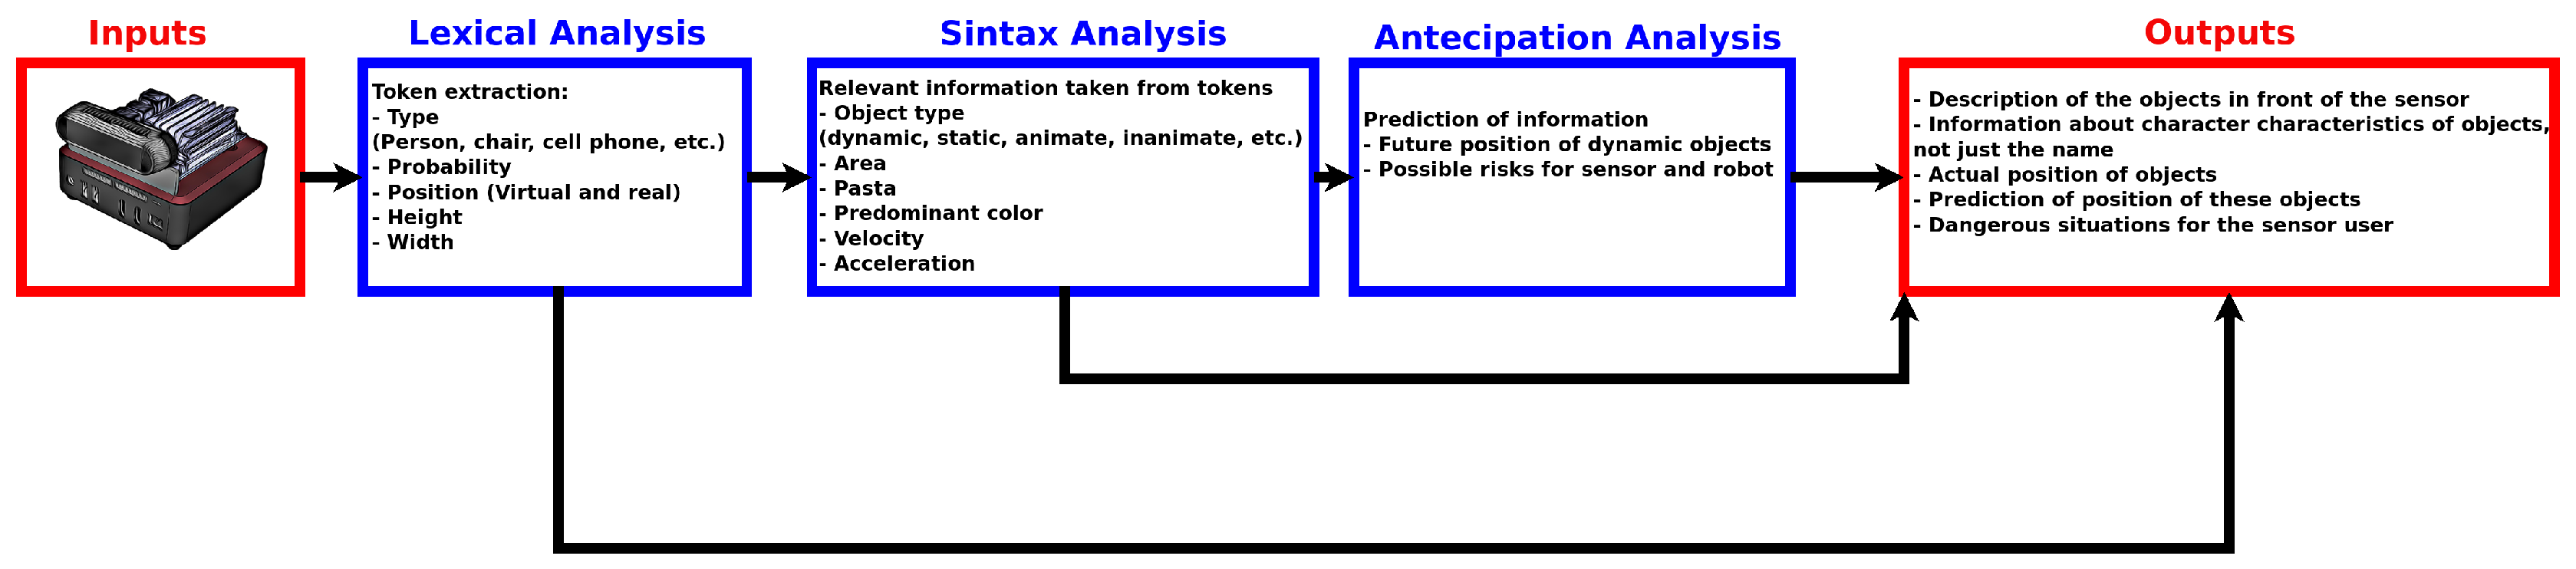
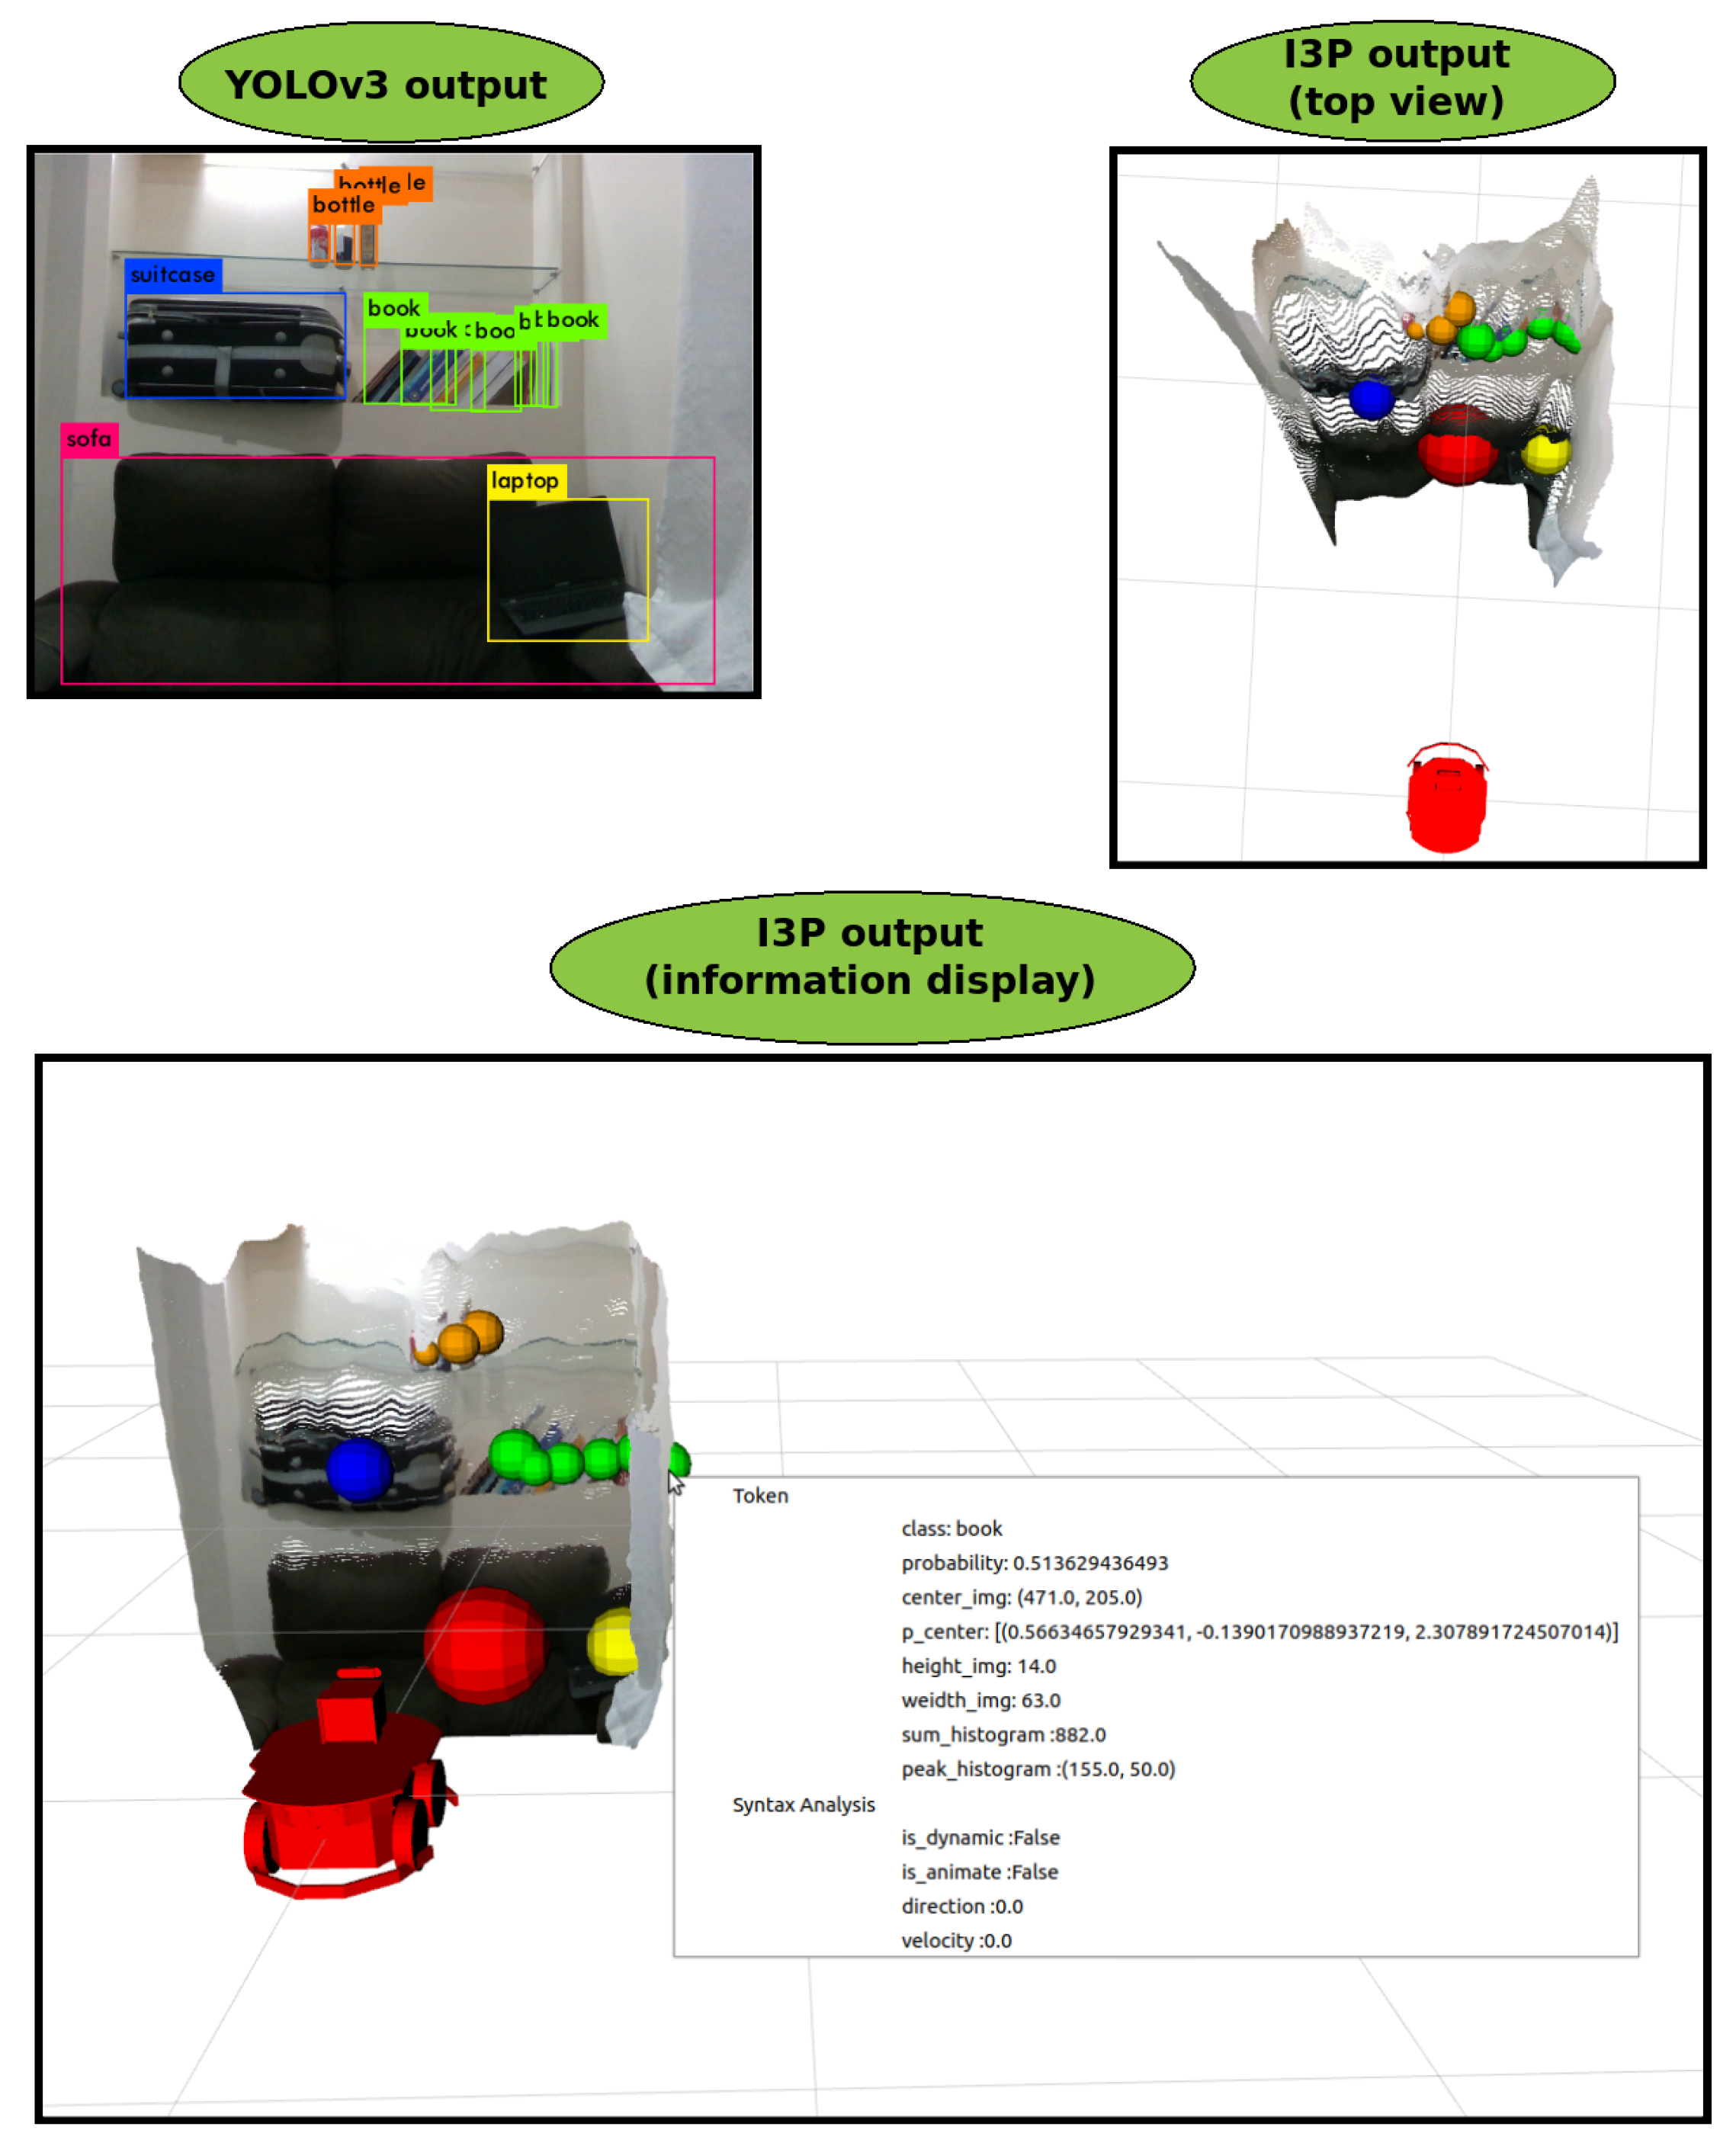
3. Semantic Description and Dynamic Interaction (SD2I)

This paper presents a new intelligent perception source with a high abstraction level to mobile robots. It is called Semantic Description and Dynamic Interaction (SD2I), and it is shown in Figure 2. The main goal is the introduction of a new class of skills to mobile robots, allowing their interaction with a large group of time-varying objects from a crowded environment. The proposed methodology is conceived to be embedded into the Intelligent 3D Perception (I3P) system described above or another similar powerfully processor.
The SD2I methodology comprises three distinct steps to process and extract the environment features. The first step is the Lexical Analysis. In this step, the environment objects are identified and their attributes such as kind, height, width, confidence, and position are extracted. The second part, Syntax Analysis, consists of an element (Token) analysis, in which all objects’ particular features like speed, acceleration, mass, and strength are estimated. Finally, the Anticipation Analysis uses the estimated parameters to infer future actions of dynamic objects. These analyses will be detailed in the following subsections.

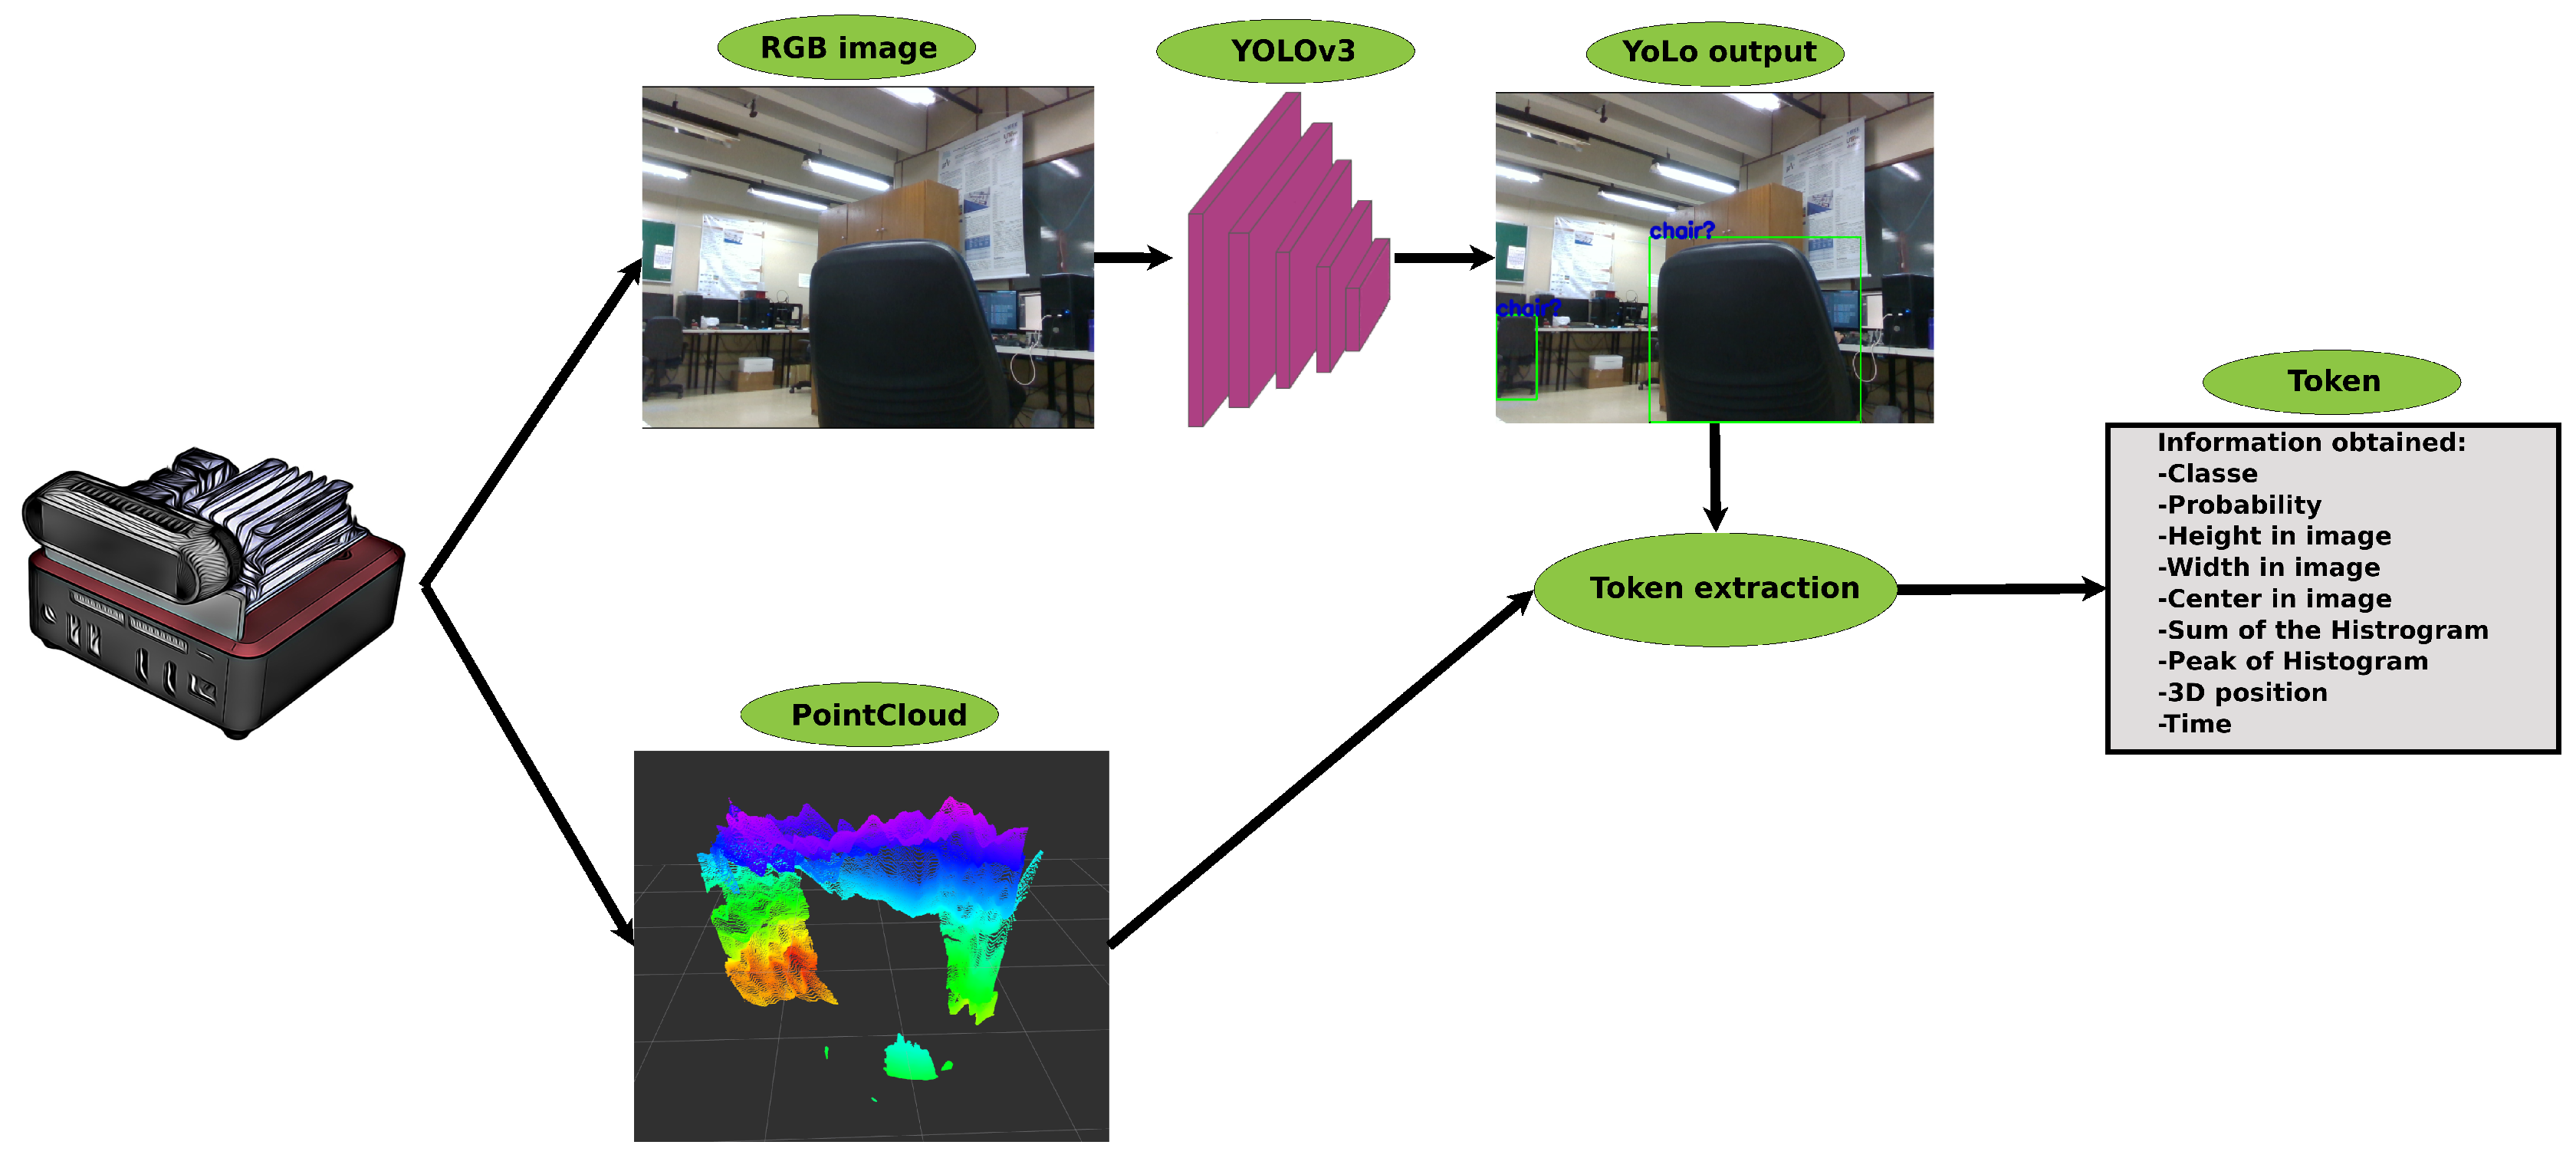
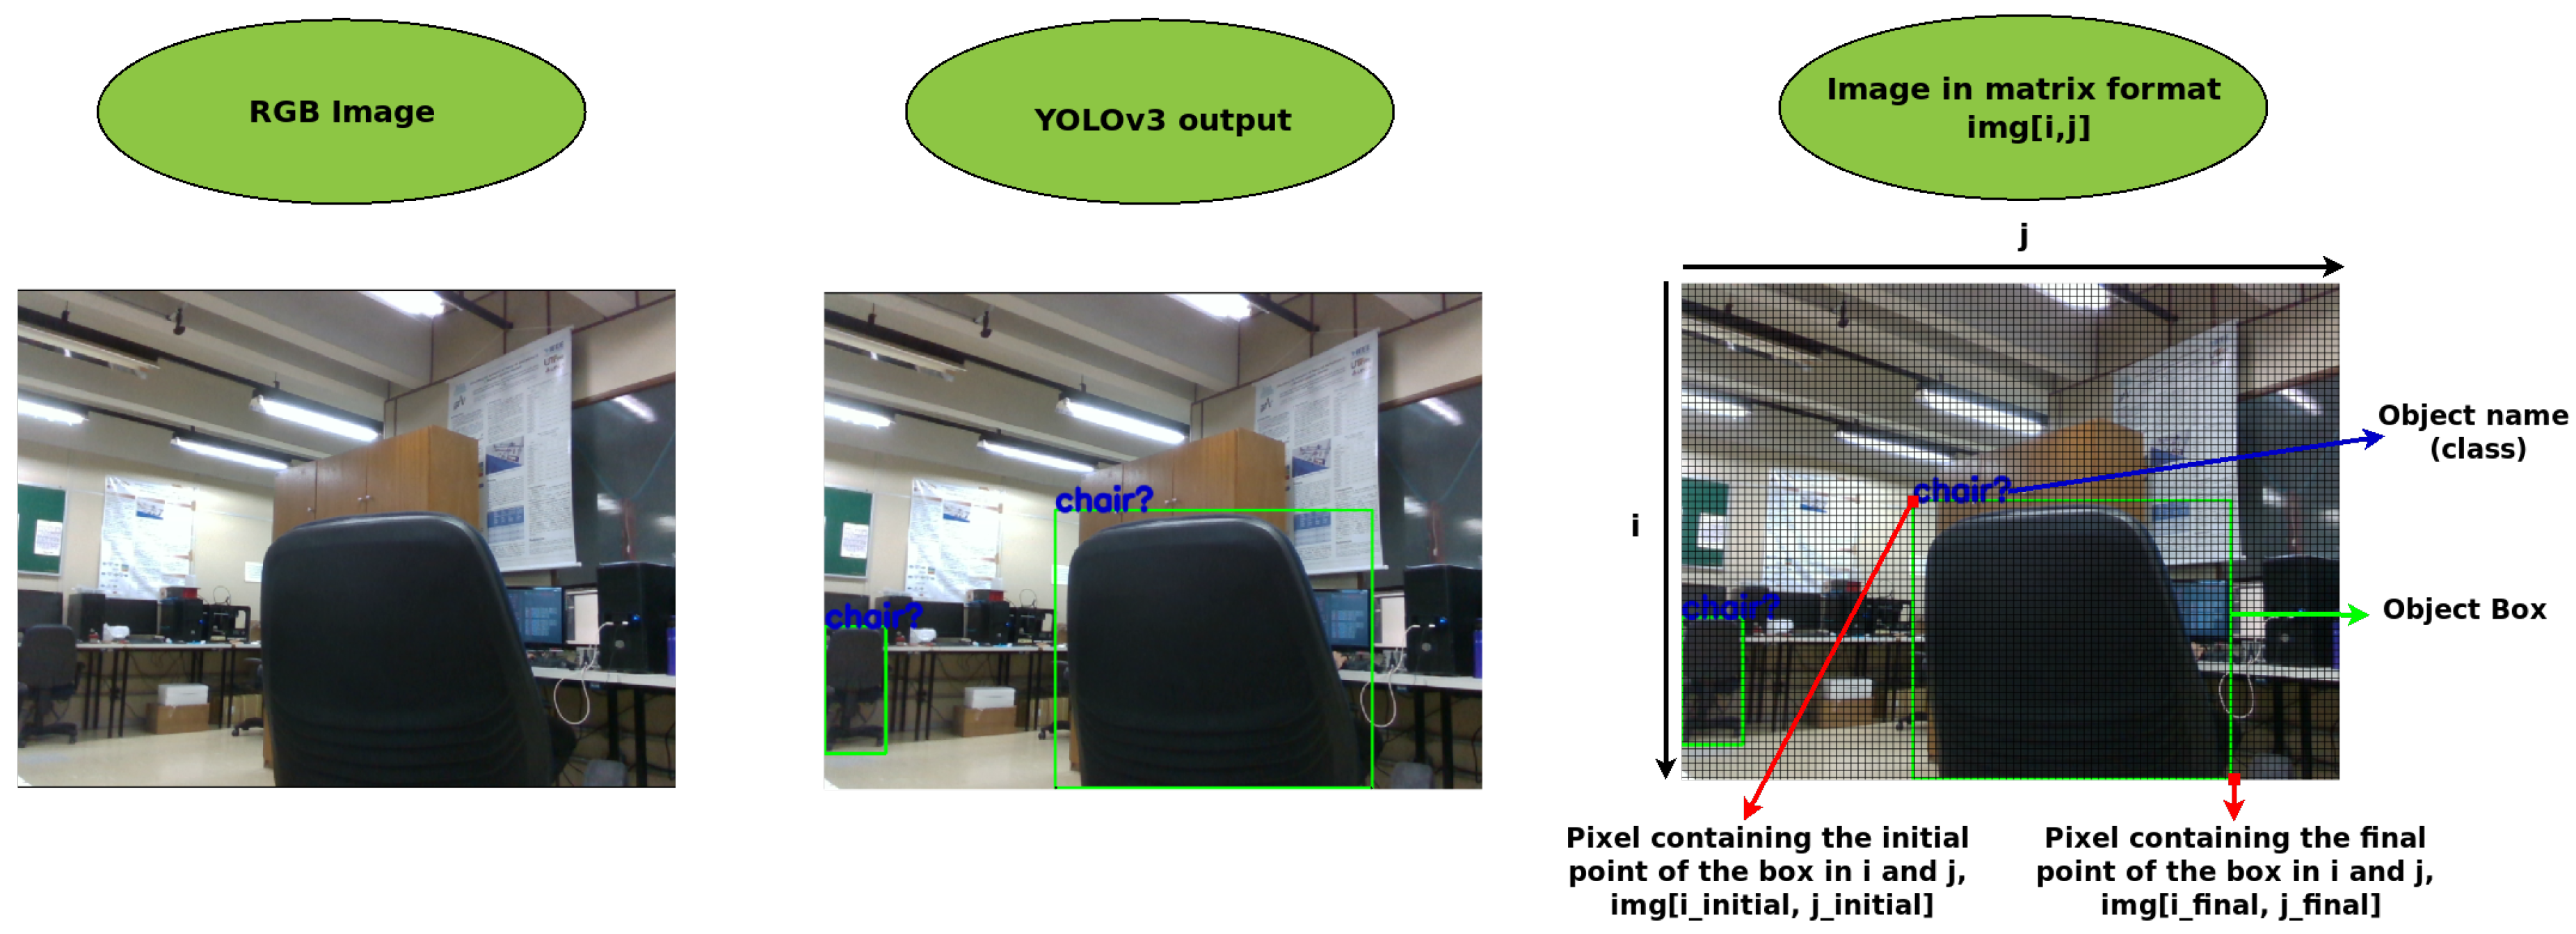
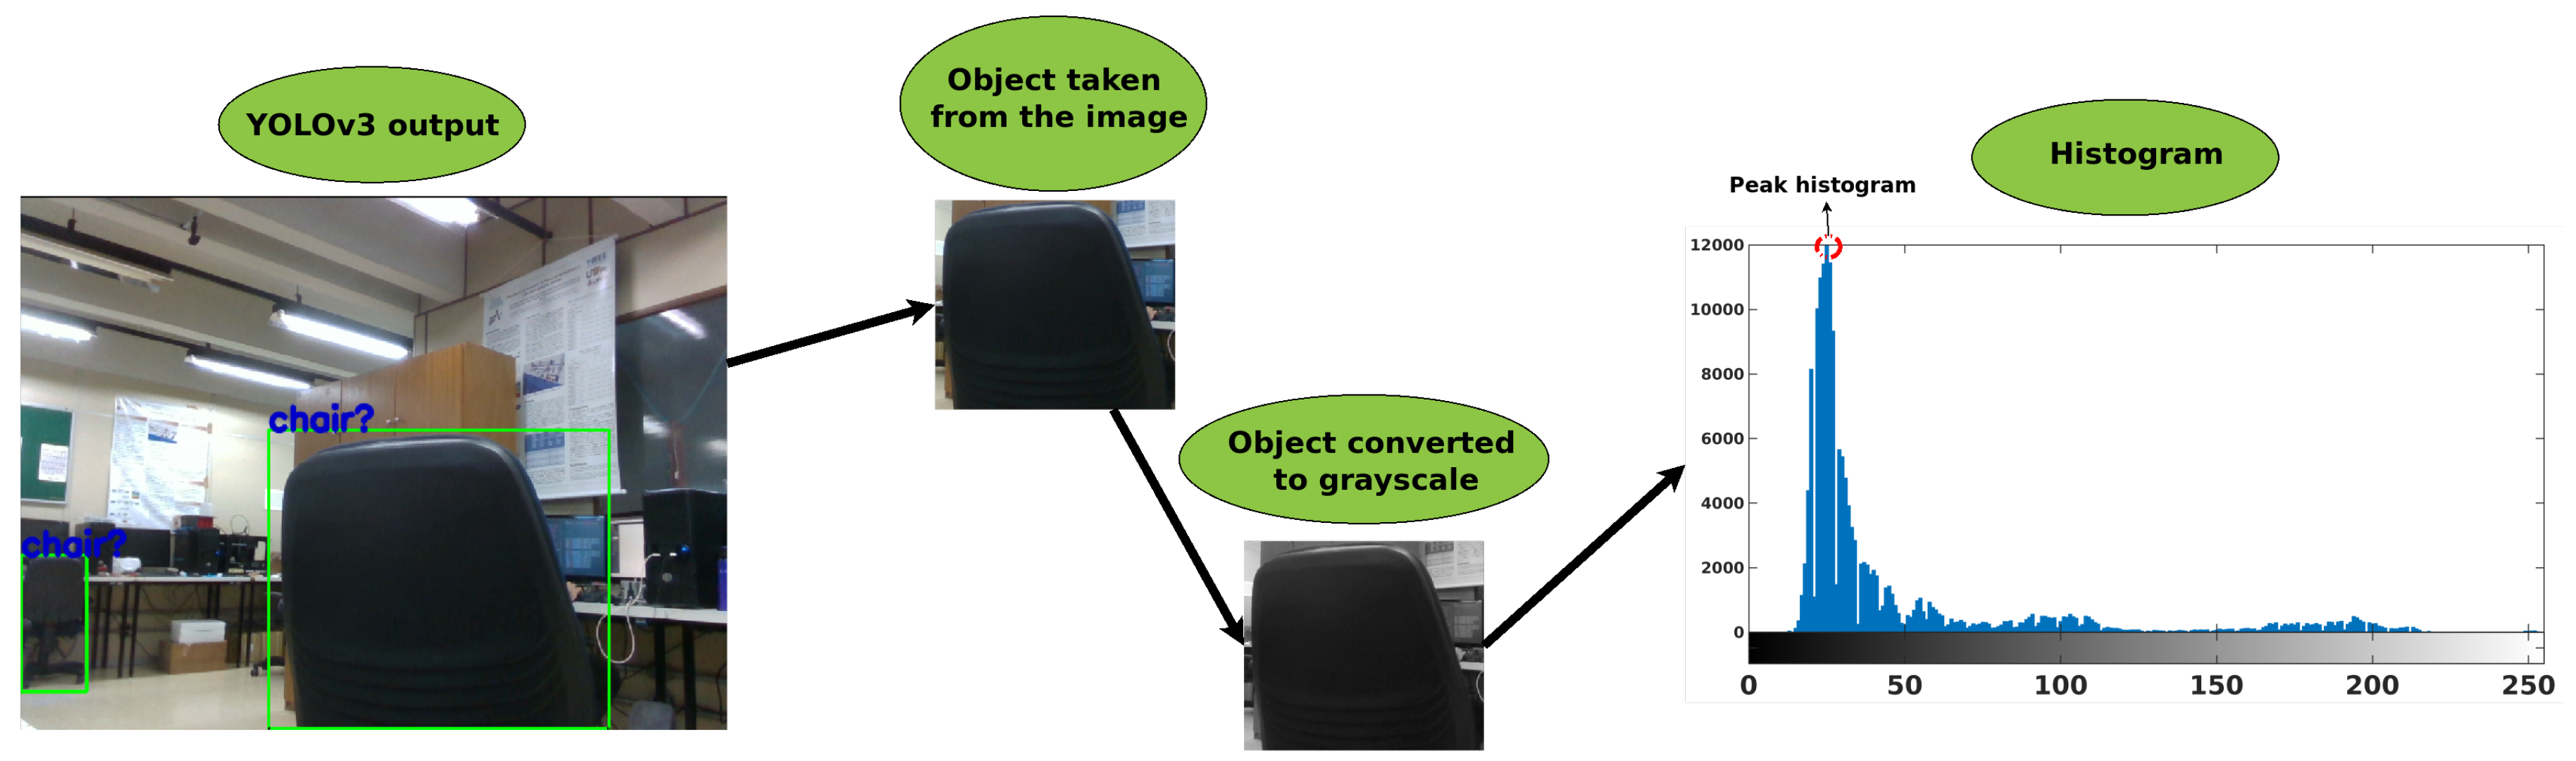
3.1. Lexical Analysis

Lexical analysis is responsible for extracting information from the environment, generating objects (called Tokens) with specific characteristics. Therefore, each Token will contain various pieces of information about a single object. Figure 3 presents a diagram showing the steps of the lexical analysis.
From Figure 3, all extracted information is associated with a Token. Such information are obtained from the RGB sensor (class, probability, center in pixel, width in pixel, height in pixel, sum of the histogram and peak of histogram) and the others come from the Depth sensor, as a spatial position of the object in the sensor frame. YOLOv3 is used for Token identification. For this, YOLOv3 has been trained with the COCO database [36] so that 80 different objects can be identified. The YOLOv3 convolutional neural network (CNN-YOLO) provides the name of the object, class, probability, and a box around the object from which the width and height are obtained. Figure 4 shows an example of data provided by the network from an image, and the strategy used to calculate height and width information.
The class of Tokens are obtained as the output of CNN-YOLO without any pre-processing step. The other data need some processing for their extraction. In the lexical analysis, the objective is only to extract the relevant data; all relevant information will be obtained from this data in the next syntax analysis step. Therefore, Token extraction must be carried out with as little computational effort as possible.
From an object image, a subtraction is made between the i _ f i n a l minus the i _ i n i t i a l pixels, as shown in Equation (1), in order to obtain the object’s height information in pixel. The same procedure, using j (Equation (2)), is used to get the width. In order to obtain the central pixel of the object in the image, c e n t e r _ i m g [ x , y ] , Equation (3) can be used. It is worth mentioning that the obtained position refers to the object in the image, not its actual location in the world, which will be obtained later. Therefore, some characteristics referring to the object and its position in the RGB image can be evaluated, for instance, height, width, and center:
h e i g h t _ i m g = i _ f i n a l i _ i n i t i a l ,
w i d t h _ i m g = j _ f i n a l j _ i n i t i a l ,
c e n t e r _ i m g = [ ( i _ i n i t i a l + ( h e i g h t / 2 ) , j _ i n i t i a l + ( w i d t h / 2 ) ] .
The predominant gray tone from an image can be captured by a histogram [42,43]. Thus, such histogram is added as an object information and its peak is saved into the Token. This information may be interesting to identify if the object is light or dark, for example. Other information taken from the histogram is the sum of all values. This information can be used to identify the same object at different time states. Only the object being observed is cut out of the image to obtain the histogram for each element. After cutting the object, the image is converted to grayscale, and then its histogram is generated. Figure 5 gives an example, where the complete image is presented, the cut object is highlighted, and its histogram identified peak is computed.
The 3D depth sensor associates each pixel of the image ( i m g [ i , j ] ) with a 3D point ( p c [ x , y , z ] ) of its point cloud. It is thus possible to identify the actual position of the object in the world, from the position of the object in the image. The proposed strategy consists of averaging the points relative to the object, resulting in an estimate of its position. However, the 3D sensor does not always provide the distance of all pixels; when, for different reasons, such information can not be read, the corresponding data position i m g [ i , j ] are p c [ N a N , N a N , N a N ] or some other invalid value. The method to avoid obtaining erroneous values consists of averaging the pixels that are in the box of the object, ignoring the values that are not valid. A second error can also happen when the box is larger than the object, generating 3D points that do not correspond to the object in question. This error is avoided with the use of only 60% of the box for averaging, ignoring the borders. The calculation of the new box consists of adding to the center of the object ( c e n t e r _ i m g ) 30% for more and for less of the height ( h e i g h t _ i m g ) for the values of i, and 30% for more and for less of the width ( w i d t h _ i m g ) for the values of j.
Algorithm 1 presents the proposed strategy for identifying the object’s 3D position, where the inputs are the point cloud provided by the depth sensor, with a resolution of 640 × 640, and each position contains a 3D point [X, Y, Z], named p c [ 640 , 480 , 3 ] . The second entry consists of the center of the object in the image ( c e n t e r _ i m g [ i , j ] ). The third and fourth entries, respectively, are the object’s height and width, in pixels, provided by the image, called h e i g h t _ i m g and w i d t h _ i m g . The computation is made by averaging in X, Y, and Z of the points in the center of the object’s box, reduced 40%. The output of the algorithm, a single 3D position [ X , Y , Z ] , is found containing the position of the object considered by the proposed strategy, named p _ c e n t e r [ x , y , z ] .
This strategy is applied to all objects identified in the image, extracting the Tokens for all objects identified by YOLOv3. To review, Tokens are object name (class), obtained by YOLOv3; height of the object in the image ( h e i g h t _ i m g ) is obtained by Equation (1), width of the object in the image ( w e i d t h _ i m g ) is obtained by Equation (2), central pixel of the object in the image ( c e n t e r _ i m g ) is obtained by Equation (3), sum of histogram ( s u m _ h i s t o g r a m ) and histogram peak ( p e a k _ h i s t o g r a m ) are as seen in Figure 5 and real position of the 3D object ( p _ c e n t e r ) is obtained by Algorithm (3). The next steps convert the Tokens into smart information.
Algorithm 1: Identification of the object’s 3D center.
Sensors 19 03764 i001

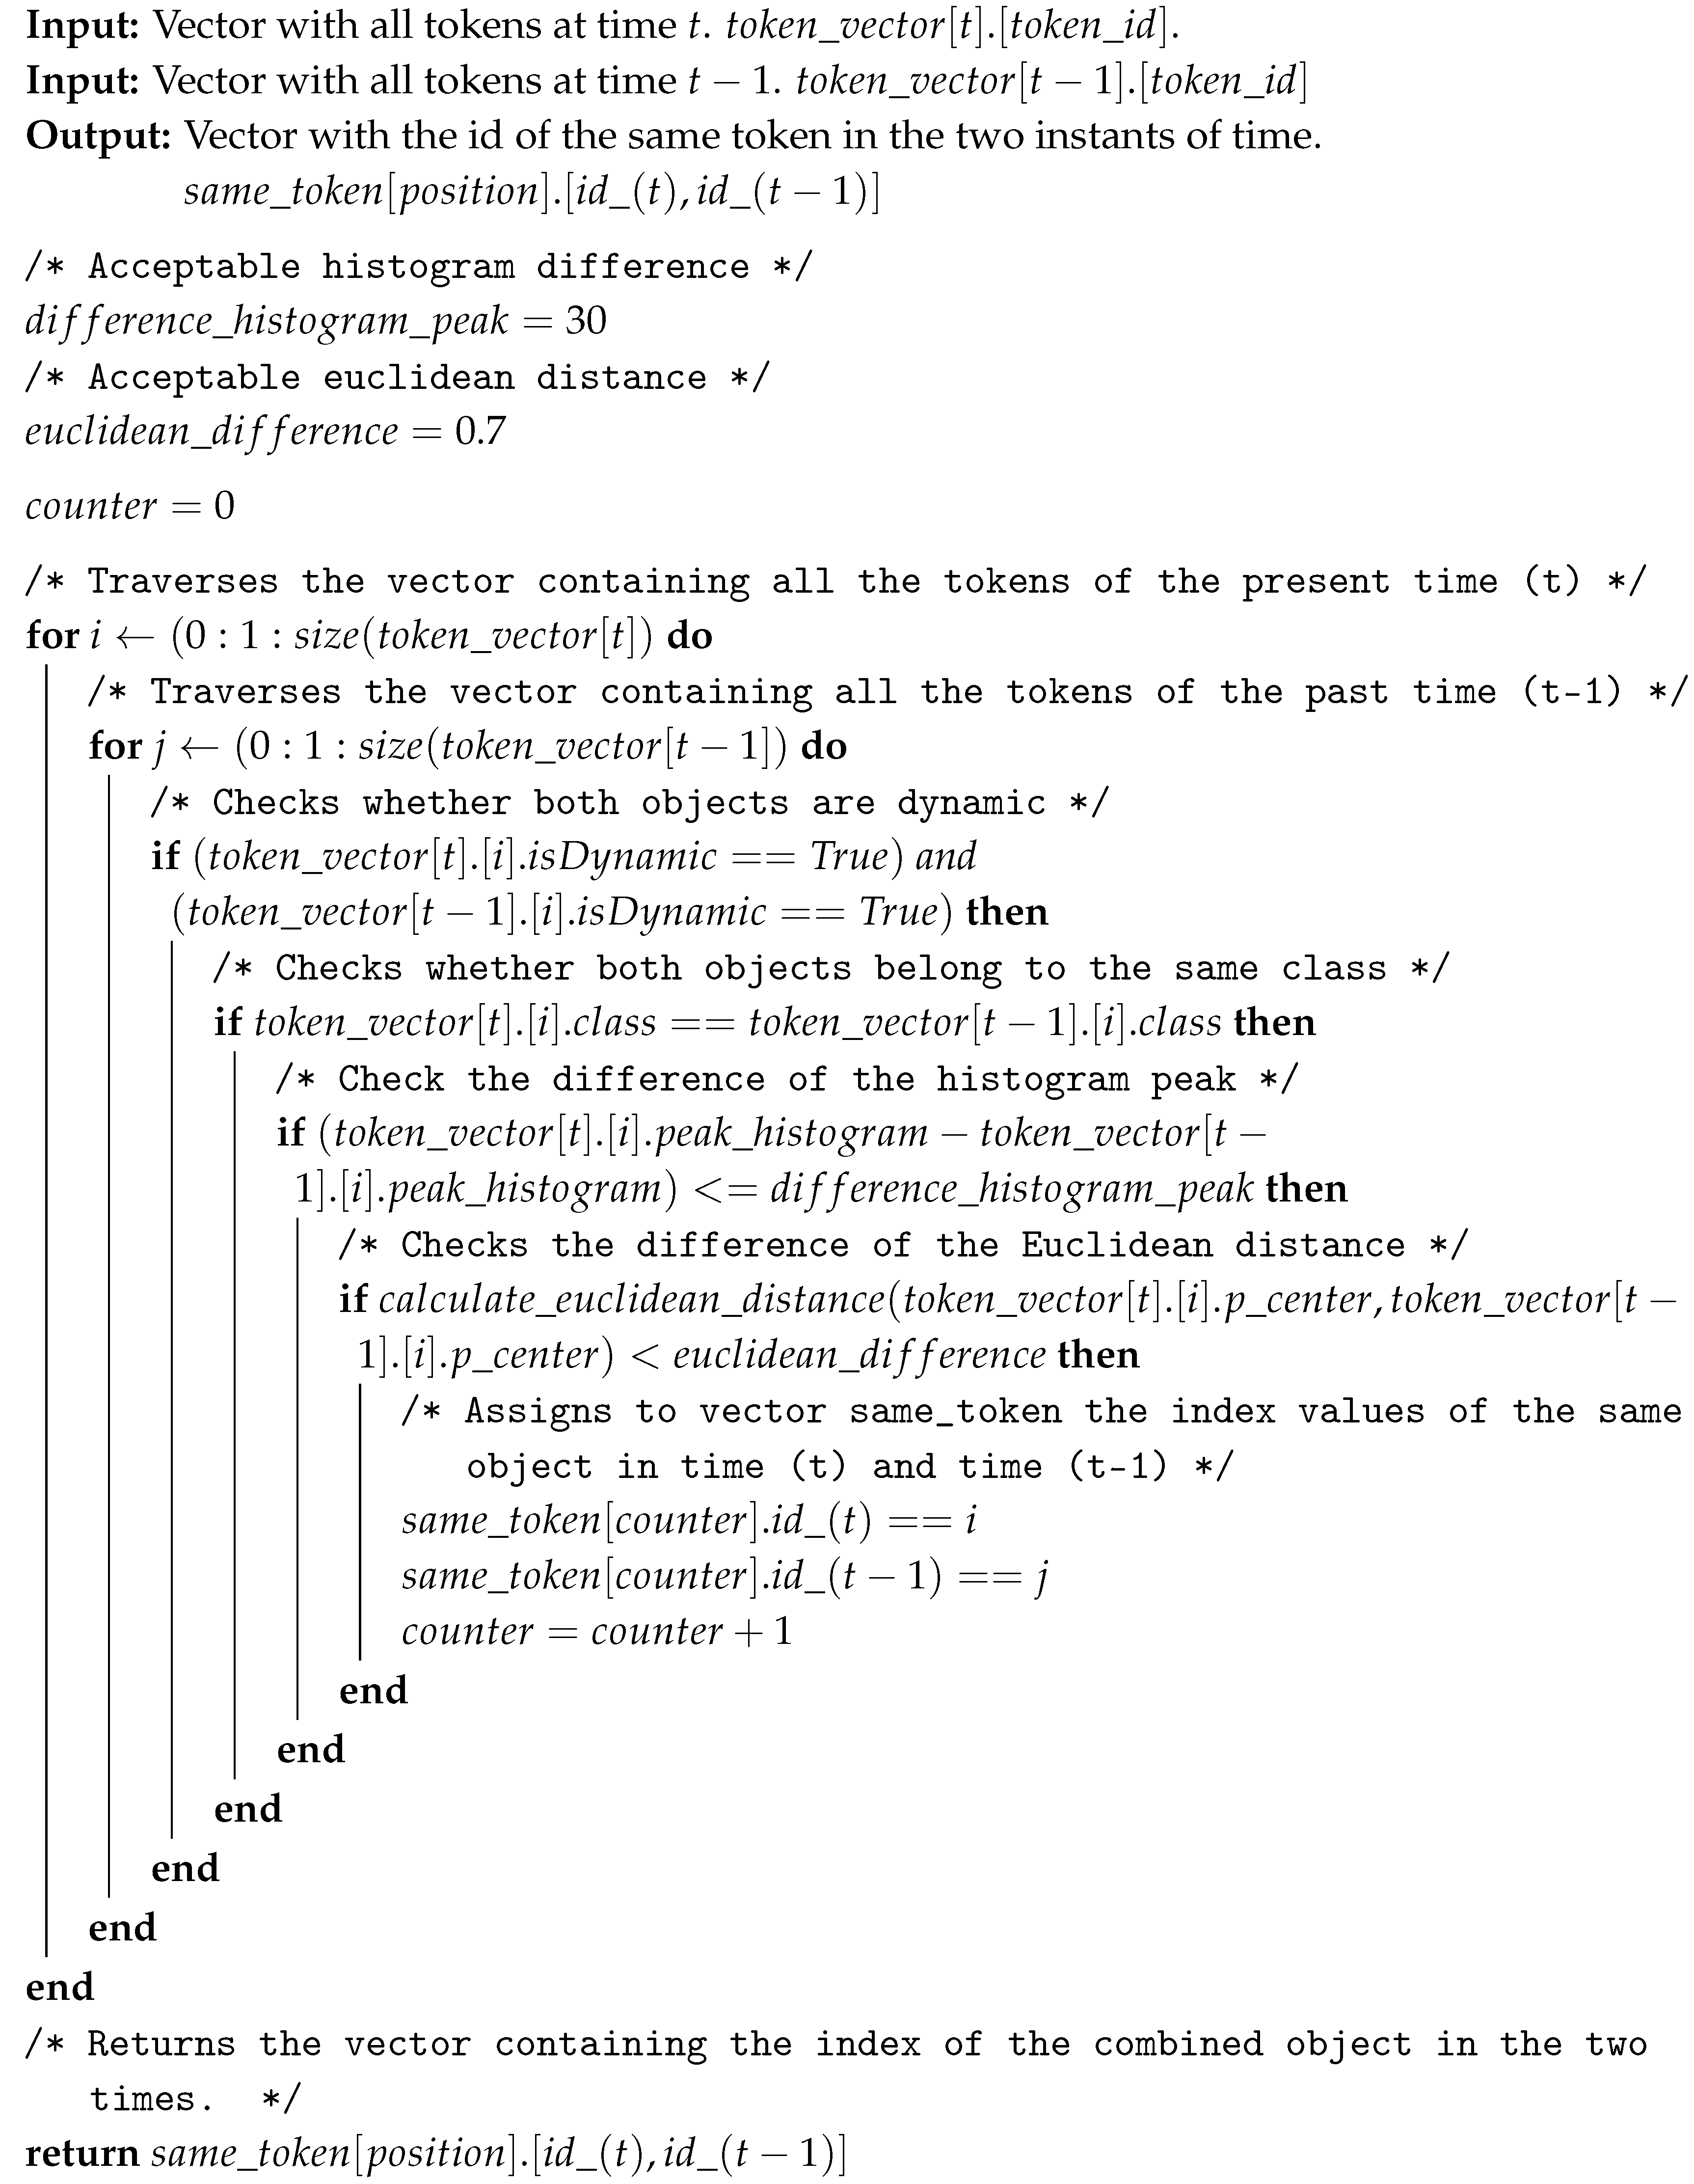
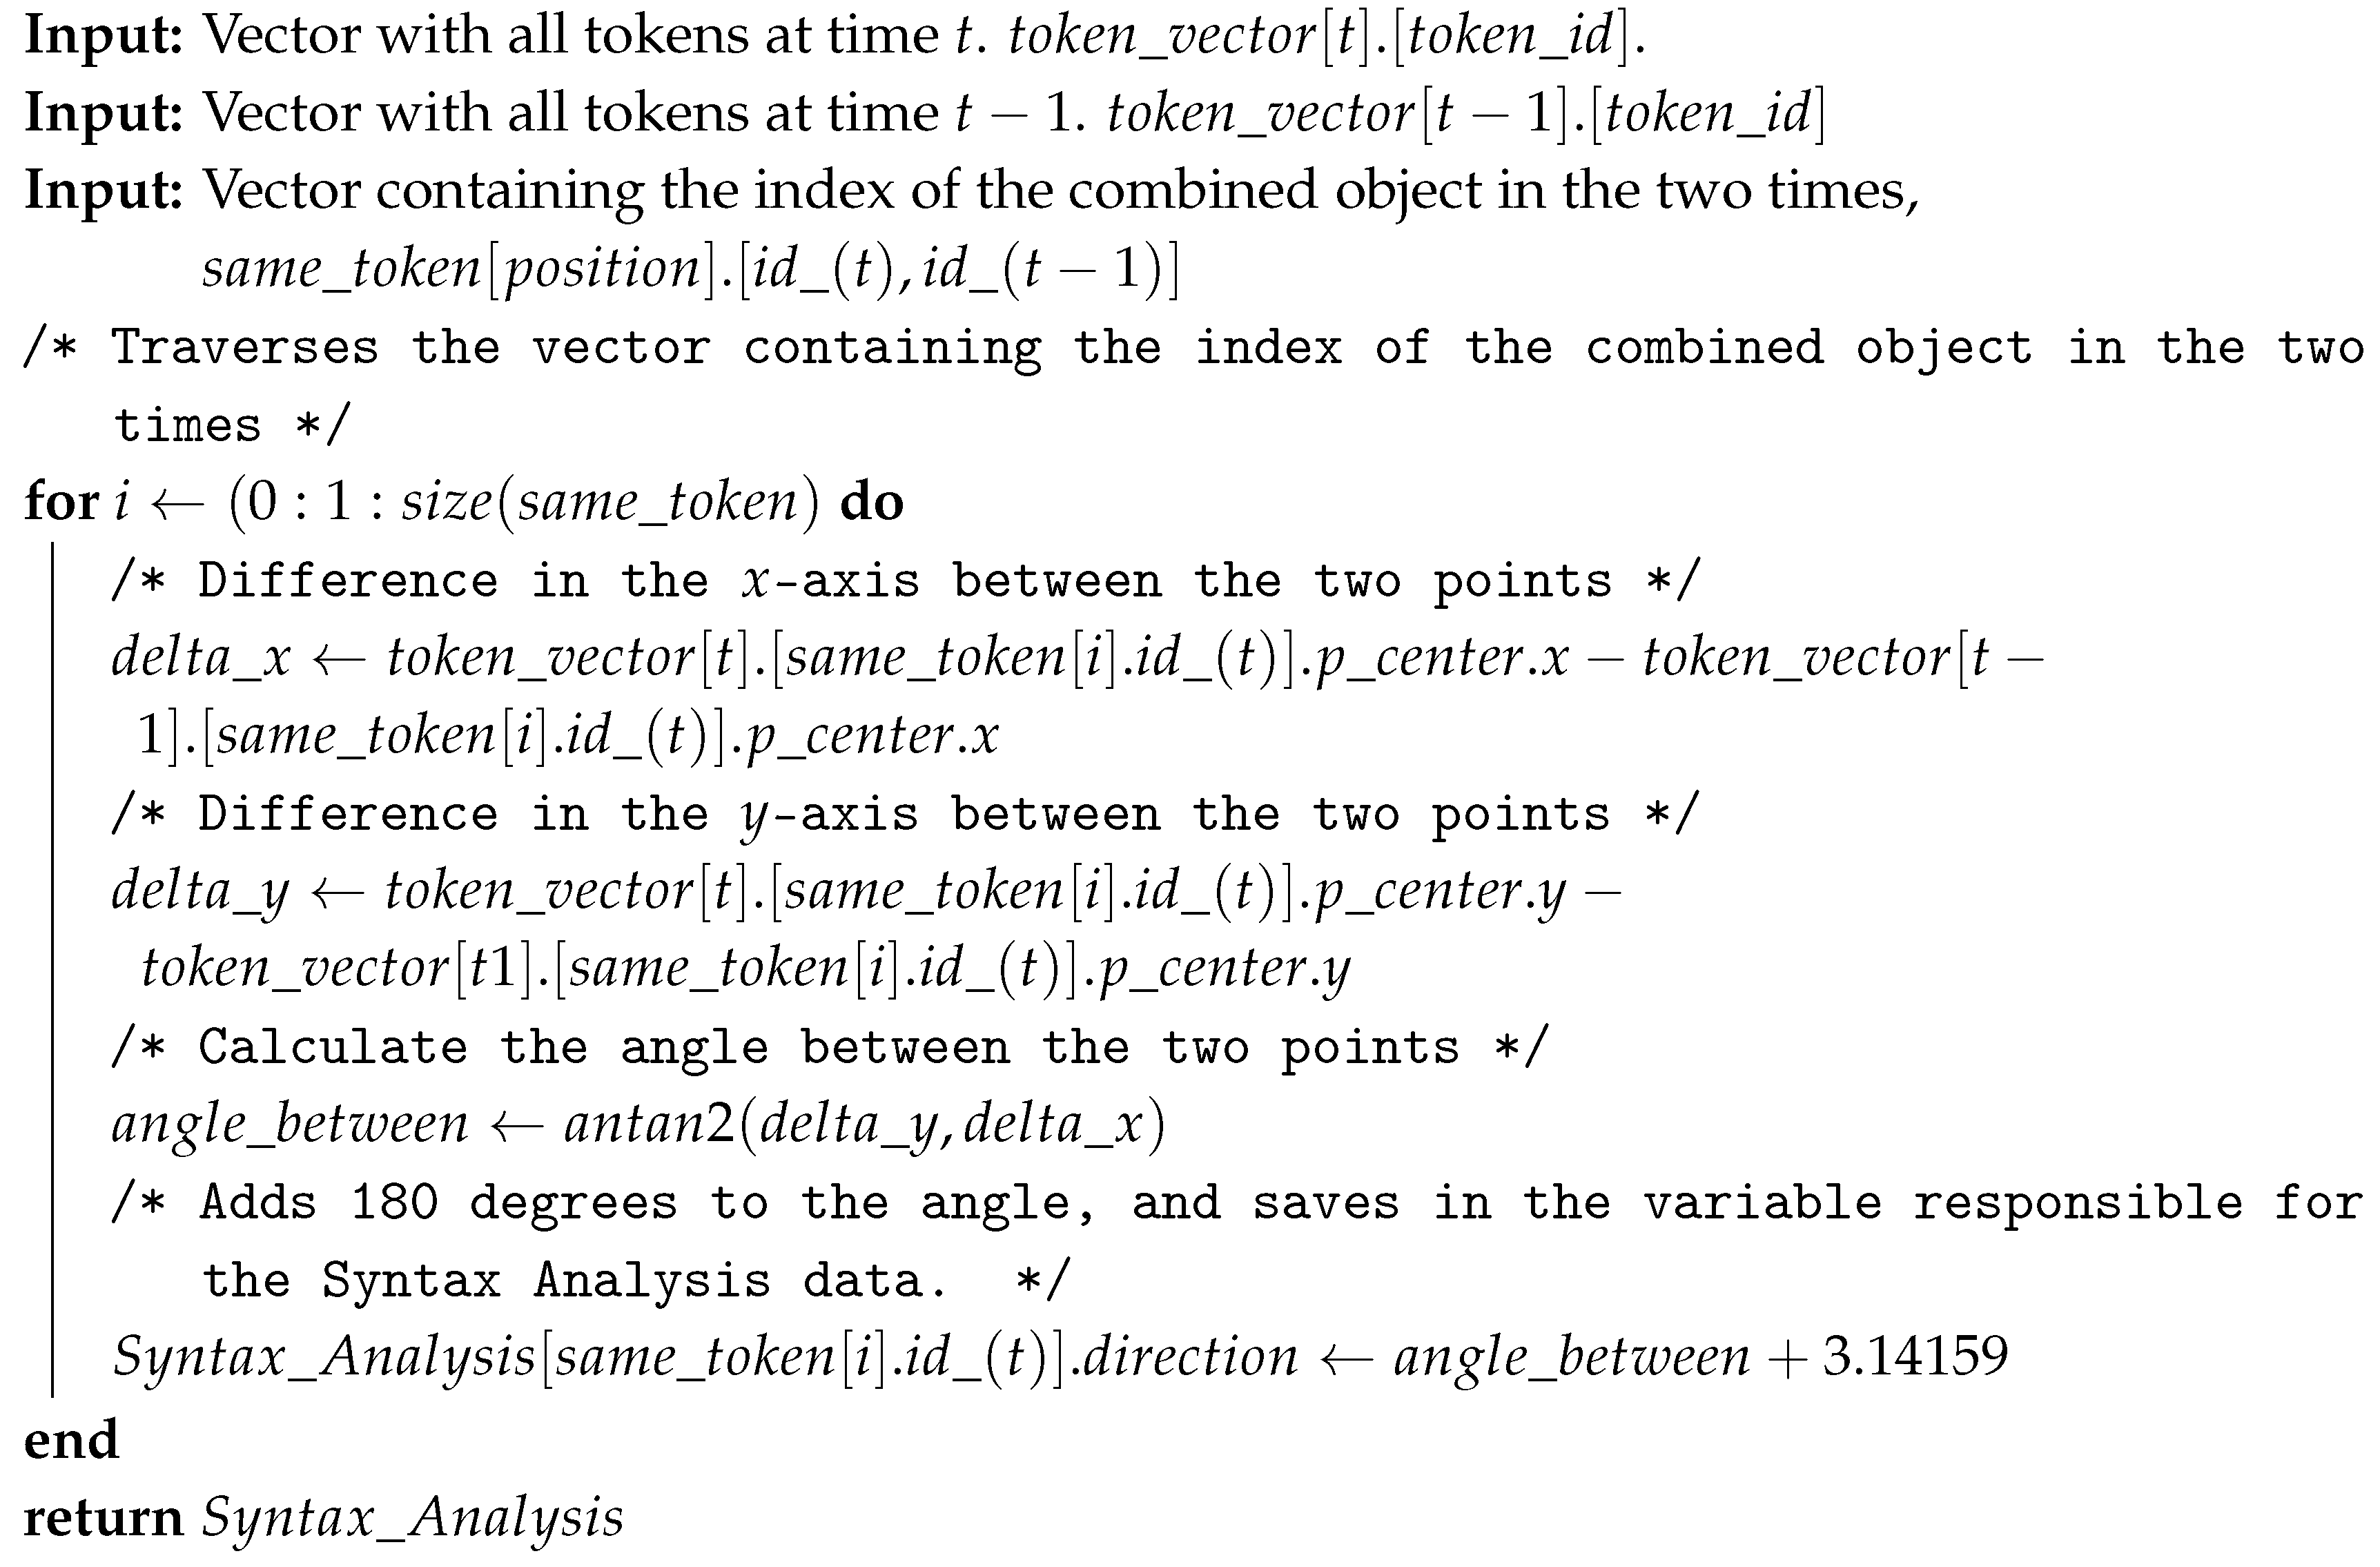
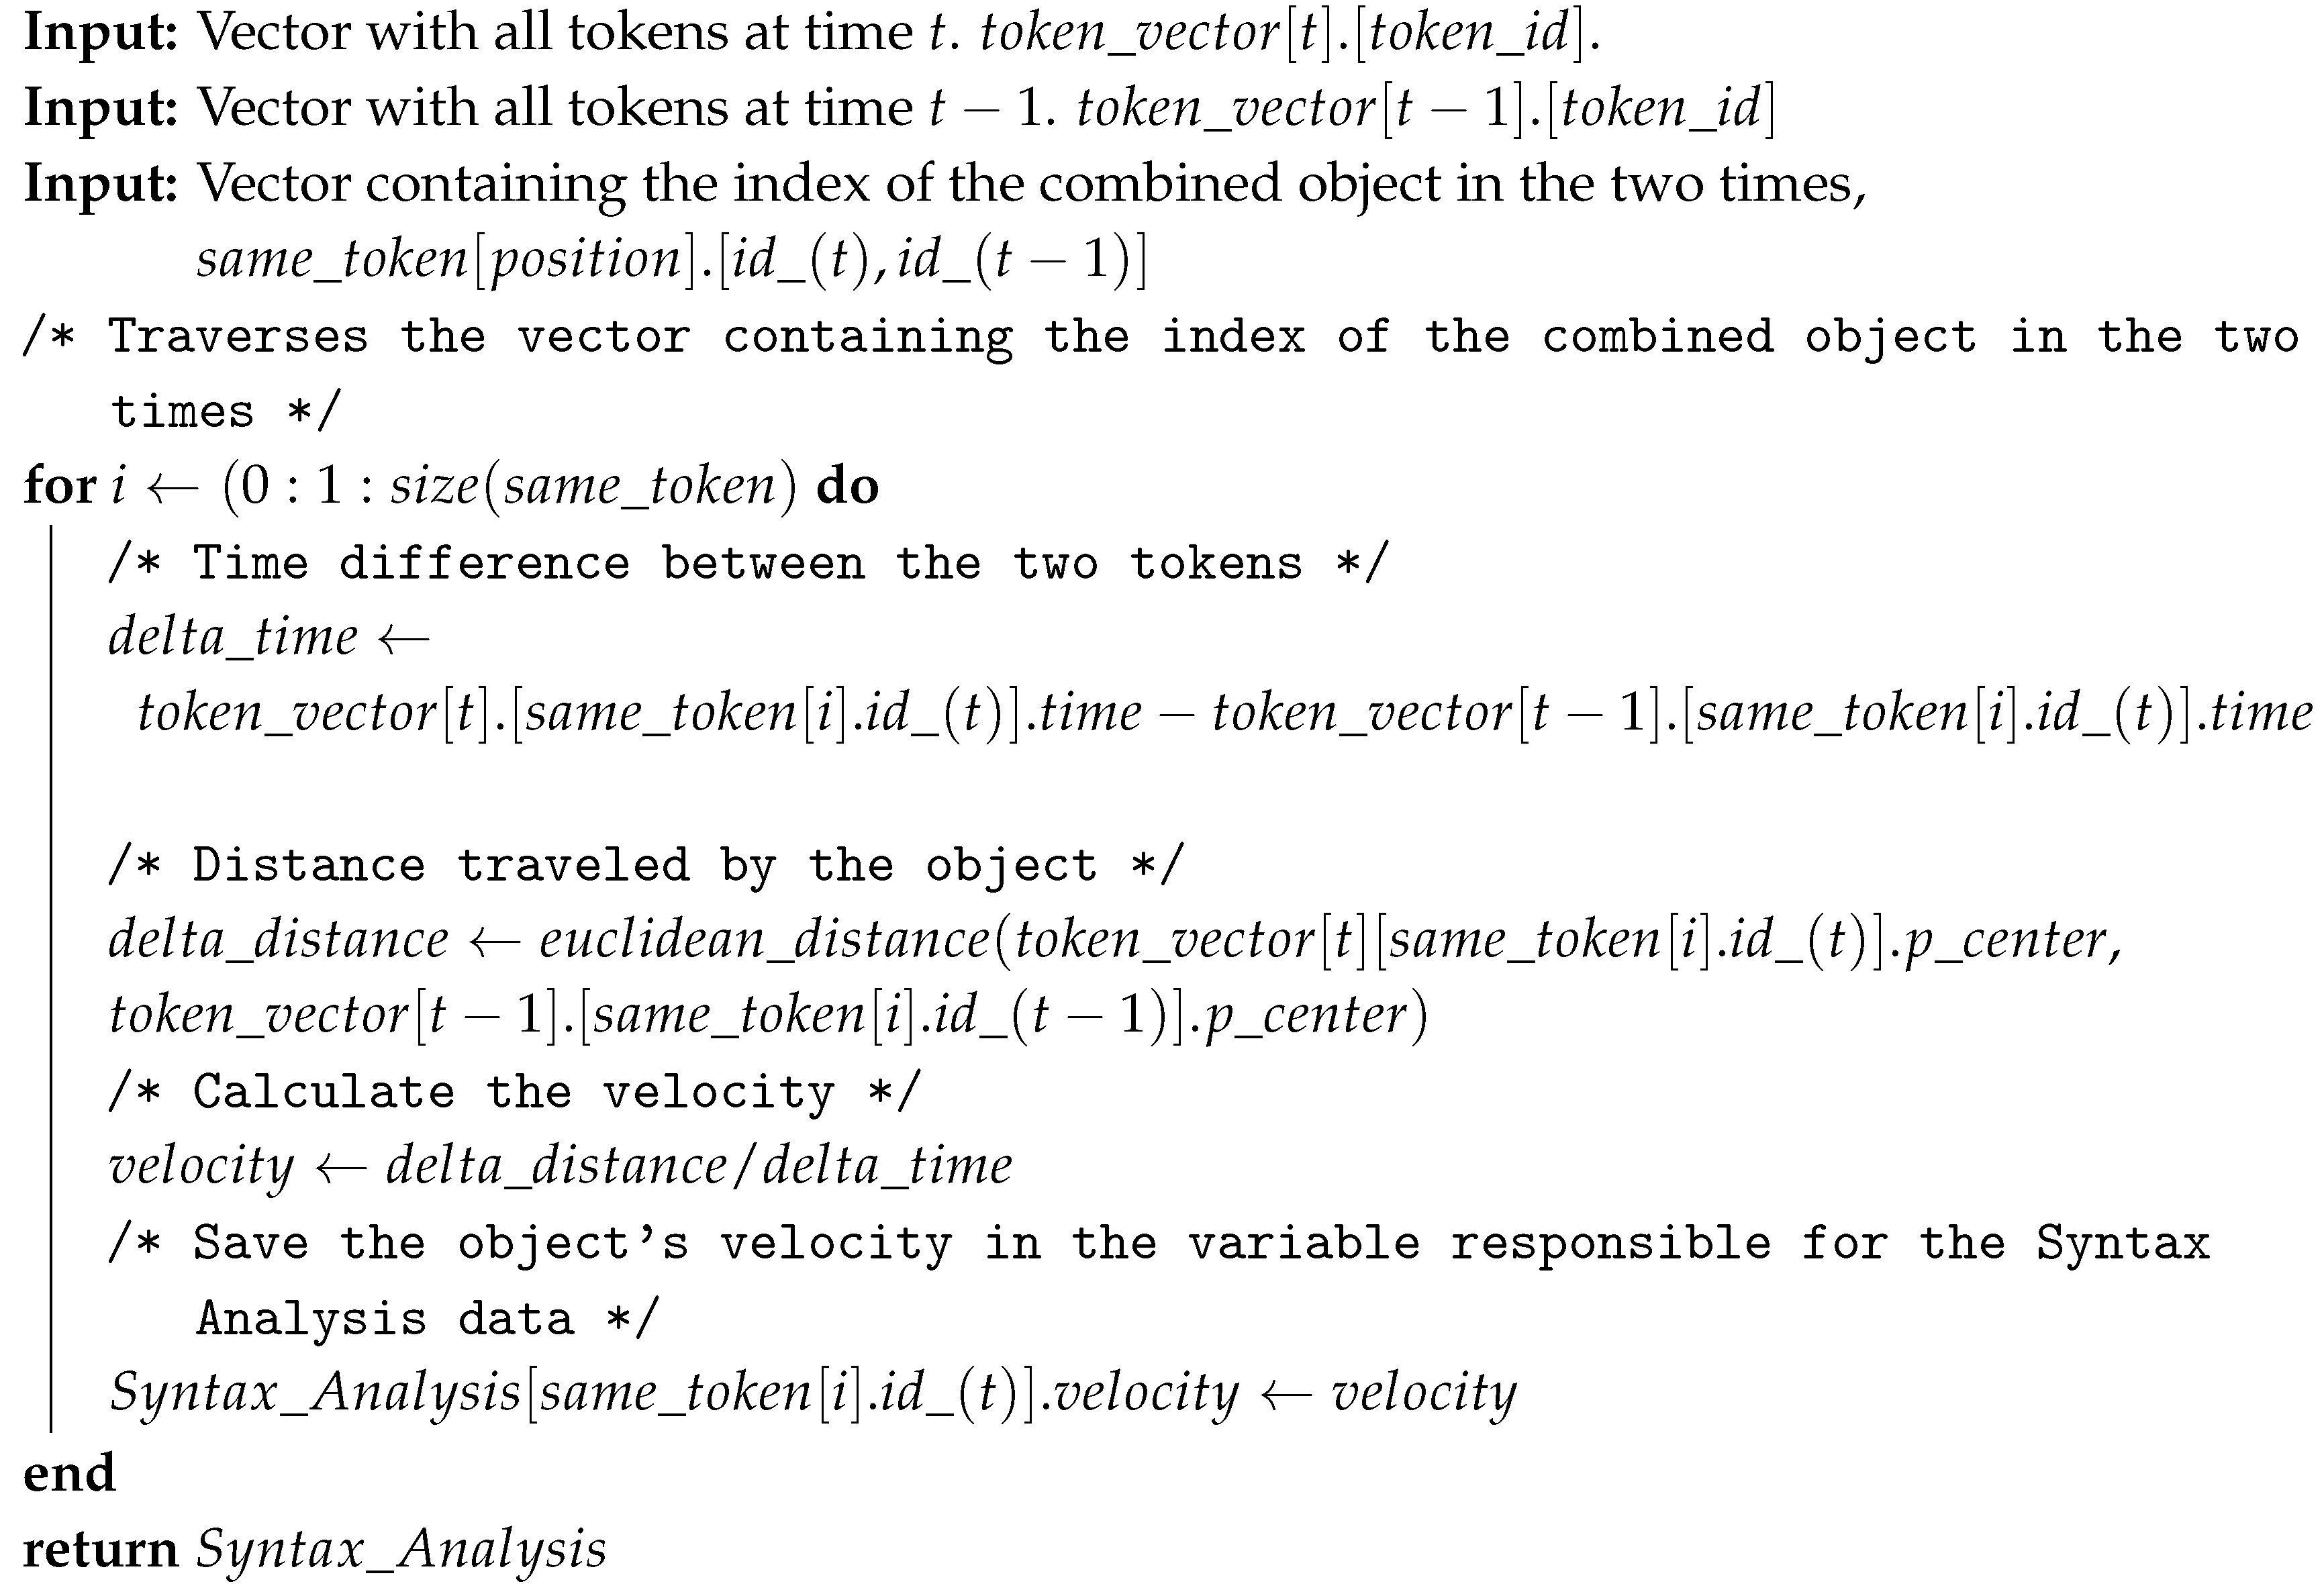
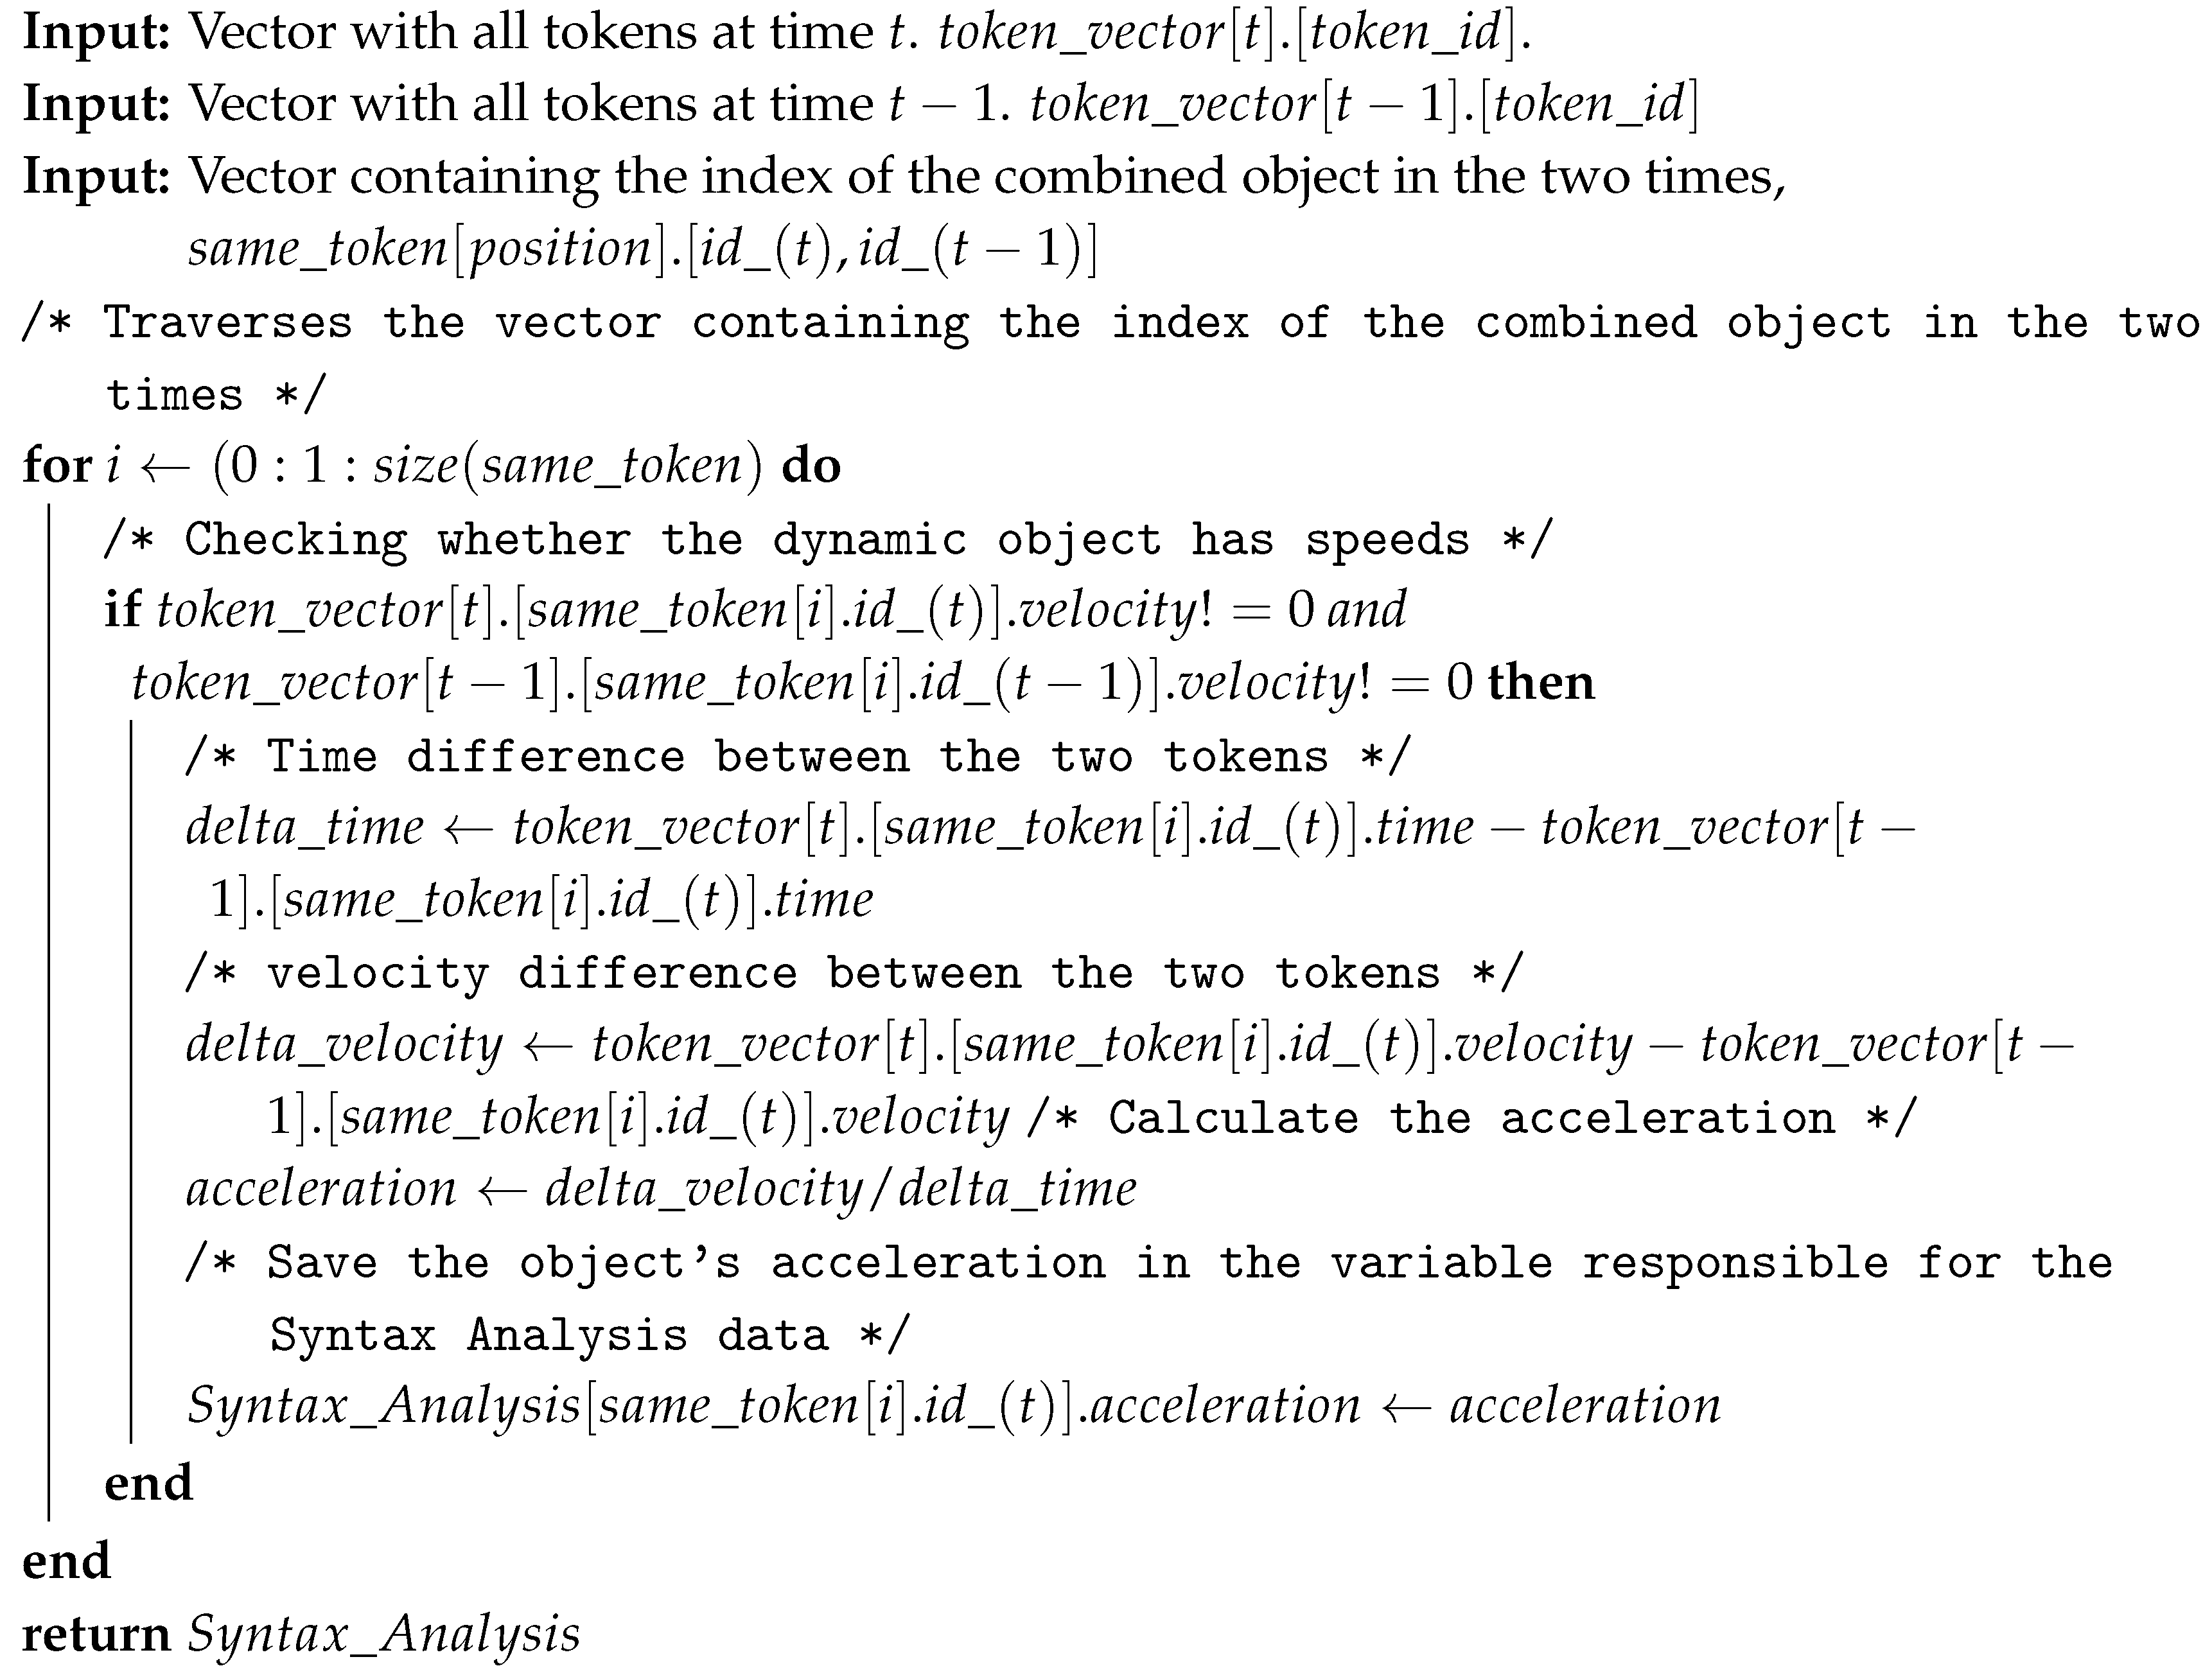
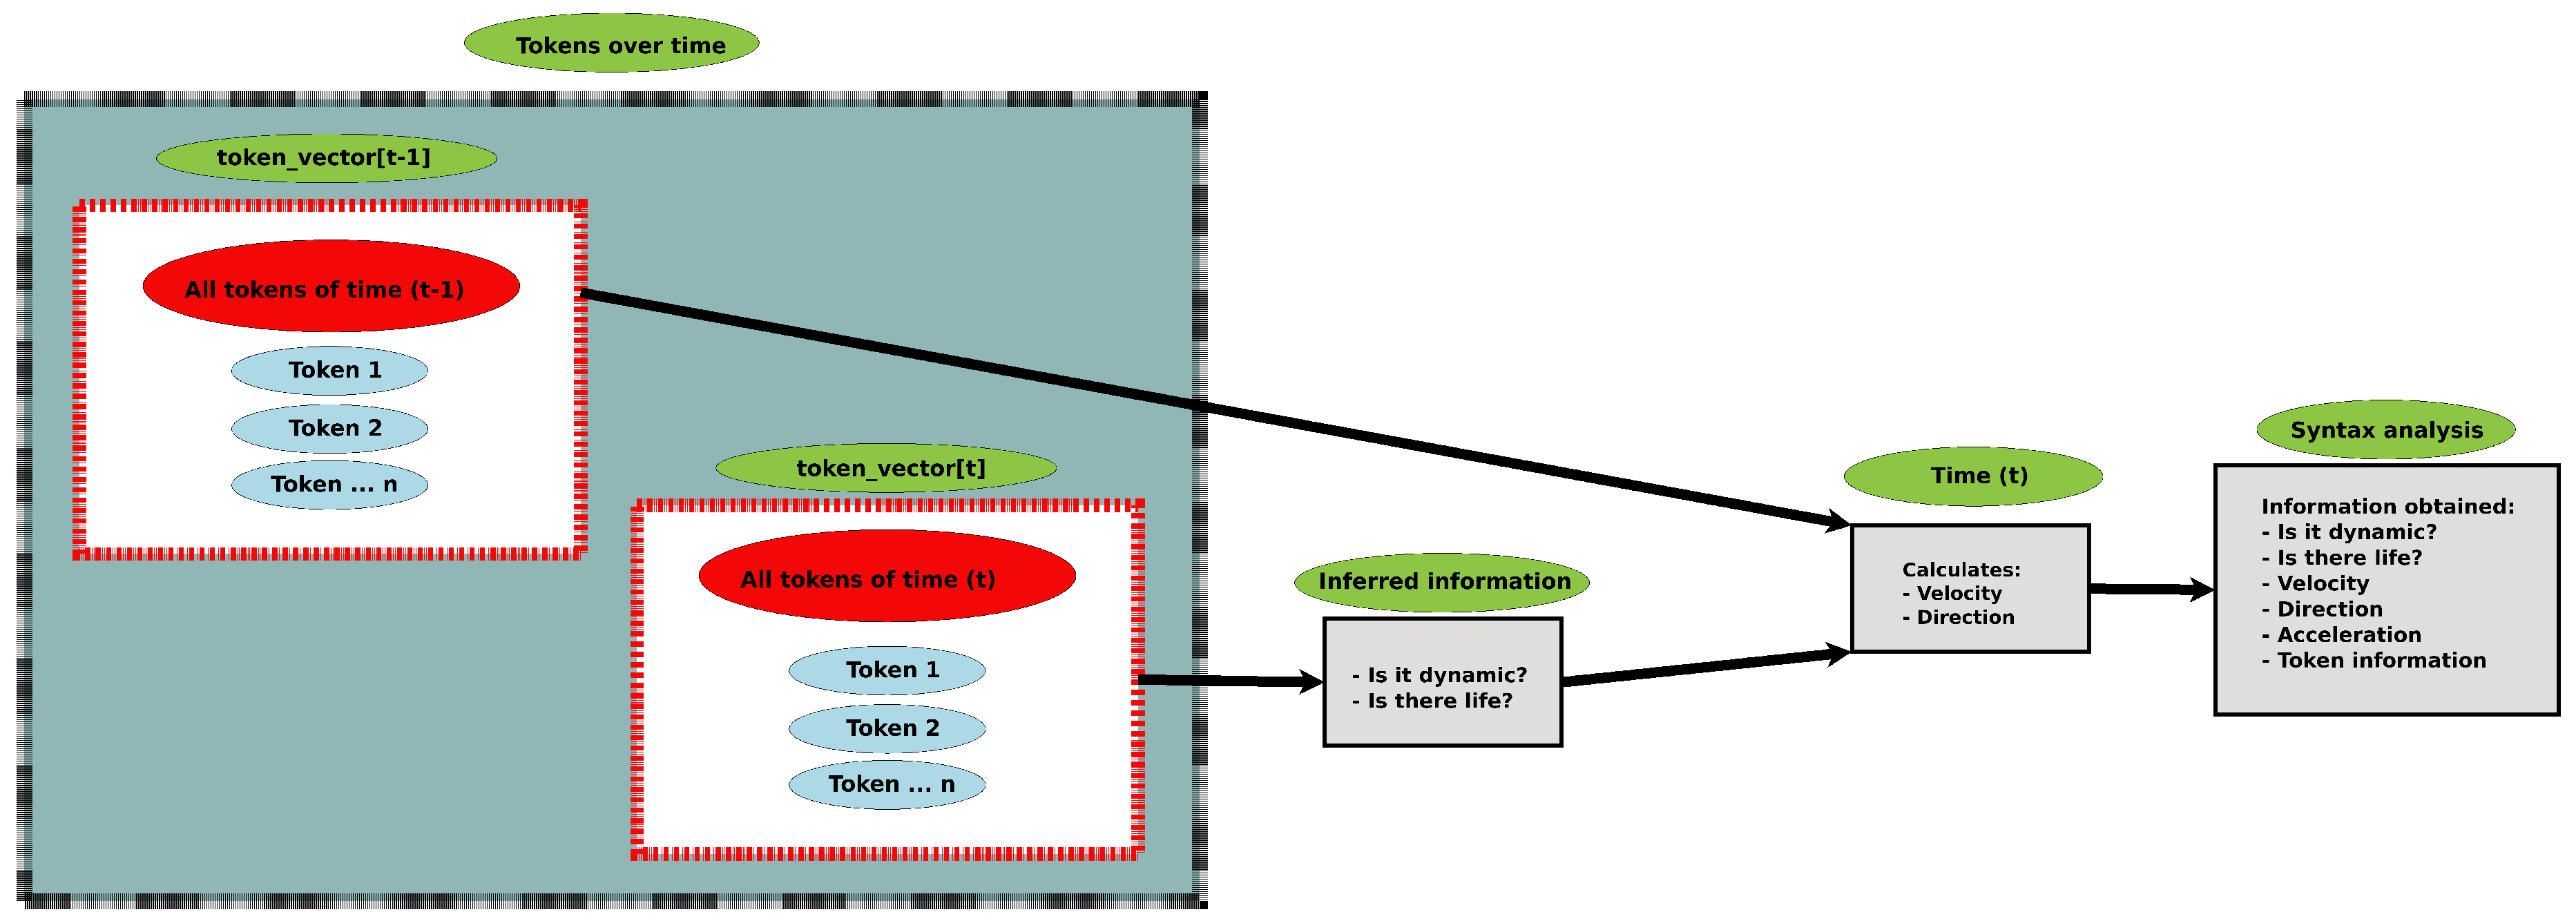
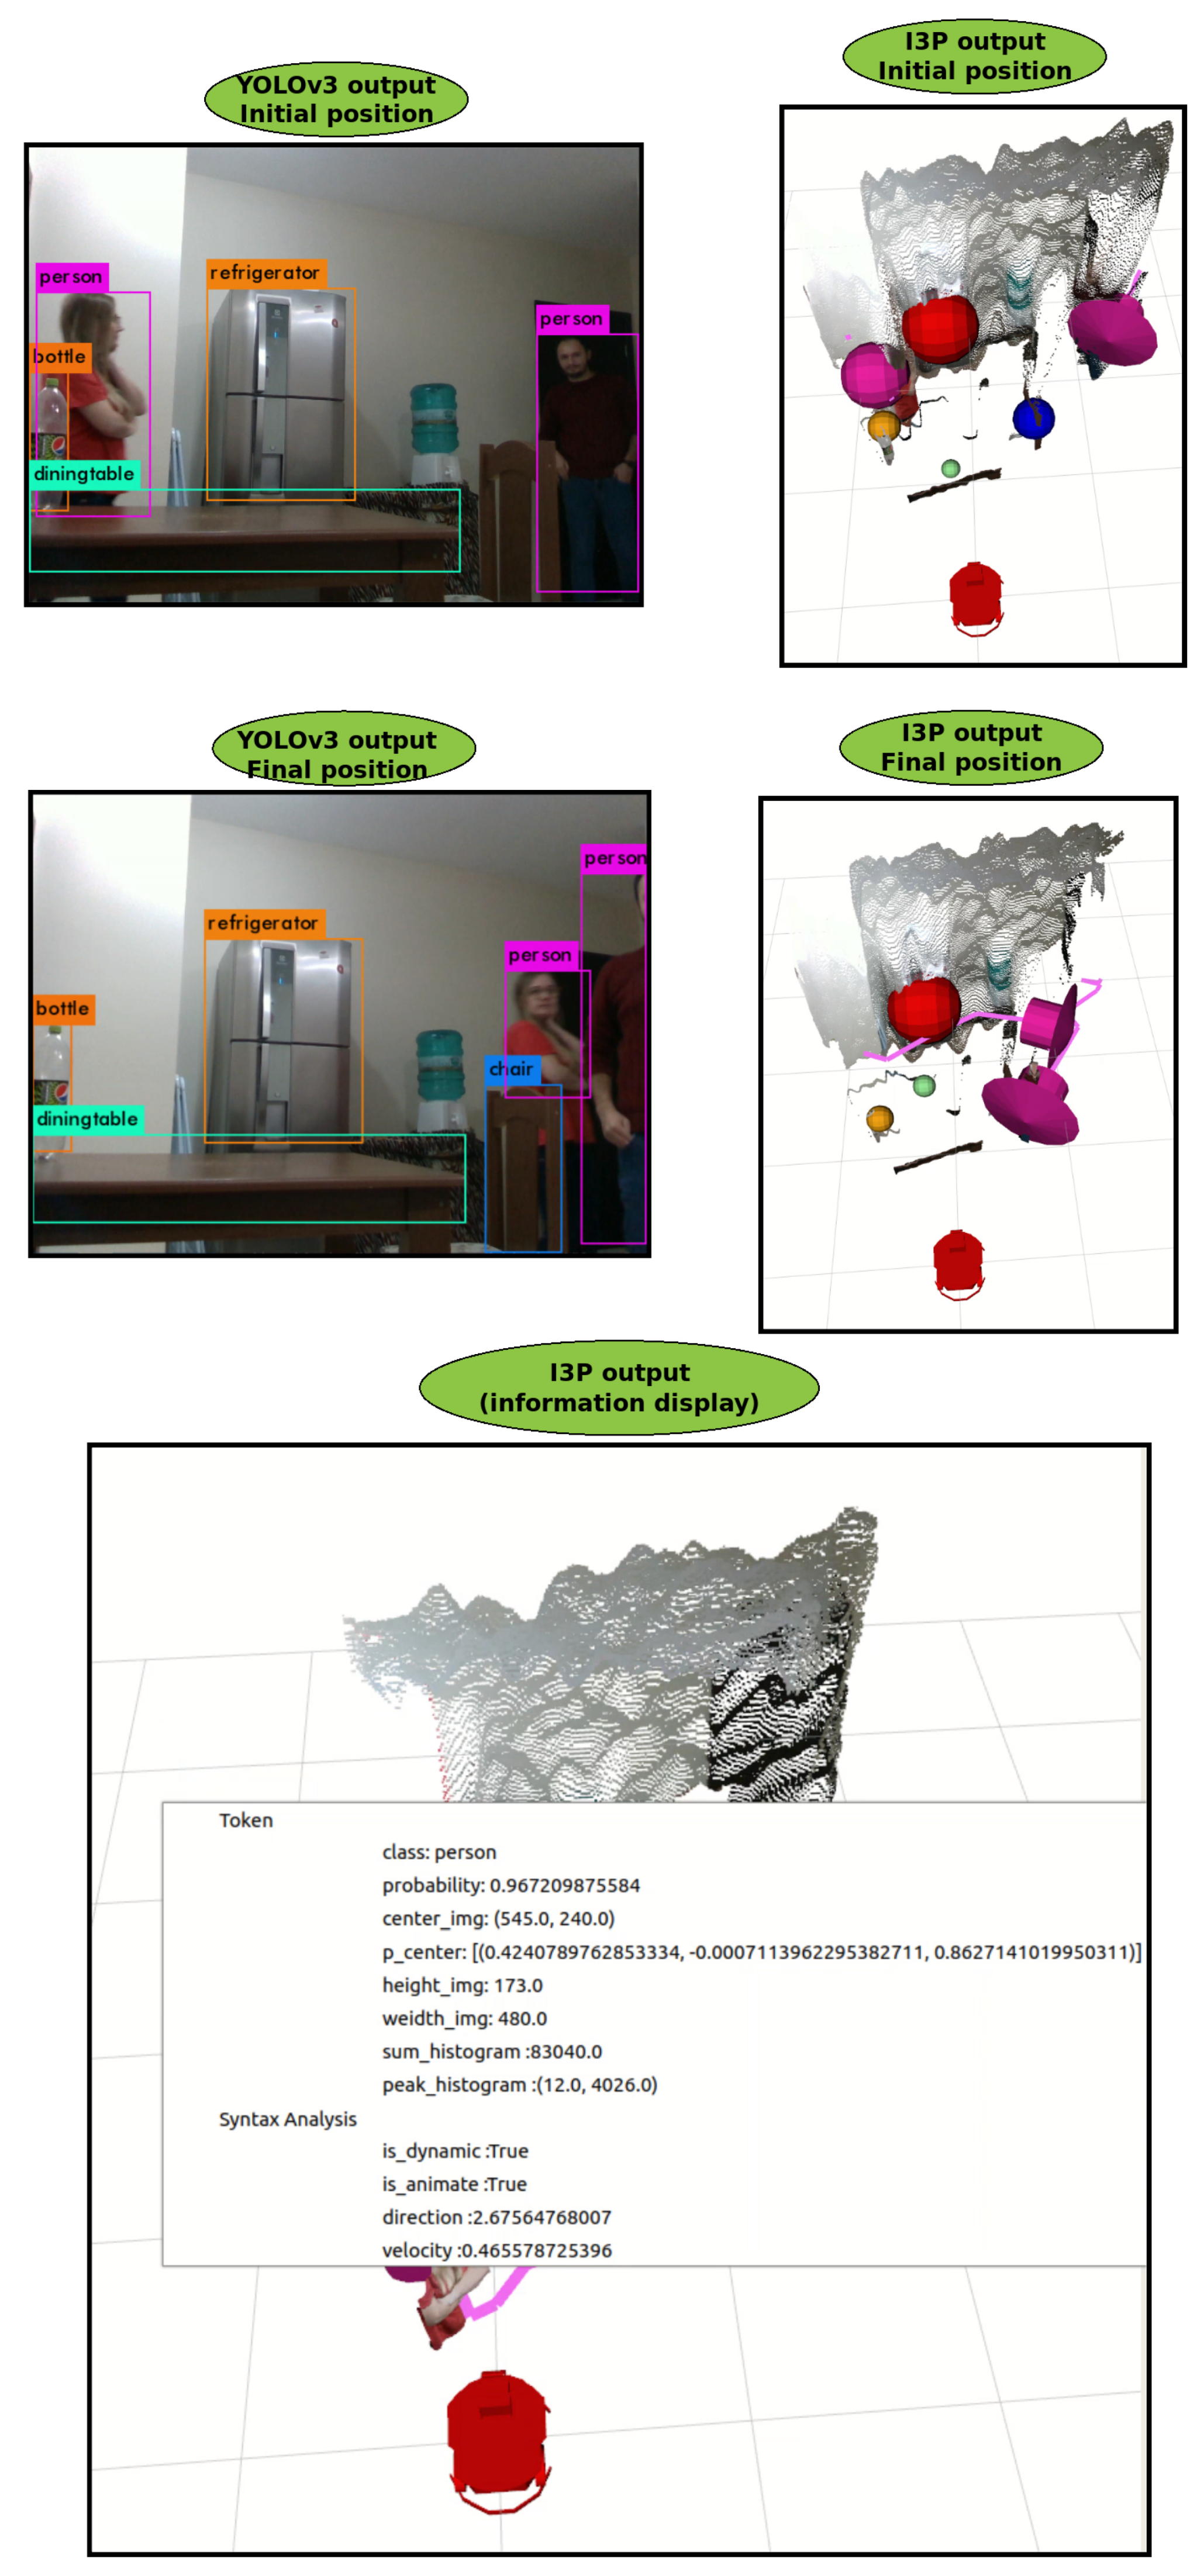
3.2. Syntax Analysis

Syntax analysis aims to convert information from lexical analysis into useful information for the robot. At the end of this analysis, the object will be classified as dynamic or non-dynamic, animate or inanimate, and its speed, direction, and acceleration will be calculated if the element is time-variant. Figure 6 gives an overview of the Analysis syntax.
The objects will be divided into categories, as static or dynamic objects and animate or inanimate objects. When the objects are classified as static or dynamic objects, the robot can make use of this information to know if there is a risk of an object moving around. Knowing if the object is animate or inanimate, the robot can use this information to measure its actions, to avoid acting dangerously and risking its integrity. Table 1 presents examples of objects that belong to dynamic category and life category (animate); other objects that don’t belong to any of the two types are static or inanimate. A list of such objects can be accessed in [36].
The computation of dynamic objects’ velocity, direction, and acceleration consist of collecting the Tokens at two different time moments. The variable t and t 1 will be used to respectively indicate present and past into the vector of token t o k e n _ v e c t o r [ t i m e ] [ t o k e n _ i d ] .
To identify the same token at different time periods, a comparison between the data from a previous ( t 1 ) moment and the current one (t) is necessary. The compared information are the token’s class ( c l a s s ), the peak of the histogram ( p e a k _ h i s t o g r a m ) and Euclidean distance between the central points ( p _ c e n t e r ). First, they are compared in different moments (t and t 1 ) to verify if they belong to the same class. The second step is to use the histogram peak, where the objects are separated by gray tones, so a light grayscale dynamic object in the t 1 is compared only with the light grayscale dynamic object at the instant t. Finally, the Euclidean distance is used as the last criterion, considering that the tokens are generated at a small-time difference, something between 0.1 and 0.5 s, and a Euclidean distance of 0.7 m is considered as the maximum possible value for the displacement of an dynamic object of this time interval. This way, if two objects have the same class, the same shade of gray, and separated by a valid (small) value of a Euclidean distance between them, then they are the same object.
Algorithm 2 presents the procedure to identify the same object at two different instances of time. There are two vector inputs to the algorithm, where the first one contains all the present-instance tokens saved, while the other has all the past-instance tokens, the vectors are called t o k e n _ v e c t o r [ t ] . [ t o k e n _ i d ] and t o k e n _ v e c t o r [ t 1 ] . [ t o k e n _ i d ] , where t refers to the present instance time and t − 1 to the past instance. The time difference depends on the processing capacity of the sensor, ranging from 0.1 to 0.5 s. In the algorithm processing, a comparison between all objects of both vectors is made. Where it is verified, if both objects are dynamic, then if they belong to the same class; next, if the difference between the histogram peak is less than 30, and, finally, if the distance between their centers is less than or equal to 70 cm. If all the requirements are met, the position of the two tokens is saved in a third vector, called s a m e _ t o k e n [ p o s i t i o n ] . [ i d _ ( t ) , i d _ ( t 1 ) ] . In the future, these positions will be used to get the information of a Token to calculate the direction, velocity, and acceleration.
Algorithm 2: Identify the same object in two instants of time.
Sensors 19 03764 i002
The direction of a dynamic object can be computed by the function atan2 that provides the angular difference between the two points [44]. Then, an angular deviation of 180 degrees is added to this difference, generating the course of the dynamic object. Algorithm 3 presents the complete computation of object direction. As input to the algorithm, there are the two vectors with all tokens saved, in the present instance (t) and in the past instance (t − 1), with the respective names t o k e n _ v e c t o r [ t ] . [ t o k e n _ i d ] and t o k e n _ v e c t o r [ t 1 ] . [ t o k e n _ i d ] . The third input concerns the output of Algorithm 2, where the identification of the same tokens is stored, the name of this entry is s a m e _ t o k e n [ p o s i t i o n ] . [ i d _ ( t ) , i d _ ( t 1 ) ] . The processing consists in obtaining the angular difference between the two points representing the same token at different times so that it is possible to obtain the direction of the token. As output, a variable called as is created where the dynamic token direction, velocity, and acceleration data are stored. In this algorithm, the direction is saved in the S y n t a x _ A n a l y s i s [ i d ] . d i r e c t i o n field.
Algorithm 3: Calculate the direction of the dynamic object.
Sensors 19 03764 i003
The ratio between the variation of position and the variation of time is used to calculate the velocity of the dynamic object at time t. This feature is shown in meters, and the time in seconds, so the speed obtained is in meters per second (m/s). The Algorithm 4 presents the method applied to all the dynamic points identified by the Algorithm 2. The inputs to the algorithm are the same as those in Algorithm 3, while their output is the addition of speed of the moving token, called S y n t a x _ A n a l y s i s [ i d ] . d i r e c t i o n . The algorithm processing consists of taking the time difference between the two tokens, the Euclidean distance traveled, and finally calculating the velocity by dividing the distance by time.
The acceleration is calculated using the speed variation divided by time. To calculate the acceleration, it is necessary that the object in question already has speed. Therefore, the velocity is first calculated, and, in the next cycle, its acceleration is calculated. Algorithm 5 brings the acceleration calculation, where the entries are the same as in Algorithms 3 and 4. The processing consists of first checking if the tokens are assigned any speed in the S y n t a x _ A n a l y s i s [ i d ] . v e l o c i t y field. Thus, the difference between the velocities of the tokens is calculated, and the time difference is obtained. Finally, acceleration is calculated by dividing the velocity variation by the time variation and saved in the S y n t a x _ A n a l y s i s [ i d _ ( t ) ] . a c c e l e r a t i o n variable.
Algorithm 4: Calculate the velocity of the dynamic object.
Sensors 19 03764 i004
Algorithm 5: Calculate the acceleration of the dynamic object.
Sensors 19 03764 i005
At the end of the syntax analysis, there is some new information of the token—for instance, stating if the object is dynamic or not, and whether it has a life or not (Table 1). The is also the calculation of the object’s direction (Algorithm 3), velocity (Algorithm 4) and acceleration (Algorithm 5). The next step consists of a strategy of anticipation, where the future position of the object will be calculated, based on speed and acceleration, to take preventive actions.

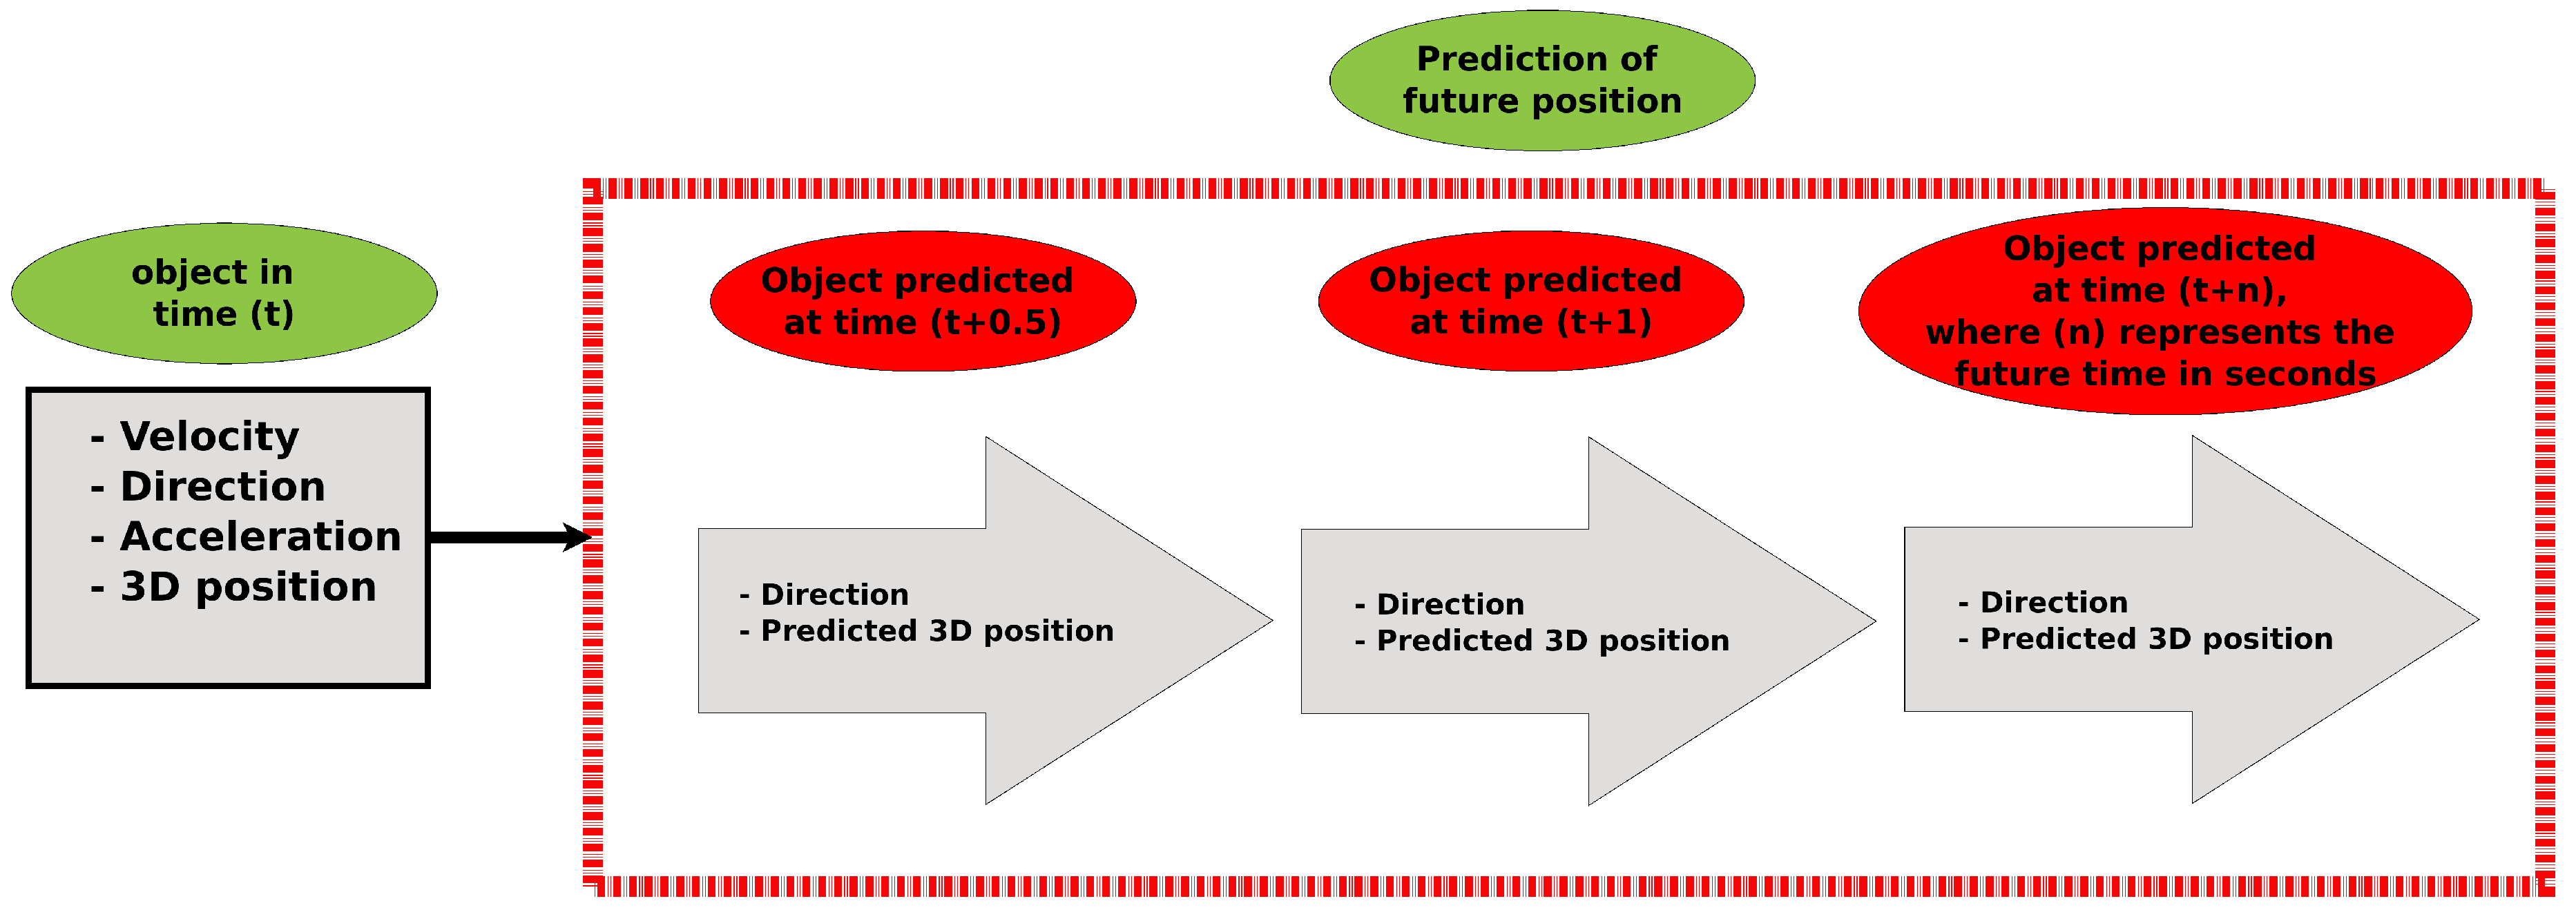
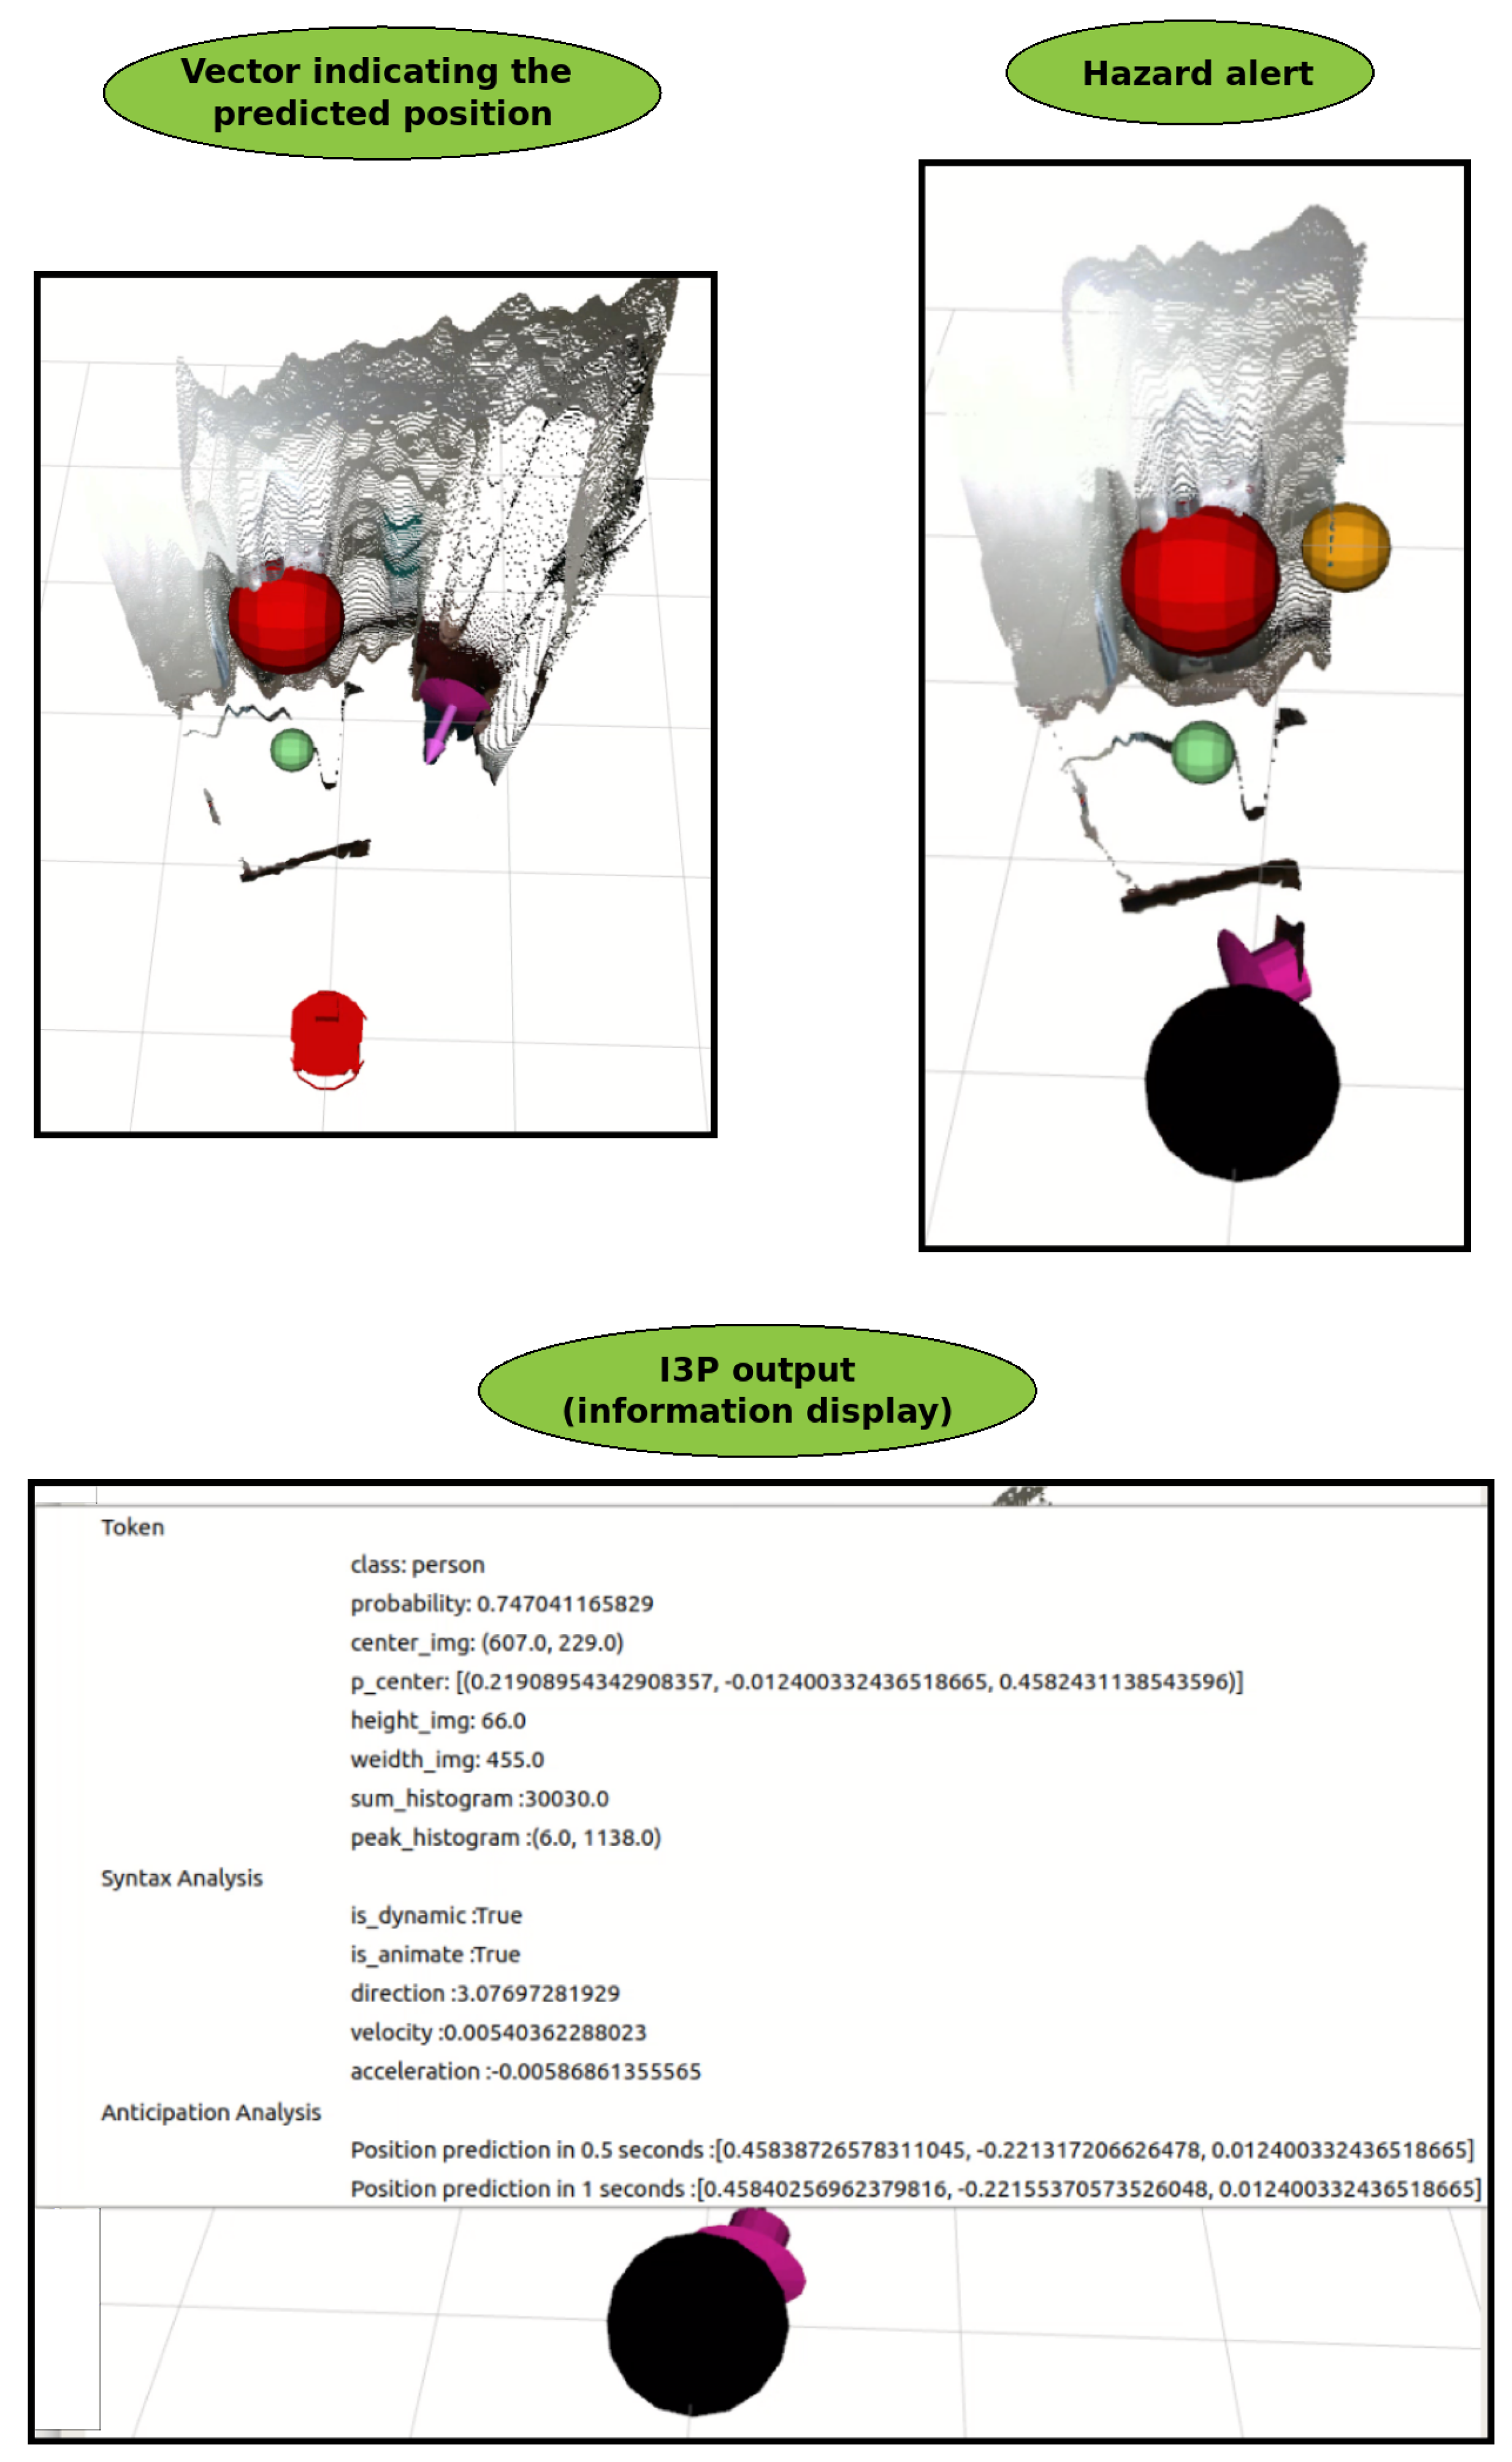
3.3. Anticipation Analysis

The future position of dynamic objects is estimated through the data obtained in syntax analysis, in the next SD2I step, called anticipation analysis. The prediction of future behavior of time-varying elements is primordial to the robot attaining reliable path planning [45]. Moreover, for safety reasons, unnecessary calculations must be prevented during trajectory planning or maneuvers to avoid collisions with objects that are moving toward the robot. Figure 7 presents a diagram of the proposed strategy.
The object motion estimation is based on acceleration, speed, and direction of the object. It is always assumed that the element maintains its direction. The Intelligent 3D Perception is designed to predict behavior at two future times: 0.5 and 1 s ahead. Equation (4) presents the calculation used to define the object displacement in time, where t i m e must be replaced by the time to be predicted. The variable S y n t a x _ A n a l y s i s possesses the direction, velocity, and acceleration of the object:
d i s p l a c e m e n t = S y n t a x _ A n a l y s i s . v e l o c i t y t i m e + S y n t a x _ A n a l y s i s . a c c e l e r a t i o n t i m e 2 2 .
The predicted position is calculated by adding the displacement to the current object position, as shown in Equation (5). This process is carried out for two different time frames, being t i m e = 0.5 and t i m e = 1 :
f u t u r e _ p o s i t i o n = c u r r e n t _ p o s i t i o n + d i s p l a c e m e n t f u t u r e _ d i r e c t i o n = c u r r e n t _ d i r e c t i o n .
The next section will present the experiments and results. An explanation about the user interface detailing the displayed information is also presented.

4. Experiments and Results

The data provided by the proposed perception source are published in the format of ROS topics [41], where the robot can access them in an agile and easy way. This information allows the robot to make decisions and take action in navigation time. The robot accessing all the information of each Token is assured. The available information is: class, probability, center of the object in the image, center of the object in 3D, width in pixels, height in pixels, histogram peak, histogram sum, speed, direction, acceleration, whether the object is dynamic and if the object has life or not. This information is returned directly to the robot, without the need for any additional processing.
To facilitate information understanding, a graphic strategy is developed. Data can also be displayed in graphical format by using Interactive Markers [46]. This way, it is possible to view the objects in a 3D environment; additionally clicking on the object will display all collected information related to it.
A first experiment in which the perception source was pointed at a shelf, as in Figure 8, is carried out to validate the Lexical Analysis. Figure shows the RGB image output added to YOLOv3, (YOLOv3 output). The output of the perception source Intelligent 3D Perception (I3P) is presented in two ways: a top view and a frontal view. In these views, each object position is checked against the source of perception (Algorithm 1). The objects are represented by colored spheres, where yellow represents the laptop, red the sofa, green the books, orange the bottles and blue the suitcase. The source of perception I3E is represented by a red robot. In the figure, the Point Cloud with color (RGB-D data) is also displayed. All information obtained from each object can be viewed by clicking on its respective sphere. The image I3P output, (information display) provides an example, where all information obtained from the book object on the right is displayed. The same can be done with any identified object.
The Syntax Analysis is concerned with obtaining information from data provided by the lexical analysis. First, the object behavior is inferred. If it is a dynamic and or animated object (Table 1), then all the Tokens are saved in two instants of different times and the procedure to identify the same object in these two instants is applied (Algorithm 2). Once this is done, it is possible to calculate its direction, velocity, and acceleration based on the displacement of the object (Algorithms 3–5). Figure 9 shows the result of the syntax analysis, when two people are moving in front of the robot. As soon as the dynamic object is identified by I3P, it is converted to a vector, which points to the direction in which the object is moving. The figure shows the path developed by the object (pink trail) so that it is possible to infer its direction, as well as validate the proposed strategy with multiple dynamic objects of the same class, one of the situations with the highest degree of complexity. In this Figure, the refrigerator is represented by a red sphere, the dining table by a light green sphere, the chair by a blue sphere, the bottle by an orange sphere, and person is represented in pink.
The Anticipation Analysis consists of predicting the future position of the moving object by its direction, speed, and acceleration. Figure 10 shows the working strategy, where the purple vector represents the future position of the object in 1 s. This time frame can be changed to identify the future position of the object; the Equations (4) and (5) are used. A second visual strategy has been developed where a black sphere is created around the perception source if the future position of a moving object may come crashing into the robot.
The proposed strategy was implemented and proved to be satisfactory for use in mobile robots. A specific sensor to provide intelligent information slows down the development of intelligent robotic systems and prevents accidents if the information provided by the sensor is used correctly, fulfilling the main objective of this paper.

Accuracy and Precision

The error of the proposed strategy of lexical analysis corresponds to the object identification error of YOLOv3 plus the distance error provided by the depth sensor. The YOLOv3 has an accuracy of 35.4 mAP (mean Average Precision). The position error of the 3D object refers to the sensor error and may vary according to the employed perception source. The paper [47] presents the data from the RealSense D435 3D sensor, which was used by this work, which shows an error of 0.707 mm for an object at 1 m. Based on the data provided by the work, an object identified at 1 m by the strategy proposed by this paper would have an accuracy of 35.4 mAP on the object identification and an error of 0.707 mm on its position.
One of the problems that can occur when calculating velocity and acceleration is not having the same object in two moments. This issue is caused by YOLOv3 not identifying the object in a specific image frame, or the proposed strategy not recognizing the same dynamic object. Ten experiments were performed to quantify the accuracy, where a dynamic object moved around nonstop within the sensor range. During the experiment period, all Tokens data were saved. Tokens that have velocity, direction, and acceleration data are considered valid. That did not track the same objected are considered stopped were defined as errors for obtaining I3P sensor data. The results are presented in Table 2, containing the duration of each experiment, the amount of total tokens captured, the calculated tokens per second, the number of tokens with velocity, direction, and acceleration data, number of tokens with calculation errors as well as the percentage of the error. The I3P sensor error in the experiments was 4.835% on the average.
Anticipation Analysis is valid for different tasks, such as high preservation by avoiding collision with an object moving towards the robot, or for trajectory calculation. A dynamic object was taken towards the robot in a total of 10 experiments, aiming to validate the analysis in a quantitative way. Data were collected from their actual position, and position established by the Anticipation Analysis, and then the Euclidean distance from both locations to the robot was performed. An average of the variation of the two places was shown, where the obtained result was of 84 cm. On average, the robot was able to anticipate an object’s movement towards it from up to 84.79 cm. The smallest distance difference between the tests was 34.43 cm and the largest 2.77 m. This distance varies with the speed of the object.

5. Conclusions

The paper has presented a novel source of perception, capable of identifying objects in 3D, and extracting as much information as possible, such as name, position in the real world in relation to the source of perception, predominant gray tone, speed, direction and acceleration, in addition to predicting its future position. The proposed approach is carried out in three steps. A Lexical Analysis was performed, where the RGB image from the sensor was used to identify the objects through YoLoV3. From the image, data such as the class of the object, center of the object in the image, Box around the object, probability of hit and histogram peak were identified. Moreover, the Lexical Analysis also implements the computation of the object position in the real world, from its position in the image, using the cloud of points provided by the depth sensor. All these data were stored in a Token. Each Token contains information about each object identified in the scene. The error of the sensor is highly dependent on YOLOv3 accuracy, which is 35.4 mean average precision. The 3D position error from the sensor, which is specified by the manufacturer by up to 2%.
The second step consisted of a Syntax Analysis, where two Tokens were obtained at different time instants, called (t) for the current instant, and (t-1) for the previous instant. A procedure was then developed to identify the same Token at both instants of time. Having the same Token in both instances of time, it is possible to calculate object properties such as speed, direction, and acceleration, based on the known data of each Token. This procedure is validated through the analysis of error from obtaining the velocity, direction, and acceleration data of the dynamic objects by the strategy proposed by this paper resulting in an absolute error of 4.835%.
Finally, with velocity, direction, and acceleration, an Anticipation Analysis is developed, where the position of the moving object at two future instants of time was predicted. These data are important for a mobile robot in order to avoid future collisions with a moving object. In the experiments performed, it was possible to verify that an object towards the robot with an average distance of 84.79 cm, having particular cases of identifying at a distance of up to 2.77 m, makes this sensor better suited to provide information for avoidance behaviors.
At the end of these three analyses, the proposed perception source provided the robot with the ability to identify objects, know their position in the world, calculate their speed and acceleration, predict their future position and present the obtained data in an intelligent way, alerting the robot and the viewer about collision hazards.
The sensor has some particular issues to be improved, such as the instantaneous lack of calculation the speed, direction, and acceleration of dynamic objects in single frames. This problem does not pose a risk to the robot because a frame lasts, on average, 0.3367 s, and the error happens in isolated cases in very tiny time intervals. As future efforts, it is possible to refine the strategy to work with a more significant amount of time intervals, thus preventing such errors from occurring.
The use of an intelligent sensor can prevent the loss of material and processing resources. By predicting the future position of a dynamic object, it is possible to develop a high preservation strategy to avoid collisions, for example. Focusing on processing and performance of the robot, it is possible to avoid the recalculation of trajectory, considering busy positions where dynamic objects have a chance to occupy. These are just a few examples of how the proposed strategy can contribute to the advances of research and development in mobile robotics.

Author Contributions

Conceptualization, M.A.S.T., A.S.d.O., L.V.R.d.A., D.R.P. and J.E.R.; Methodology, M.A.S.T., A.S.d.O., L.V.R.d.A., F.N.-J., J.E.R. and D.R.P.; Validation, N.D., H.B.S., R.d.C.M.N., D.R.P. and J.E.R.; Resources, L.V.R.d.A., F.N.-J., D.R.P. and J.E.R.; Funding acquisition, L.V.R.d.A., F.N.-J., D.R.P., J.E.R. and A.S.d.O.; Writing—original draft preparation, M.A.S.T. and A.S.d.O.; Writing—review and editing, R.d.C.M.N., L.V.R.d.A., F.N.-J., A.S.d.O., D.R.P. and J.E.R.; all of the authors have participated in revising the intellectual content of this article.

Acknowledgments

The authors thank the National Counsel of Technological and Scientific Development of Brazil (CNPq), Coordination for the Improvement of Higher Level People (CAPES) and the Brazilian Ministry of Science, Technology, Innovation and Communication (MCTIC). The authors would like to greatly thank NVIDIA Corporation (Santa Clara, CA, USA) for the donation of equipment and PETROBRAS for project funding.

Conflicts of Interest

The authors declare no conflict of interest.

References

  1. Siegwart, R.; Nourbakhsh, I.R.; Scaramuzza, D.; Arkin, R.C. Introduction to Autonomous Mobile Robots; MIT Press: Cambridge, MA, USA, 2011. [Google Scholar]
  2. Jones, J.L.; Seiger, B.A.; Flynn, A.M. Mobile Robots: Inspiration to Implementation; AK Peters/CRC Press: Boca Raton, FL, USA, 1998. [Google Scholar]
  3. Lu, Y. Industry 4.0: A survey on technologies, applications and open research issues. J. Ind. Inf. Integr. 2017, 6, 1–10. [Google Scholar]
  4. Bahrin, M.A.K.; Othman, M.F.; Azli, N.N.; Talib, M.F. Industry 4.0: A review on industrial automation and robotic. J. Teknol. 2016, 78, 137–143. [Google Scholar]
  5. Benotsmane, R.; Kovács, G.; Dudás, L. Economic, Social Impacts and Operation of Smart Factories in Industry 4.0 Focusing on Simulation and Artificial Intelligence of Collaborating Robots. Soc. Sci. 2019, 8, 143. [Google Scholar] [CrossRef]
  6. Cardona, G.A.; Calderon, J.M. Robot Swarm Navigation and Victim Detection Using Rendezvous Consensus in Search and Rescue Operations. Appl. Sci. 2019, 9, 1702. [Google Scholar] [CrossRef]
  7. Murphy, R.R. Human-robot interaction in rescue robotics. IEEE Trans. Syst. Man Cybern. Part C (Appl. Rev.) 2004, 34, 138–153. [Google Scholar]
  8. Davis, M.; Sahin, F. HOG feature human detection system. In Proceedings of the 2016 IEEE International Conference on Systems, Man, and Cybernetics (SMC), Budapest, Hungary, 9–16 October 2016; pp. 002878–002883. [Google Scholar]
  9. Everett, H. Sensors for Mobile Robots; AK Peters/CRC Press: Boca Raton, FL, USA, 1995. [Google Scholar]
  10. Kehoe, B.; Patil, S.; Abbeel, P.; Goldberg, K. A survey of research on cloud robotics and automation. IEEE Trans. Autom. Sci. Eng. 2015, 12, 398–409. [Google Scholar]
  11. Fiala, M. ARTag, a fiducial marker system using digital techniques. In Proceedings of the 2005 IEEE Computer Society Conference on Computer Vision and Pattern Recognition (CVPR’05), San Diego, CA, USA, 20–25 June 2005; Volume 2, pp. 590–596. [Google Scholar]
  12. Fiala, M. Designing highly reliable fiducial markers. IEEE Trans. Pattern Anal. Mach. Intell. 2009, 32, 1317–1324. [Google Scholar] [CrossRef]
  13. Cui, J.; Zhang, J.; Sun, G.; Zheng, B. Extraction and Research of Crop Feature Points Based on Computer Vision. Sensors 2019, 19, 2553. [Google Scholar] [CrossRef]
  14. Tan, D.S.; Lin, J.M.; Lai, Y.C.; Ilao, J.; Hua, K.L. Depth Map Upsampling via Multi-Modal Generative Adversarial Network. Sensors 2019, 19, 1587. [Google Scholar] [CrossRef]
  15. Tan, D.S.; Yao, C.Y.; Ruiz, C.; Hua, K.L. Single-Image Depth Inference Using Generative Adversarial Networks. Sensors 2019, 19, 1708. [Google Scholar] [CrossRef]
  16. Teixeira, M.A.S.; Santos, H.B.; de Oliveira, A.S.; Arruda, L.V.; Neves, F. Robots Perception Through 3D Point Cloud Sensors. In Robot Operating System (ROS); Springer: New York, NY, USA, 2017; pp. 525–561. [Google Scholar]
  17. Jokela, M.; Kutila, M.; Pyykönen, P. Testing and Validation of Automotive Point-Cloud Sensors in Adverse Weather Conditions. Appl. Sci. 2019, 9, 2341. [Google Scholar] [CrossRef]
  18. Xu, H.; Chen, G.; Wang, Z.; Sun, L.; Su, F. RGB-D-Based Pose Estimation of Workpieces with Semantic Segmentation and Point Cloud Registration. Sensors 2019, 19, 1873. [Google Scholar] [CrossRef] [PubMed]
  19. Yen, S.H.; Tang, P.C.; Lin, Y.C.; Lin, C.Y. Development of a Virtual Force Sensor for a Low-Cost Collaborative Robot and Applications to Safety Control. Sensors 2019, 19, 2603. [Google Scholar] [CrossRef]
  20. Shin, M.; Paik, W.; Kim, B.; Hwang, S. An IoT Platform with Monitoring Robot Applying CNN-Based Context-Aware Learning. Sensors 2019, 19, 2525. [Google Scholar] [CrossRef]
  21. He, W.; Li, Z.; Chen, C.P. A survey of human-centered intelligent robots: issues and challenges. IEEE/CAA J. Autom. Sin. 2017, 4, 602–609. [Google Scholar] [CrossRef]
  22. Rusu, R.B.; Cousins, S. Point cloud library (pcl). In Proceedings of the 2011 IEEE International Conference on Robotics and Automation, Shanghai, China, 9–13 May 2011; pp. 1–4. [Google Scholar]
  23. Pomerleau, F.; Colas, F.; Siegwart, R. A review of point cloud registration algorithms for mobile robotics. Found. Trends Robot. 2015, 4, 1–104. [Google Scholar] [CrossRef]
  24. Viola, P.; Jones, M.J. Robust real-time face detection. Int. J. Comput. Vis. 2004, 57, 137–154. [Google Scholar] [CrossRef]
  25. Liu, C.; Chang, F.; Chen, Z.; Liu, D. Fast traffic sign recognition via high-contrast region extraction and extended sparse representation. IEEE Trans. Intell. Transp. Syst. 2015, 17, 79–92. [Google Scholar] [CrossRef]
  26. Dalal, N.; Triggs, B. Histograms of oriented gradients for human detection. In Proceedings of the International Conference on Computer Vision & Pattern Recognition (CVPR’05), San Diego, CA, USA, 20–25 June 2005; Volume 1, pp. 886–893. [Google Scholar]
  27. Girshick, R.; Donahue, J.; Darrell, T.; Malik, J. Rich feature hierarchies for accurate object detection and semantic segmentation. In Proceedings of the IEEE Conference on Computer Vision and Pattern Recognition, Columbus, OH, USA, 23–28 June 2014; IEEE: New York, NY, USA, 2014; pp. 580–587. [Google Scholar]
  28. Girshick, R. Fast r-cnn. In Proceedings of the IEEE International Conference on Computer Vision, Washington, DC, USA, 7–13 December 2015; pp. 1440–1448. [Google Scholar]
  29. Ren, S.; He, K.; Girshick, R.; Sun, J. Faster r-cnn: Towards real-time object detection with region proposal networks. arXiv, 2015; arXiv:1506.01497v3. [Google Scholar] [CrossRef]
  30. Liu, W.; Anguelov, D.; Erhan, D.; Szegedy, C.; Reed, S.; Fu, C.Y.; Berg, A.C. Ssd: Single shot multibox detector. In Proceedings of the European Conference on Computer Vision, Amsterdam, The Netherlands, 8–16 October 2016; Springer: New York, NY, USA, 2016; pp. 21–37. [Google Scholar]
  31. Redmon, J.; Divvala, S.; Girshick, R.; Farhadi, A. You only look once: Unified, real-time object detection. In Proceedings of the IEEE Conference on Computer Vision and Pattern Recognition, Las Vegas, NV, USA, 27–30 June 2016; pp. 779–788. [Google Scholar]
  32. Min, W.; Cui, H.; Han, Q.; Zou, F. A Scene Recognition and Semantic Analysis Approach to Unhealthy Sitting Posture Detection during Screen-Reading. Sensors 2018, 18, 3119. [Google Scholar] [CrossRef]
  33. Redmon, J.; Farhadi, A. Yolov3: An incremental improvement. arXiv 2018, arXiv:1804.02767. [Google Scholar]
  34. Keselman, L.; Woodfill, J.I.; Grunnet-Jepsen, A.; Bhowmik, A. Intel (r) realsense (tm) stereoscopic depth cameras. In Proceedings of the 2017 IEEE Conference on Computer Vision and Pattern Recognition Workshops (CVPRW), Honolulu, HI, USA, 21–26 July 2017; pp. 1267–1276. [Google Scholar]
  35. Pagliari, D.; Pinto, L. Calibration of kinect for xbox one and comparison between the two generations of microsoft sensors. Sensors 2015, 15, 27569–27589. [Google Scholar] [CrossRef] [PubMed]
  36. Lin, T.Y.; Maire, M.; Belongie, S.; Hays, J.; Perona, P.; Ramanan, D.; Dollár, P.; Zitnick, C.L. Microsoft coco: Common objects in context. In Proceedings of the European Conference on Computer Vision, Zurich, Switzerland, 6–12 September 2014; Springer: New York, NY, USA, 2014; pp. 740–755. [Google Scholar]
  37. Everingham, M.; Van Gool, L.; Williams, C.K.; Winn, J.; Zisserman, A. The pascal visual object classes (voc) challenge. Int. J. Comput. Vis. 2010, 88, 303–338. [Google Scholar] [CrossRef]
  38. Geiger, A.; Lenz, P.; Urtasun, R. Are we ready for autonomous driving? The kitti vision benchmark suite. In Proceedings of the 2012 IEEE Conference on Computer Vision and Pattern Recognition, Providence, RI, USA, 16–21 June 2012; pp. 3354–3361. [Google Scholar]
  39. Nvidia. AUTONOMOUS MACHINES. Available online: https://www.nvidia.com/en-us/autonomous-machines/embedded-systems/ (accessed on 22 June 2019).
  40. Intel. INTEL® NUC. Available online: https://www.intel.com/content/www/us/en/products/boards-kits/nuc.html (accessed on 22 June 2019).
  41. Quigley, M.; Conley, K.; Gerkey, B.; Faust, J.; Foote, T.; Leibs, J.; Wheeler, R.; Ng, A.Y. ROS: An open-source Robot Operating System. In Proceedings of the IEEE International Conference on Robotics and Automation: Workshop on Open Source Software (ICRA), Kobe, Japan, 12–17 May 2009. [Google Scholar]
  42. Kapur, J.N.; Sahoo, P.K.; Wong, A.K. A new method for gray-level picture thresholding using the entropy of the histogram. Comput. Vis. Graph. Image Process. 1985, 29, 273–285. [Google Scholar] [CrossRef]
  43. Macedo, J.; Marques, L.; Costa, E. A Comparative Study of Bio-Inspired Odour Source Localisation Strategies from the State-Action Perspective. Sensors 2019, 19, 2231. [Google Scholar] [CrossRef] [PubMed]
  44. Luo, Z.; Ding, J.; Zhao, L.; Wu, M. An Enhanced Non-Coherent Pre-Filter Design for Tracking Error Estimation in GNSS Receivers. Sensors 2017, 17, 2668. [Google Scholar] [CrossRef]
  45. Teixeira, M.A.S.; Dalmedico, N.; de Oliveira, A.S.; de Arruda, L.V.R.; Neves-Jr, F. A pose prediction approach to mobile objects in 2D costmaps. In Proceedings of the 2017 Latin American Robotics Symposium (LARS) and 2017 Brazilian Symposium on Robotics (SBR), Curitiba, Brazil, 8–11 November 2017; IEEE: Piscatway, NJ, USA, 2017; pp. 1–6. [Google Scholar] [CrossRef]
  46. Gossow, D.; Leeper, A.; Hershberger, D.; Ciocarlie, M. Interactive markers: 3-d user interfaces for ros applications [ros topics]. IEEE Robot. Autom. Mag. 2011, 18, 14–15. [Google Scholar] [CrossRef]
  47. Carfagni, M.; Furferi, R.; Governi, L.; Santarelli, C.; Servi, M.; Uccheddu, F.; Volpe, Y. Metrological and Critical Characterization of the Intel D415 Stereo Depth Camera. Sensors 2019, 19, 489. [Google Scholar] [CrossRef]
Figure 1. Intelligent 3D Perception (I3P) system.
Sensors 19 03764 g001
Figure 2. An overview of Semantic Description and Dynamic Interaction (SD2I) methodology.
Sensors 19 03764 g002
Figure 3. An overview of Lexical Analysis.
Sensors 19 03764 g003
Figure 4. Extraction of the tokens from the image.
Sensors 19 03764 g004
Figure 5. Analysis of histogram.
Sensors 19 03764 g005
Figure 6. Overview of syntax analysis.
Sensors 19 03764 g006
Figure 7. Diagram of the anticipation strategy.
Sensors 19 03764 g007
Figure 8. Result of the application of the Lexical Analysis.
Sensors 19 03764 g008
Figure 9. Result of the application of the Syntax Analysis.
Sensors 19 03764 g009
Figure 10. Result of the application of the Anticipation Analysis.
Sensors 19 03764 g010
Table 1. Inferred knowledge in objects.
Object Class
Is it dynamic?person, bicycle, car, motorbike, aeroplane,
bus, train, truck, boat, bird,
cat, dog, horse, sheep, cow,
elephant, bear, zebra, giraffe, frisbee,
snowboard, sports ball, skateboard, surfboard
tennis racket, chair
Is there life?person, bird, cat, dog, horse,
sheep, cow, elephant, bear, zebra, giraffe
Table 2. Errors in the accuracy experiments.
TimeTokensTokens per SecondTokens with Speed/Direction/AccelerationTokens with Calculation ErrorError Percentage
32.191003.1079466.000
46.372475.327235124.858
38.741283.30412264.688
69.582273.262215125.286
35.181113.15511010.901
58.441853.16618052.703
51.982334.482221125.150
76.313554.6523114412.394
40.391303.21912643.077
47.961523.16914753.289
Average49.71186.83.684186.810.74.835

