X-ray Imaging Analysis of Silo Flow Parameters Based on Trace Particles Using Targeted Crowdsourcing †


Abstract
1. Introduction
2. Related Work
2.1. Industrial and Process Tomography for Understanding Process Behavior
2.2. Gravitational Flow of Solids
2.3. Trace Particle Tracking Method for Flow Investigation
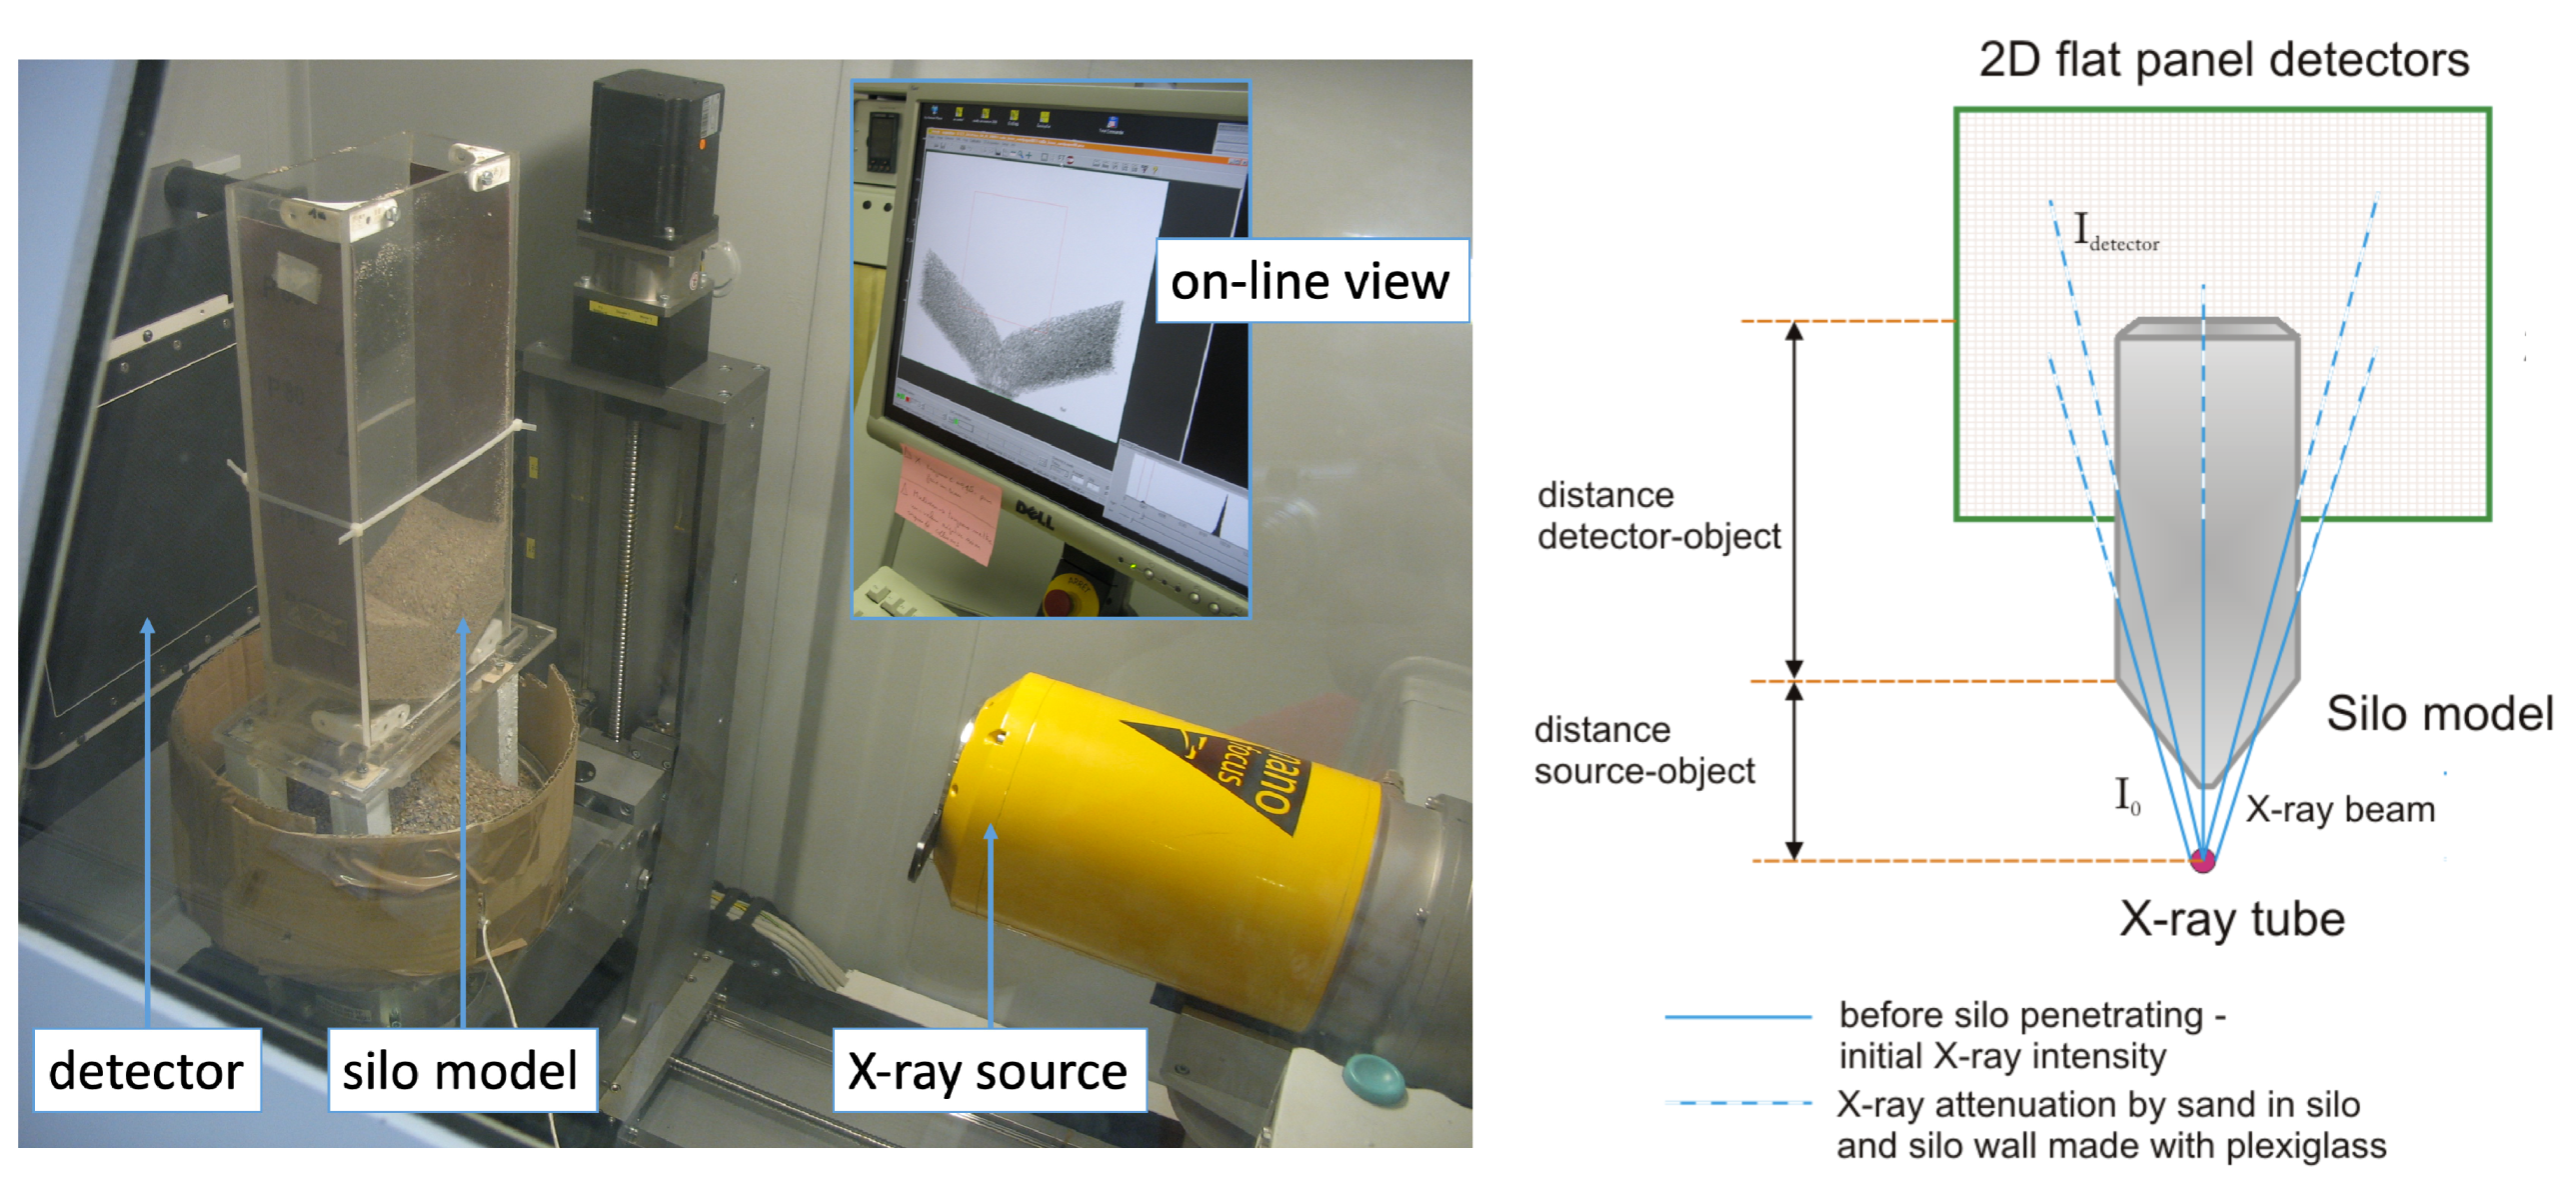
3. Sensing Equipment and X-ray Imaging
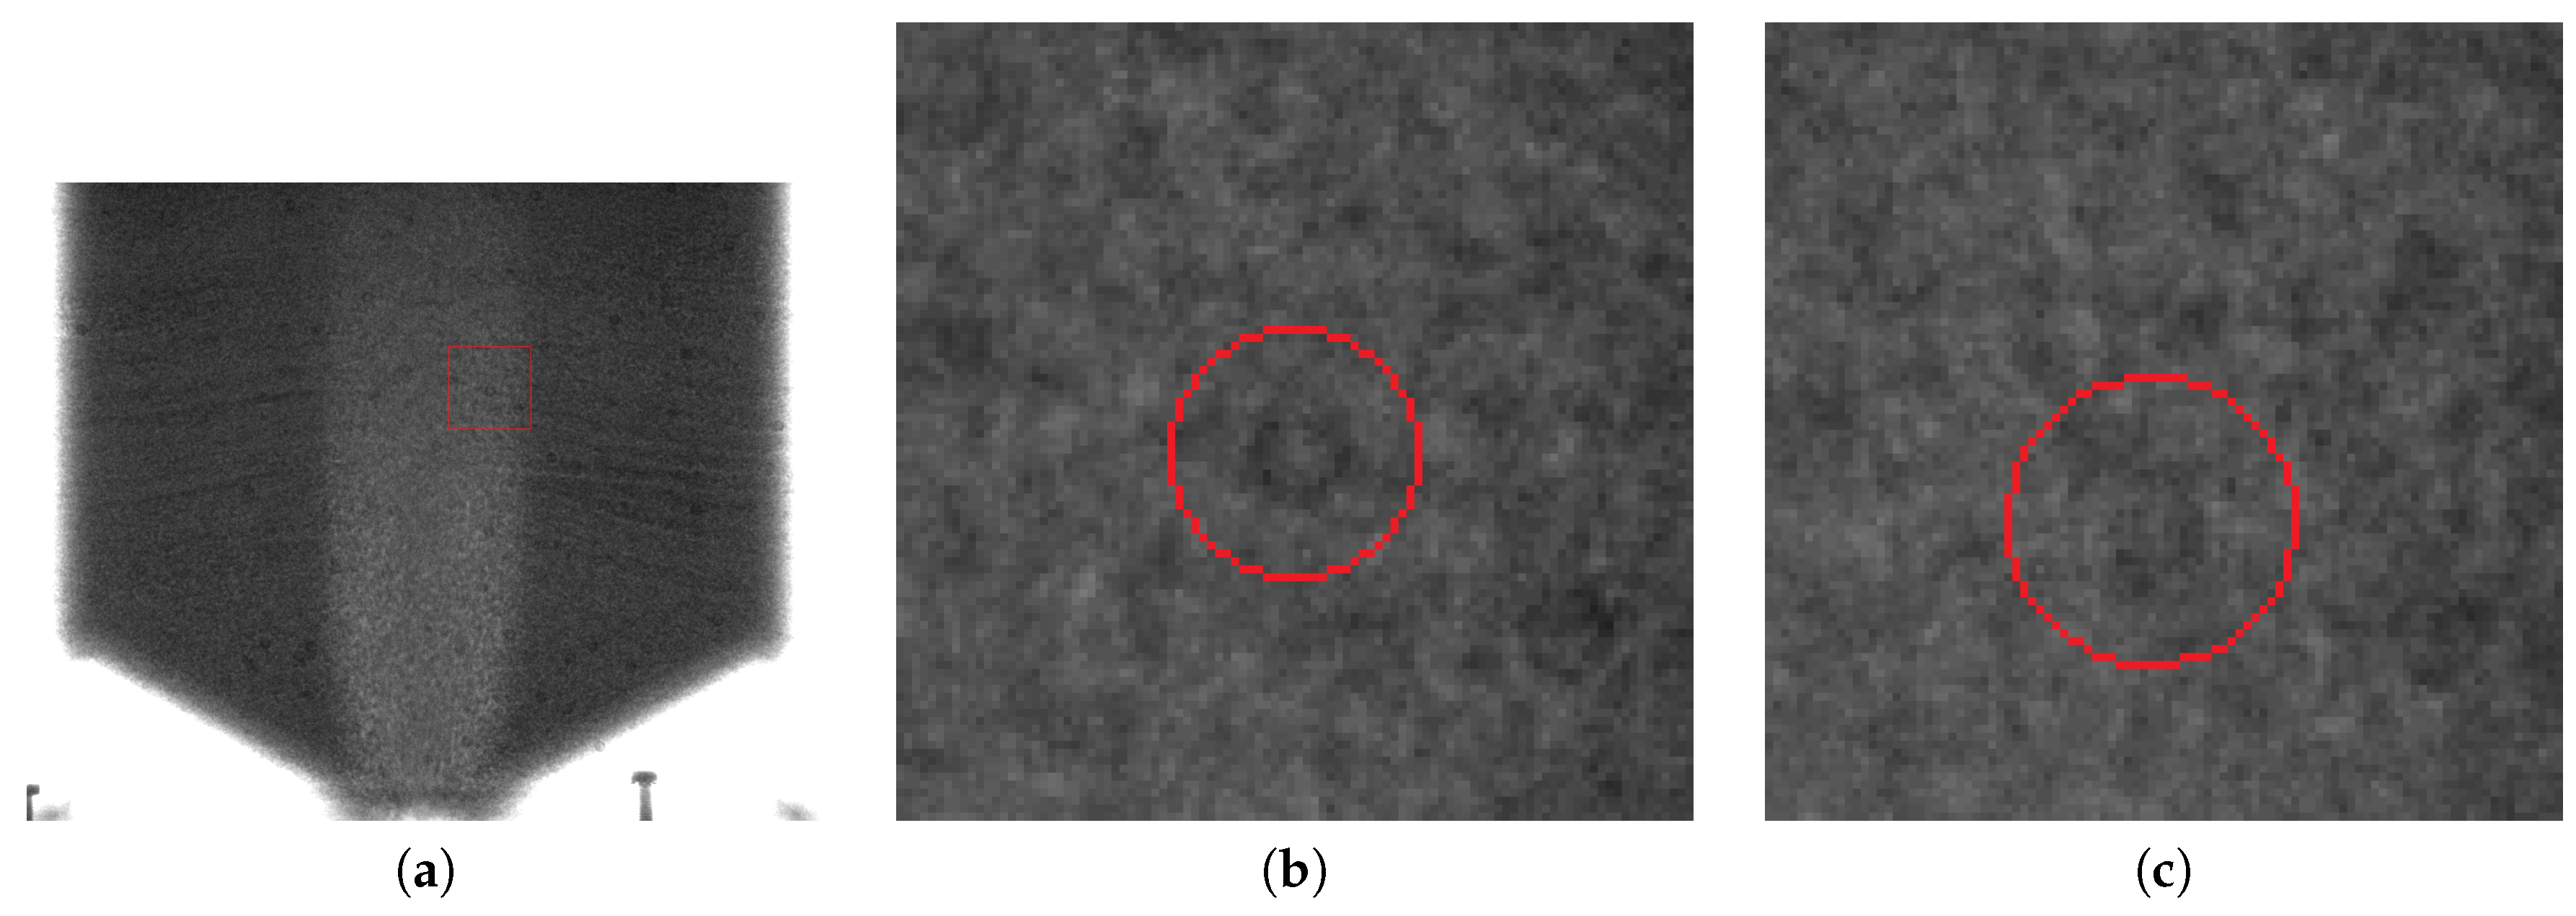
3.1. X-ray Measurement Data Processing
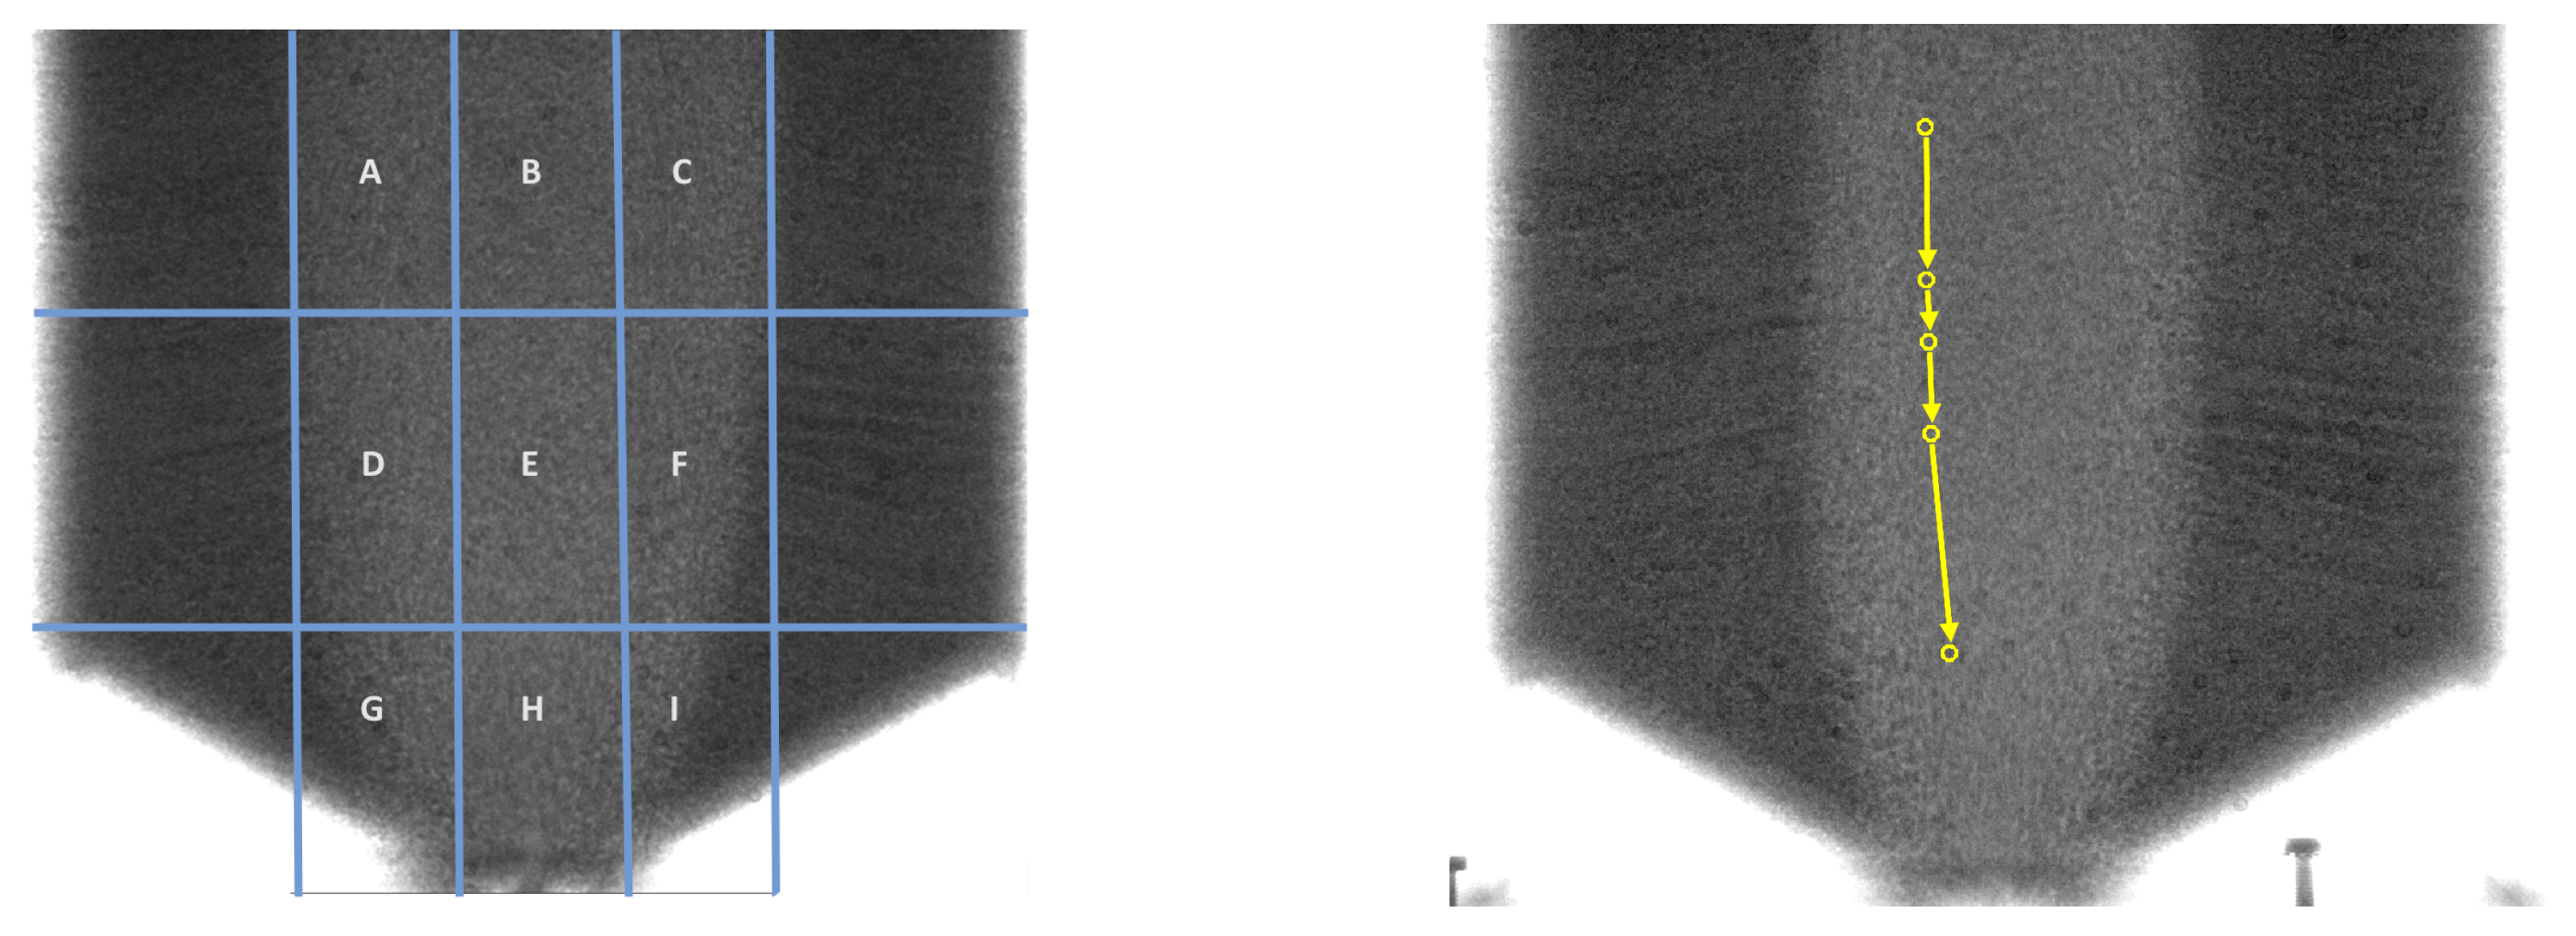
3.2. Experimental Methodology
4. Crowdsourcing as an Effective Image Processing Engine
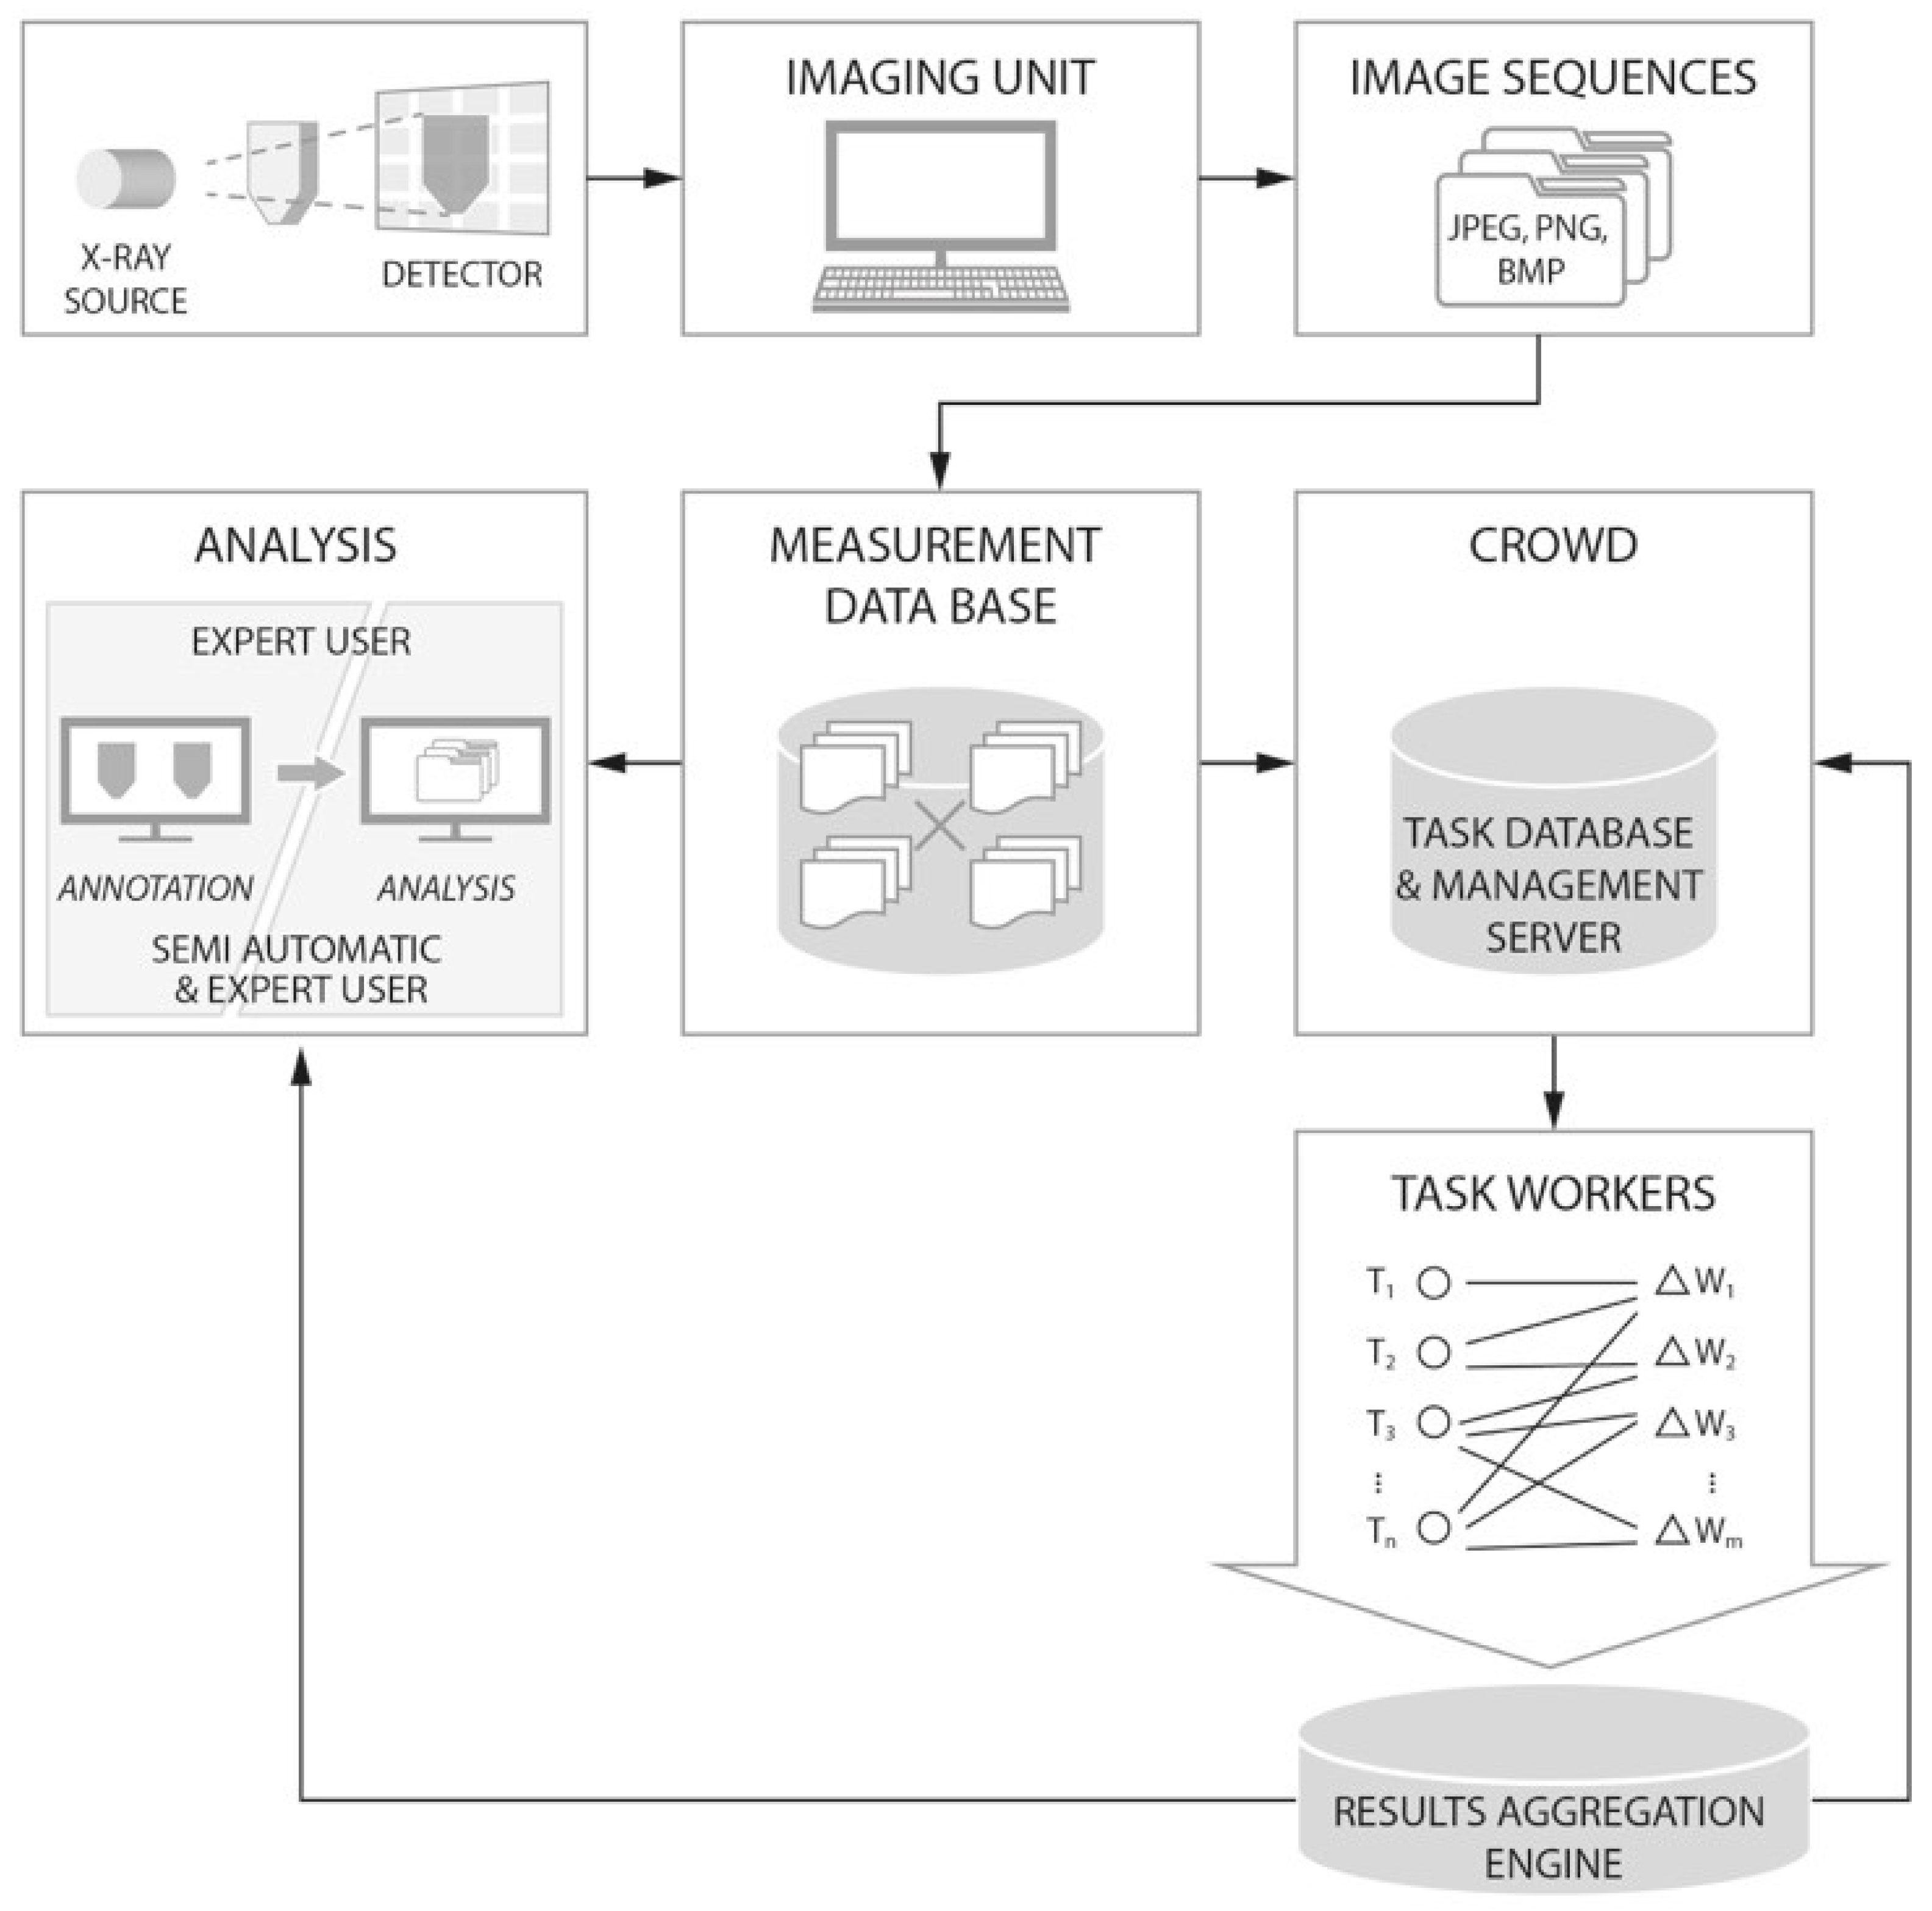
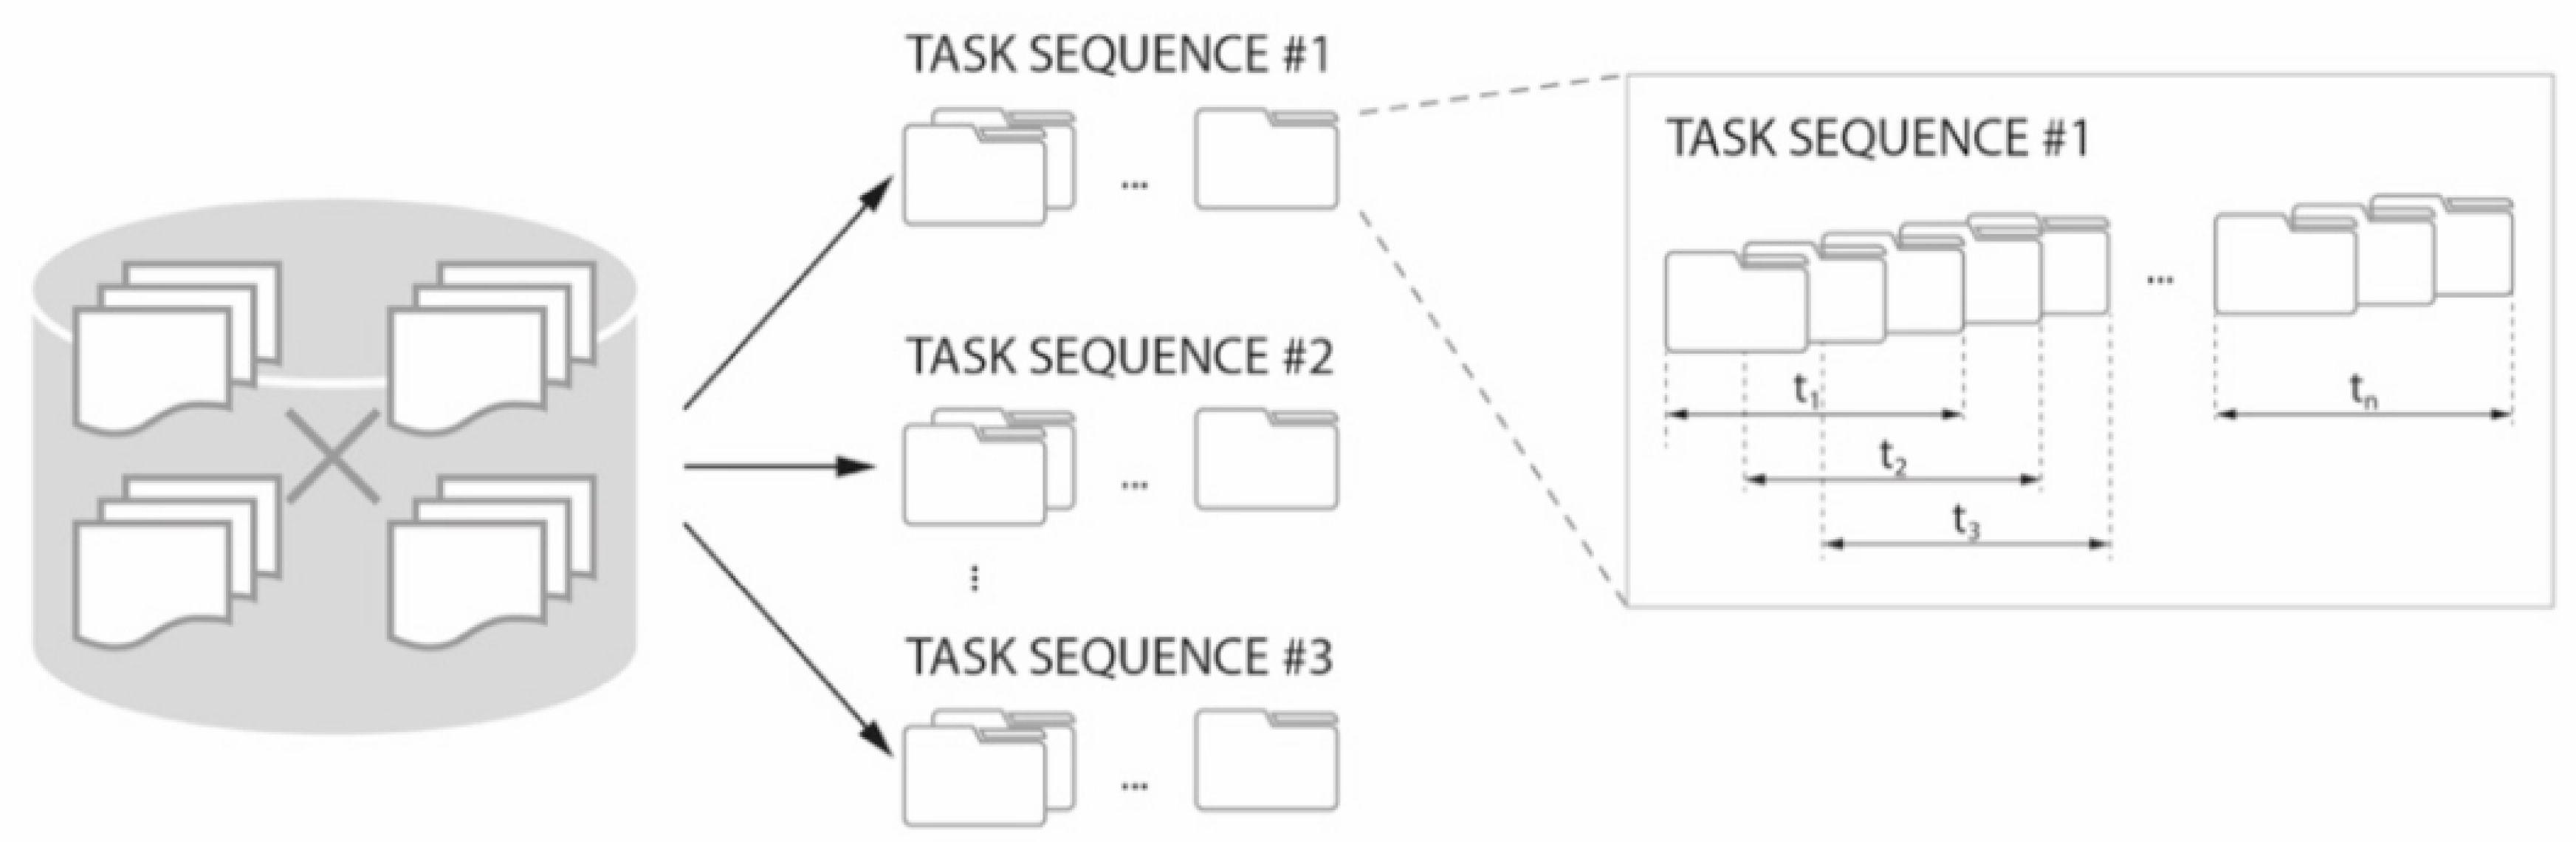
4.1. Crowdsourcing System Workflow
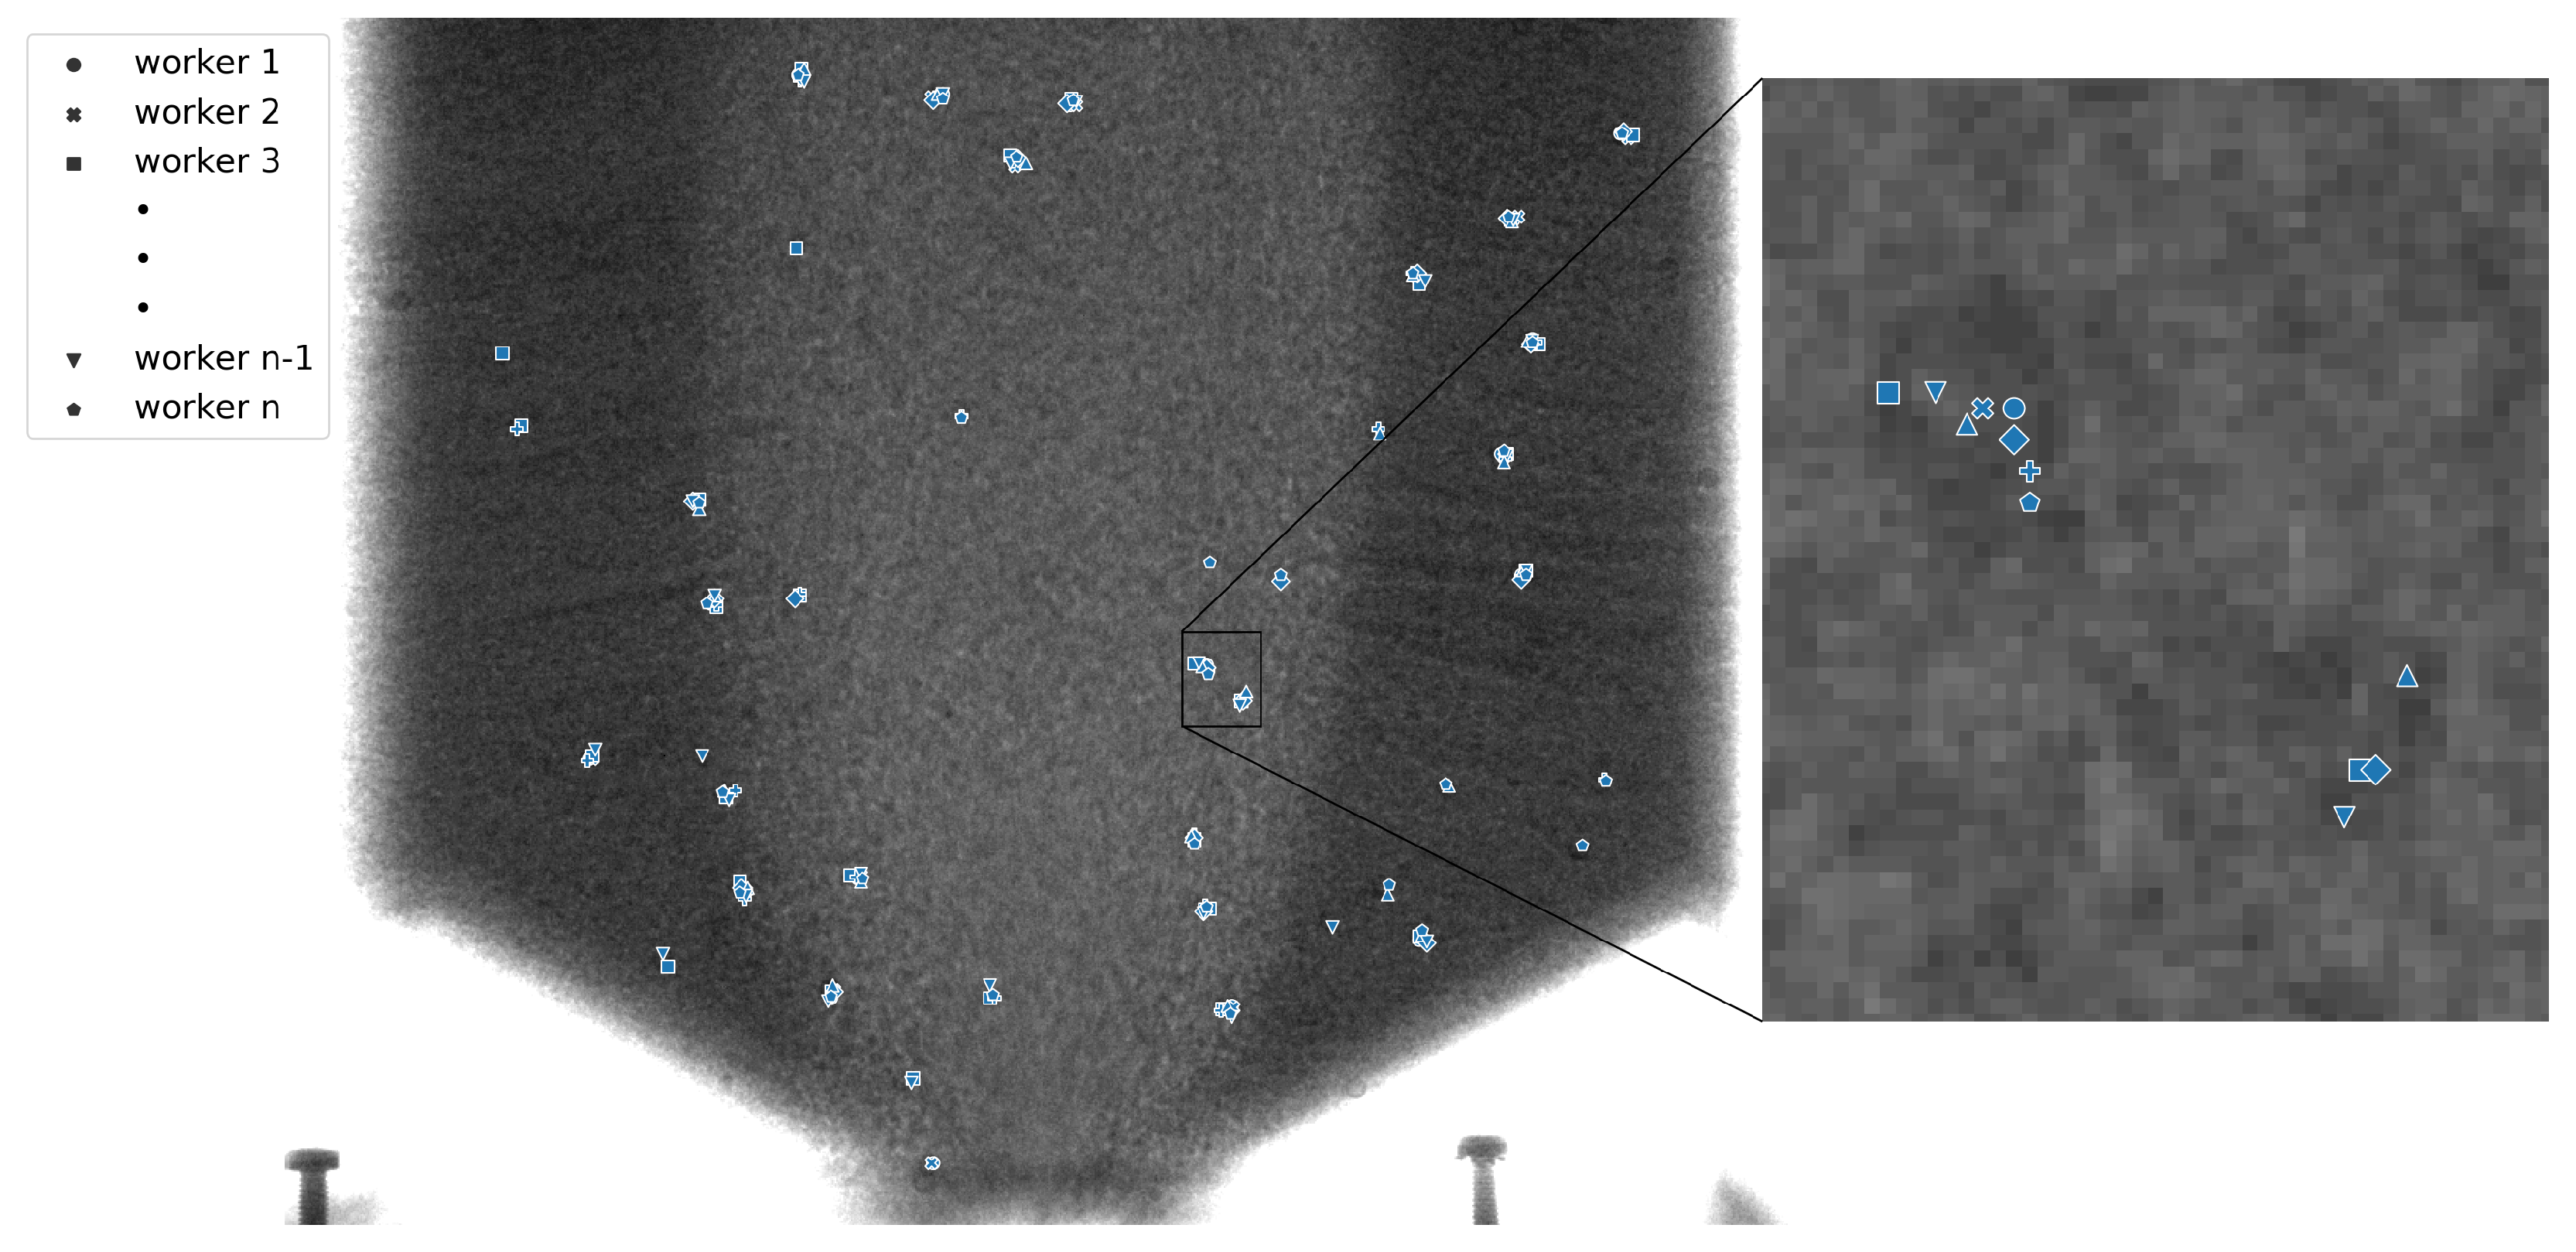
4.2. Crowdsourcing System Output
5. Results and Discussion
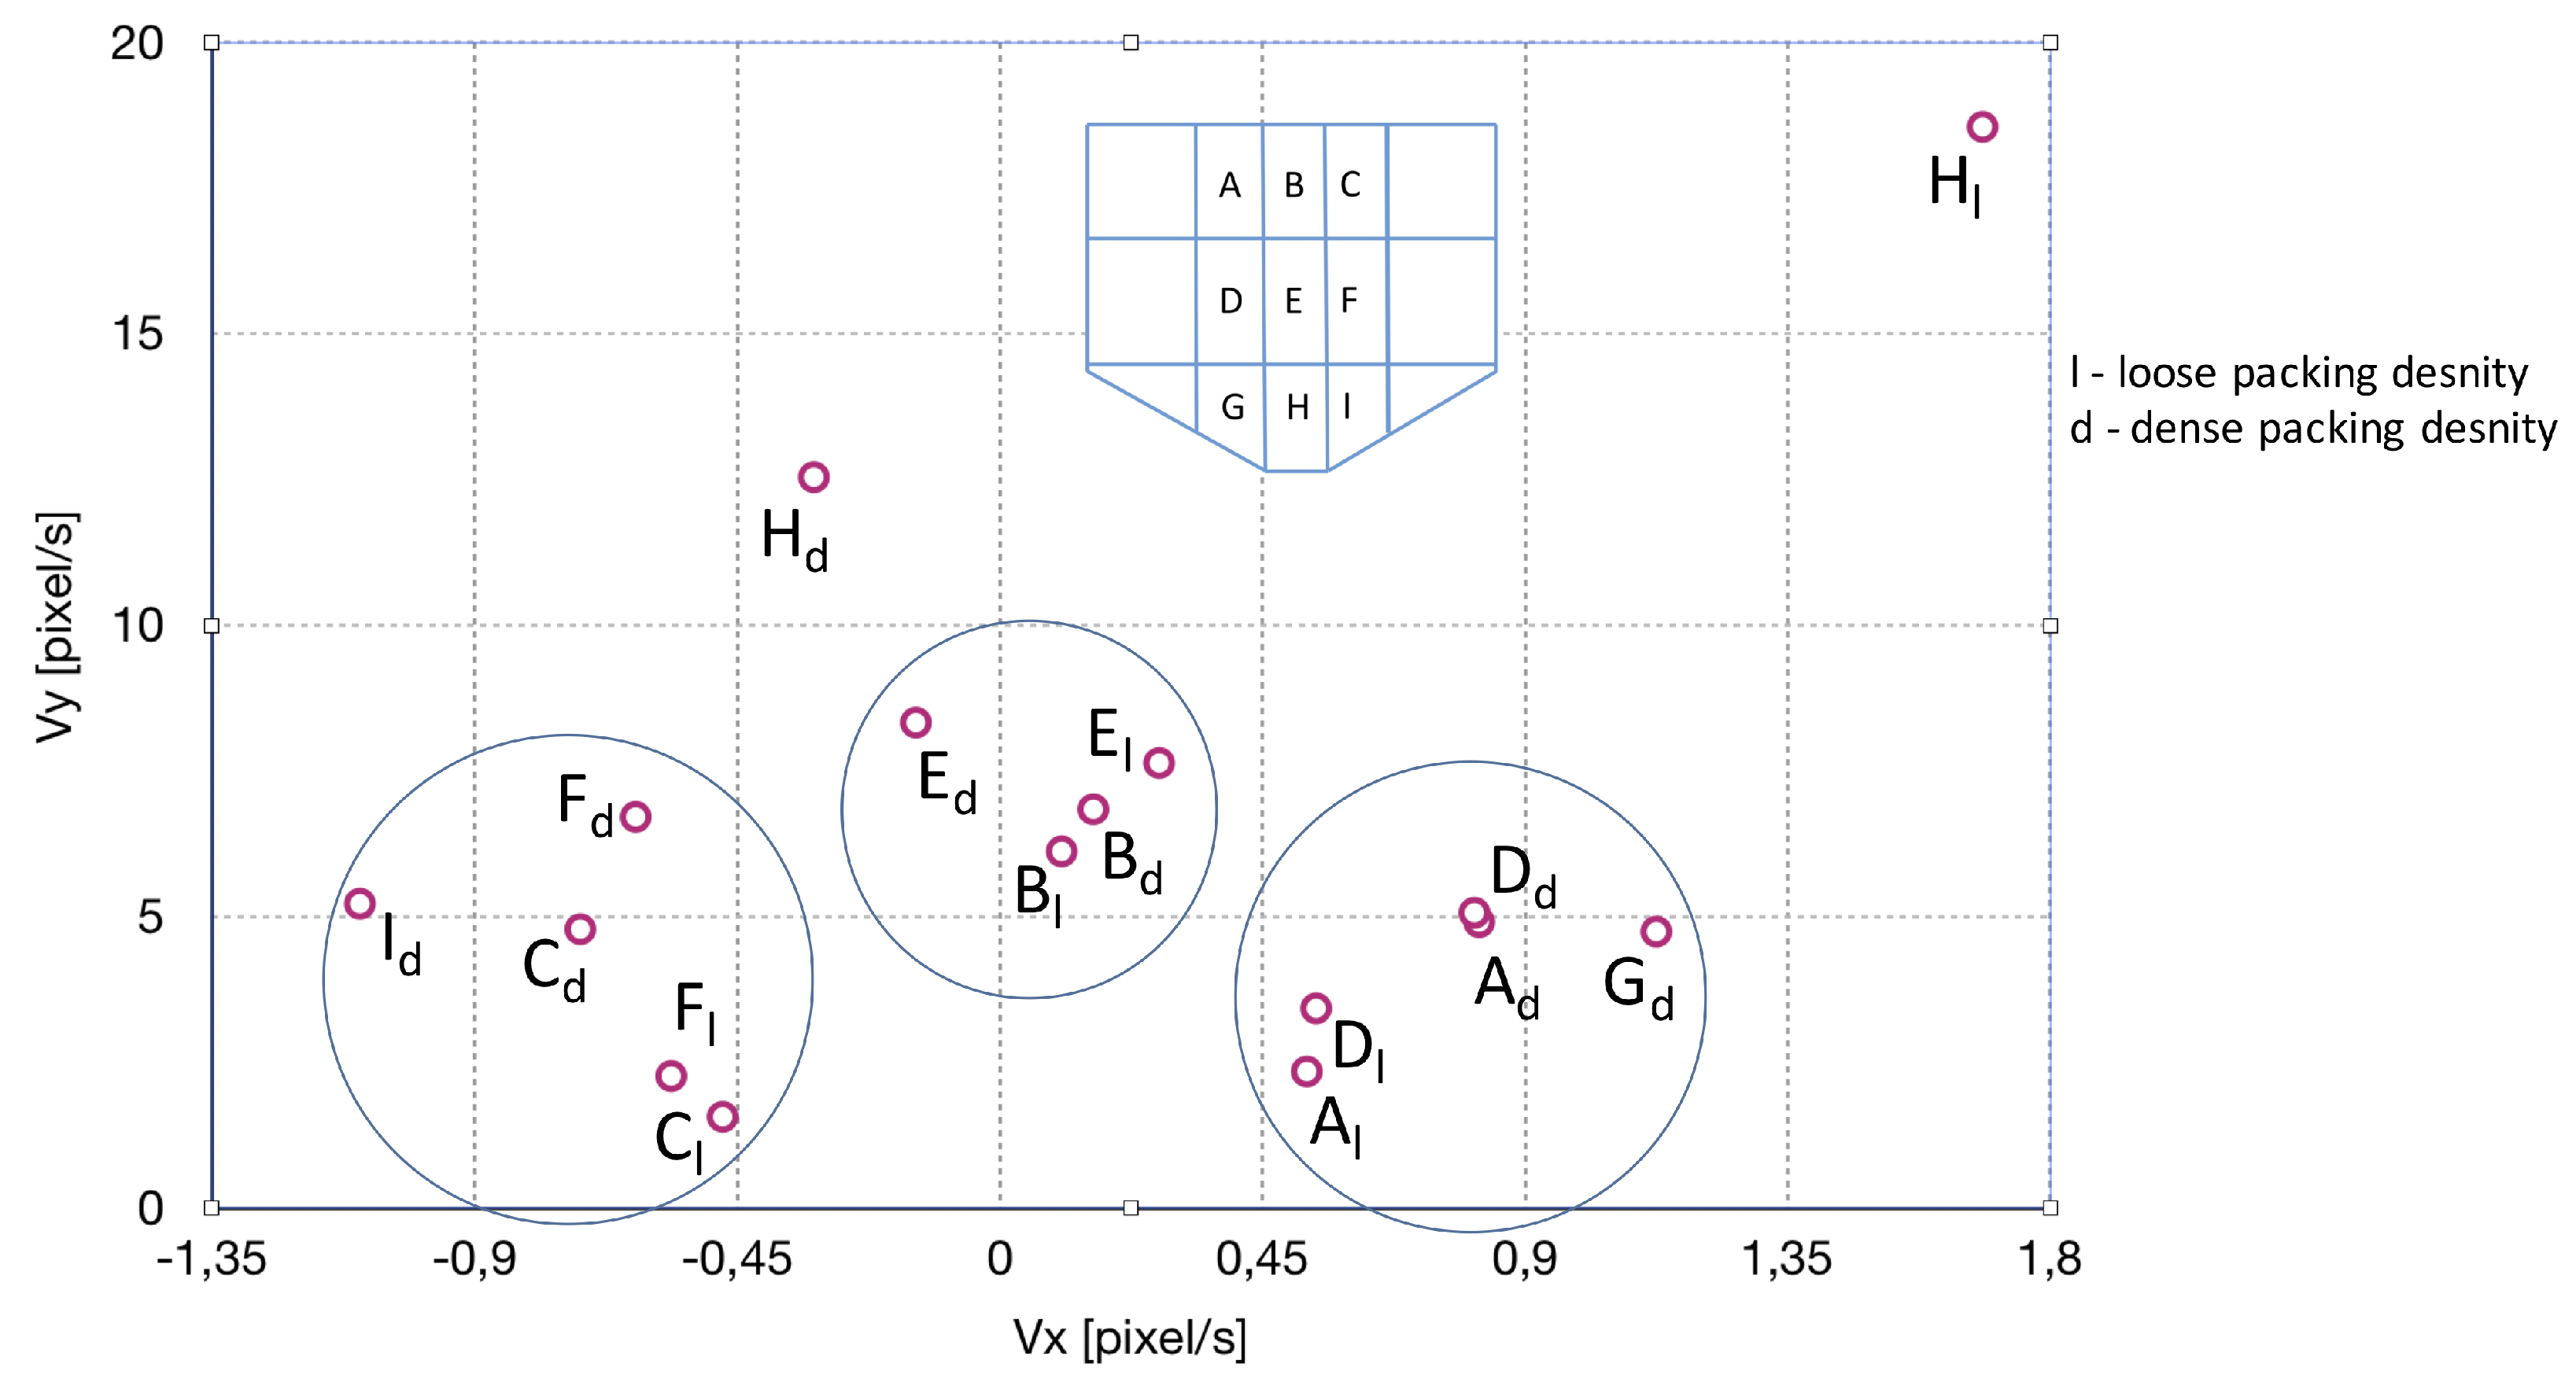
5.1. Flow Velocity Determination
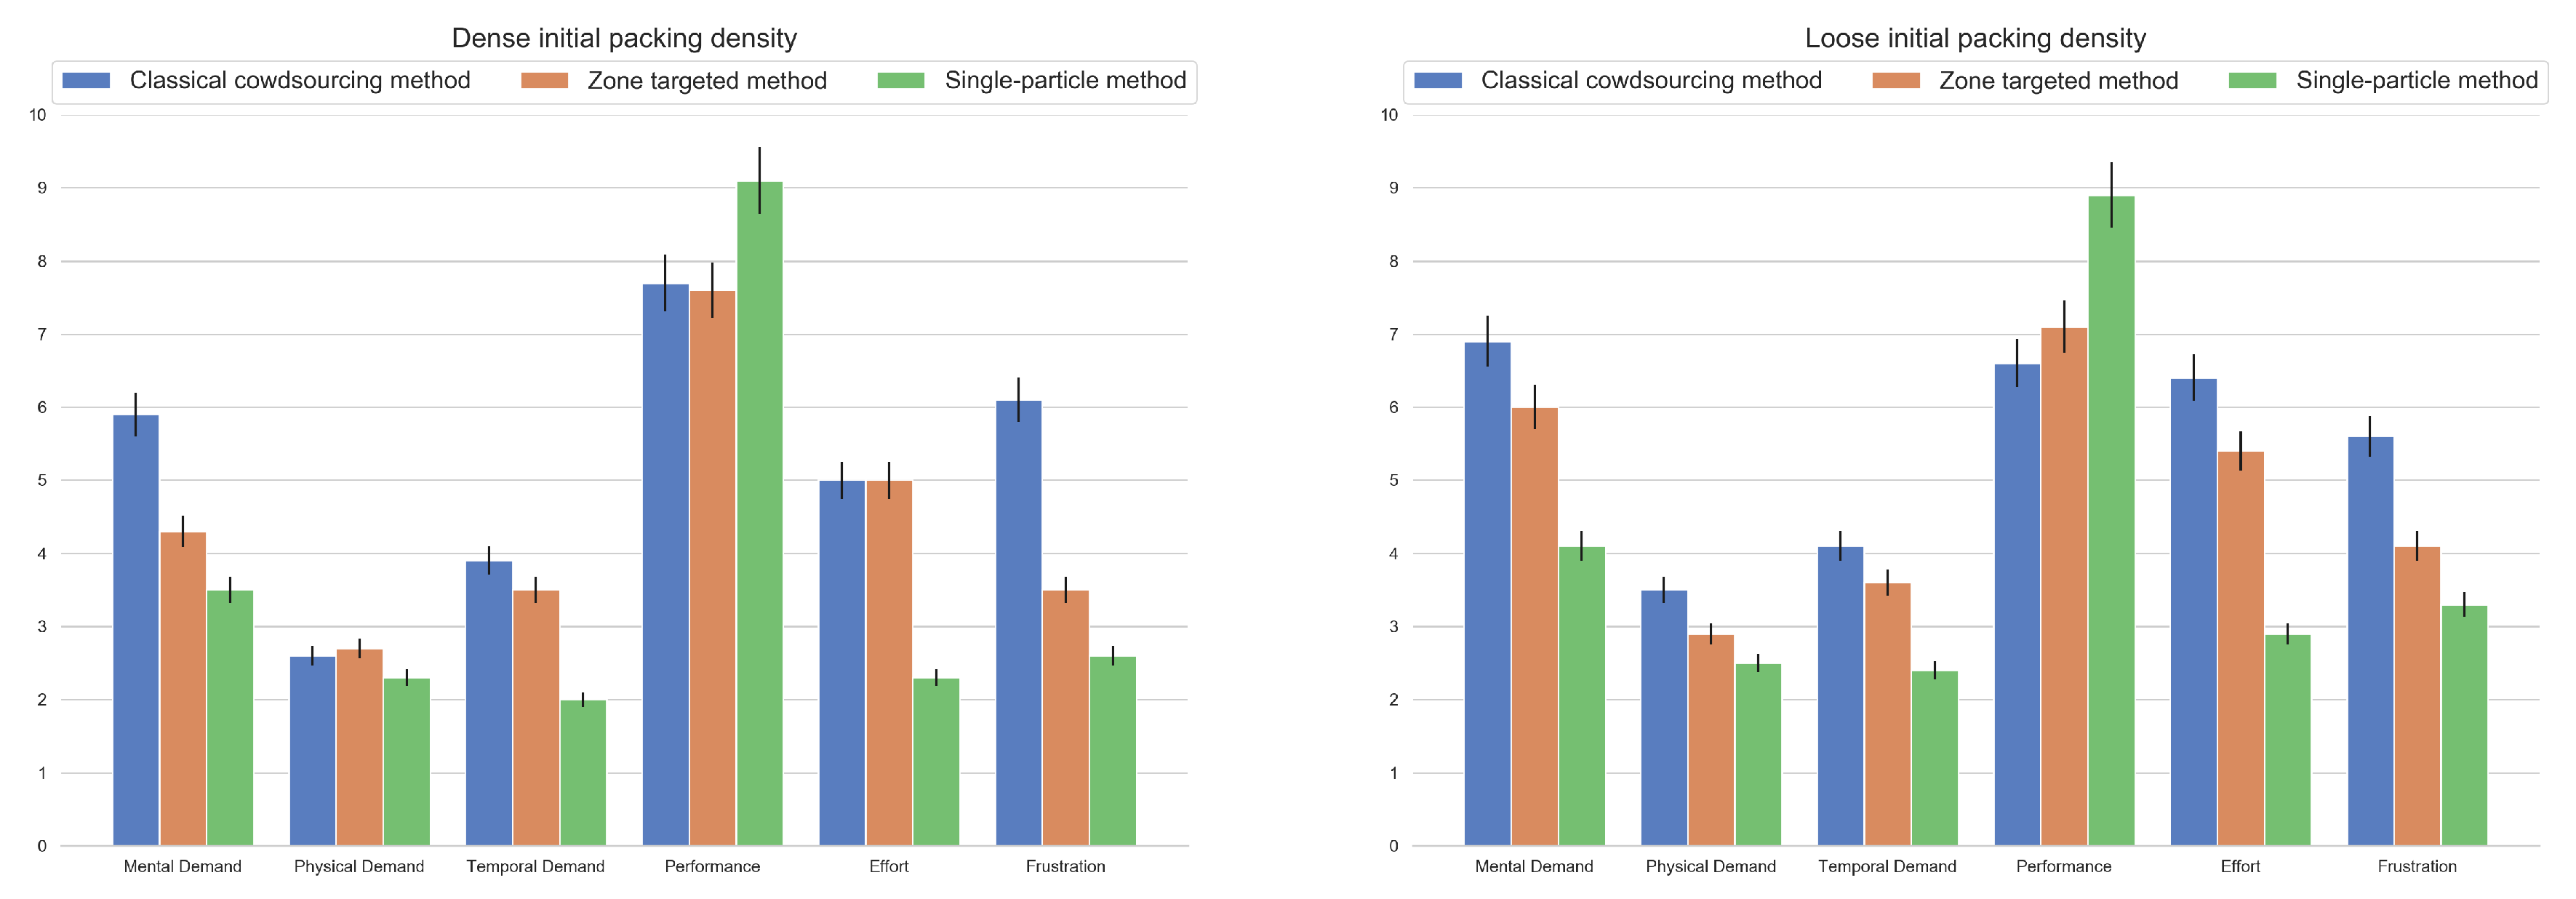
5.2. Qualitative Assessment: NASA TLX
5.3. Discussion Summary
6. Future Work
7. Conclusions
Author Contributions
Funding
Acknowledgments
Conflicts of Interest
References
- Irshad, H.; Montaser-Kouhsari, L.; Waltz, G.; Bucur, O.; Nowak, J.; Dong, F.; Knoblauch, N.W.; Beck, A.H. Crowdsourcing image annotation for nucleus detection and segmentation in computational pathology: Evaluating experts, automated methods, and the crowd. In Pacific Symposium on Biocomputing Co-Chairs; World Scientific: Singapore, 2014; pp. 294–305. [Google Scholar]
- Ghadiyaram, D.; Bovik, A.C. Crowdsourced study of subjective image quality. In Proceedings of the 2014 48th Asilomar Conference on Signals, Systems and Computers, Pacific Grove, CA, USA, 2–5 November 2014; pp. 84–88. [Google Scholar]
- Cabezas, F.; Carlier, A.; Charvillat, V.; Salvador, A.; Giro-i Nieto, X. Quality control in crowdsourced object segmentation. In Proceedings of the 2015 IEEE International Conference on Image Processing (ICIP), Quebec City, QC, Canada, 27–30 September 2015; pp. 4243–4247. [Google Scholar]
- Bernstein, M.S.; Little, G.; Miller, R.C.; Hartmann, B.; Ackerman, M.S.; Karger, D.R.; Crowell, D.; Panovich, K. Soylent: A Word Processor with a Crowd Inside. Commun. ACM 2015, 58, 85–94. [Google Scholar] [CrossRef]
- Brabham, D.C. Crowdsourcing as a model for problem solving: An introduction and cases. Convergence 2008, 14, 75–90. [Google Scholar] [CrossRef]
- Cheng, J.; Teevan, J.; Iqbal, S.T.; Bernstein, M.S. Break It Down: A Comparison of Macro- and Microtasks. In Proceedings of the 33rd Annual ACM Conference on Human Factors in Computing Systems; ACM: New York, NY, USA, 2015; pp. 4061–4064. [Google Scholar] [CrossRef]
- Luz, N.; Silva, N.; Novais, P. A survey of task-oriented crowdsourcing. Artif. Intell. Rev. 2015, 44, 187–213. [Google Scholar] [CrossRef]
- Kittur, A.; Smus, B.; Khamkar, S.; Kraut, R.E. CrowdForge: Crowdsourcing Complex Work. In Proceedings of the 24th Annual ACM Symposium on User Interface Software and Technology; ACM: New York, NY, USA, 2011; pp. 43–52. [Google Scholar] [CrossRef]
- Zheng, H.; Li, D.; Hou, W. Task Design, Motivation, and Participation in Crowdsourcing Contests. Int. J. Electron. Commer. 2011, 15, 57–88. [Google Scholar] [CrossRef]
- Grudzień, K.; Gonzalez, M.H.D.L.T. Detection of tracer particles in tomography images for analysis of gravitational flow in silo. Image Process. Commun. 2013, 18, 11–22. [Google Scholar] [CrossRef][Green Version]
- Chen, C.; Woźniak, P.W.; Romanowski, A.; Obaid, M.; Jaworski, T.; Kucharski, J.; Grudzień, K.; Zhao, S.; Fjeld, M. Using crowdsourcing for scientific analysis of industrial tomographic images. ACM Trans. Intell. Syst. Technol. (TIST) 2016, 7, 52. [Google Scholar] [CrossRef]
- Law, E.; Gajos, K.Z.; Wiggins, A.; Gray, M.L.; Williams, A. Crowdsourcing As a Tool for Research: Implications of Uncertainty. In Proceedings of the 2017 ACM Conference on Computer Supported Cooperative Work and Social Computing; ACM: New York, NY, USA, 2017; pp. 1544–1561. [Google Scholar] [CrossRef]
- Kazai, G.; Kamps, J.; Milic-Frayling, N. Worker Types and Personality Traits in Crowdsourcing Relevance Labels. In Proceedings of the 20th ACM International Conference on Information and Knowledge Management; ACM: New York, NY, USA, 2011; pp. 1941–1944. [Google Scholar] [CrossRef]
- Lyu, L.; Kantardzic, M.; Sethi, T.S. Sloppiness mitigation in crowdsourcing: Detecting and correcting bias for crowd scoring tasks. Int. J. Data Sci. Anal. 2019, 7, 179–199. [Google Scholar] [CrossRef]
- Beck, M.; Williams, R. Process tomography: A European innovation and its applications. Meas. Sci. Technol. 1996, 7, 215. [Google Scholar] [CrossRef]
- Sideman, S.; Hijikata, K. Imaging in Transport Processes; Begell House: Danbury, CT, USA, 1993; Volume 621. [Google Scholar]
- Romanowski, A.; Grudzien, K.; Chaniecki, Z.; Woźniak, P. Contextual processing of ECT measurement information towards detection of process emergency states. In Proceedings of the 2013 13th International Conference on Hybrid Intelligent Systems (HIS), Gammarth, Tunisia, 4–6 December 2013; pp. 291–297. [Google Scholar]
- Banasiak, R.; Wajman, R.; Jaworski, T.; Fiderek, P.; Fidos, H.; Nowakowski, J.; Sankowski, D. Study on two-phase flow regime visualization and identification using 3D electrical capacitance tomography and fuzzy-logic classification. Int. J. Multiph. Flow 2014, 58, 1–14. [Google Scholar] [CrossRef]
- Wajman, R.; Fiderek, P.; Fidos, H.; Jaworski, T.; Nowakowski, J.; Sankowski, D.; Banasiak, R. Metrological evaluation of a 3D electrical capacitance tomography measurement system for two-phase flow fraction determination. Meas. Sci. Technol. 2013, 24, 065302. [Google Scholar] [CrossRef]
- Rymarczyk, T. New methods to determine moisture areas by electrical impedance tomography. Int. J. Appl. Electromagn. Mech. 2016, 52, 79–87. [Google Scholar] [CrossRef]
- Rymarczyk, T. Using electrical impedance tomography to monitoring flood banks. Int. J. Appl. Electromagn. Mech. 2014, 45, 489–494. [Google Scholar] [CrossRef]
- Rymarczyk, T.; Adamkiewicz, P.; Duda, K.; Szumowski, J.; Sikora, J. New electrical tomographic method to determine dampness in historical buildings. Arch. Electr. Eng. 2016, 65, 273–283. [Google Scholar] [CrossRef]
- Tjugum, S.; Hjertaker, B.; Johansen, G. Multiphase flow regime identification by multibeam gamma-ray densitometry. Meas. Sci. Technol. 2002, 13, 1319. [Google Scholar] [CrossRef]
- Hampel, U.; Bieberle, A.; Hoppe, D.; Kronenberg, J.; Schleicher, E.; Suhnel, T.; Zimmermann, F.; Zippe, C. High resolution gamma ray tomography scanner for flow measurement and non-destructive testing applications. Rev. Sci. Instrum. 2007, 78, 103704. [Google Scholar] [CrossRef]
- Fukushima, E. Nuclear magnetic resonance as a tool to study flow. Annu. Rev. Fluid Mech. 1999, 31, 95–123. [Google Scholar] [CrossRef]
- Bieberle, M.; Fischer, F.; Schleicher, E.; Koch, D.; Menz, H.J.; Mayer, H.G.; Hampel, U. Experimental two-phase flow measurement using ultra fast limited-angle-type electron beam X-ray computed tomography. Exp. Fluids 2009, 47, 369. [Google Scholar] [CrossRef]
- Figueiredo, M.; Goncalves, J.; Nakashima, A.; Fileti, A.; Carvalho, R. The use of an ultrasonic technique and neural networks for identification of the flow pattern and measurement of the gas volume fraction in multiphase flows. Exp. Therm. Fluid Sci. 2016, 70, 29–50. [Google Scholar] [CrossRef]
- Fischer, F.; Hampel, U. Ultra fast electron beam X-ray computed tomography for two-phase flow measurement. Nucl. Eng. Des. 2010, 240, 2254–2259. [Google Scholar] [CrossRef]
- Guillard, F.; Marks, B.; Einav, I. Dynamic X-ray radiography reveals particle size and shape orientation fields during granular flow. Sci. Rep. 2017, 7, 8155. [Google Scholar] [CrossRef]
- Schulze, D. Powders and Bulk Solids. Behavior, Characterization, Storage and Flow; Springer: Berlin/Heidelberg, Germany, 2008; pp. 35–74. [Google Scholar]
- Michalowski, R. Flow of granular material through a plane hopper. Powder Technol. 1984, 39, 29–40. [Google Scholar] [CrossRef]
- Tejchman, J. Confined Granular Flow in Silos: Experimental and Numerical Investigations; Springer Science & Business Media: Berlin/Heidelberg, Germany, 2013. [Google Scholar]
- Wójcik, M.; Tejchman, J. Modeling of shear localization during confined granular flow in silos within non-local hypoplasticity. Powder Technol. 2009, 192, 298–310. [Google Scholar] [CrossRef]
- Choi, J.; Kudrolli, A.; Bazant, M.Z. Velocity profile of granular flows inside silos and hoppers. J. Phys. Condens. Matter 2005, 17, S2533. [Google Scholar] [CrossRef]
- Tüzün, U.; Nedderman, R. An investigation of the flow boundary during steady-state discharge from a funnel-flow bunker. Powder Technol. 1982, 31, 27–43. [Google Scholar] [CrossRef]
- Fu, S.; Biwolé, P.H.; Mathis, C. A Comparative Study of Particle Image Velocimetry (PIV) and Particle Tracking Velocimetry (PTV) for Airflow Measurement. Int. J. Mech. Mechatron. Eng. 2015, 9, 40–45. [Google Scholar]
- Tai, C.; Hsiau, S. Dynamic behaviors of powders in a vibrating bed. Powder Technol. 2004, 139, 221–232. [Google Scholar] [CrossRef]
- Khakhar, D.V. Rheology and Mixing of Granular Materials. Macromol. Mater. Eng. 2011, 296, 278–289. [Google Scholar] [CrossRef]
- Pudasaini, S.P.; Hsiau, S.S.; Wang, Y.; Hutter, K. Velocity measurements in dry granular avalanches using particle image velocimetry technique and comparison with theoretical predictions. Phys. Fluids 2005, 17, 093301. [Google Scholar] [CrossRef]
- Slominski, C.; Niedostatkiewicz, M.; Tejchman, J. Application of particle image velocimetry (PIV) for deformation measurement during granular silo flow. Powder Technol. 2007, 173, 1–18. [Google Scholar] [CrossRef]
- Chen, X.; Zhong, W.; Heindel, T.J. Using stereo XPTV to determine cylindrical particle distribution and velocity in a binary fluidized bed. AIChE J. 2019, 65, 520–535. [Google Scholar] [CrossRef]
- Chung, Y.; Hsiau, S.; Liao, H.; Ooi, J. An improved PTV technique to evaluate the velocity field of non-spherical particles. Powder Technol. 2010, 202, 151–161. [Google Scholar] [CrossRef]
- Melling, A. Tracer particles and seeding for particle image velocimetry. Meas. Sci. Technol. 1997, 8, 1406–1416. [Google Scholar] [CrossRef]
- Babout, L.; Grudzien, K.; Maire, E.; Withers, P.J. Influence of wall roughness and packing density on stagnant zone formation during funnel flow discharge from a silo: An X-ray imaging study. Chem. Eng. Sci. 2013, 97, 210–224. [Google Scholar] [CrossRef]
- Romanowski, A. Big Data-Driven Contextual Processing Methods for Electrical Capacitance Tomography. IEEE Trans. Ind. Inform. 2019, 15, 1609–1618. [Google Scholar] [CrossRef]
- Rymarczyk, T.; Sikora, J. Applying industrial tomography to control and optimization flow systems. Open Phys. 2018, 16, 332–345. [Google Scholar] [CrossRef]
- Floru, R.; Cail, F.; Elias, R. Psychophysiological changes during a VDU repetitive task. Ergonomics 1985, 28, 1455–1468. [Google Scholar] [CrossRef]
- Jelliti, I.; Romanowski, A.; Grudzień, K. Design of Crowdsourcing System for Analysis of Gravitational Flow using X-ray Visualization. In Proceedings of the 2016 Federated Conference on Computer Science and Information Systems, Gdansk, Poland, 11–14 September 2016. [Google Scholar]
- Staron, L.; Lagrée, P.Y.; Popinet, S. Continuum simulation of the discharge of the granular silo. Eur. Phys. J. E 2014, 37, 5. [Google Scholar] [CrossRef]
- Knierim, P.; Kiss, F.; Schmidt, A. Look Inside: Understanding Thermal Flux Through Augmented Reality. In Proceedings of the 2018 IEEE International Symposium on Mixed and Augmented Reality Adjunct (ISMAR-Adjunct), Munich, Germany, 16–20 October 2018; pp. 170–171. [Google Scholar] [CrossRef]
- Fraga-Lamas, P.; Fernández-Caramés, T.M.; Blanco-Novoa, Ó.; Vilar-Montesinos, M.A. A Review on Industrial Augmented Reality Systems for the Industry 4.0 Shipyard. IEEE Access 2018, 6, 13358–13375. [Google Scholar] [CrossRef]
- Eschen, H.; Kötter, T.; Rodeck, R.; Harnisch, M.; Schüppstuhl, T. Augmented and Virtual Reality for Inspection and Maintenance Processes in the Aviation Industry. Procedia Manuf. 2018, 19, 156–163. [Google Scholar] [CrossRef]


| 0.8213 | 4.9124 | 0.1602 | 6.8481 | −0.7188 | 4.7917 |
| A | B | C | |||
| 4.9806 | 16.49% | 6.8500 | 2.34% | 4.8453 | −14.83% |
| 0.8131 | 5.0736 | −0.1438 | 8.3339 | −0.6240 | 6.7173 |
| D | E | F | |||
| 5.1383 | 15.82% | 8.3352 | −1.73% | 6.7462 | −9.25% |
| 1.1250 | 4.7500 | −0.3187 | 12.5440 | −1.09651 | 5.2293 |
| G | H | I | |||
| 4.8814 | 23.05% | 12.5480 | −2.54% | 5.3430 | −20.52% |
| 1.3901 | 8.3142 | 0.2711 | 11.5905 | −1.2165 | 8.1099 |
| A | B | C | |||
| 1.3762 | 8.5871 | −0.2434 | 14.1052 | −1.0562 | 11.3690 |
| D | E | F | |||
| 1.9041 | 8.0394 | −0.5394 | 21.2306 | −1.8558 | 8.8506 |
| G | H | I | |||
| 0.5263 | 2.3509 | 0.1062 | 6.1258 | −0.4750 | 1.5750 |
| A | B | C | |||
| 2.4091 | 21.85% | 6.1267 | 1.73% | 1.6451 | −28.87% |
| 0.5415 | 3.4333 | 0.2735 | 7.6415 | −0.5631 | 2.2733 |
| D | E | F | |||
| 3.4758 | 15.58% | 7.6464 | 3.58% | 2.3420 | −24.04% |
| 1.6844 | 18.5511 | ||||
| G | H | I | |||
| 18.6274 | 9.04% | ||||
| 0.9808 | 3.9789 | 0.1797 | 10.3679 | −0.8039 | 2.6657 |
| A | B | C | |||
| 0.9165 | 5.8109 | 0.4629 | 12.9332 | −0.9530 | 3.8475 |
| D | E | F | |||
| 0.0000 | 0.0000 | 2.8509 | 31.3978 | 0.0000 | 0.0000 |
| G | H | I | |||
| Classical | Zone Targeted | Single-Particle Targeted | ||||
|---|---|---|---|---|---|---|
| Time (avg) | SD | Time | SD | Time | SD | |
| 1 frame | 58.47 | 36.26 | 18.57 | 15.13 | 5.94 | 4.20 |
| 10 frames | 584.69 | 262.51 | 185.70 | 121.65 | 59.41 | 12.30 |
| 100 frames | 5800.53 | 1952.39 | 1845.58 | 978.37 | 591.57 | 68.43 |
| Zone | Time | SD |
|---|---|---|
| A | 9.60 | 2.70 |
| B | 13.33 | 3.67 |
| C | 47.07 | 18.24 |
| D | 9.11 | 3.62 |
| E | 19.04 | 6.38 |
| F | 8.56 | 5.18 |
| G | 12.80 | 4.62 |
| H | 15.66 | 4.92 |
| I | 31.98 | 15.78 |
© 2019 by the authors. Licensee MDPI, Basel, Switzerland. This article is an open access article distributed under the terms and conditions of the Creative Commons Attribution (CC BY) license (http://creativecommons.org/licenses/by/4.0/).
Share and Cite
Romanowski, A.; Łuczak, P.; Grudzień, K. X-ray Imaging Analysis of Silo Flow Parameters Based on Trace Particles Using Targeted Crowdsourcing. Sensors 2019, 19, 3317. https://doi.org/10.3390/s19153317
Romanowski A, Łuczak P, Grudzień K. X-ray Imaging Analysis of Silo Flow Parameters Based on Trace Particles Using Targeted Crowdsourcing. Sensors. 2019; 19(15):3317. https://doi.org/10.3390/s19153317
Chicago/Turabian StyleRomanowski, Andrzej, Piotr Łuczak, and Krzysztof Grudzień. 2019. "X-ray Imaging Analysis of Silo Flow Parameters Based on Trace Particles Using Targeted Crowdsourcing" Sensors 19, no. 15: 3317. https://doi.org/10.3390/s19153317
APA StyleRomanowski, A., Łuczak, P., & Grudzień, K. (2019). X-ray Imaging Analysis of Silo Flow Parameters Based on Trace Particles Using Targeted Crowdsourcing. Sensors, 19(15), 3317. https://doi.org/10.3390/s19153317