Removal of Motion Artifacts in Photoplethysmograph Sensors during Intensive Exercise for Accurate Heart Rate Calculation Based on Frequency Estimation and Notch Filtering


Abstract
1. Introduction
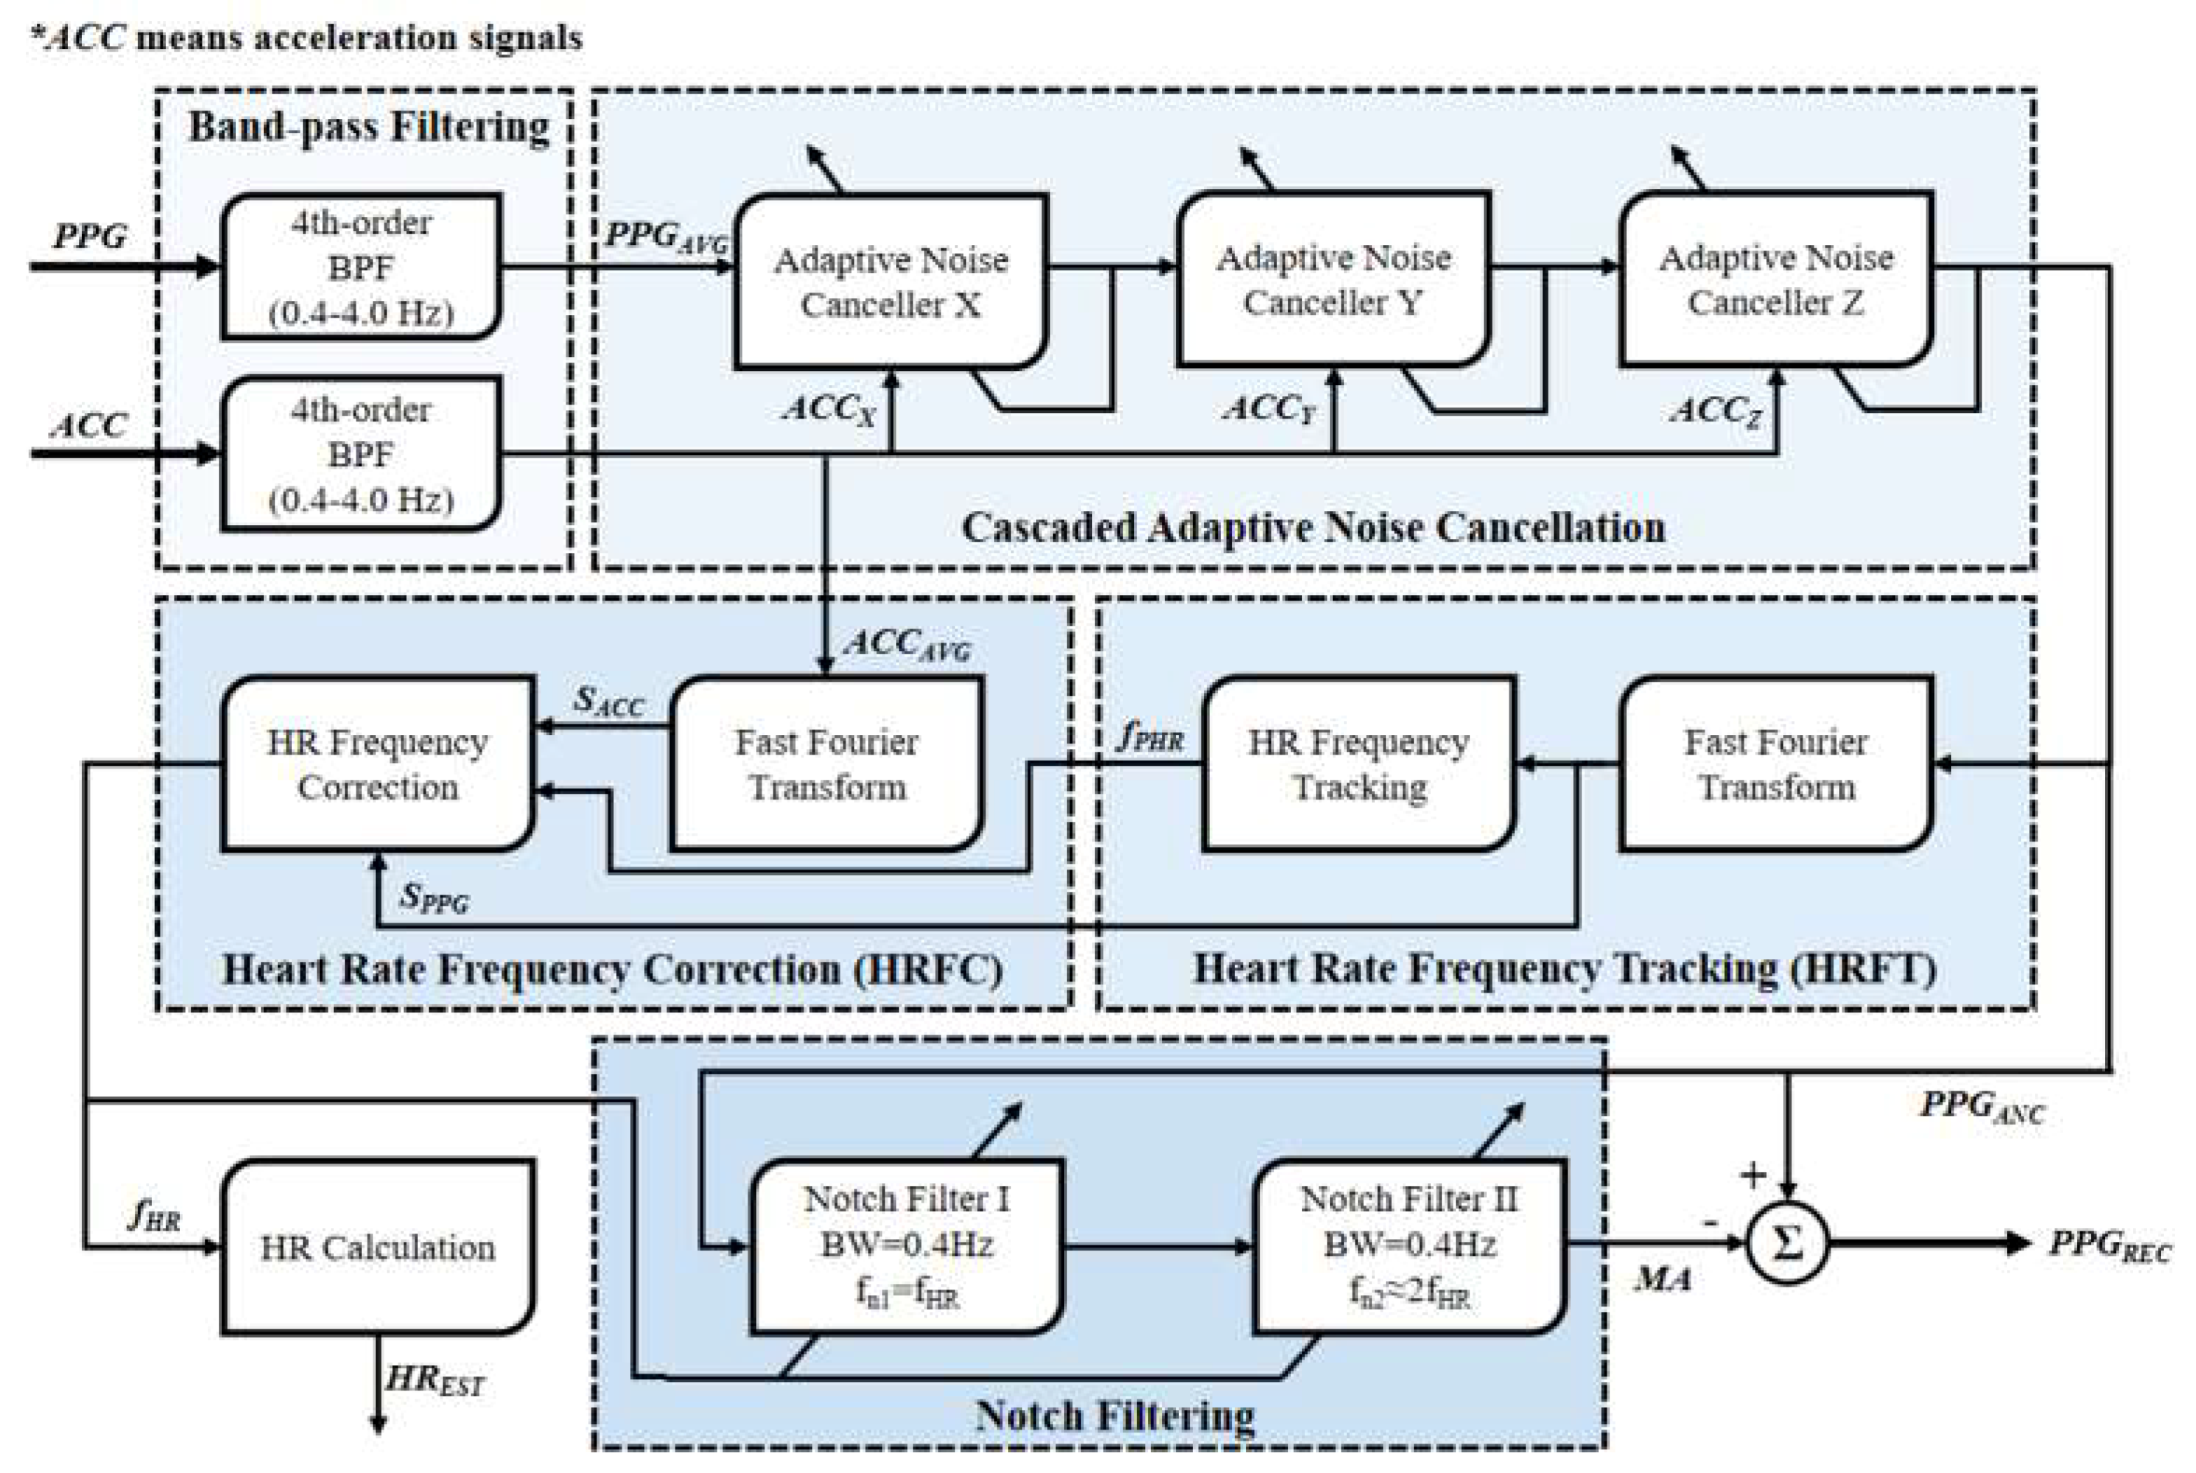
2. Proposed Method
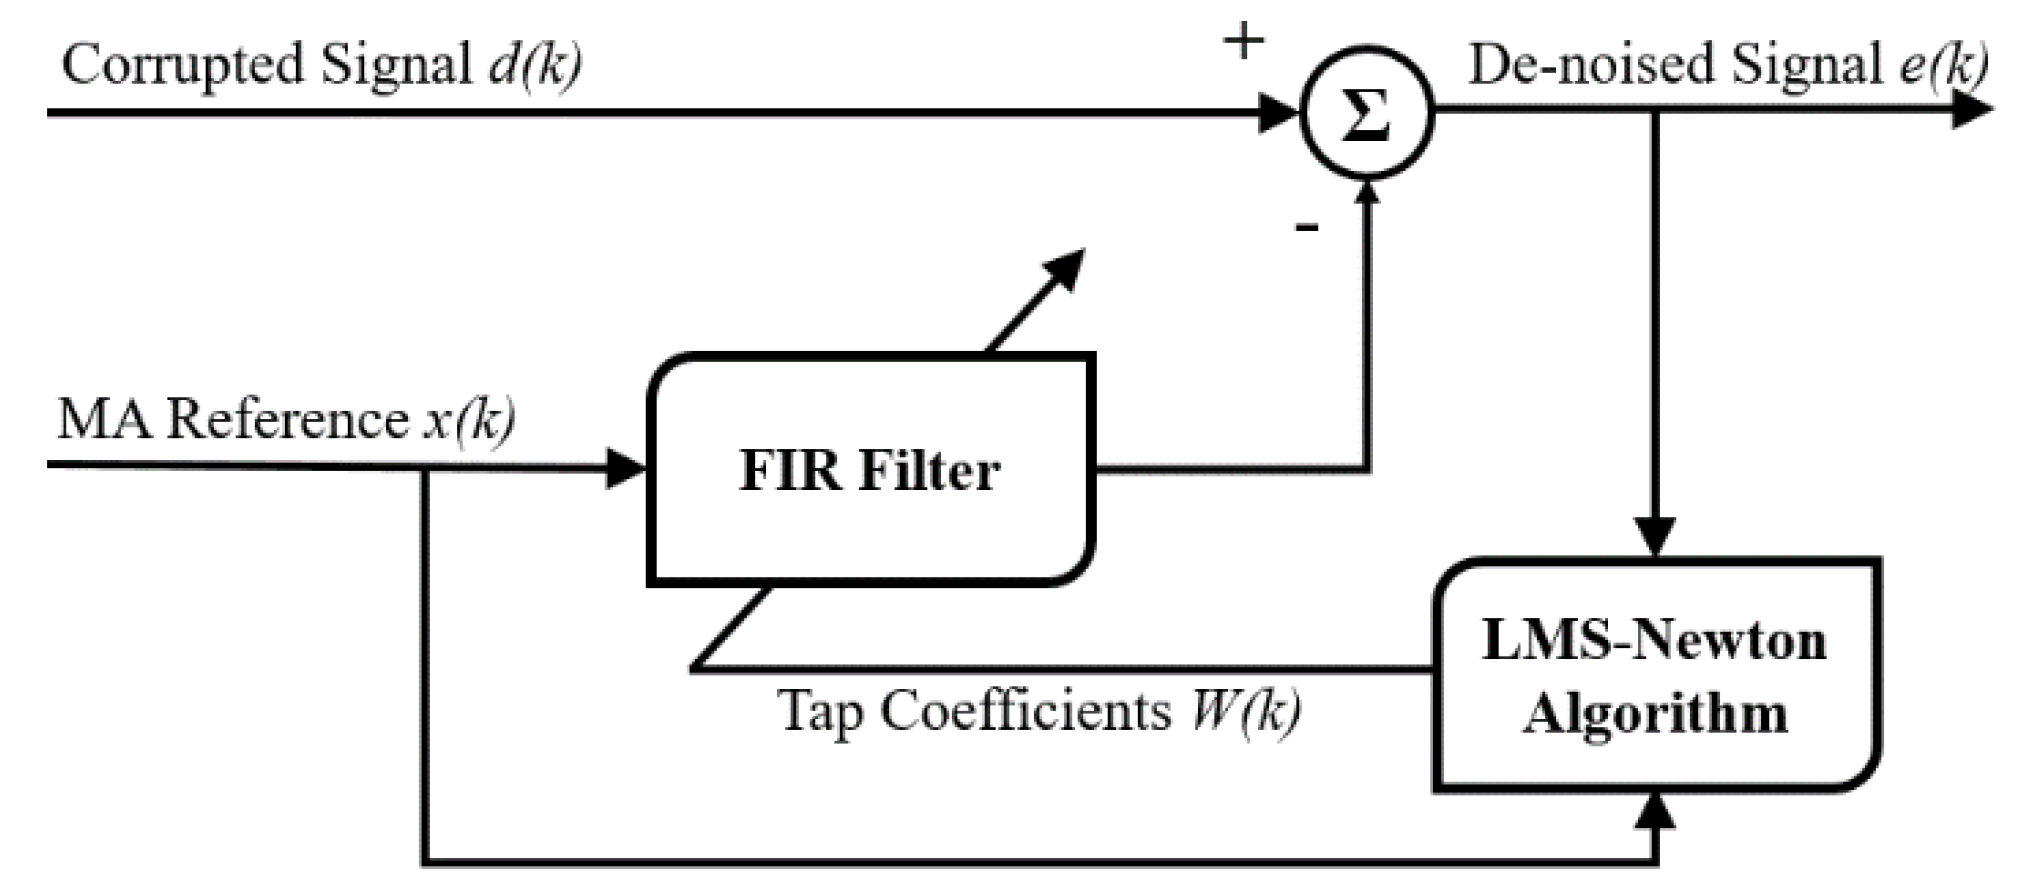
2.1. Cascaded Adaptive Noise Cancellation
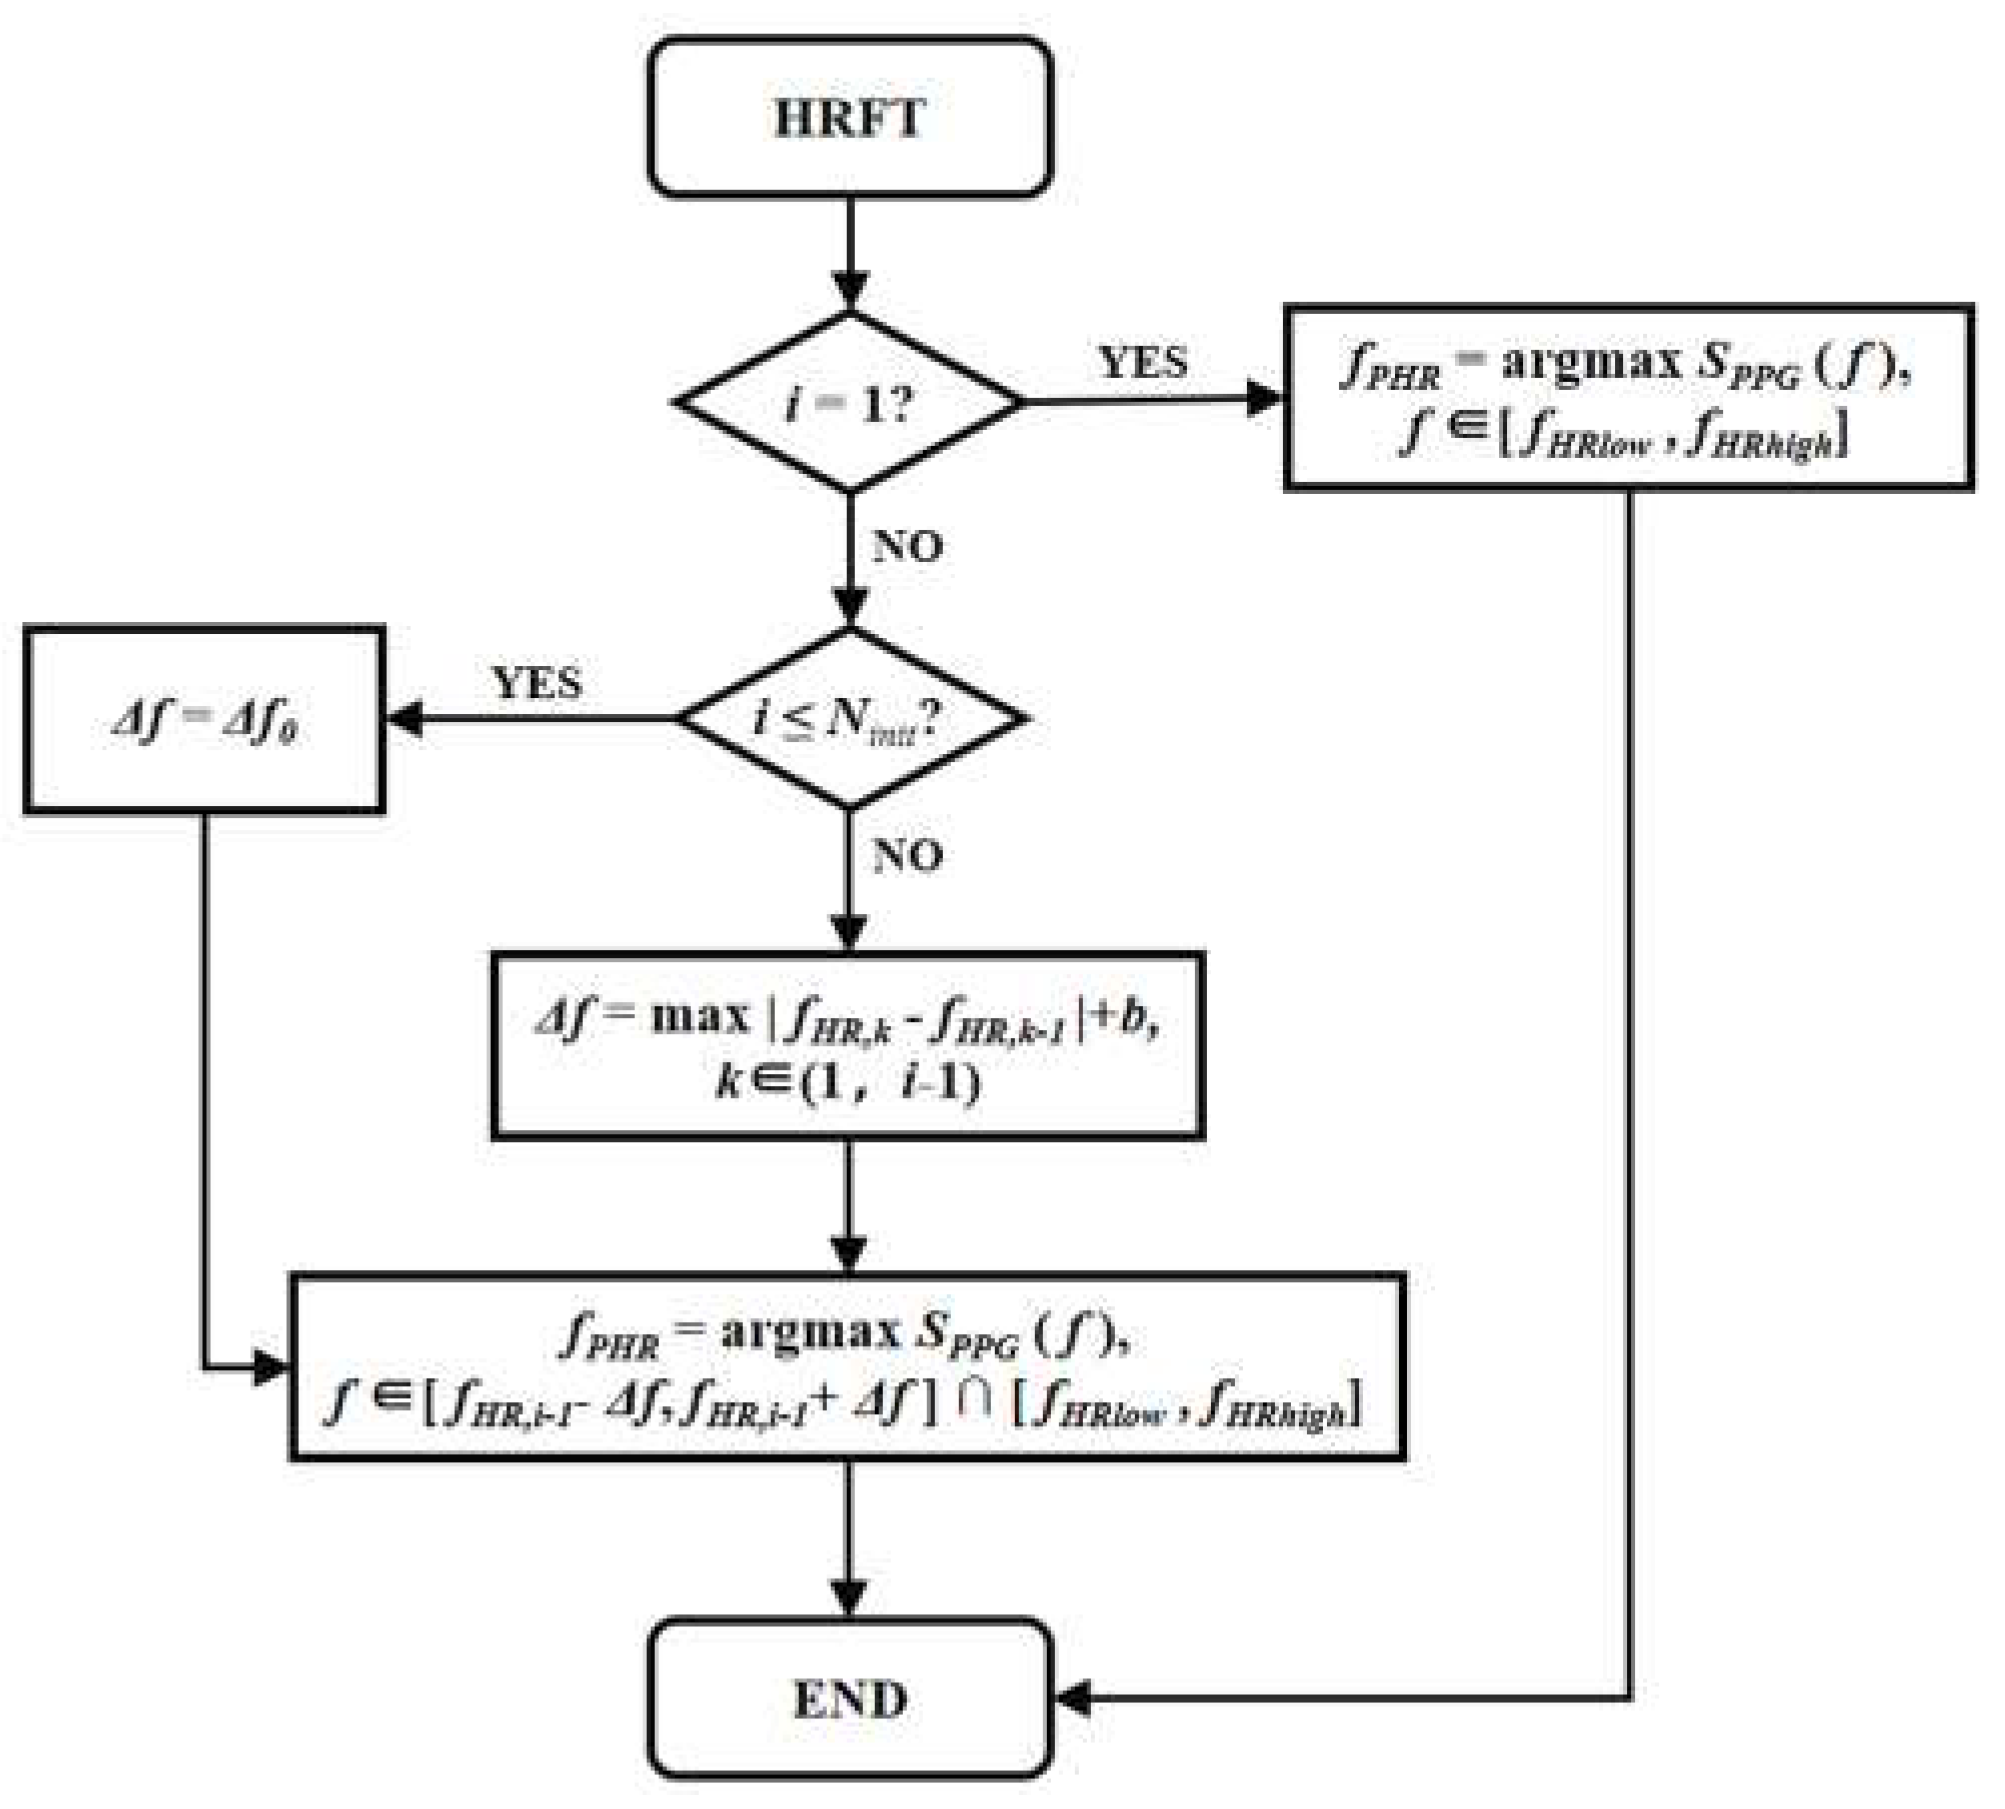
2.2. Heart Rate Frequency Tracking
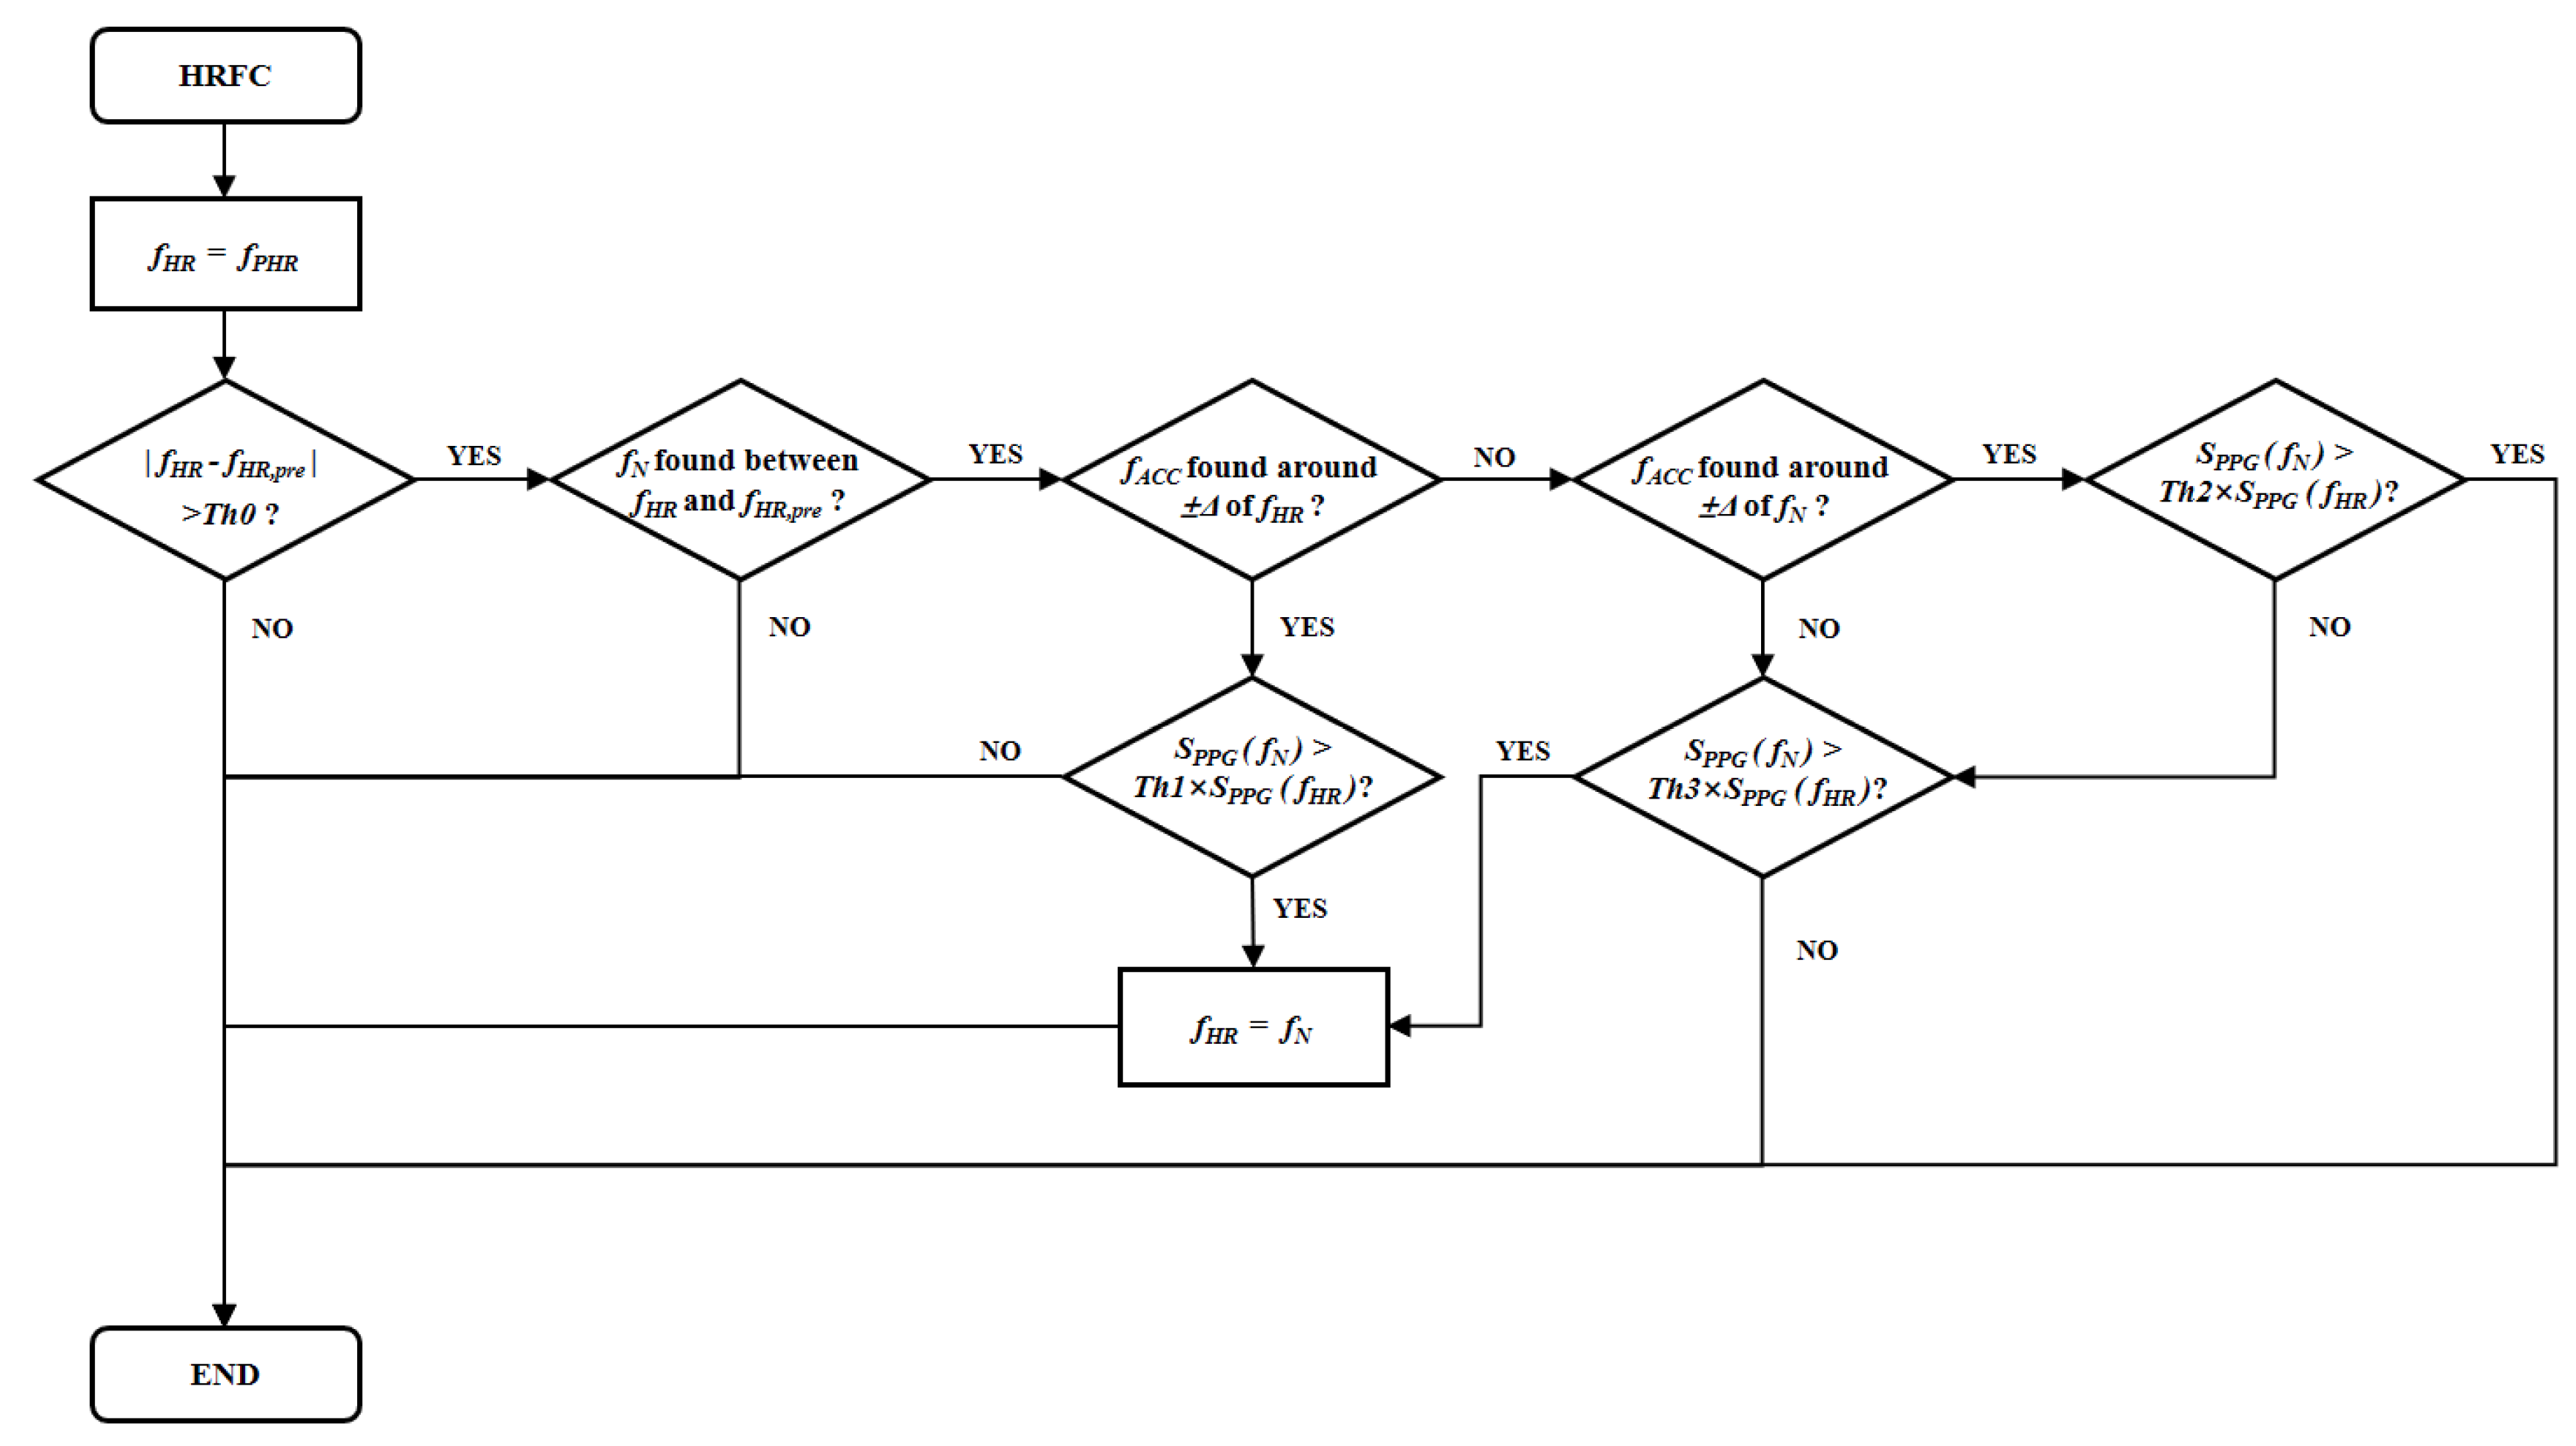
2.3. Heart Rate Frequency Correction
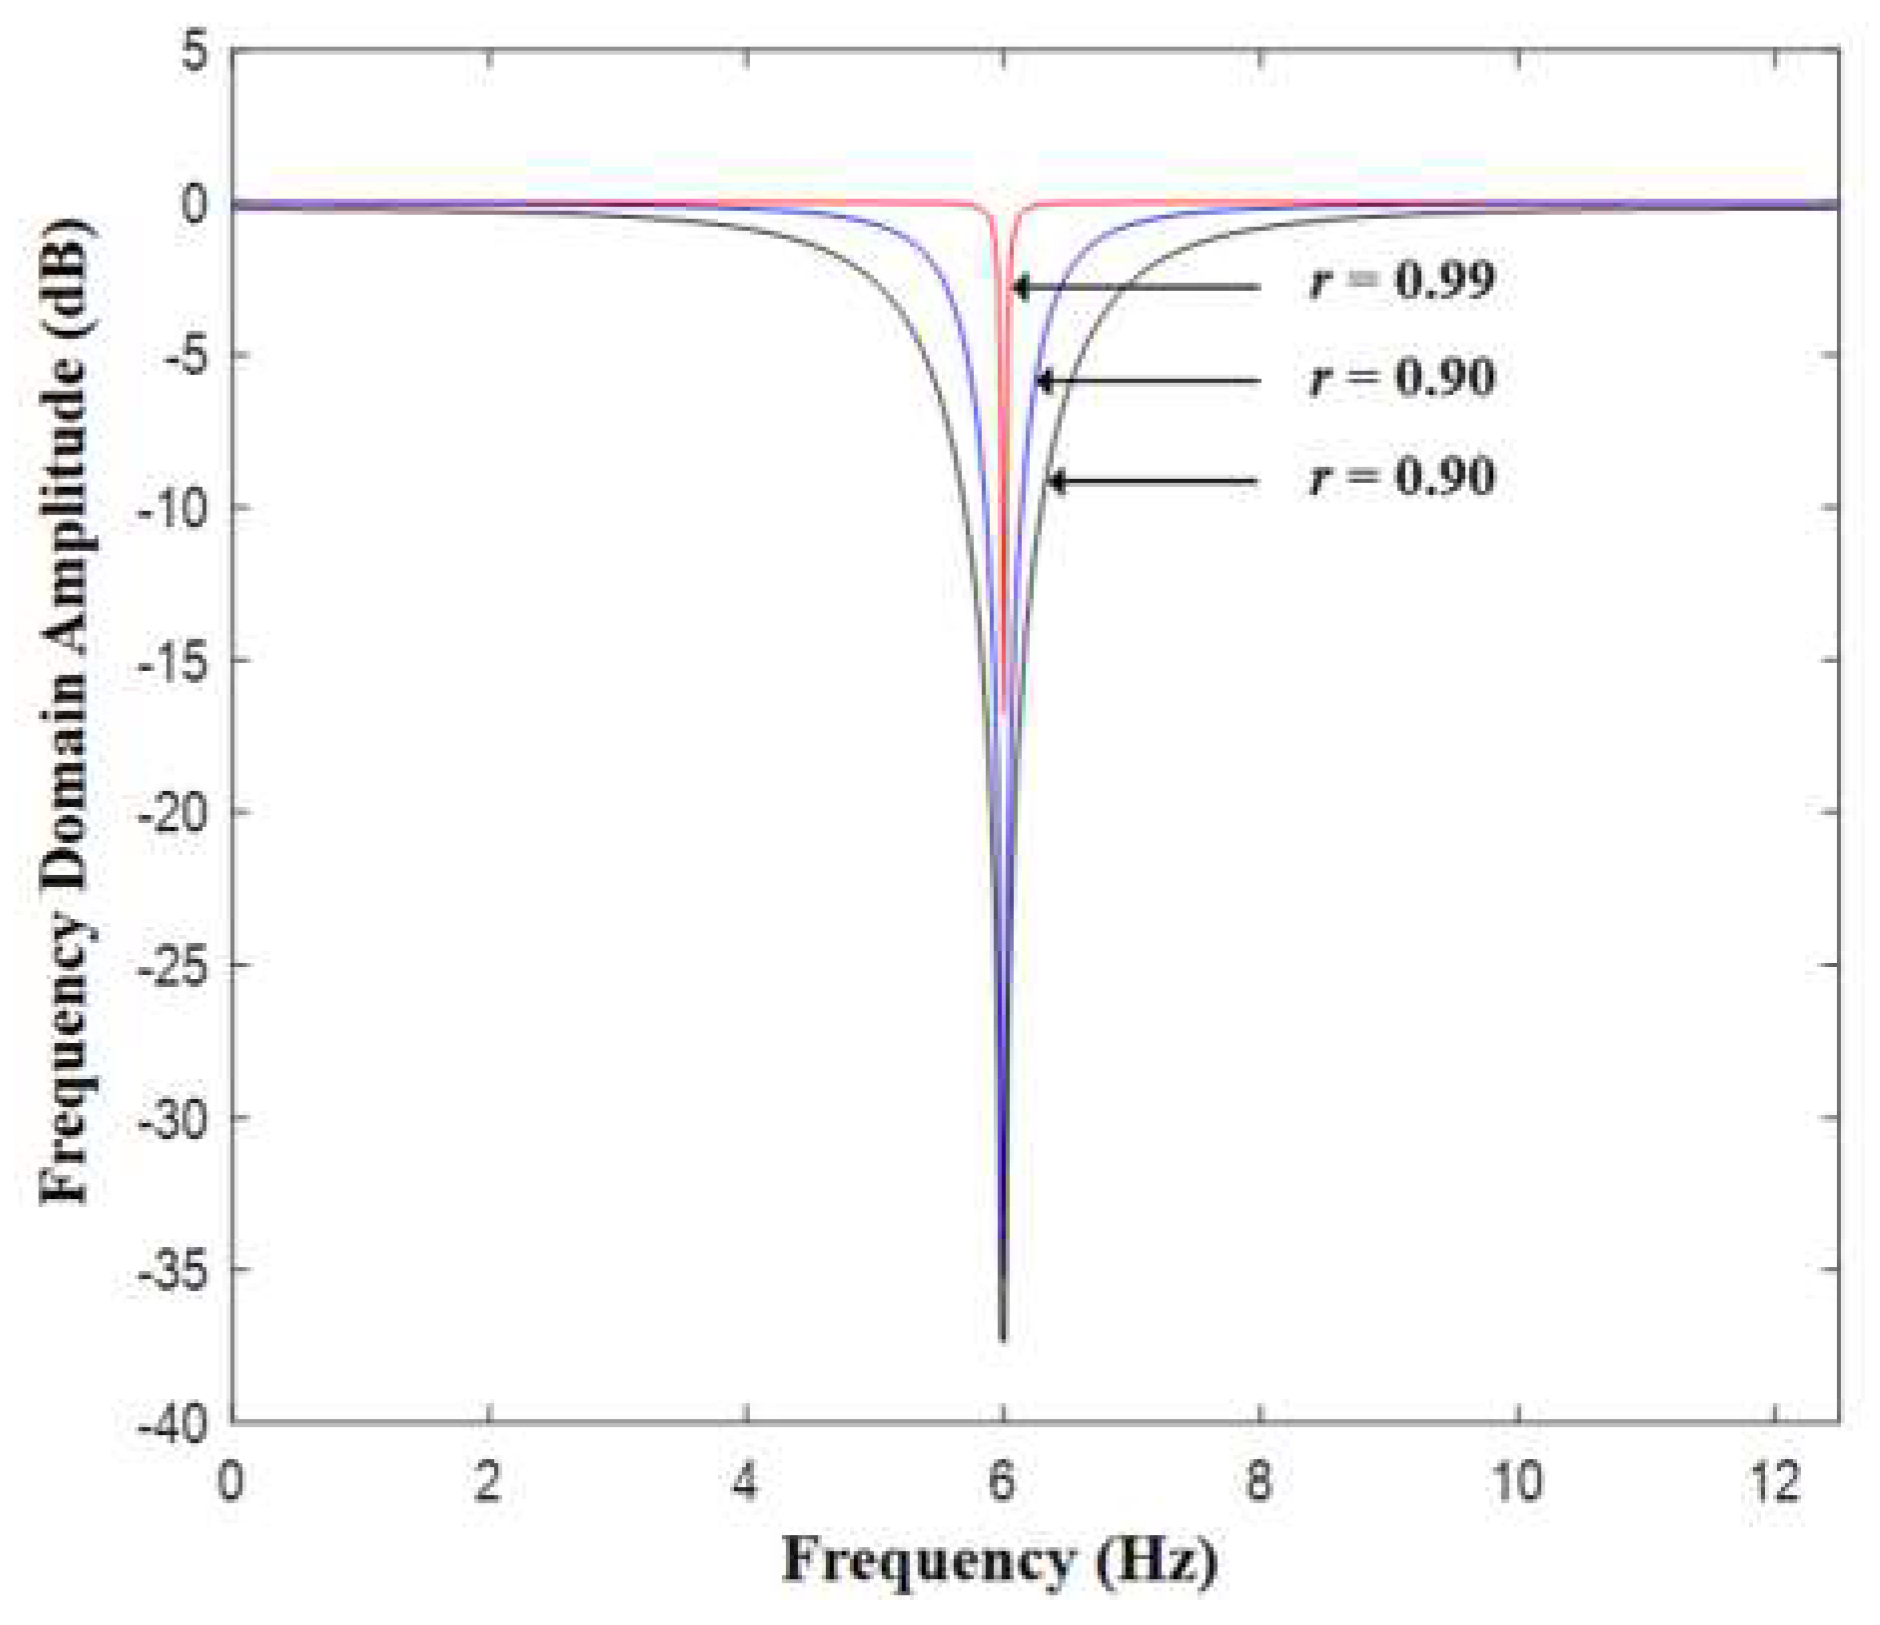
2.4. Notch Filtering
3. Experimental Results
3.1. Preliminary Evaluation of HR Estimation Based on Open Source Data Set
3.2. Evaluation under Practical Experiment
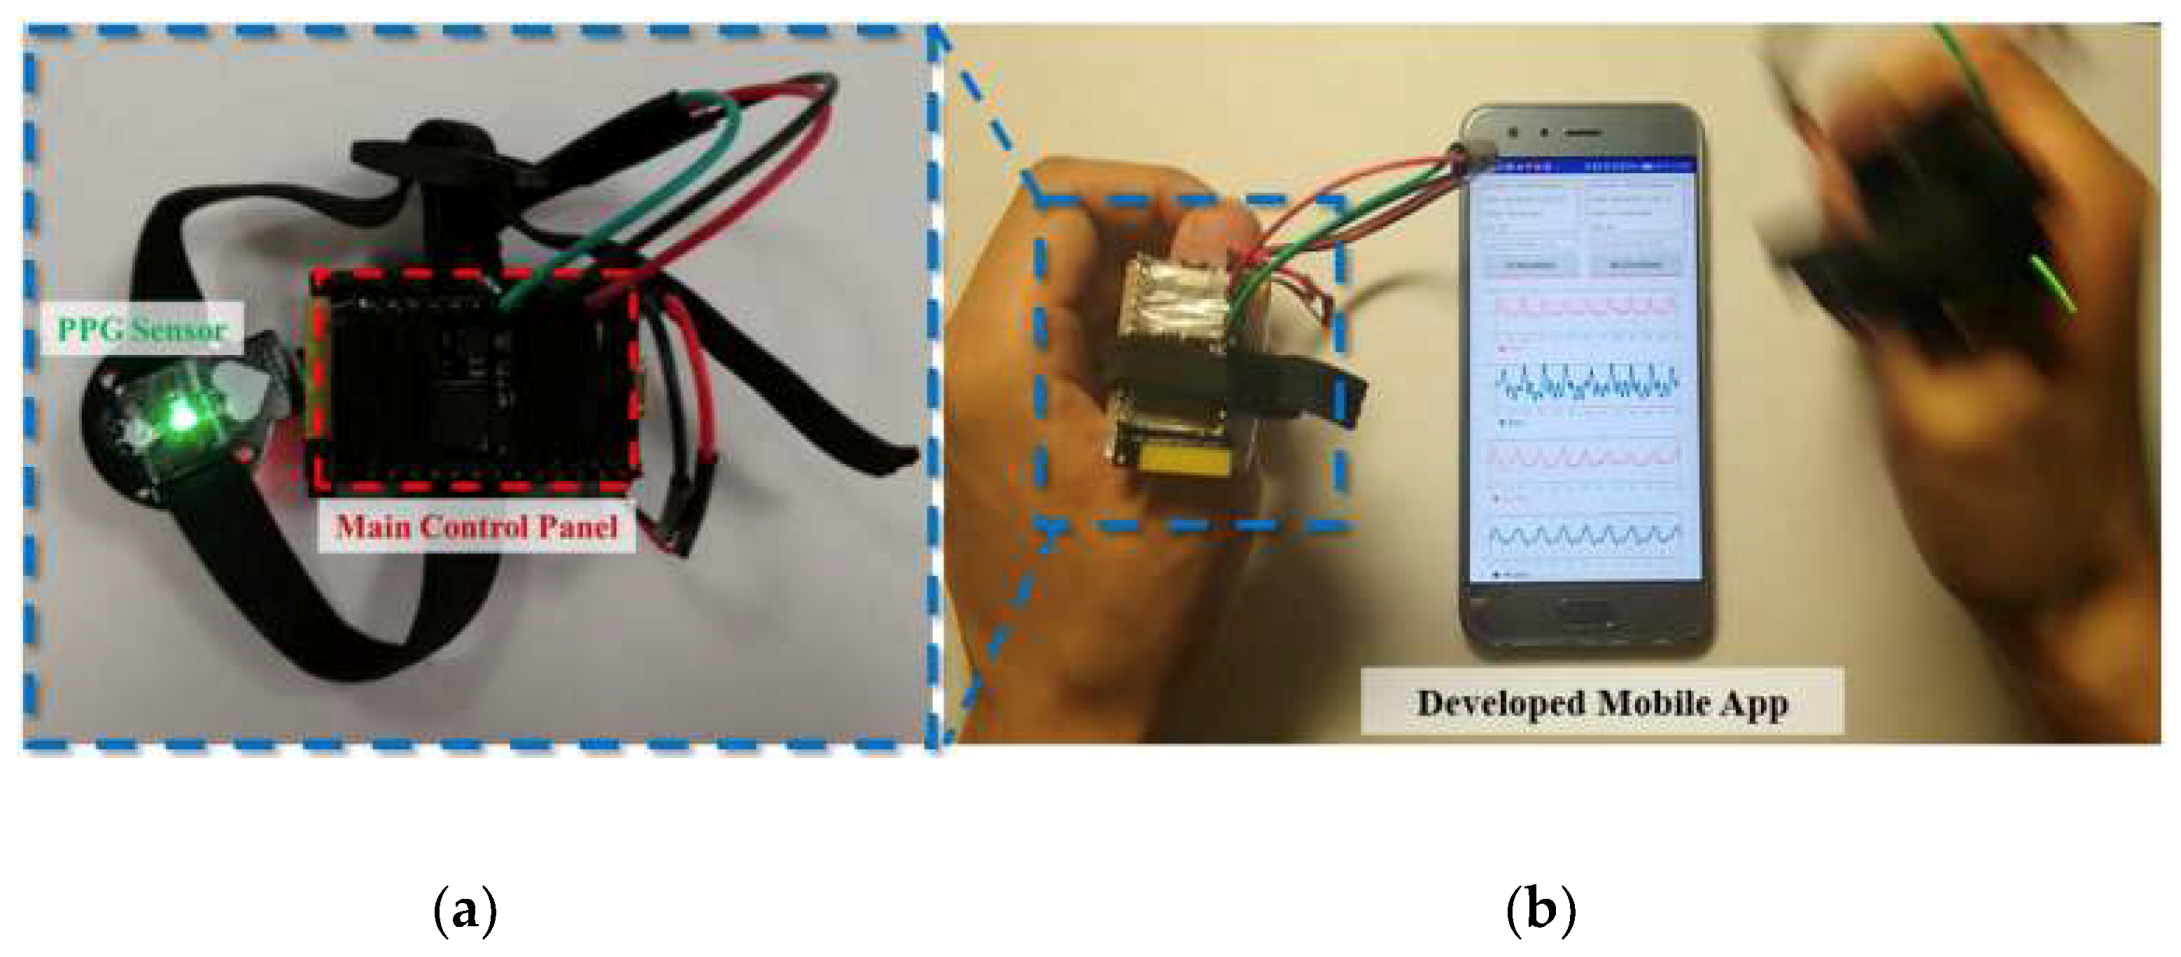
3.2.1. Implementation of Evaluation Hardware and Software
3.2.2. Experimental Process
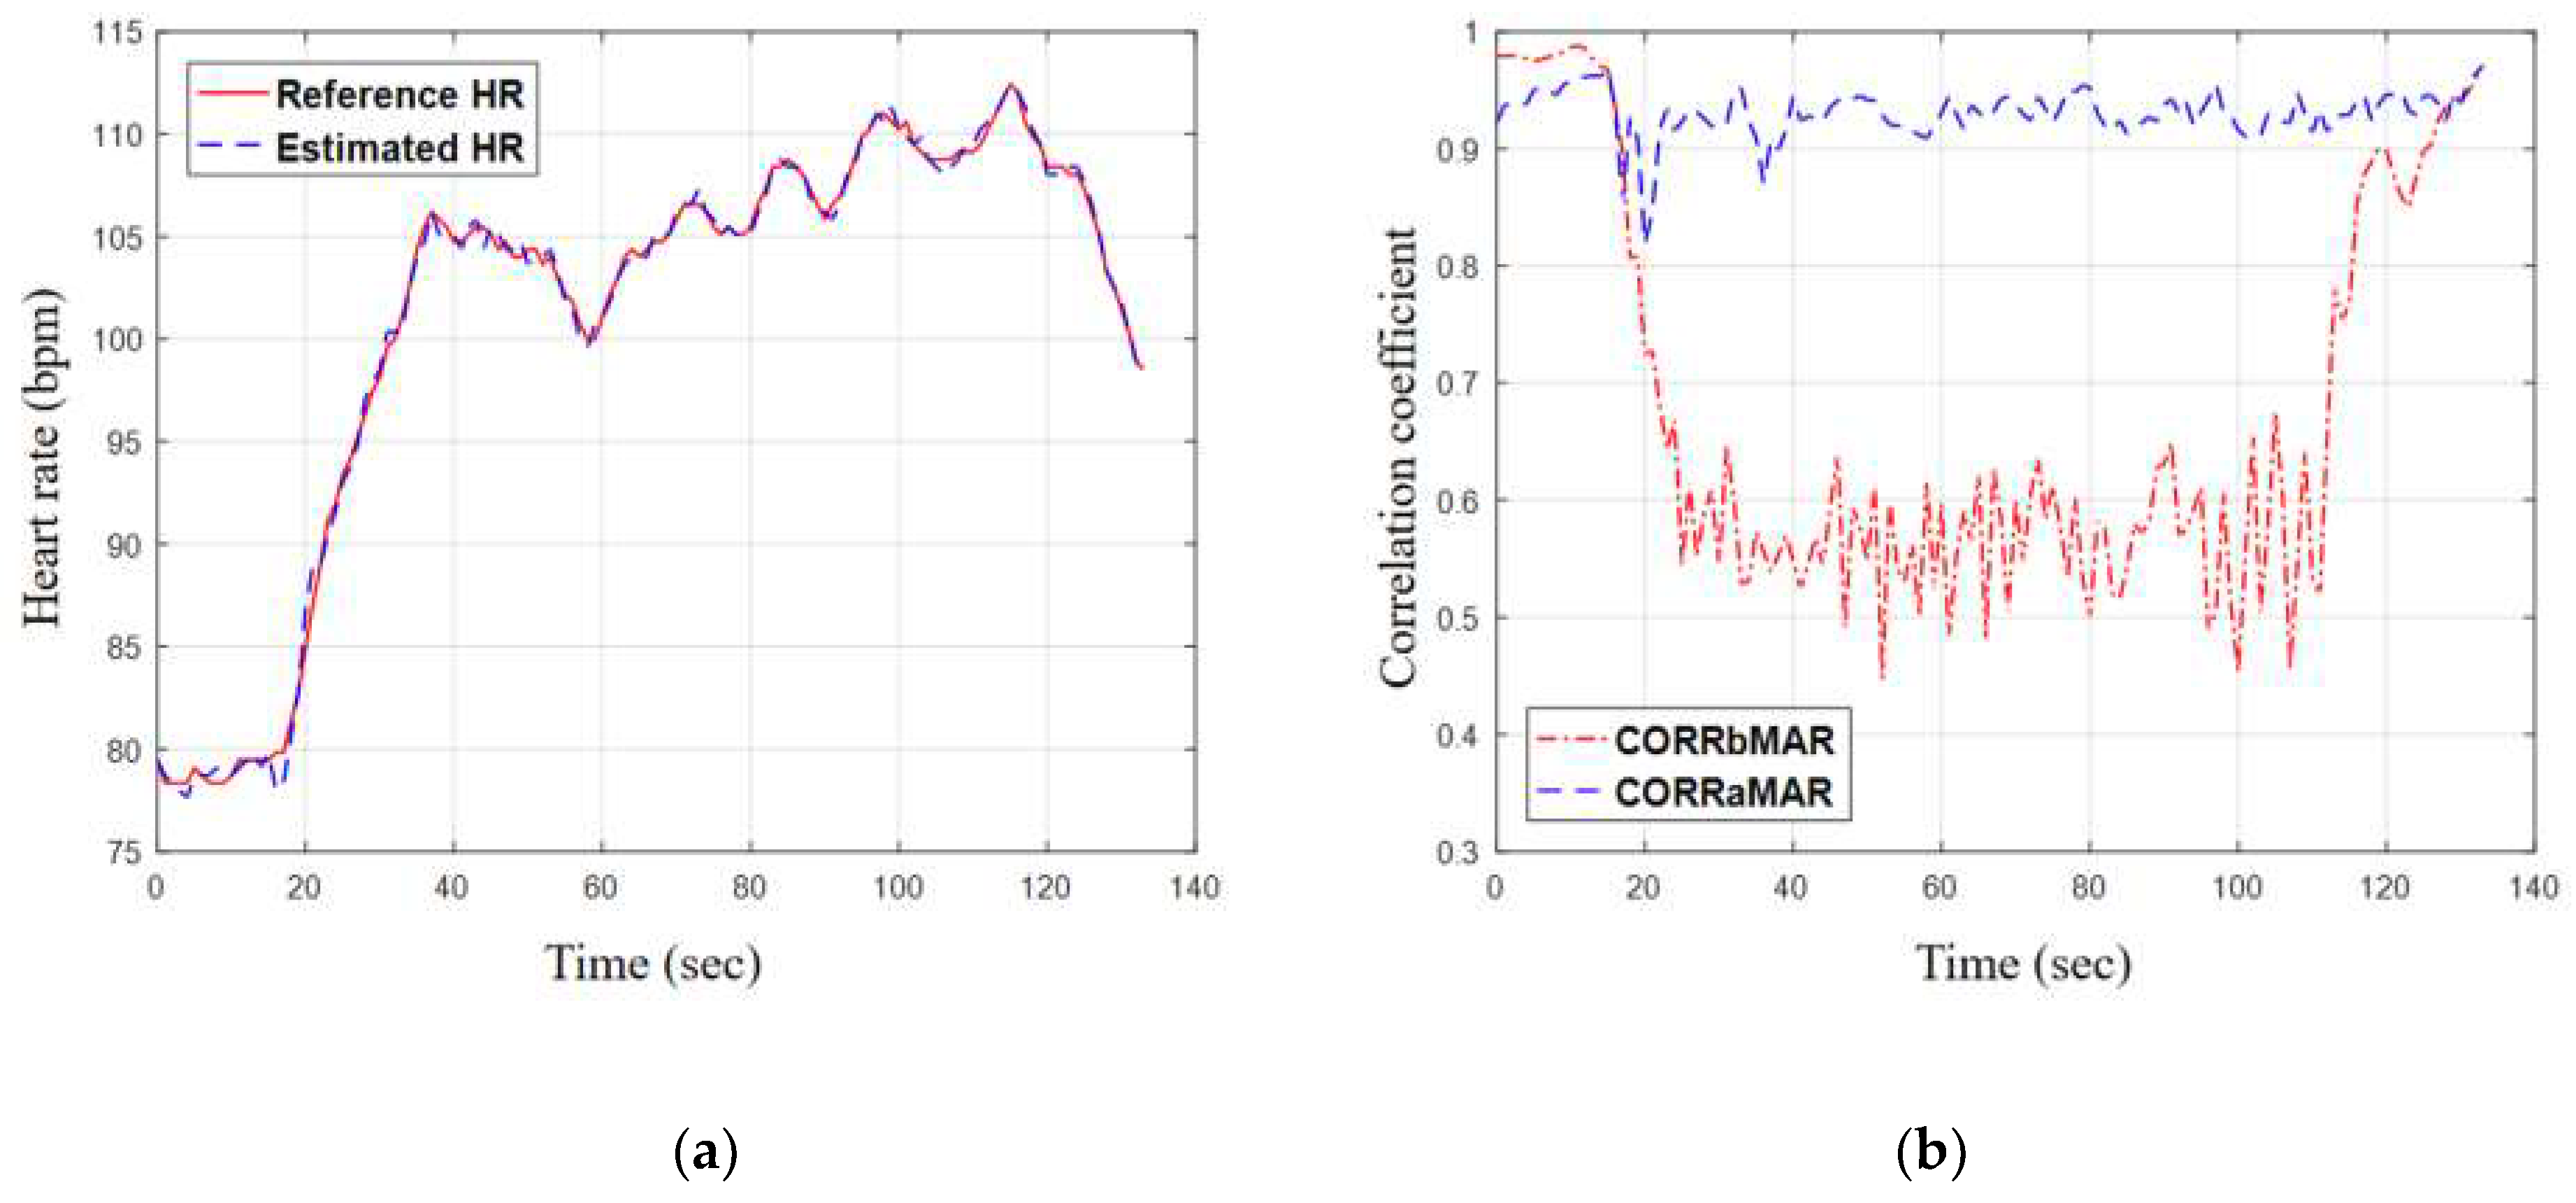
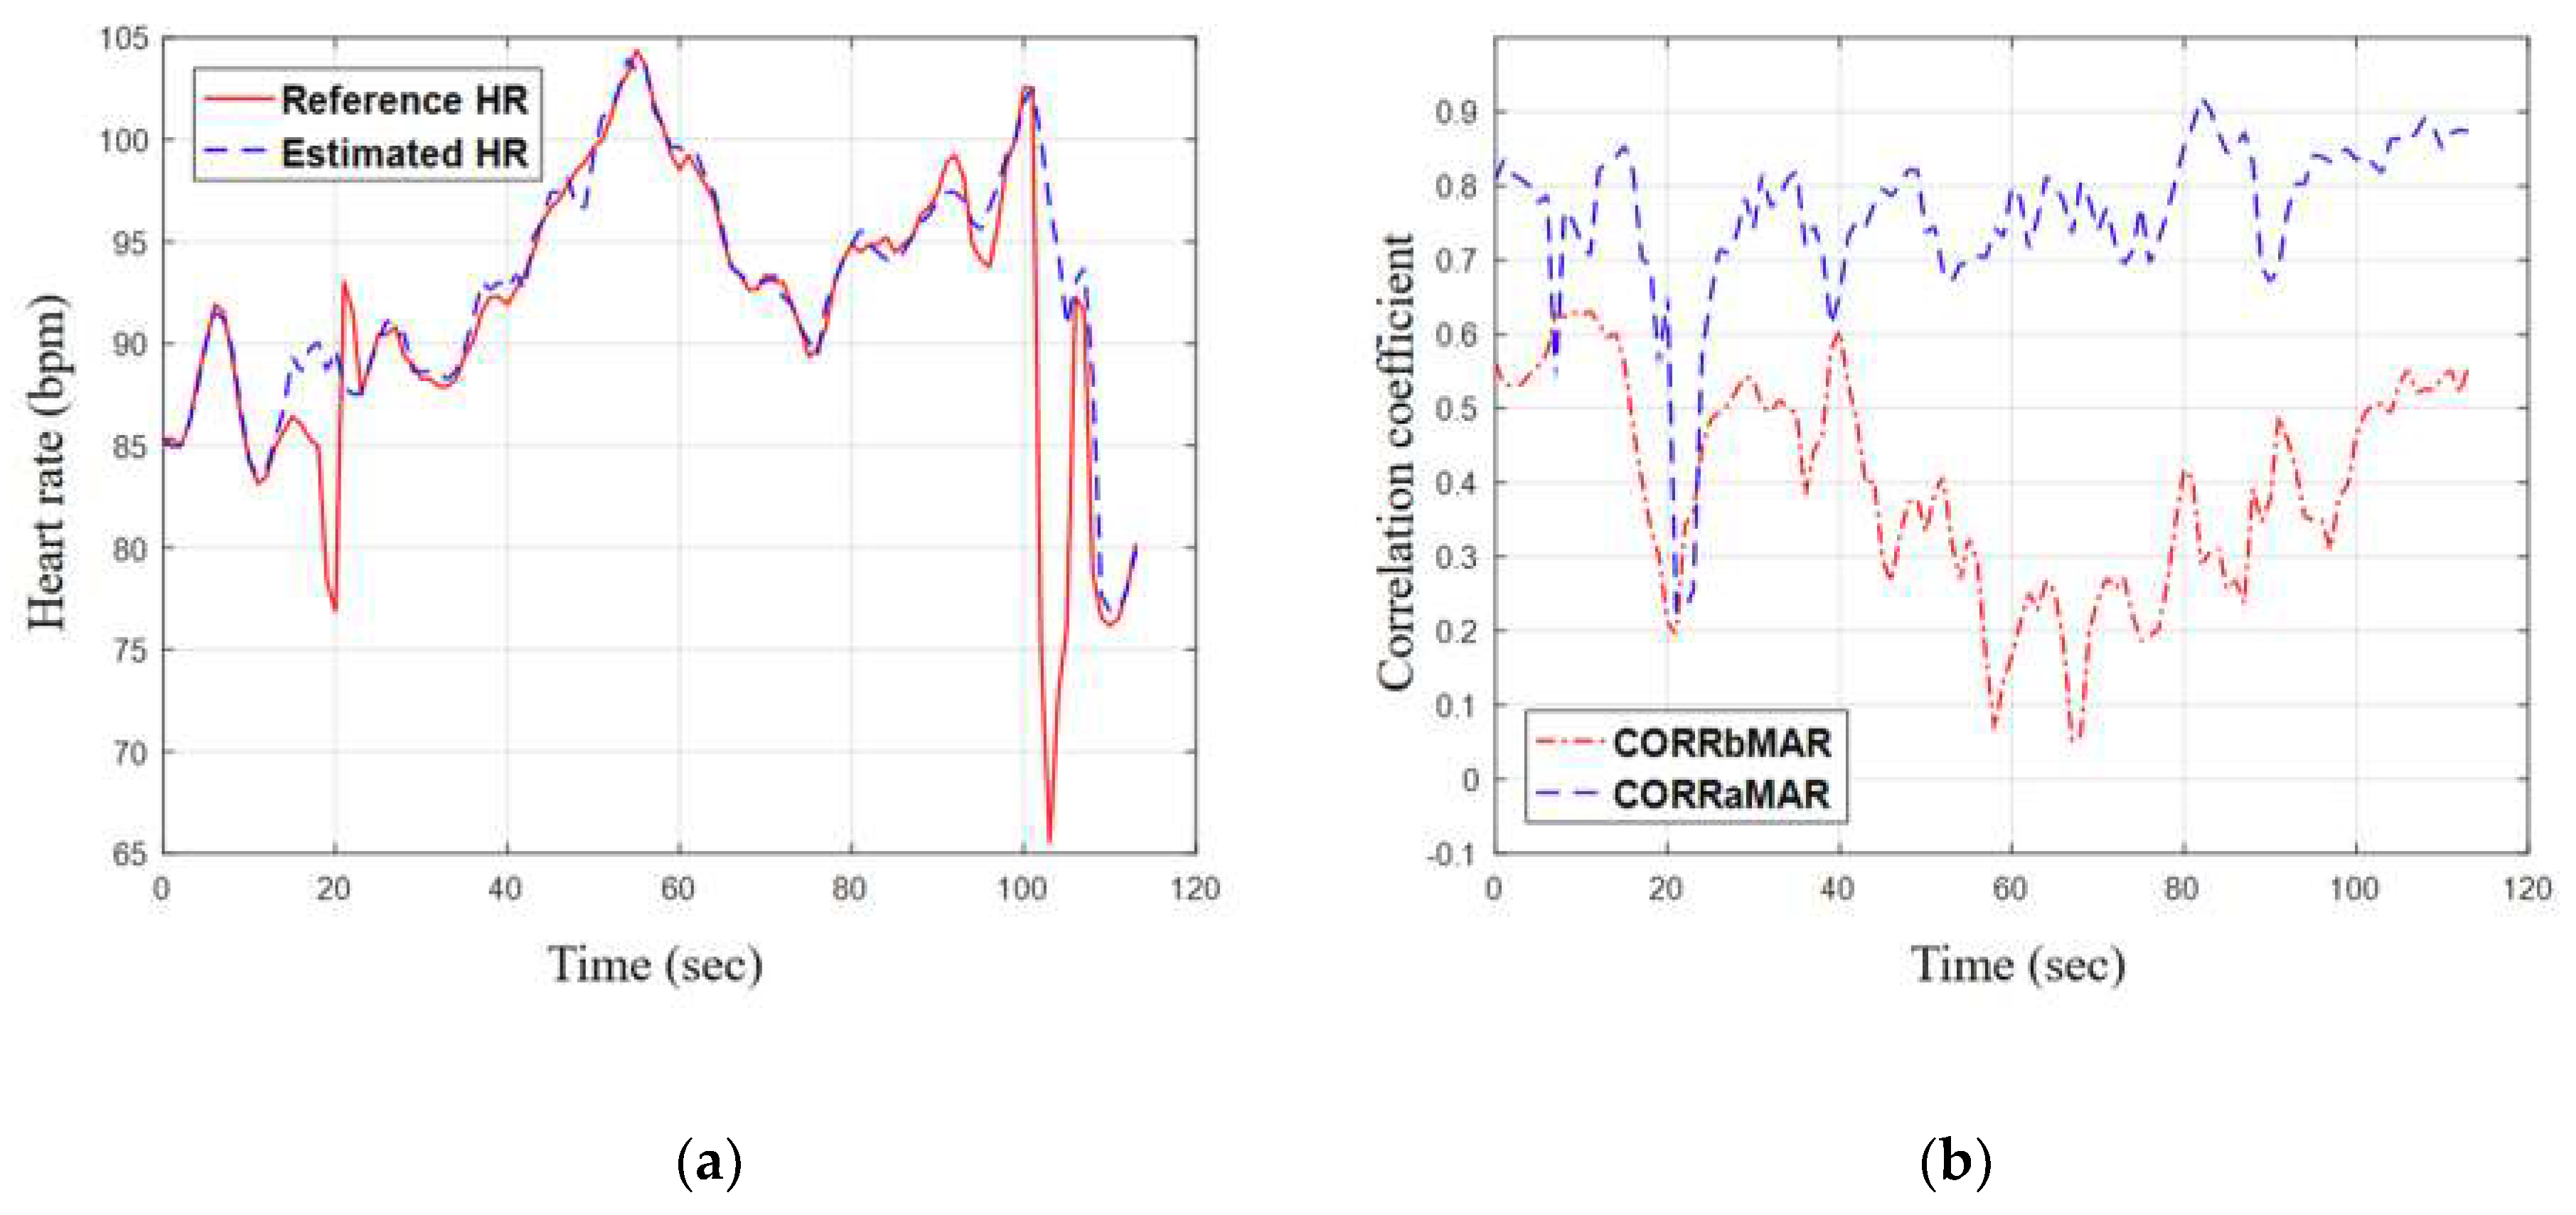
3.2.3. Experiment Results
4. Discussions and Conclusions
Author Contributions
Funding
Conflicts of Interest
References
- Allen, J. Photoplethysmography and its application in clinical physiological measurement. Physio. Meas. 2007, 28, R1–R39. [Google Scholar] [CrossRef] [PubMed]
- Ahmadi, A.K.; Moradi, P.; Malihi, M.; Karimi, S.; Shamsollahi, M.B. Heart rate monitoring during physical exercise using wrist-type photoplethysmographic (PPG) signals. In Proceedings of the 2015 37th Annual International Conference of the IEEE Engineering in Medicine and Biology Society (EMBC), Milan, Italy, 25–29 August 2015; pp. 6166–6169. [Google Scholar]
- Wood, L.B.; Asada, H.H. Noise cancellation model validation for reduced motion artifact wearable PPG sensors using MEMS accelerometers. In Proceedings of the 2006 International Conference of the IEEE Engineering in Medicine and Biology Society, New York, NY, USA, 30 August–3 September 2006; pp. 3525–3528. [Google Scholar]
- Wijshoff, R.W.; Mischi, M.; Aarts, R.M. Reduction of periodic motion artifacts in photoplethysmography. IEEE Trans. Biomed. Eng. 2017, 64, 196–207. [Google Scholar] [CrossRef] [PubMed]
- Naraharisetti, K.V.P.; Bawa, M.; Tahernezhadi, M. Comparison of different signal processing methods for reducing artifacts from photoplethysmograph signal. In Proceedings of the 2011 IEEE International Conference on Electronic and Information Technology, Mankato, MN, USA, 15–17 May 2011; pp. 1–8. [Google Scholar]
- Kim, B.S.; Yoo, S.K. Motion Artifact reduction in photoplethysmography using independent component analysis. IEEE Trans. Biomed. Eng. 2006, 53, 566–568. [Google Scholar] [CrossRef] [PubMed]
- Yao, J.; Warren, S. A short study to assess the potential of independent component analysis for motion artifact separation in wearable pulse oximeter signals. In Proceedings of the 27th Annual Conference of the IEEE Engineering in Medicine and Biology, Shanghai, China, 1–4 September 2005; pp. 3585–3588. [Google Scholar]
- Tăuţan, A.M.; Young, A.; Wentink, E.; Wieringa, F. Characterization and reduction of motion artifacts in photoplethysmographic signals from a wrist-worn device. In Proceedings of the 2015 37th Annual International Conference of the IEEE Engineering in Medicine and Biology Society (EMBC), Milan, Italy, 25–29 August 2015; pp. 6146–6149. [Google Scholar]
- Wang, Q.; Yang, P.; Zhang, Y. Artifact reduction based on empirical mode decomposition (EMD) in photoplethysmography for pulse rate detection. In Proceedings of the 2010 Annual International Conference of the IEEE Engineering in Medicine and Biology, Buenos Aires, Argentina, 31 August–4 September 2010; pp. 959–962. [Google Scholar]
- Krishnan, R.; Natarajan, B.; Warren, S. Two-stage approach for detection and reduction of motion artifacts in photoplethysmographic data. IEEE Trans. Biomed Eng. 2010, 57, 1867–1876. [Google Scholar] [CrossRef] [PubMed]
- Ram, M.R.; Madhav, K.V.; Krishna, E.H.; Komalla, N.R.; Reddy, K.A. Measurement. A Novel Approach for Motion Artifact Reduction in PPG Signals based on AS-LMS Adaptive Filter. IEEE Trans. Instrum. Meas. 2012, 61, 1445–1457. [Google Scholar] [CrossRef]
- Zhang, Z.; Pi, Z.; Liu, B. TROIKA: A general framework for heart rate monitoring using wrist-type photoplethysmographic signals during intensive physical exercise. IEEE Trans. Biomed. Eng. 2015, 62, 522–531. [Google Scholar] [CrossRef] [PubMed]
- Ye, Y.; Cheng, Y.; He, W.; Hou, M.; Zhang, Z. Combining nonlinear adaptive filtering and signal decomposition for motion artifact removal in wearable photoplethysmography. IEEE Sens. J. 2016, 16, 7133–7141. [Google Scholar] [CrossRef]
- Khan, E.; Al Hossain, F.; Uddin, S.Z.; Alam, S.K.; Hasan, M.K. A robust heart rate monitoring scheme using photoplethysmographic signals corrupted by intense motion artifacts. IEEE Trans. Biomed. Eng. 2015, 63, 550–562. [Google Scholar] [CrossRef] [PubMed]
- Temko, A. Accurate heart rate monitoring during physical exercises using PPG. IEEE Trans. Biomed. Eng. 2017, 64, 2016–2024. [Google Scholar] [CrossRef] [PubMed]
- Lee, B.; Kee, Y.; Han, J.; Yi, W.J. Adaptive comb filtering for motion artifact reduction from PPG with a structure of adaptive lattice IIR notch filter. In Proceedings of the 33rd International Conference of the IEEE Engineering in Medicine and Biology Society, Boston, MA, USA, 30 August–3 September 2011; pp. 7937–7940. [Google Scholar]
- Widrow, B.; Glover, J.R.; McCool, J.M.; Kaunitz, J.; Williams, C.S.; Hearn, R.H.; Zeidler, J.R.; Dong, J.E.; Goodlin, R.C. Adaptive noise cancelling: principles and applications. Proc. IEEE 1975, 63, 1692–1716. [Google Scholar] [CrossRef]
- Diniz, P.S.; Campos, M.L.; Antoniou, A. Analysis of lms-newton adaptive filtering algorithms with variable convergence factor. IEEE Trans. Signal Process. 1995, 43, 617–627. [Google Scholar] [CrossRef]
- Tseng, C.C.; Pei, S.C. Stable IIR notch filter design with optimal pole placement. IEEE Trans. Signal Proc. 2001, 49, 2673–2681. [Google Scholar] [CrossRef]
- Xiong, J.; Cai, L.; Jiang, D.; Song, H.; He, X. Spectral Matrix Decomposition-based Motion Artifacts Removal in Multi-channel PPG Sensor Signals. IEEE Access 2016, 4, 3076–3086. [Google Scholar] [CrossRef]
- Chowdhury, S.S.; Hyder, R.; Hafiz, M.S.B.; Haque, M.A. Real-time robust heart rate estimation from wrist-type PPG signals using multiple reference adaptive noise cancellation. IEEE J. Biomed. Health Inform. 2018, 22, 450–459. [Google Scholar] [CrossRef] [PubMed]
- Dubey, H.; Kumaresan, R.; Mankodiya, K. Harmonic sum-based method for heart rate estimation using PPG signals affected with motion artifacts. J. Ambient Intell. Humaniz. Comput. 2018, 9, 137–150. [Google Scholar] [CrossRef]
- Bland, J.M.; Altman, D.J.T.l. Statistical methods for assessing agreement between two methods of clinical measurement. Lancet 1986, 327, 307–310. [Google Scholar] [CrossRef]
- Asada, H.H.; Jiang, H.H.; Gibbs, P. Active noise cancellation using MEMS accelerometers for motion-tolerant wearable bio-sensors. Proceedings of The 26th Annual International Conference of the IEEE Engineering in Medicine and Biology Society, San Francisco, CA, USA, 1–5 September 2004; pp. 2157–2160. [Google Scholar]


| Subject | 1 | 2 | 3 | 4 | 5 | 6 | 7 | 8 | 9 | 10 | 11 | 12 | Mean |
|---|---|---|---|---|---|---|---|---|---|---|---|---|---|
| BPF only | 8.80 | 26.12 | 17.27 | 6.23 | 1.28 | 4.61 | 2.06 | 2.95 | 0.36 | 40.99 | 13.49 | 13.44 | 11.47 |
| BPF + ANC | 4.18 | 1.51 | 1.24 | 0.89 | 0.67 | 1.22 | 2.20 | 0.49 | 0.34 | 4.68 | 0.85 | 0.81 | 1.59 |
| Subject | 1 | 2 | 3 | 4 | 5 | 6 | 7 | 8 | 9 | 10 | 11 | 12 | Mean |
|---|---|---|---|---|---|---|---|---|---|---|---|---|---|
| BPF +ANC | 4.18 | 1.51 | 1.24 | 0.89 | 0.67 | 1.22 | 2.20 | 0.49 | 0.34 | 4.68 | 0.85 | 0.81 | 1.59 |
| BPF +ANC+HRFT | 1.46 | 1.17 | 1.12 | 0.89 | 0.67 | 1.22 | 0.90 | 0.49 | 0.34 | 2.24 | 0.85 | 0.81 | 1.01 |
| Subject | 1 | 2 | 3 | 4 | 5 | 6 | 7 | 8 | 9 | 10 | 11 | 12 | Mean |
|---|---|---|---|---|---|---|---|---|---|---|---|---|---|
| BPF +ANC+HRFT | 1.46 | 1.17 | 1.12 | 0.89 | 0.67 | 1.22 | 0.90 | 0.49 | 0.34 | 2.24 | 0.85 | 0.81 | 1.01 |
| Complete HR Estimation | 1.09 | 0.87 | 1.20 | 0.81 | 0.67 | 1.15 | 0.73 | 0.49 | 0.34 | 2.06 | 0.87 | 0.78 | 0.92 |
| Subject | IEEE Access’16 [20] | IEEE TMBE’16 [14] | MUARD [21] | WFPV [15] | HSUM [22] | This Work |
| 1 | 1.16 | 1.70 | 1.17 | 1.25 | 0.76 | 1.09 |
| 2 | 1.07 | 0.84 | 0.93 | 1.41 | 0.92 | 0.87 |
| 3 | 0.80 | 0.56 | 0.70 | 0.71 | 0.95 | 1.20 |
| 4 | 1.13 | 1.15 | 0.82 | 0.97 | 1.19 | 0.81 |
| 5 | 0.98 | 0.77 | 0.88 | 0.75 | 0.70 | 0.67 |
| 6 | 1.29 | 1.06 | 0.97 | 0.92 | 0.61 | 1.15 |
| 7 | 0.88 | 0.63 | 0.67 | 0.65 | 0.87 | 0.73 |
| 8 | 0.81 | 0.53 | 0.74 | 0.97 | 0.59 | 0.49 |
| 9 | 0.55 | 0.52 | 0.49 | 0.55 | 0.53 | 0.34 |
| 10 | 3.18 | 2.56 | 2.69 | 2.06 | 0.75 | 2.06 |
| 11 | 0.79 | 1.05 | 0.81 | 1.03 | 1.50 | 0.87 |
| 12 | 0.72 | 0.91 | 0.77 | 0.99 | 2.47 | 0.78 |
| Mean | 1.11 | 1.02 | 0.97 | 1.02 | 0.99 | 0.92 |
| Subset | Number of Subjects | Motion Pattern |
| 1 | 1 | Motionless (120 s) |
| 2–10 | 9 | Motionless (20 s) → Long-range Full-arm Swinging at 1 Hz (20 s) → Middle-range Full-arm Swinging at 1.5 Hz (20 s) → Long-range Full-arm Swinging at 1 Hz (20 s) → Middle-range Full-arm Swinging at 1.5 Hz (20 s) → Motionless (20 s) |
| 11–16 | 6 | Motionless (20 s) → Random Keyboard Hitting (20 s) → Left-right Wrist Swinging (20 s) → Left-right Forearm Swinging (20 s) → Up-down Forearm Swinging (20 s) →Motionless (20 s) |
| 17–20 | 1 | Motionless (20 s) → Walking on a treadmill at 3–6 km/h (80–100 s) →Motionless (20 s) |
| Subset | HRAAE | Average CORRbMAR | Average CORRaMAR |
|---|---|---|---|
| 1 | 0.18 | 0.98 | 0.90 |
| 2 | 1.02 | 0.58 | 0.90 |
| 3 | 0.94 | 0.64 | 0.84 |
| 4 | 0.87 | 0.31 | 0.86 |
| 5 | 0.53 | 0.67 | 0.89 |
| 6 | 0.59 | 0.73 | 0.90 |
| 7 | 1.33 | 0.61 | 0.78 |
| 8 | 1.81 | 0.55 | 0.84 |
| 9 | 0.79 | 0.65 | 0.90 |
| 10 | 0.77 | 0.54 | 0.83 |
| Mean(2–10) | 0.96 | 0.59 | 0.86 |
| 11 | 0.49 | 0.58 | 0.89 |
| 12 | 1.12 | 0.54 | 0.80 |
| 13 | 1.29 | 0.44 | 0.75 |
| 14 | 1.05 | 0.34 | 0.74 |
| 15 | 1.41 | 0.60 | 0.80 |
| 16 | 0.53 | 0.77 | 0.92 |
| Mean(11–16) | 0.98 | 0.55 | 0.81 |
| 17 | 1.06 | 0.63 | 0.89 |
| 18 | 0.41 | 0.61 | 0.93 |
| 19 | 0.36 | 0.58 | 0.93 |
| 20 | 0.47 | 0.49 | 0.90 |
| Mean(17–20) | 0.57 | 0.58 | 0.91 |
| Mean(2–20) | 0.89 | 0.57 | 0.86 |
© 2019 by the authors. Licensee MDPI, Basel, Switzerland. This article is an open access article distributed under the terms and conditions of the Creative Commons Attribution (CC BY) license (http://creativecommons.org/licenses/by/4.0/).
Share and Cite
Wang, M.; Li, Z.; Zhang, Q.; Wang, G. Removal of Motion Artifacts in Photoplethysmograph Sensors during Intensive Exercise for Accurate Heart Rate Calculation Based on Frequency Estimation and Notch Filtering. Sensors 2019, 19, 3312. https://doi.org/10.3390/s19153312
Wang M, Li Z, Zhang Q, Wang G. Removal of Motion Artifacts in Photoplethysmograph Sensors during Intensive Exercise for Accurate Heart Rate Calculation Based on Frequency Estimation and Notch Filtering. Sensors. 2019; 19(15):3312. https://doi.org/10.3390/s19153312
Chicago/Turabian StyleWang, Min, Zhe Li, Qirui Zhang, and Guoxing Wang. 2019. "Removal of Motion Artifacts in Photoplethysmograph Sensors during Intensive Exercise for Accurate Heart Rate Calculation Based on Frequency Estimation and Notch Filtering" Sensors 19, no. 15: 3312. https://doi.org/10.3390/s19153312
APA StyleWang, M., Li, Z., Zhang, Q., & Wang, G. (2019). Removal of Motion Artifacts in Photoplethysmograph Sensors during Intensive Exercise for Accurate Heart Rate Calculation Based on Frequency Estimation and Notch Filtering. Sensors, 19(15), 3312. https://doi.org/10.3390/s19153312