Vision-Based Measurement of Heart Rate from Ballistocardiographic Head Movements Using Unsupervised Clustering


Abstract
1. Introduction
2. Proposed Method
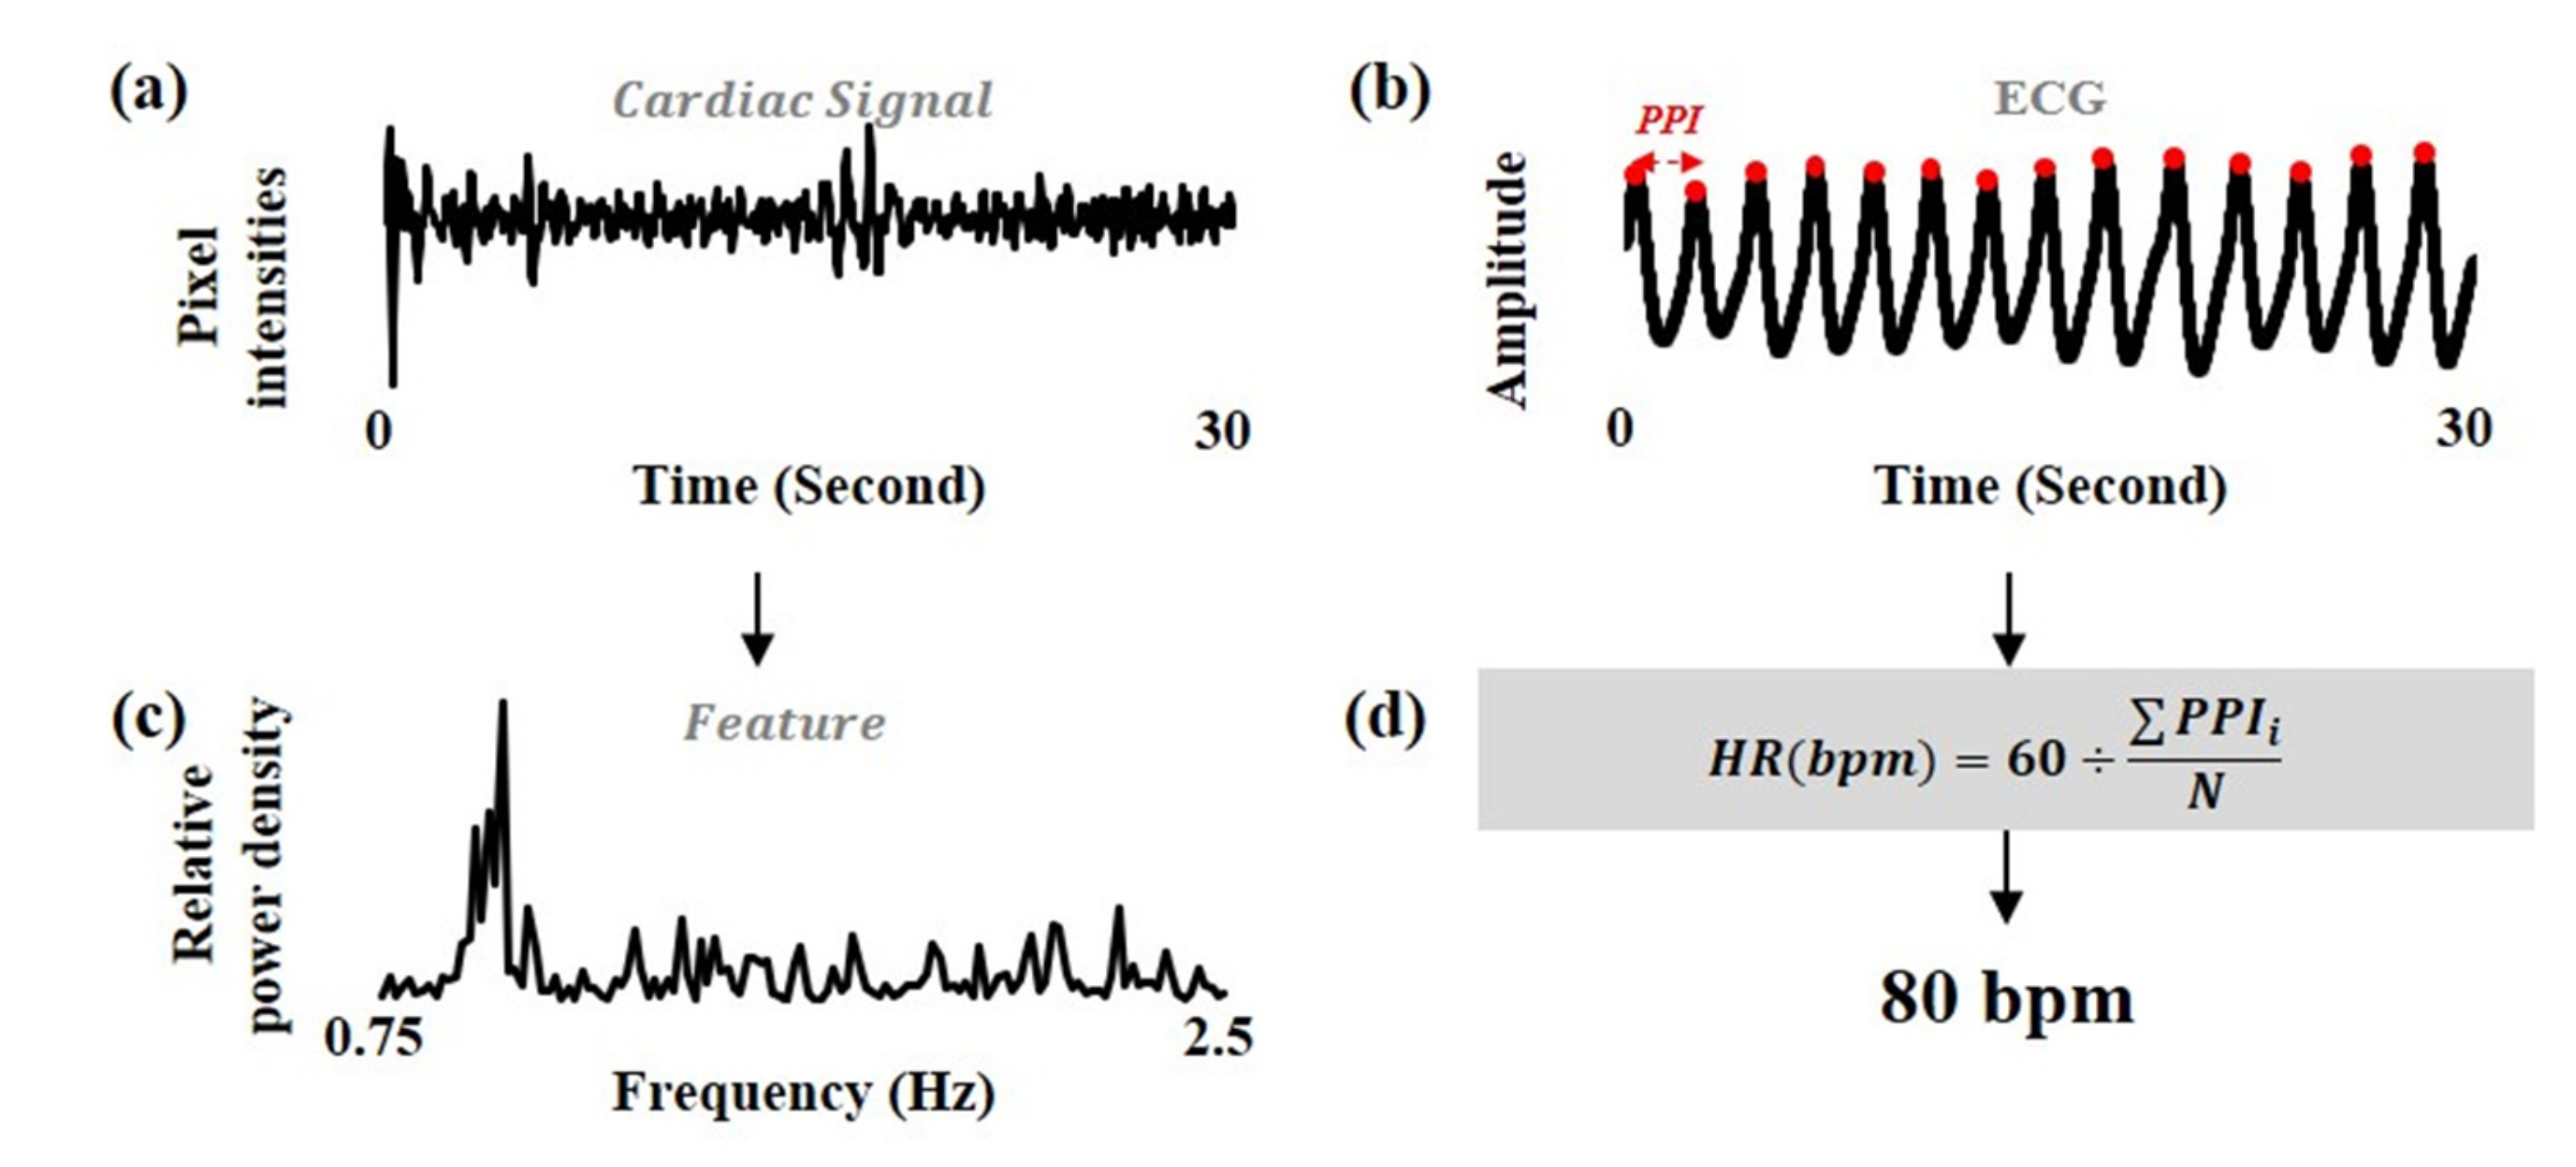
2.1. Signal Extraction and Signal Estimation
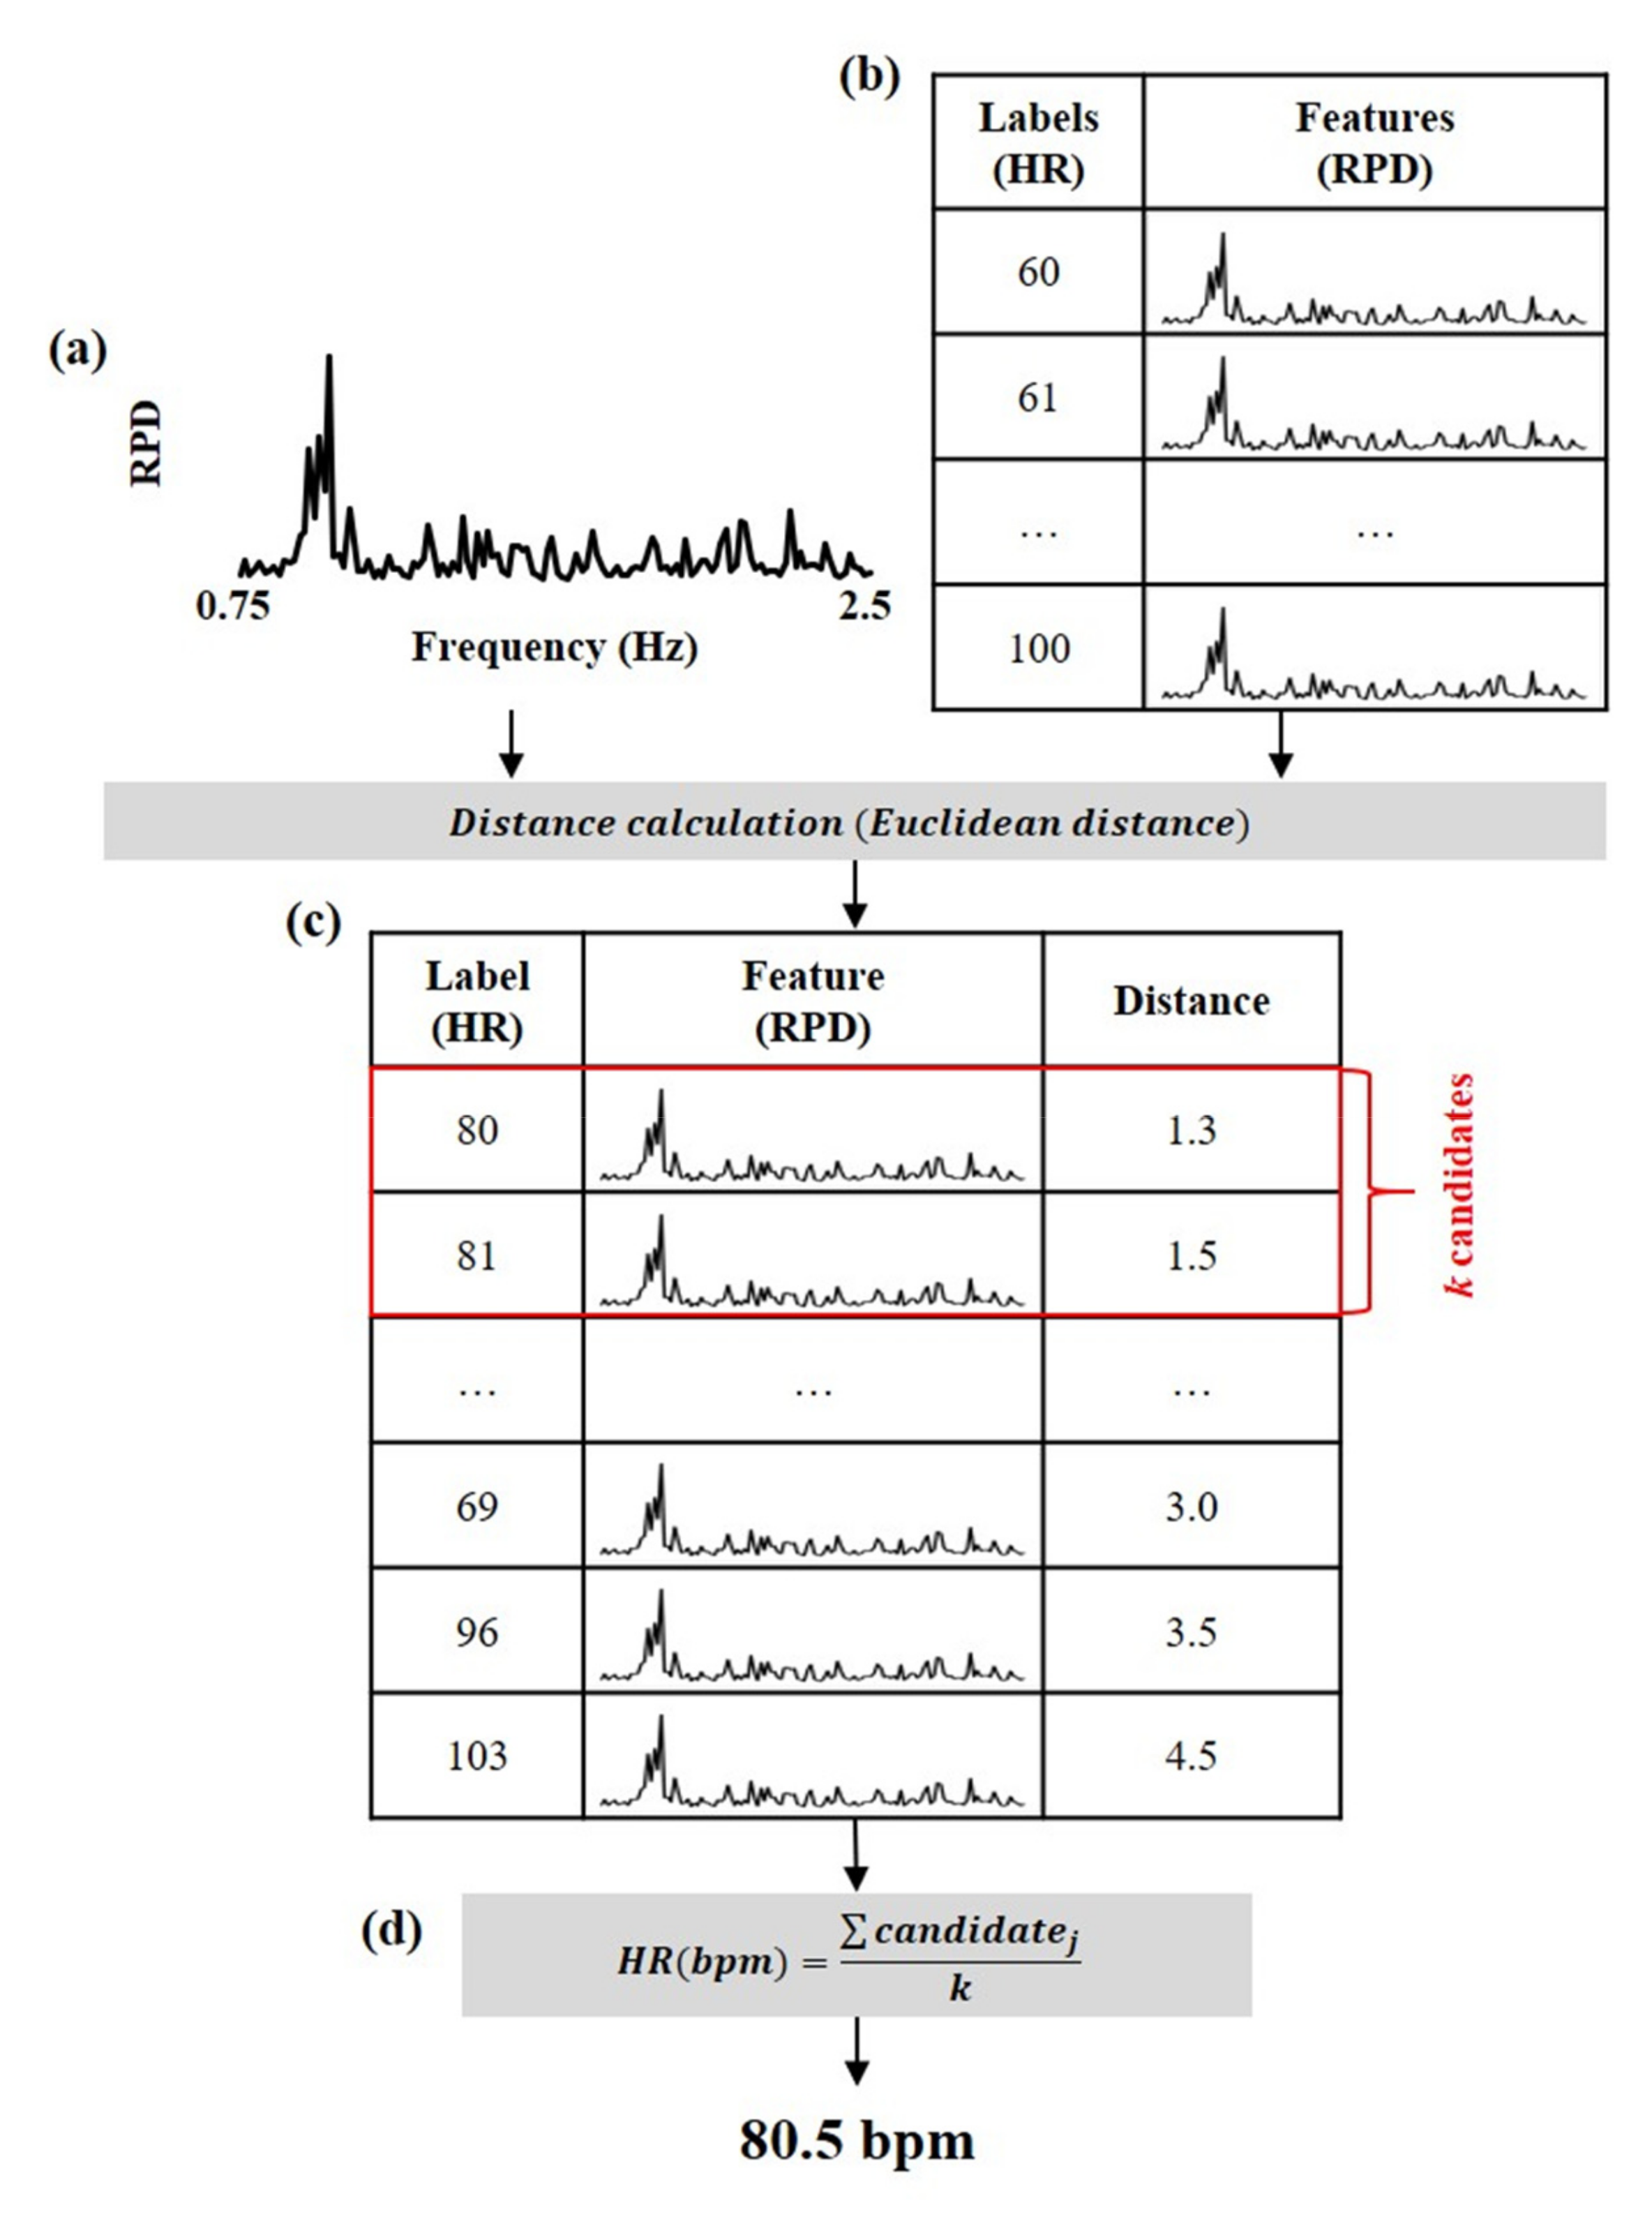
2.2. Feature Extraction
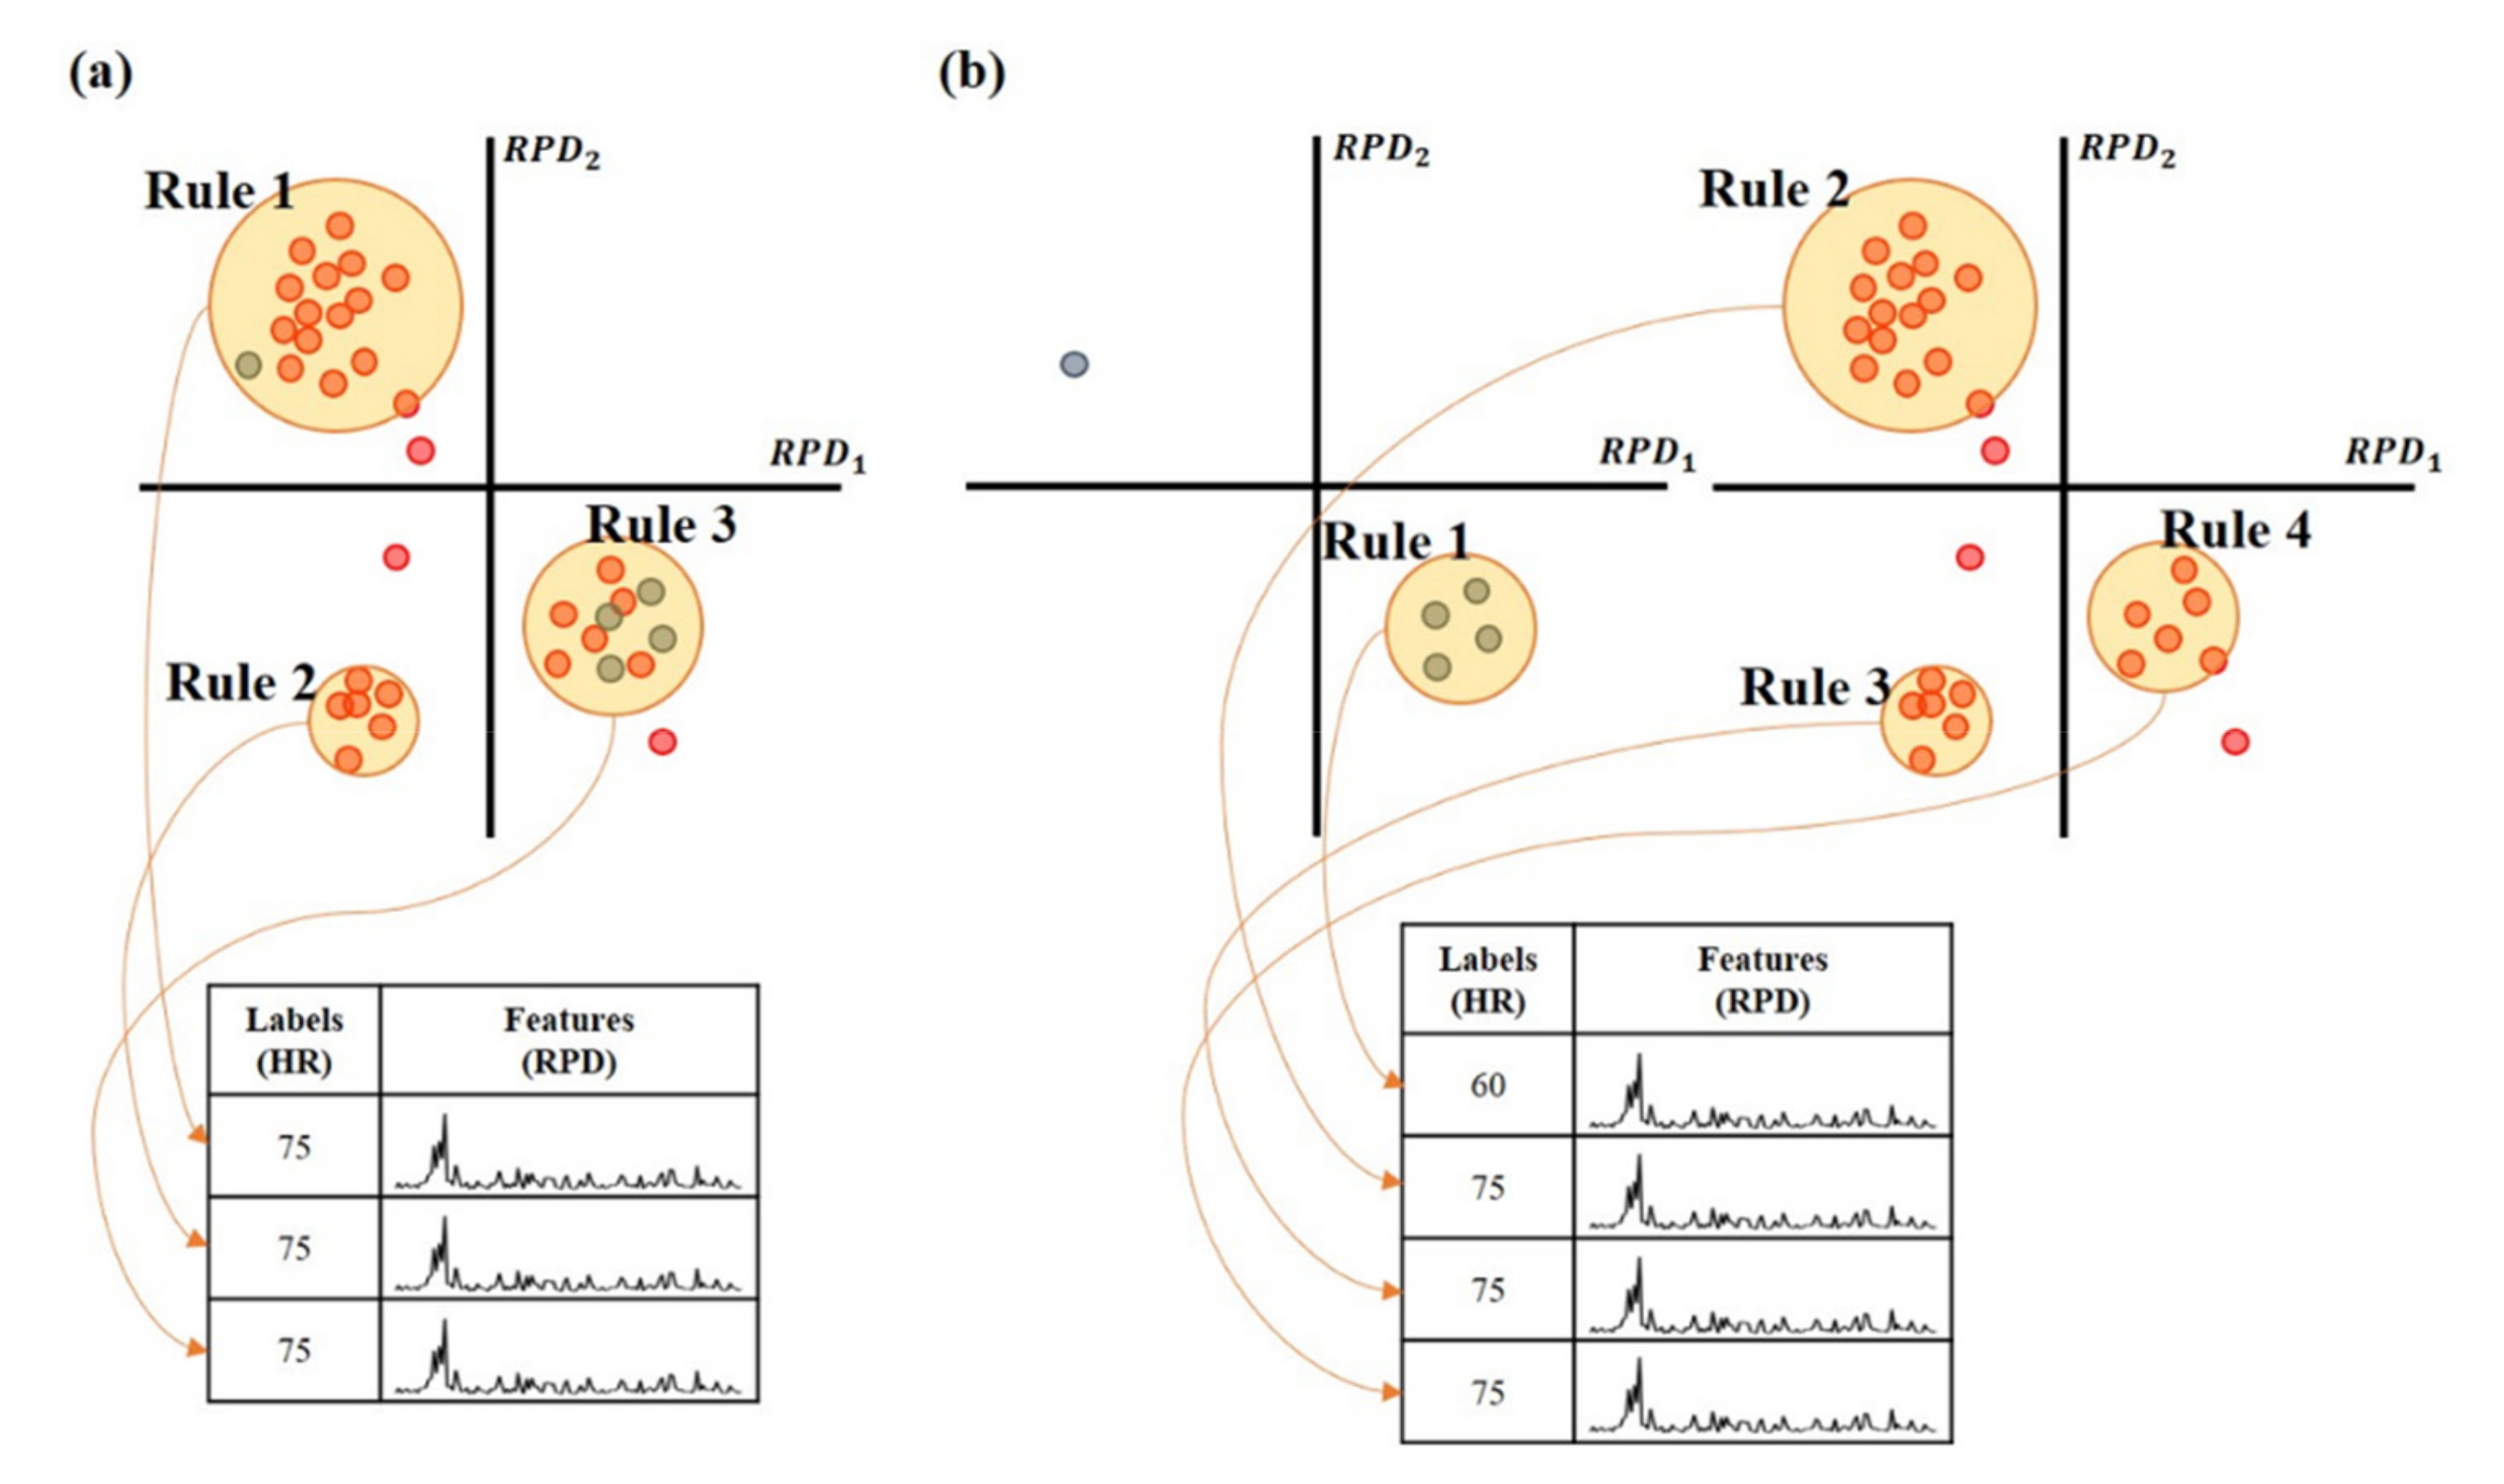
2.3. Unsupervised Clustering
2.4. Heart Rate Estimation
3. Experiments
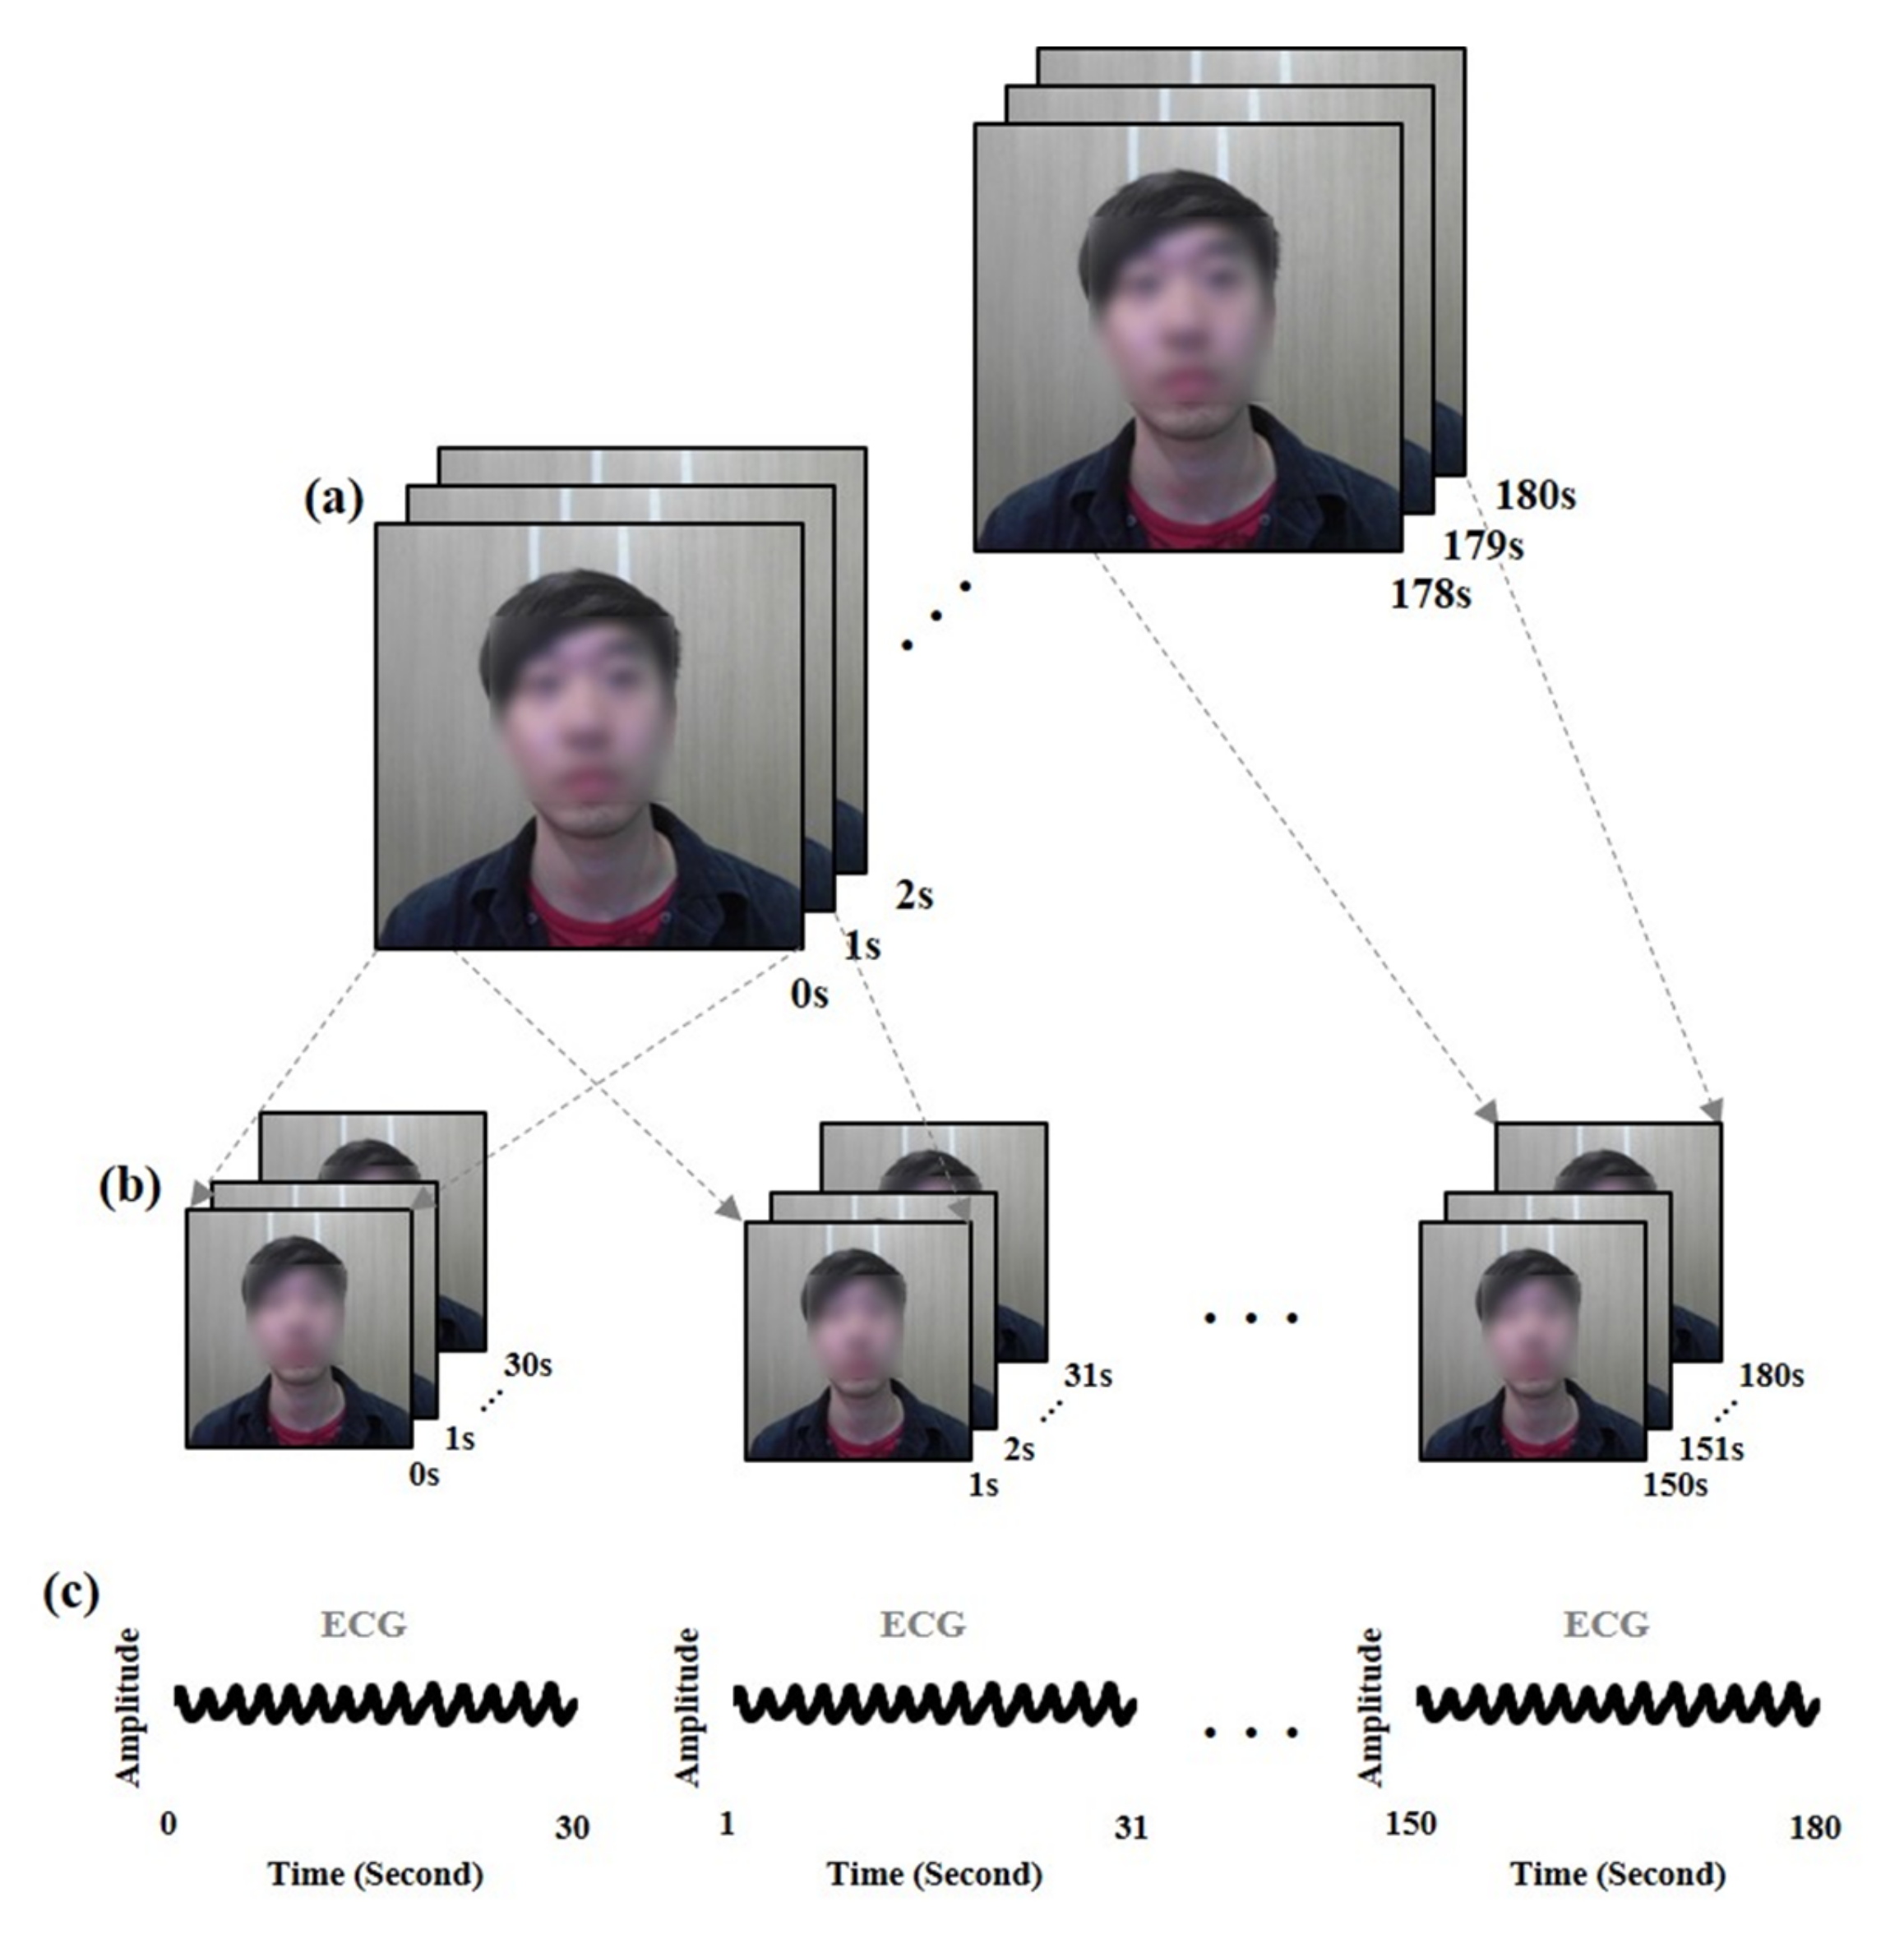
3.1. Dataset
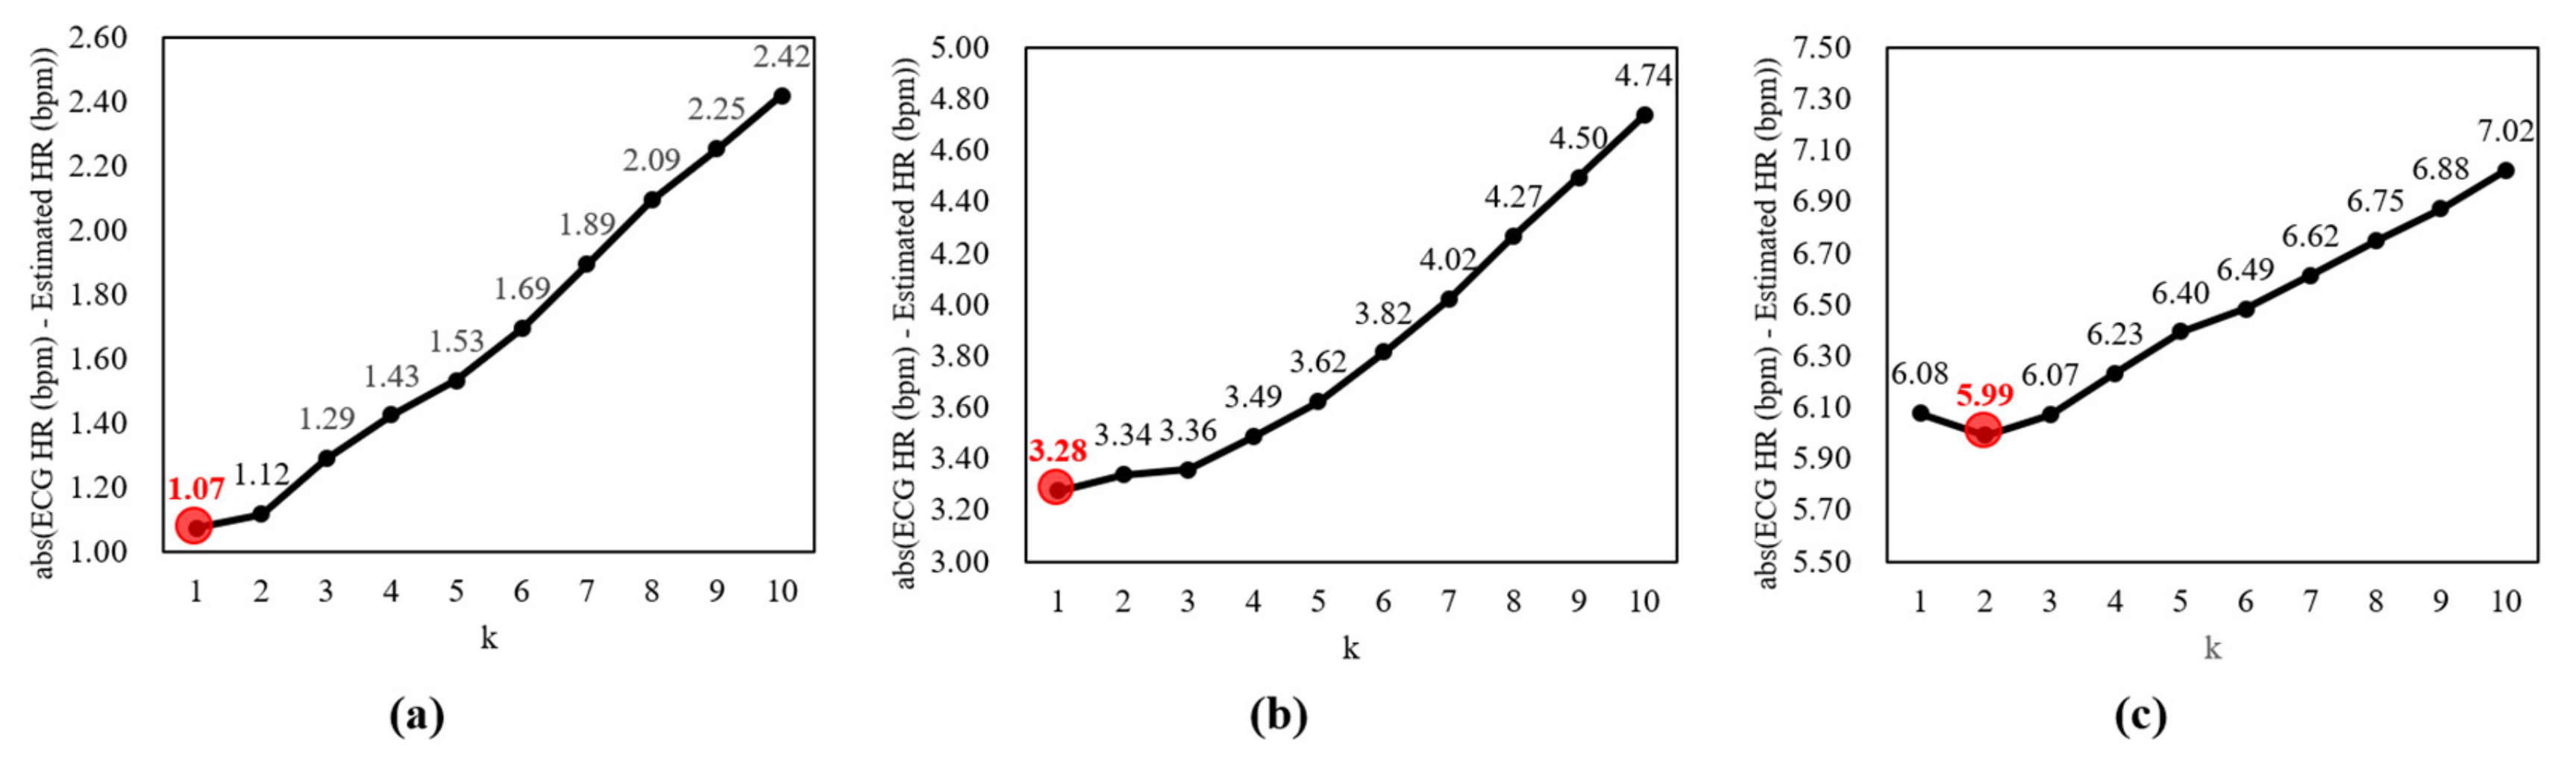
3.2. Evaluation
4. Results
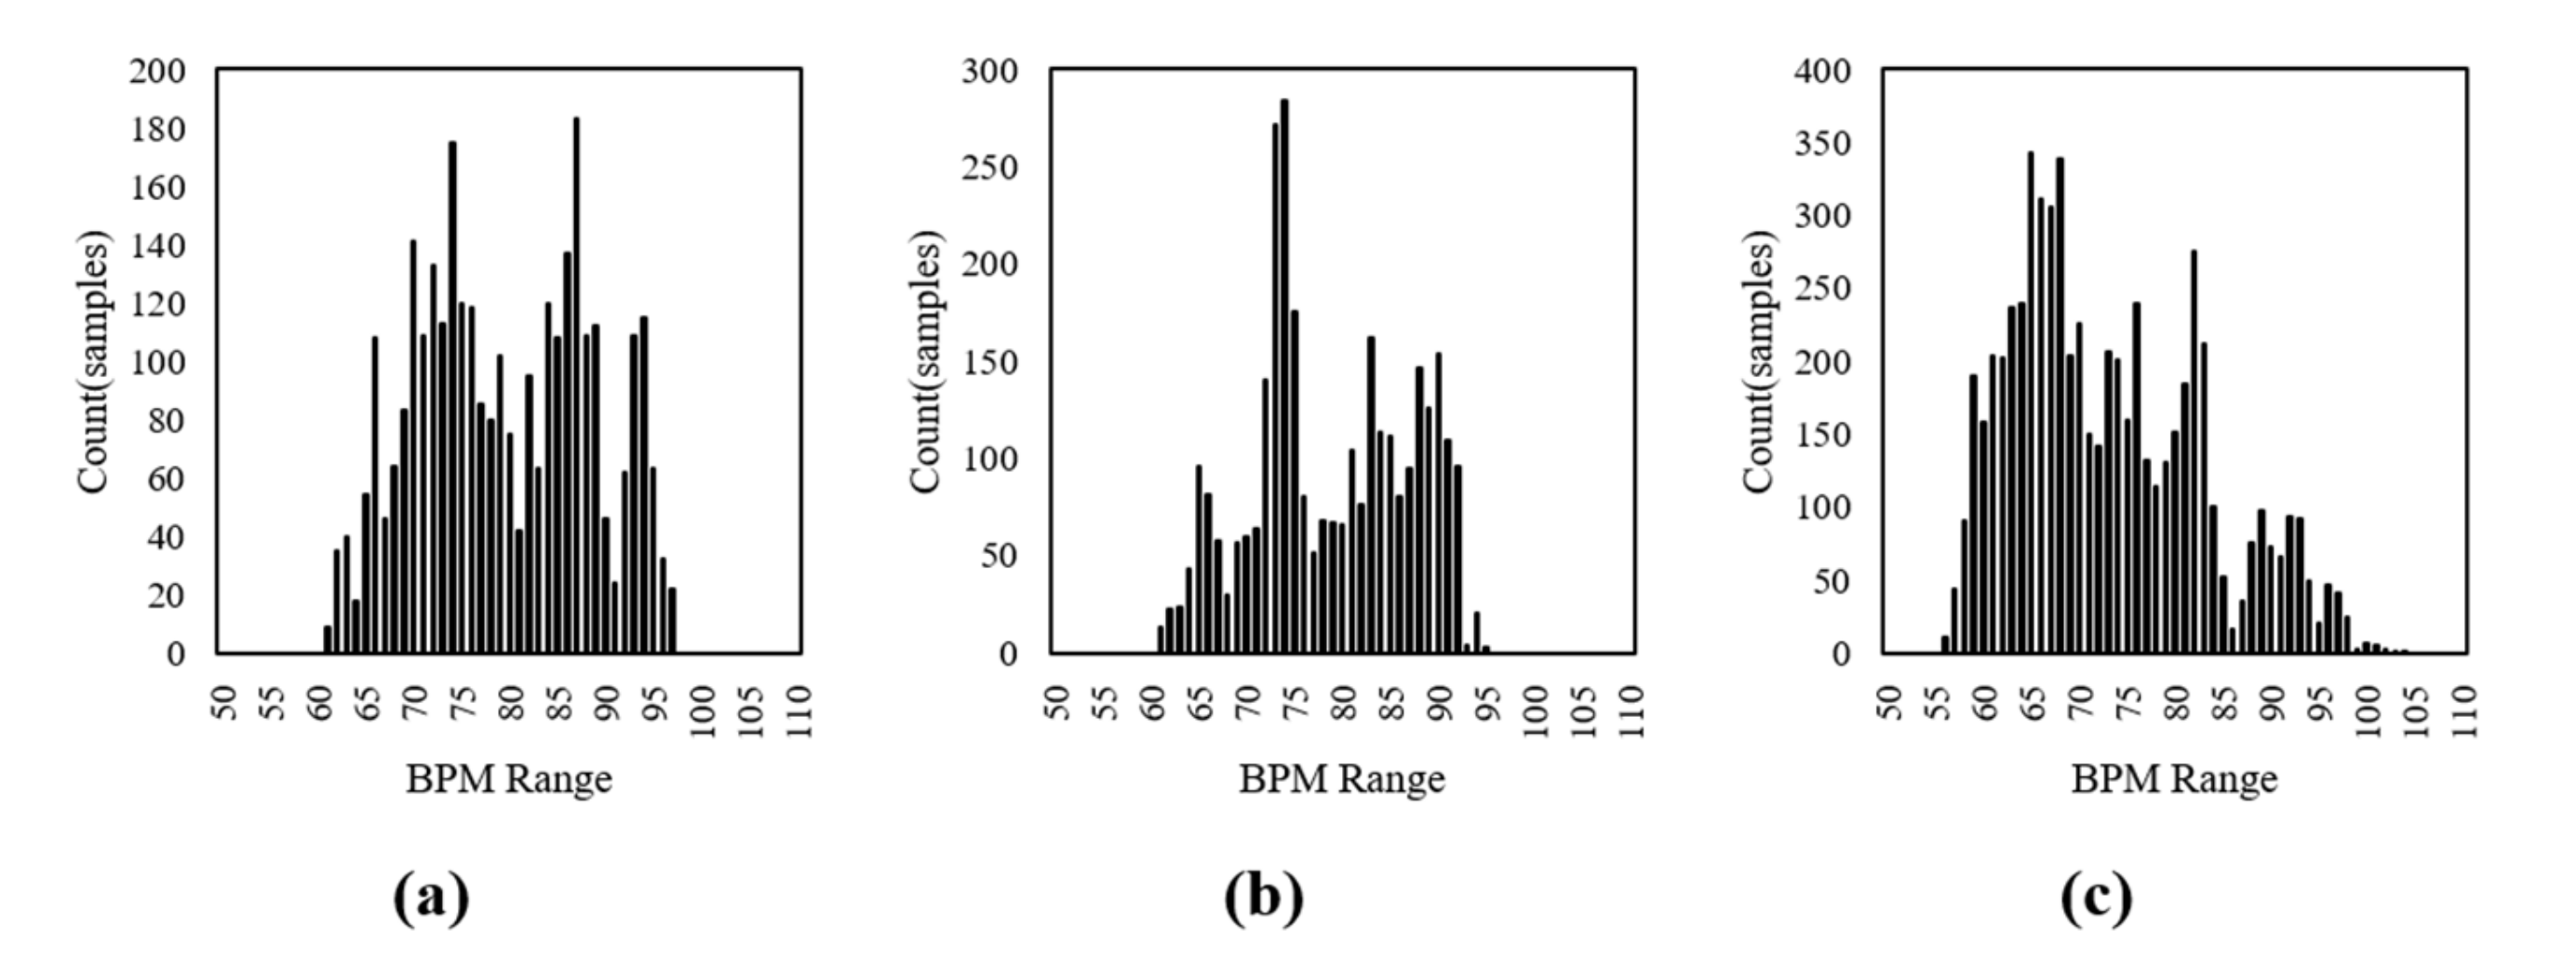
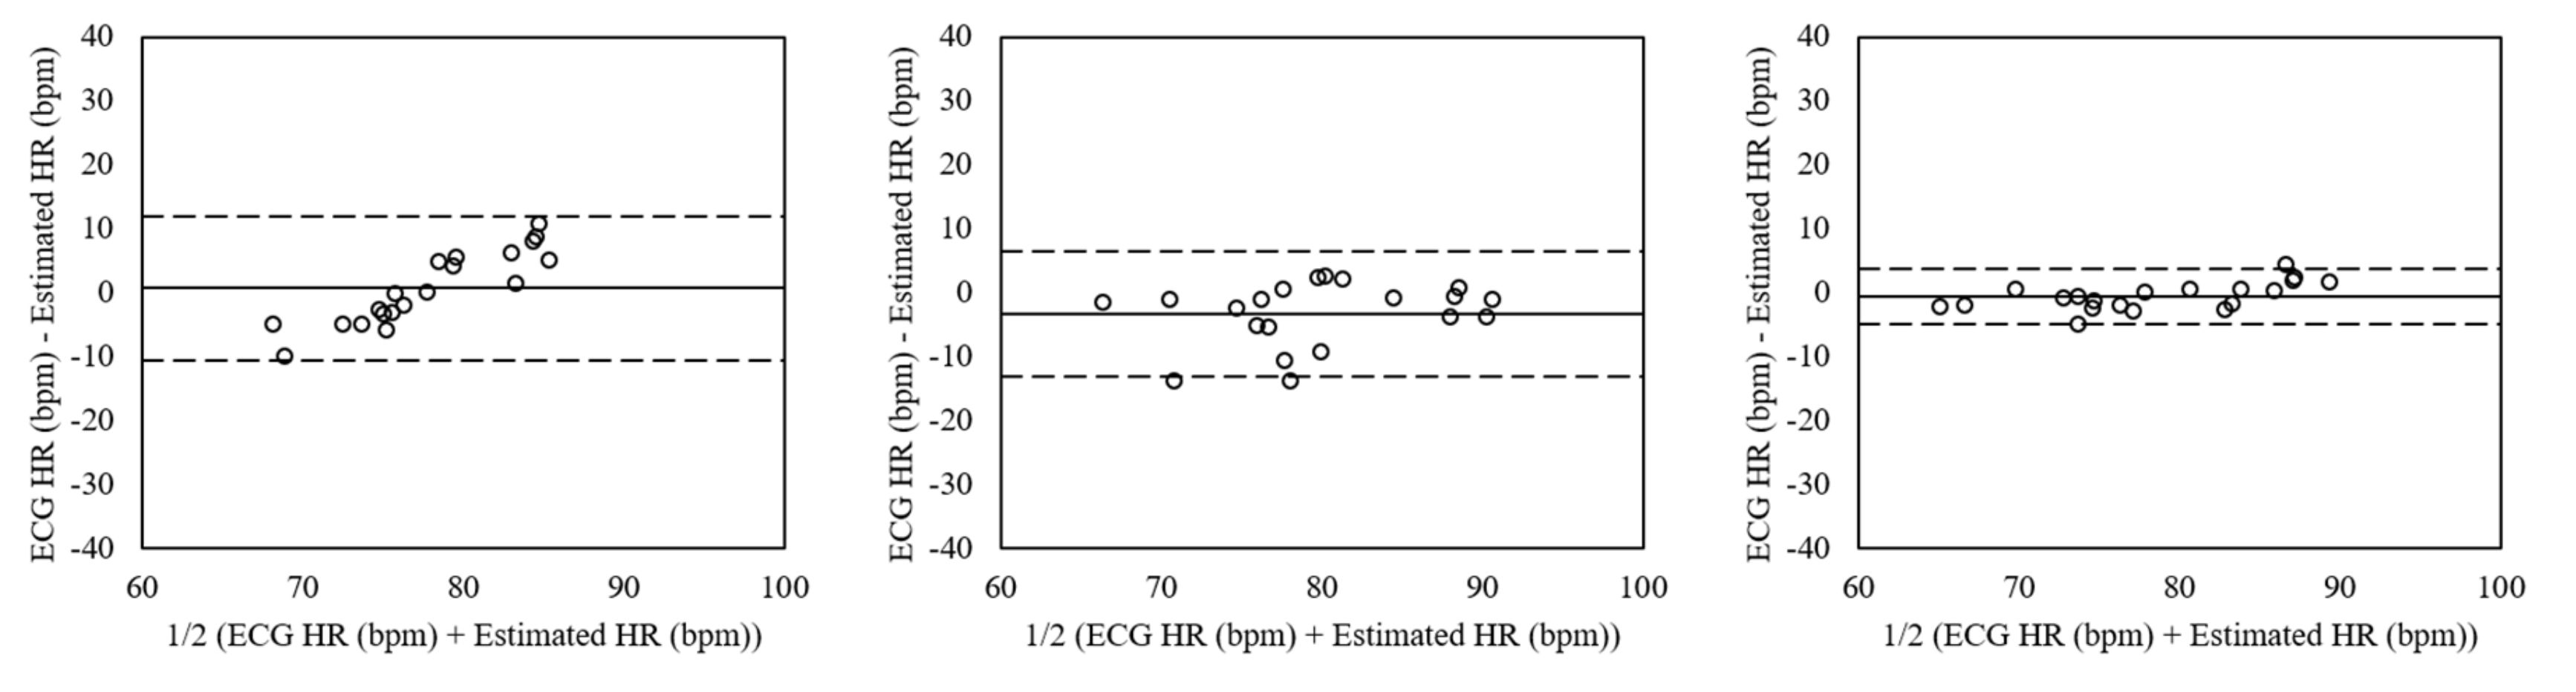
4.1. Experiment 1: Normal
4.2. Experiment 2: Facial Expressions
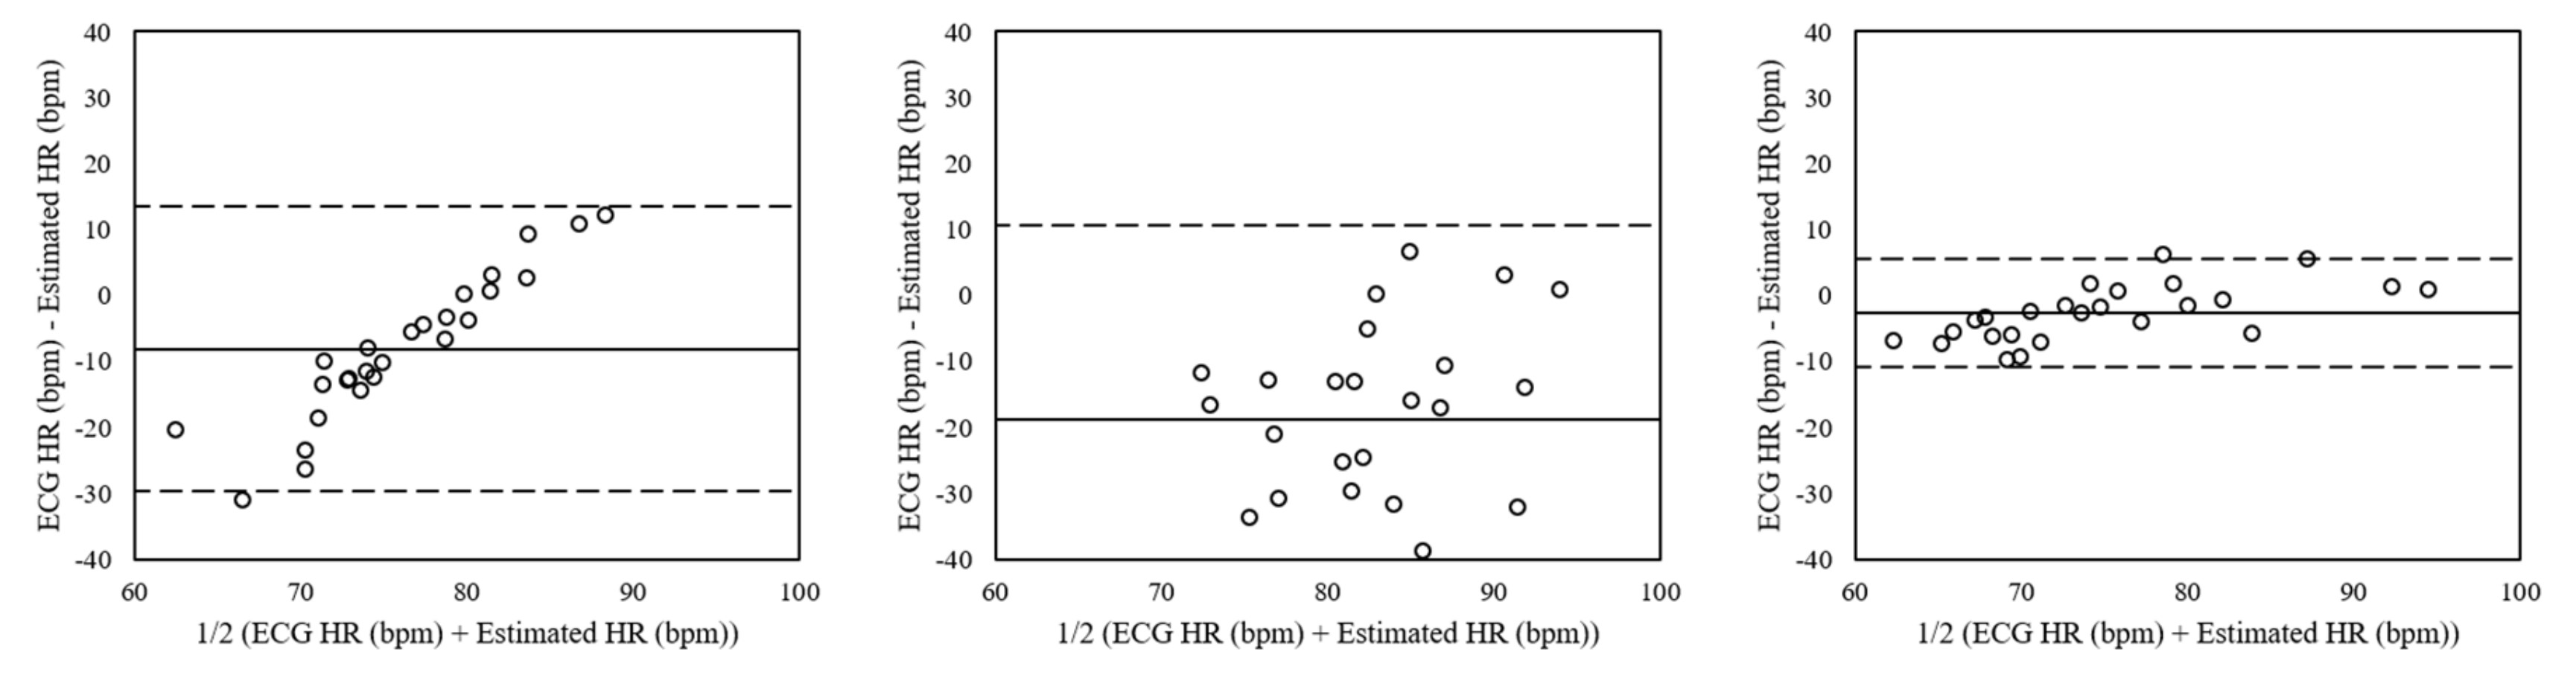
4.3. Experiment 3: Facial Expressions and Voluntary Head Motions
5. Discussion
6. Conclusions
Author Contributions
Funding
Conflicts of Interest
References
- Hertzman, A.B.; Dillon, J.B. Applications of photoelectric plethysmography in peripheral vascular disease. Am. Heart J. 1940, 20, 750–761. [Google Scholar] [CrossRef]
- Hassan, M.; Malik, A.; Fofi, D.; Saad, N.; Karasfi, B.; Ali, Y.; Meriaudeau, F. Heart rate estimation using facial video: A review. Biomed. Signal Process. Control 2017, 38, 346–360. [Google Scholar] [CrossRef]
- Poh, M.Z.; McDuff, D.J.; Picard, R.W. Non-contact, automated cardiac pulse measurements using video imaging and blind source separation. Opt. Express 2010, 18, 10762–10774. [Google Scholar] [CrossRef] [PubMed]
- De Haan, G.; Jeanne, V. Robust Pulse Rate from Chrominance-Based rPPG. IEEE Trans. Biomed. Eng. 2013, 60, 2878–2886. [Google Scholar] [CrossRef] [PubMed]
- De Haan, G.; Van Leest, A. Improved motion robustness of remote-PPG by using the blood volume pulse signature. Physiol. Meas. 2014, 35, 1913–1926. [Google Scholar] [CrossRef] [PubMed]
- Yan, Y.; Ma, X.; Yao, L.; Ouyang, J. Noncontact measurement of heart rate using facial video illuminated under natural light and signal weighted analysis. Biol. Med. Mater. Eng. 2015, 26, S903–S909. [Google Scholar] [CrossRef] [PubMed]
- Starr, I.; Rawson, A.J.; Schroeder, H.A.; Joseph, N.R. Studies on the Estimation of Cardiac Output in Man, and of Abnormalities in Cardiac Function, from the heart’s Recoil and the blood’s Impacts; the Ballistocardiogram. Am. J. Physiol. Leg. Content 1939, 127, 1–28. [Google Scholar] [CrossRef]
- Rouast, P.V.; Adam, M.T.P.; Chiong, R.; Cornforth, D.; Lux, E. Remote heart rate measurement using low-cost RGB face video: A technical literature review. Front. Comput. Sci. 2018, 12, 858–872. [Google Scholar] [CrossRef]
- Balakrishnan, G.; Durand, F.; Guttag, J. Detecting pulse from head motions in video. In Proceedings of the IEEE Conference on Computer Vision and Pattern Recognition (CVPR), Portland, OR, USA, 23–28 June 2013; pp. 3430–3437. [Google Scholar]
- Shan, L.; Yu, M. Video-based heart rate measurement using head motion tracking and ICA. In Proceedings of the 2013 6th International Congress on Image and Signal Processing (CISP), Hangzhou, China, 16–18 December 2013; pp. 160–164. [Google Scholar]
- Haque, M.A.; Nasrollahi, K.; Moeslund, T.B.; Irani, R. Facial video-based detection of physical fatigue for maximal muscle activity. IET Comput. Vis. 2016, 10, 323–330. [Google Scholar] [CrossRef]
- Hassan, M.A.; Malik, A.S.; Fofi, D.; Saad, N.M.; Ali, Y.S.; Meriaudeau, F. Video-Based Heartbeat Rate Measuring Method Using Ballistocardiography. IEEE Sens. J. 2017, 17, 4544–4557. [Google Scholar] [CrossRef]
- Zeiler, M.D.; Fergus, R. Visualizing and Understanding Convolutional Networks. In Proceedings of the European Conference on Computer Vision (ECCV), Zurich, Switzerland, 6–12 September 2014; pp. 818–833. [Google Scholar]
- He, K.; Zhang, X.; Ren, S.; Sun, J. Deep Residual Learning for Image Recognition. In Proceedings of the IEEE Conference on Computer Vision and Pattern Recognition (CVRP), Las Vegas, NV, USA, 26 June–1 July 2016; pp. 770–778. [Google Scholar]
- Kim, Y. Convolutional Neural Networks for Sentence Classification. In Proceedings of the 2014 Conference on Empirical Methods in Natural Language Processing (EMNLP), Doha, Qatar, 25–29 October 2014. [Google Scholar]
- Schlüter, J.; Grill, T. Exploring Data Augmentation for Improved Singing Voice Detection with Neural Networks. In Proceedings of the International Society for Music Information Retrieval Conference (ISMIR), Malaga, Spain, 26–30 October 2015; pp. 121–126. [Google Scholar]
- Um, T.T.; Babakeshizadeh, V.; Kulic, D. Exercise Motion Classification from Large-Scale Wearable Sensor Data Using Convolutional Networks. In Proceedings of the 2017 IEEE/RSJ International Conference on Intelligent Robots and Systems (IROS), Vancouver, BC, Canada, 24–28 September 2017. [Google Scholar]
- Lee, H.; Whang, M. Heart Rate Estimated from Body Movements at Six Degrees of Freedom by Convolutional Neural Networks. Sensors 2018, 18, 1392. [Google Scholar] [CrossRef] [PubMed]
- Grira, N.; Crucianu, M.; Boujemaa, N. Unsupervised and semi-supervised clustering: A brief survey. Rev. Mach. Learn. Tech. Process. Multimed. Content 2004, 1, 9–16. [Google Scholar]
- Viola, P.; Jones, M. Rapid object detection using a boosted cascade of simple features. In Proceedings of the IEEE Conference on Computer Vision and Pattern Recognition (CVPR), Kauai, HI, USA, 8–14 December 2001; pp. 511–518. [Google Scholar]
- Tommasini, T.; Fusiello, A.; Trucco, E.; Roberto, V. Making good features track better. In Proceedings of the IEEE Conference on Computer Vision and Pattern Recognition (CVPR), Santa Barbara, CA, USA, 23–25 June 1998; pp. 178–183. [Google Scholar]
- Bouguet, J.Y. Pyramidal implementation of the affine lucas kanade feature tracker description of the algorithm. Intel Corp. 2001, 5, 4. [Google Scholar]
- Pan, J.; Tompkins, W.J. A Real-Time QRS Detection Algorithm. IEEE Trans. Biomed. Eng. 1985, 32, 230–236. [Google Scholar] [CrossRef] [PubMed]
- Wong, M.A.; Hartigan, J.A. Algorithm AS 136: A K-Means Clustering Algorithm. J. R. Stat. Soc. Ser. C Appl. Stat. 1979, 28, 100–108. [Google Scholar]
- Soleymani, M.; Lichtenauer, J.; Pun, T.; Pantic, M. A Multimodal Database for Affect Recognition and Implicit Tagging. IEEE Trans. Affect. Comput. 2012, 3, 42–55. [Google Scholar] [CrossRef]
- Jones, E.; Oliphant, T.; Peterson, P. SciPy: Open Source Scientific Tools for Python. Available online: http://www.scipy.org (accessed on 11 March 2019).


| Methods | Signal Extraction | Signal Estimation | Heart Rate Estimation |
|---|---|---|---|
| Bal et al. 2013 [9] | VJ + GFTT + KLT | Bandpass + PCA | Peak detection, FFT |
| Shan et al. 2013 [10] | VJ + GFTT + KLT | Norm + Bandpass + ICA | FFT |
| Haque et al. 2016 [11] | VJ + GFTT + SDM | Bandpass + MA + PCA | FFT |
| Hassan et al. 2017 [12] | VJ + SCFS + KLT | Bandpass + SVD | FFT |
| Heart Rate Estimation | MAE | SDAE | RMSE | CC |
|---|---|---|---|---|
| Peak Detection | 3.95 | 2.49 | 4.70 | 0.933 ** |
| FFT | 2.76 | 5.91 | 6.61 | 0.967 ** |
| Clustering | 1.07 | 0.99 | 1.47 | 0.999 ** |
| Heart Rate Estimation | MAE | SDAE | RMSE | CC |
|---|---|---|---|---|
| Peak Detection | 5.66 | 3.81 | 6.85 | 0.829 ** |
| FFT | 10.08 | 12.93 | 16.68 | 0.776 ** |
| Clustering | 3.28 | 3.45 | 4.84 | 0.970 ** |
| Heart Rate Estimation. | MAE | SDAE | RMSE | CC |
|---|---|---|---|---|
| Peak Detection | 11.74 | 3.96 | 12.56 | 0.290 |
| FFT | 23.89 | 15.71 | 29.33 | 0.066 |
| Clustering | 5.99 | 5.24 | 8.09 | 0.836 ** |
| Methods | MAE | SDAE | RMSE | CC |
|---|---|---|---|---|
| Bal et al. 2013 [9] | 21.68 | 11.91 | 24.72 | 0.10 |
| Shan et al. 2013 [10] | 7.88 | 4.66 | 9.14 | 0.27 |
| Haque et al. 2016 [11] | 6.47 | 3.62 | 7.56 | 0.84** |
| Hassan et al. 2017 [12] | 4.34 | 3.14 | 5.29 | 0.921** |
| Proposed method | 5.99 | 5.24 | 8.09 | 0.836** |
© 2019 by the authors. Licensee MDPI, Basel, Switzerland. This article is an open access article distributed under the terms and conditions of the Creative Commons Attribution (CC BY) license (http://creativecommons.org/licenses/by/4.0/).
Share and Cite
Lee, H.; Cho, A.; Lee, S.; Whang, M. Vision-Based Measurement of Heart Rate from Ballistocardiographic Head Movements Using Unsupervised Clustering. Sensors 2019, 19, 3263. https://doi.org/10.3390/s19153263
Lee H, Cho A, Lee S, Whang M. Vision-Based Measurement of Heart Rate from Ballistocardiographic Head Movements Using Unsupervised Clustering. Sensors. 2019; 19(15):3263. https://doi.org/10.3390/s19153263
Chicago/Turabian StyleLee, Hyunwoo, Ayoung Cho, Seongwon Lee, and Mincheol Whang. 2019. "Vision-Based Measurement of Heart Rate from Ballistocardiographic Head Movements Using Unsupervised Clustering" Sensors 19, no. 15: 3263. https://doi.org/10.3390/s19153263
APA StyleLee, H., Cho, A., Lee, S., & Whang, M. (2019). Vision-Based Measurement of Heart Rate from Ballistocardiographic Head Movements Using Unsupervised Clustering. Sensors, 19(15), 3263. https://doi.org/10.3390/s19153263