Article

Interferometric DEM-Assisted High Precision Imaging Method for ArcSAR

1
School of Information Science and Technology, North China University of Technology (NCUT), Beijing 100144, China
2
Institute of Electronics, Chinese Academy of Science (IECAS), Beijing 100190, China
*
Author to whom correspondence should be addressed.
Sensors 2019, 19(13), 2921; https://doi.org/10.3390/s19132921
Submission received: 4 June 2019 / Revised: 26 June 2019 / Accepted: 28 June 2019 / Published: 1 July 2019
(This article belongs to the Special Issue Synthetic Aperture Radar (SAR) Techniques and Applications)

Abstract

:
Ground-based arc-scanning synthetic aperture radar (ArcSAR) is the novel ground-based synthetic aperture radar (GBSAR). It scans 360-degree surrounding scenes by the antenna attached to rotating boom. Therefore, compared with linear scanning GBSAR, ArcSAR has larger field of view. Although the feasibility of ArcSAR has been verified in recent years, its imaging algorithm still presents difficulties. The imaging accuracy of ArcSAR is affected by terrain fluctuation. For rotating scanning ArcSAR, even if targets in scenes have the same range and Doppler with antenna, if the heights of targets are different, their range migration will be different. Traditional ArcSAR imaging algorithms achieve imaging on reference plane. The height difference between reference plane and target in scenes will cause the decrease of imaging quality or even image defocusing because the range migration cannot be compensated correctly. For obtaining high-precision ArcSAR image, we propose interferometric DEM (digital elevation model)-assisted high precision imaging method for ArcSAR. The interferometric ArcSAR is utilized to acquire DEM. With the assist of DEM, target in scenes can be imaged on its actual height. In this paper, we analyze the error caused by ArcSAR imaging on reference plane. The method of extracting DEM on ground range for assisted ArcSAR imaging is also given. Besides, DEM accuracy and deformation monitoring accuracy of proposed method are analyzed. The effectiveness of the proposed method was verified by experiments.

1. Introduction

Synthetic aperture radar (SAR) is capable of high-resolution imaging all-day and all-weather conditions [1,2]. As a complex image, the SAR image contains amplitude and phase information. We can get the deformation of the scenes by differential interferometric SAR (D-InSAR). Therefore, SAR is widely used in the field of ground deformation monitoring [3,4,5]. Especially the spaceborne SAR can achieve ground deformation monitoring in a wide range of scenes [6]. However, the spaceborne SAR systems and airborne SAR system require a long revisit cycle. They cannot realize continuous and repeated monitoring of a region. As an alternative, the GBSAR can achieve continuous and repeated monitoring of a region and feedback monitoring information in real time. In view of the above advantages, GBSAR has become one of the important means for deformation monitoring of dams’ walls, buildings and slope [7,8,9,10].
The conventional GBSAR system scans the scenes along the linear rail. Its synthetic aperture is generated by moving the radar on the rail [11]. This type of working mode limits its field of view. A new mode GBSAR called ArcSAR can solve this problem. The ArcSAR system scans the surrounding scenes by the antenna attached to the rotating boom which extending from the center of the rotating platform. Its synthetic aperture is generated by the rotation of the antenna [12]. Therefore, under the premise of ensuring the resolution of the system, ArcSAR can cover the 360-degree scenes in once scanning, which effectively improve the field of view. Currently, several teams are working on the ArcSAR system [12,13,14,15,16,17,18,19,20], and the imaging algorithms for ArcSAR are also proposed.
Lee et al. deduced the geometric model and signal model of the ArcSAR system and proposed the imaging algorithm for ArcSAR [17,18]. Luo Yunhua et al. proposed the fast imaging algorithm for ArcSAR and used differential interferometric ArcSAR for ground deformation monitoring [19,20]. However, the above ArcSAR imaging algorithms perform the imaging on the reference plane. The imaging accuracy of the ArcSAR system is affected by the terrain fluctuation. For rotating scanning ArcSAR system, even if the targets in the scenes have the same range and Doppler with the antenna, the targets with different height have different range migration. Therefore, if the height of reference plane is inconsistent with the actual height of target in the scenes, the height difference between the reference plane and the target will cause the decrease of imaging quality or even image defocusing because the range migration cannot be compensated correctly.
To acquire the high precision ArcSAR image, the DEM of the scenes can be used to assist ArcSAR imaging. In this paper, we propose an interferometric DEM-assisted high precision imaging method for ArcSAR. Firstly, the DEM image of the scenes is acquired by interference with the ArcSAR slant range images. The acquired DEM image is on the slant range. However, we require the DEM image on the ground range to assist ArcSAR imaging. Thus, we next transform the DEM image on the slant range to the ground range. Finally, with the assist of the DEM image on the ground range, the target in the scenes can be imaged on its actual height. The proposed method does not rely on external DEM data. It can effectively avoid the decrease of ArcSAR imaging quality.
This paper proceeds as follows. The ArcSAR geometric model and signal model that consider the terrain of the scenes is introduced in Section 2. The error caused by ArcSAR imaging on the reference plane is analyzed in Section 3. The principle of the interferometric DEM-assisted high precision imaging method is given in Section 4. The DEM accuracy and deformation monitoring accuracy of proposed method are analyzed in Section 5. The effectiveness of the proposed high precision imaging method is verified by experiment in Section 6. In Section 7, we discuss the concluding remarks.

2. The Geometric Model and Signal Model of ArcSAR

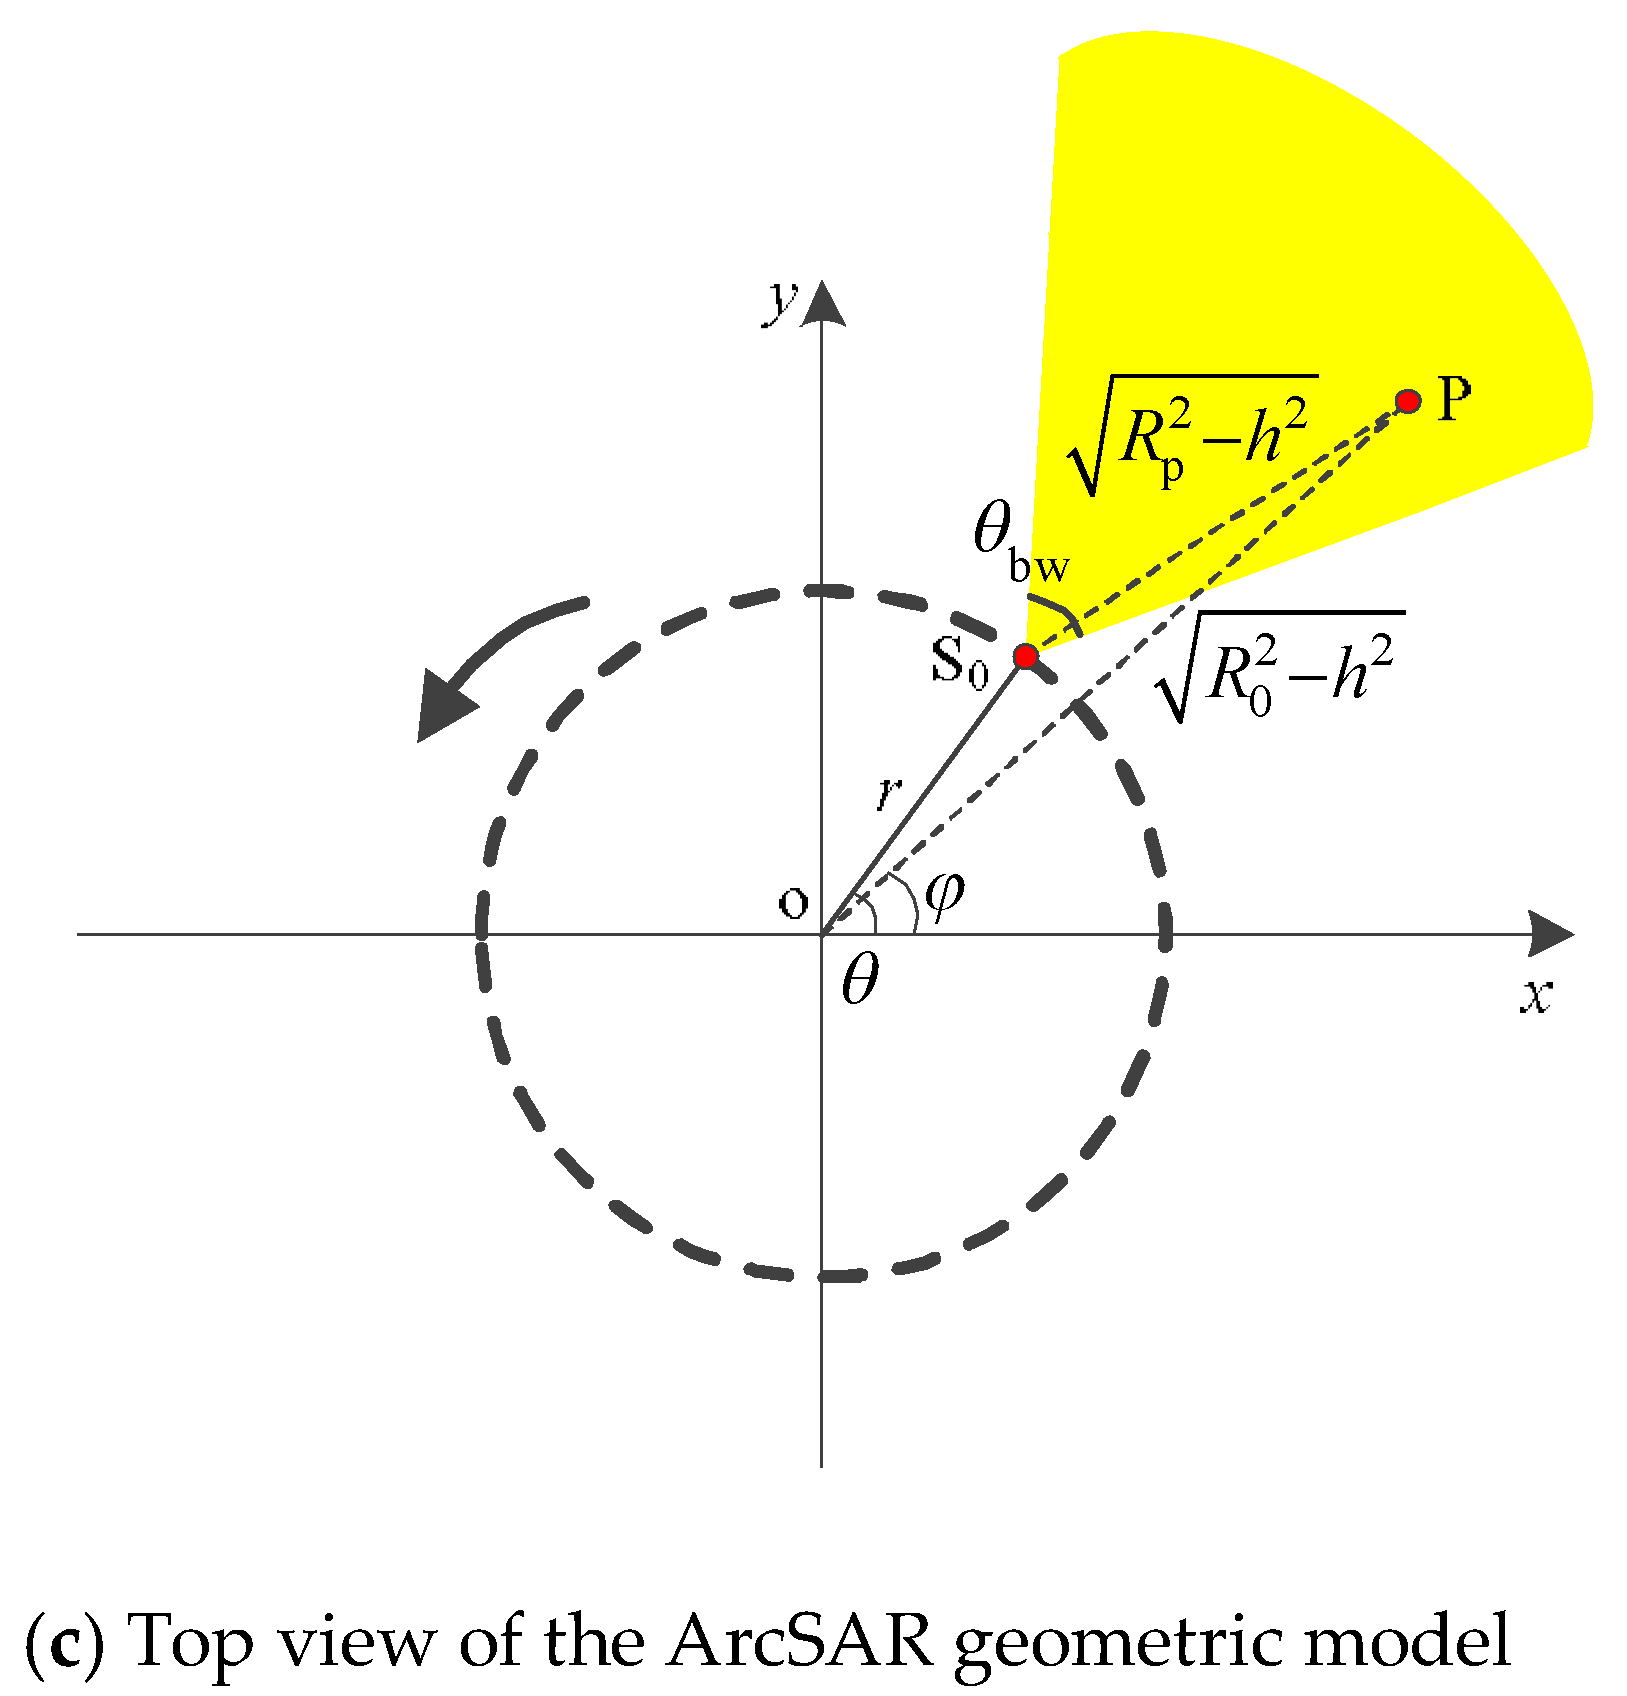
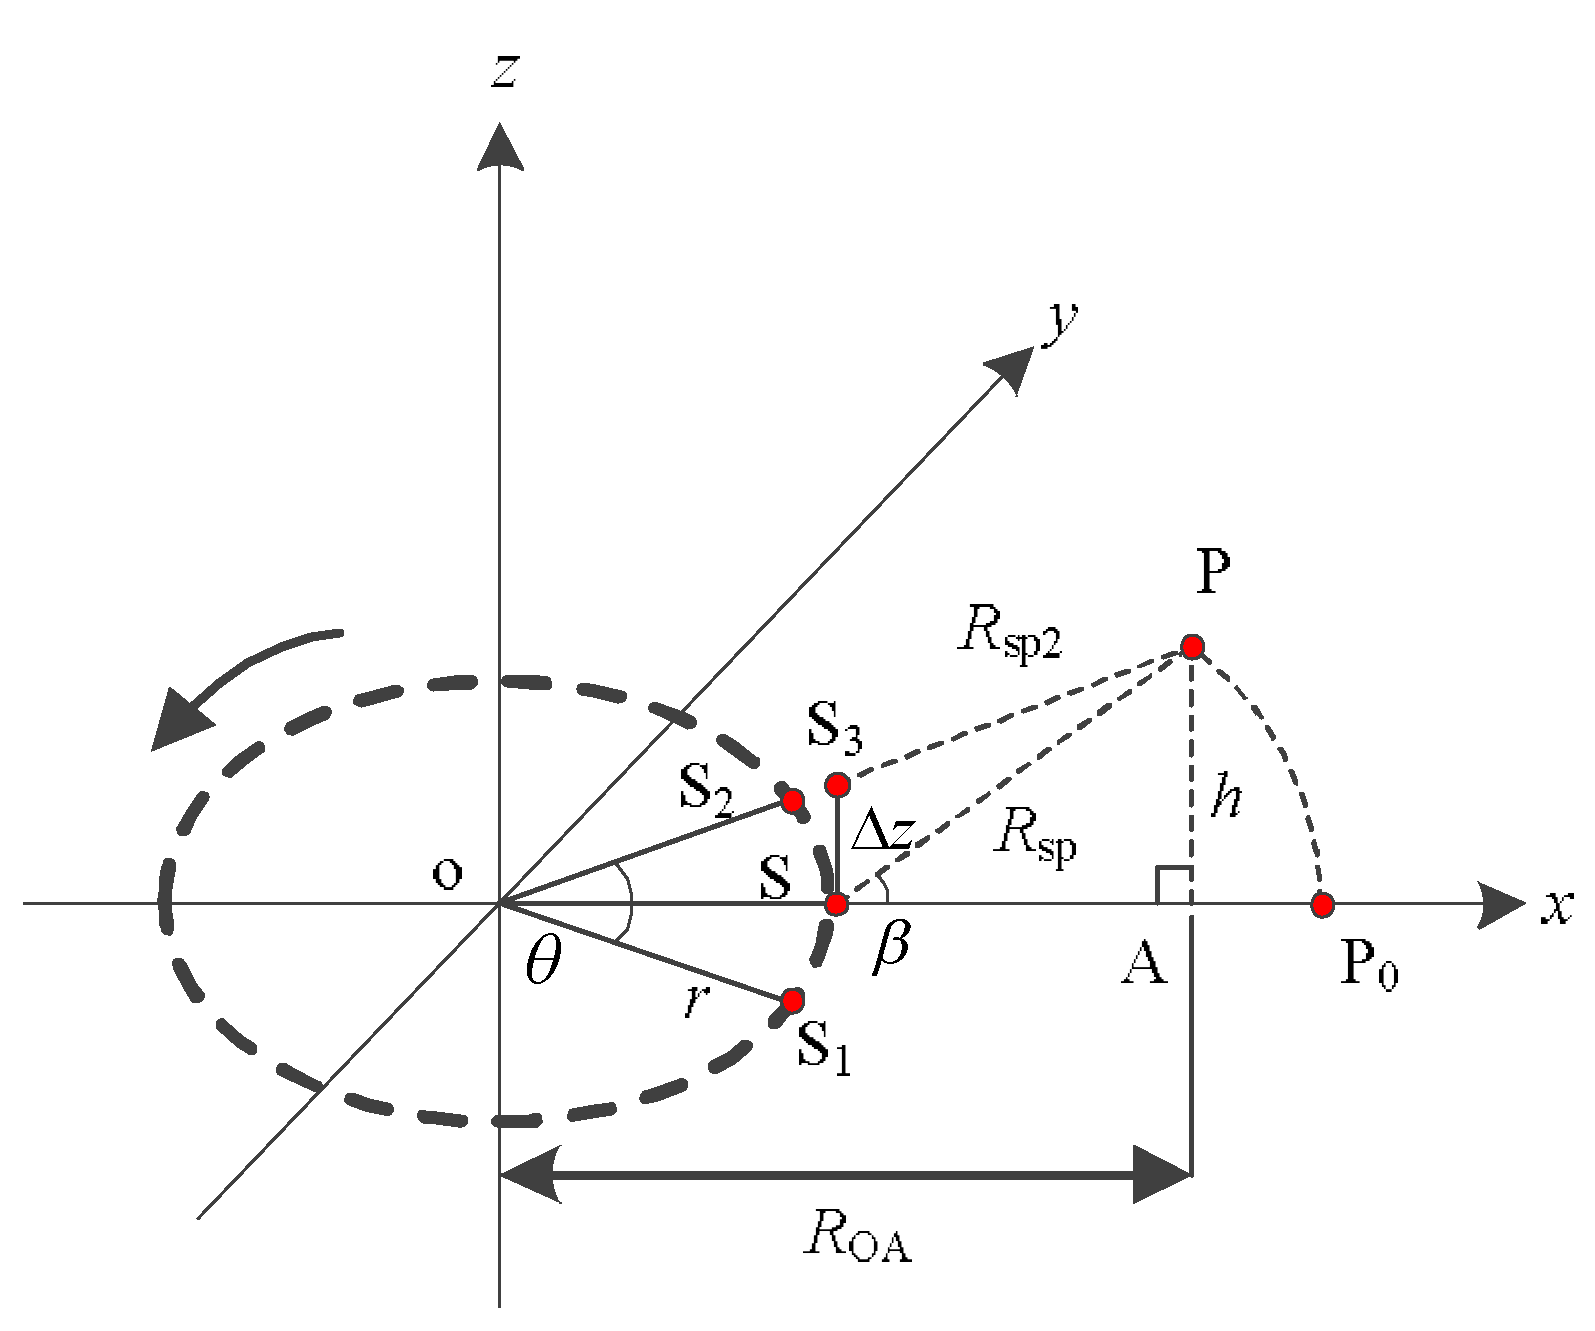
Figure 1 shows the geometric model of ArcSAR system. The antenna of ArcSAR mounted by the boom rotates counterclockwise. It transmits and receives signals at equal intervals. The coordinate z-axis is the rotation axis of the ArcSAR system. We select xoy plane as the rotation plane. Point o is the rotation center. Point P represents the target in the scenes. Its coordinates can be expressed as:
( R 0 2 h 2 cos φ , R 0 2 h 2 sin φ , h )
where R0 is the distance between the target P and the point o. h is the height of the target P. φ stands for the azimuth angle of the target position. Point S0 is the position of the antenna phase center (APC). Its coordinates are
( r cos θ , r sin θ , h )
where r represents the length of the boom and θ is the rotation angle of the boom.
Taking example for linear frequency modulation (LFM) signal, the echo signal of the target P in ArcSAR system is shown as:
S ( θ , t r ) = δ p r e c t ( ( t r 2 R p / c ) / T p ) rect ( ( θ - φ ) / θ bw ) exp ( j π K r ( t r 2 R p / c ) 2 ) exp ( j 4 π f c R p / c )
where δp is the backscattering coefficient, tr is the fast time of the ArcSAR system, c represents the speed of light, Tp stands for the signal pulse width, θbw is the antenna beam width, Kr represents the linear frequency modulation (LFM) rate, and fc is the center frequency. Rp represents the distance between target P and the APC, which can be expressed as:
R p = R 0 2 + r 2 2 r R 0 2 - h 2 cos ( θ φ )
We perform pulse compression of S(θ,tr) in the frequency domain on the range direction. The result can be expressed as:
S ( θ , f ) = δ p rect ( ( θ - φ ) / θ bw ) rect ( f / B r ) exp [ j 4 π ( f + f c ) R p / c ]
where f is the current frequency in frequency domain after the spectral transformation of signal S(θ,tr), Br is the bandwidth. Since the echo signal has a shift-invariant characteristic in the azimuth direction, targets with different φ have the same form of range migration if they are the same distance from the rotation center. Therefore, for the convenience of derivation, in this paper, we assume φ = 0. The backscattering coefficient is also neglected. Rp and S(θ, f) can be rewritten as a current frequency in a frequency domain:
R p = R 0 2 + r 2 2 r R 0 2 - h 2 cos θ
S ( θ , f ) = rect ( θ / θ bw ) rect ( f / B r ) exp [ j 4 π ( f + f c ) R p / c ]

3. Analyzing the Error Caused by ArcSAR Imaging on the Reference Plane

In this section, the error model of ArcSAR imaging on the reference plane is first built. Then, the height difference threshold for determining whether the ArcSAR image will severely defocus is calculated. We also explore the relationship between height difference threshold and system parameters.

3.1. The Error Model of ArcSAR Imaging on the Reference Plane

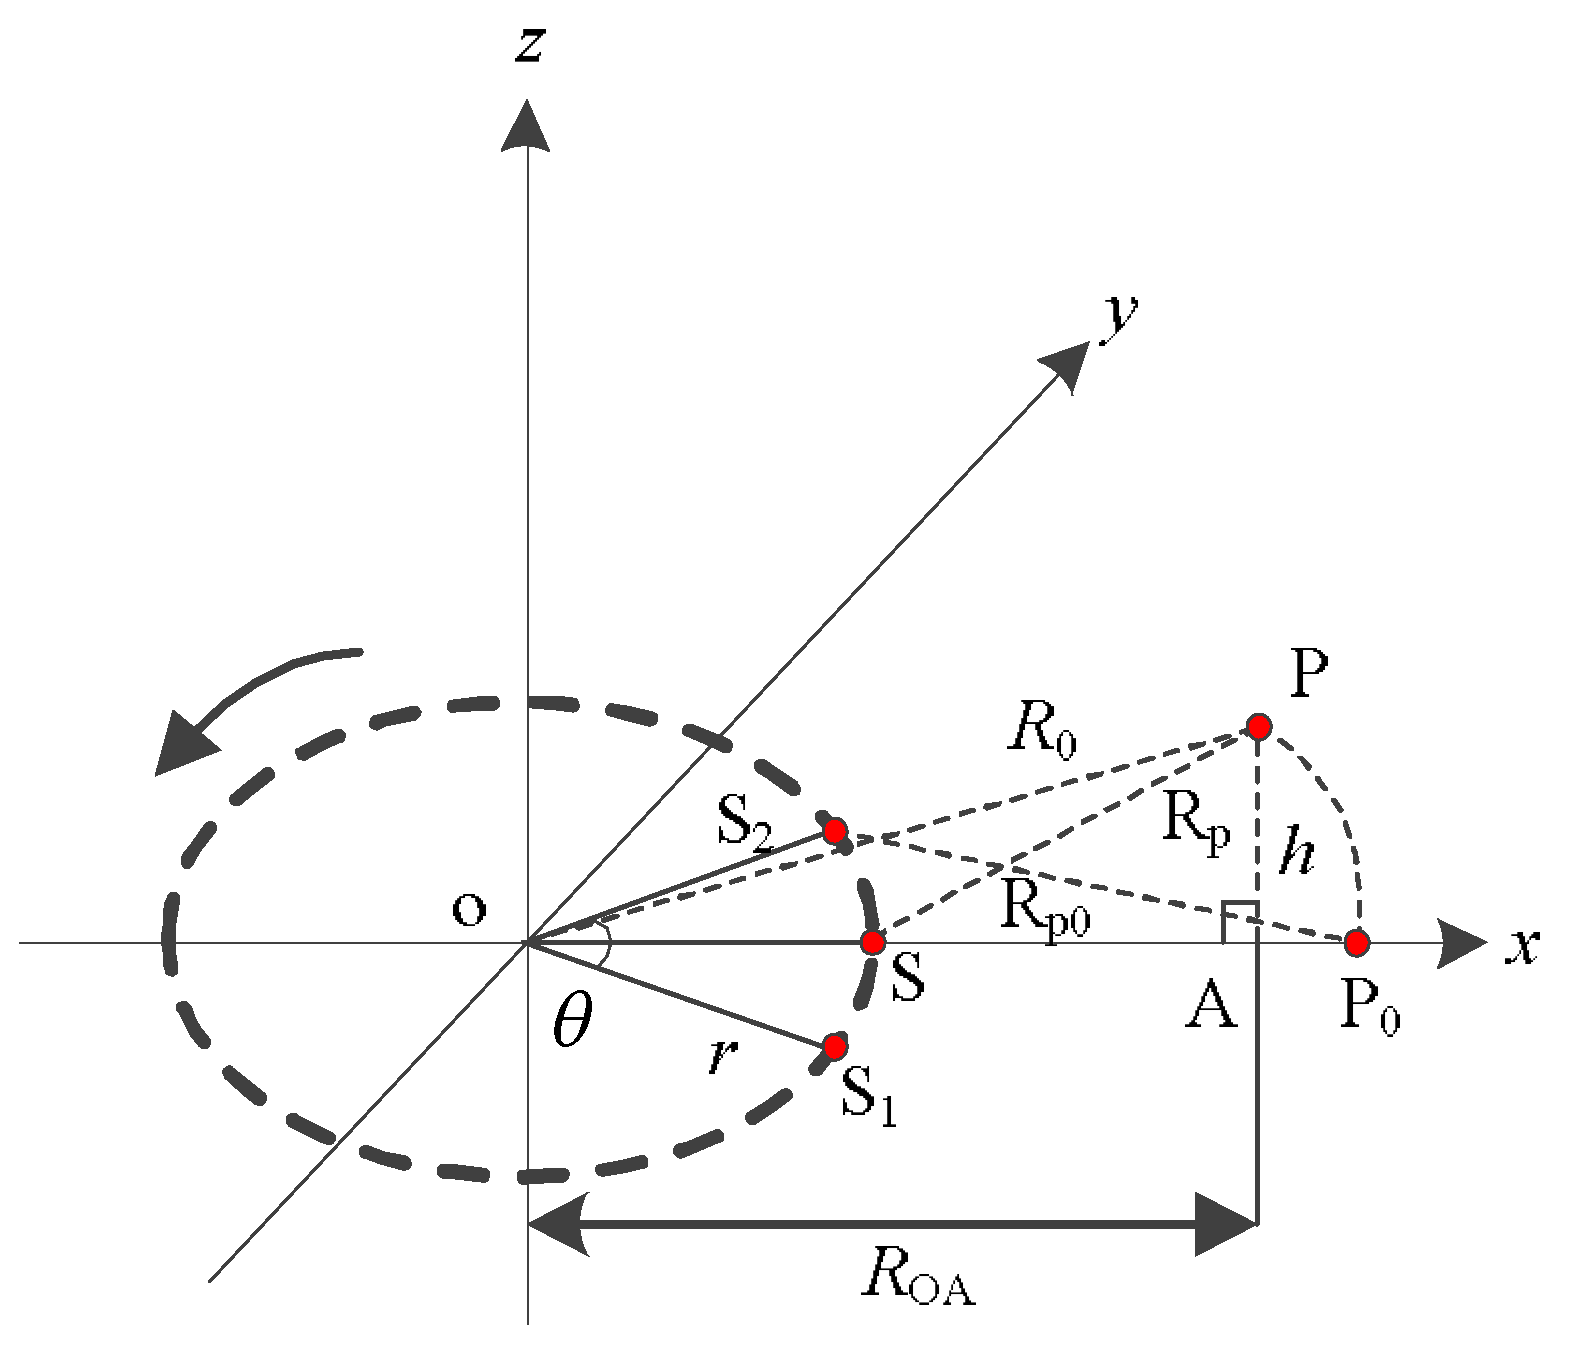
As shown in Figure 2, the antenna rotates counterclockwise from S1 to S2. When the antenna rotates to S, it is closest to the target P. The xoy plane is defined as the reference plane (the xoy plane is defined as the reference plane in subsequent parts of this paper). We use the backward projection algorithm (BP algorithm) to achieve the imaging of the target P on the reference plane. The P0 is the imaging result on the reference plane. It has the same range and Doppler from the antenna with target P. However, referring to the geometric model given in Figure 2, target P and P0 has different range migration because the height of the reference plane is inconsistent with the actual height of the target P.
The inverse Fourier transform is performed on S(θ, f) at the range direction to obtain its time domain form, which can be expressed as:
S c ( θ , t r ) = sin c ( B r ( t r - 2 R p / c ) ) exp ( j 4 π f c c R p )
The exponential term of Sc(θ,tr) represents the range migration, which must be compensated during the process of focusing. Therefore, the matched filter is used to compensate for the range migration of Sc(θ,tr). The ideal matched filter is expressed as follows:
H ( θ , t r ) = exp { j 4 π f c c R p }
However, the actual matched filter used to compensate for the range migration of target P is different from the ideal matched filter because target P and P0 have different range migrations. The actual matched filter contains the phase error, which means the range migration of target P cannot be compensated correctly. The actual matched filter can be expressed as:
H ( θ , t r ) = exp { j ( 4 π f c c R p + Δ p ) }
where ∆p represents the phase error:
Δ p = 4 π f c c ( R p 0 R p )
where Rp0 represents the distance between P0 and the APC, which can be expressed as:
R p 0 = ( R OA r ) 2 + r 2 + h 2 2 r ( R OA r ) 2 + h 2 cos θ
R OA = R 0 2 h 2
where ROA is the ground range from the target to the rotation center. Therefore, the imaging result of the target P on the reference plane is
G p 0 = θ S c ( θ , t r ) H ( θ , t r ) d θ = θ B r sin c ( B r ( t r - 2 R p / c ) ) exp ( j Δ p ) d θ
The matched filter in Equation (10) cannot correctly compensate for the range migration. Thus, the imaging quality of the target P on the reference plane will decrease.
Then, we derive the condition for the defocusing of the ArcSAR imaging result on the reference plane. According to Equation (11), the occurrence of ∆p is due to the slant range error caused by Rp and Rp0. We define the slant range error as the ∆R, which can be expressed as:
Δ R = R p 0 R p
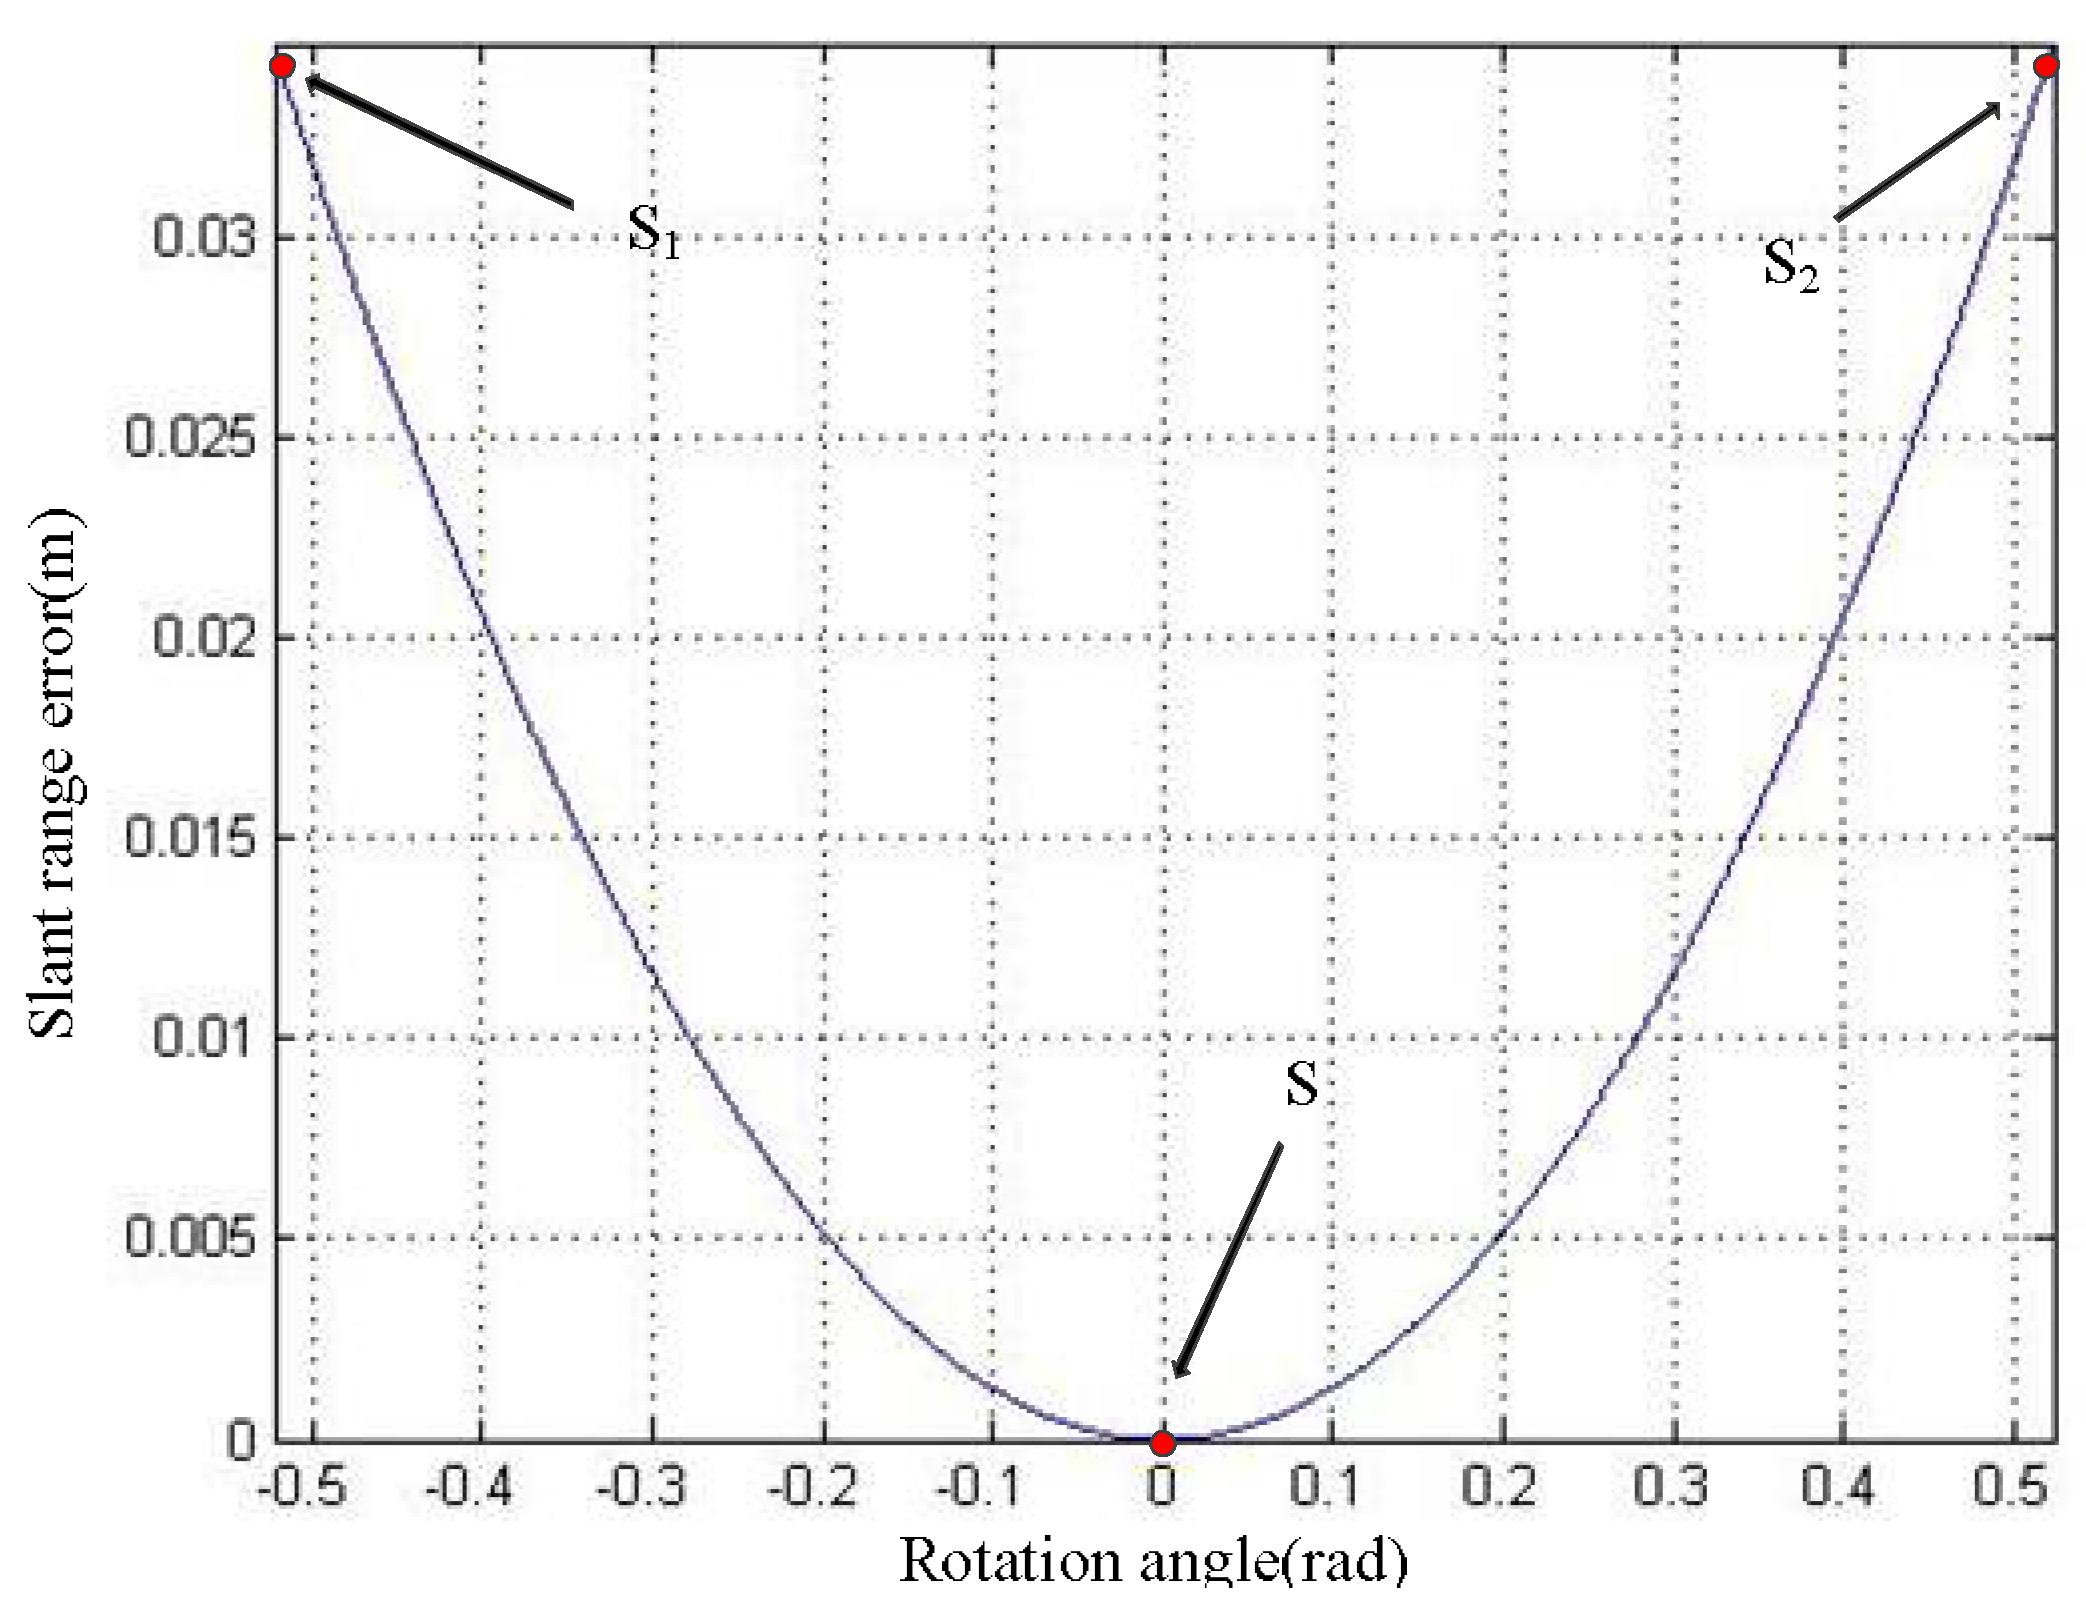
Equations (6) and (12) indicate that the ∆R is the function of θ. The relationship curve of θ and ∆R is shown in Figure 3. S1, S and S2 are marked in the curve. As can be seen from the curve, when the antenna is at point S, the value of slant range error is zero. As the antenna deviates from position S, the value of slant range error gradually increases. When the antenna is at S1 and S2, the value of slant range error is the largest. We define the maximum slant range error as ∆Rmax.
The maximum phase error acceptable for SAR image is π/4 [21]. If the phase error exceeds π/4, the SAR image will severely defocus (when the phase error is less than π/4, this error is too small for SAR imaging to be ignored). Therefore, the condition for severe defocusing of the ArcSAR imaging result on the reference plane is:
Δ p max π / 4 4 π f c c Δ R max π / 4 Δ R max λ 16
where λ represents the wavelength.

3.2. The Relationship between Height Difference Threshold and System Parameters

In this part, we calculate the height difference threshold for determining whether the ArcSAR imaging result on the reference plane will severely defocus, and analyze the relationship between the height difference threshold and the system parameters. We define the height of the reference plane as href, which the value is 0 m. The geometric relationship is shown in Figure 2. The necessary parameters are given in Table 1.
Rsp is the minimum slant range between the antenna and the target during the rotation. The relationship between height of the target and ∆Rmax is as follows:
R p 0 max R p max = Δ R max
R p 0 max = ( r sin θ 2 ) 2 + ( R sp + r r cos θ 2 ) 2
R p max = ( r sin θ 2 ) 2 + ( R sp - h 2 + r r cos θ 2 ) 2 + h 2
where Rpmax is the maximum slant range between the antenna and the target P during system rotation, Rp0max represents the maximum slant range between the antenna and P0 during system rotation. According to Equations (17)–(19) and the parameters given in Table 1, we can get the h–∆Rmax relationship curve (Figure 4).
With reference to Figure 4, it can be seen that the ∆Rmax increases with h. Applying the parameters of Table 1 to Equations (17)–(19), we calculate that the height difference threshold is 38.26 m. When h exceeds 38.26 m, the ArcSAR image of target P on the reference plane will severely defocus. We give the simulated imaging results of the target P on the reference plane in Figure 5. When h is 0 m, the imaging result of target P on the reference plane has no defocusing because the height of the reference plane is consistent with the actual height of the target at this time. When h is 80 m, the height of the target P exceeds height difference threshold, thus the imaging result of target P on the reference plane appears severe defocusing.
The height difference threshold is determined by the system parameters given in Table 1. Therefore, the change of system parameters has an impact on height difference threshold: under the premise of changing only single system parameter, the increase of θbw, θ and Rsp will cause the height difference threshold to rise, while the increase of the fc, r will cause the height difference threshold to decrease.

4. The Principle of Interferometric DEM-Assisted High Precision Imaging Method for ArcSAR

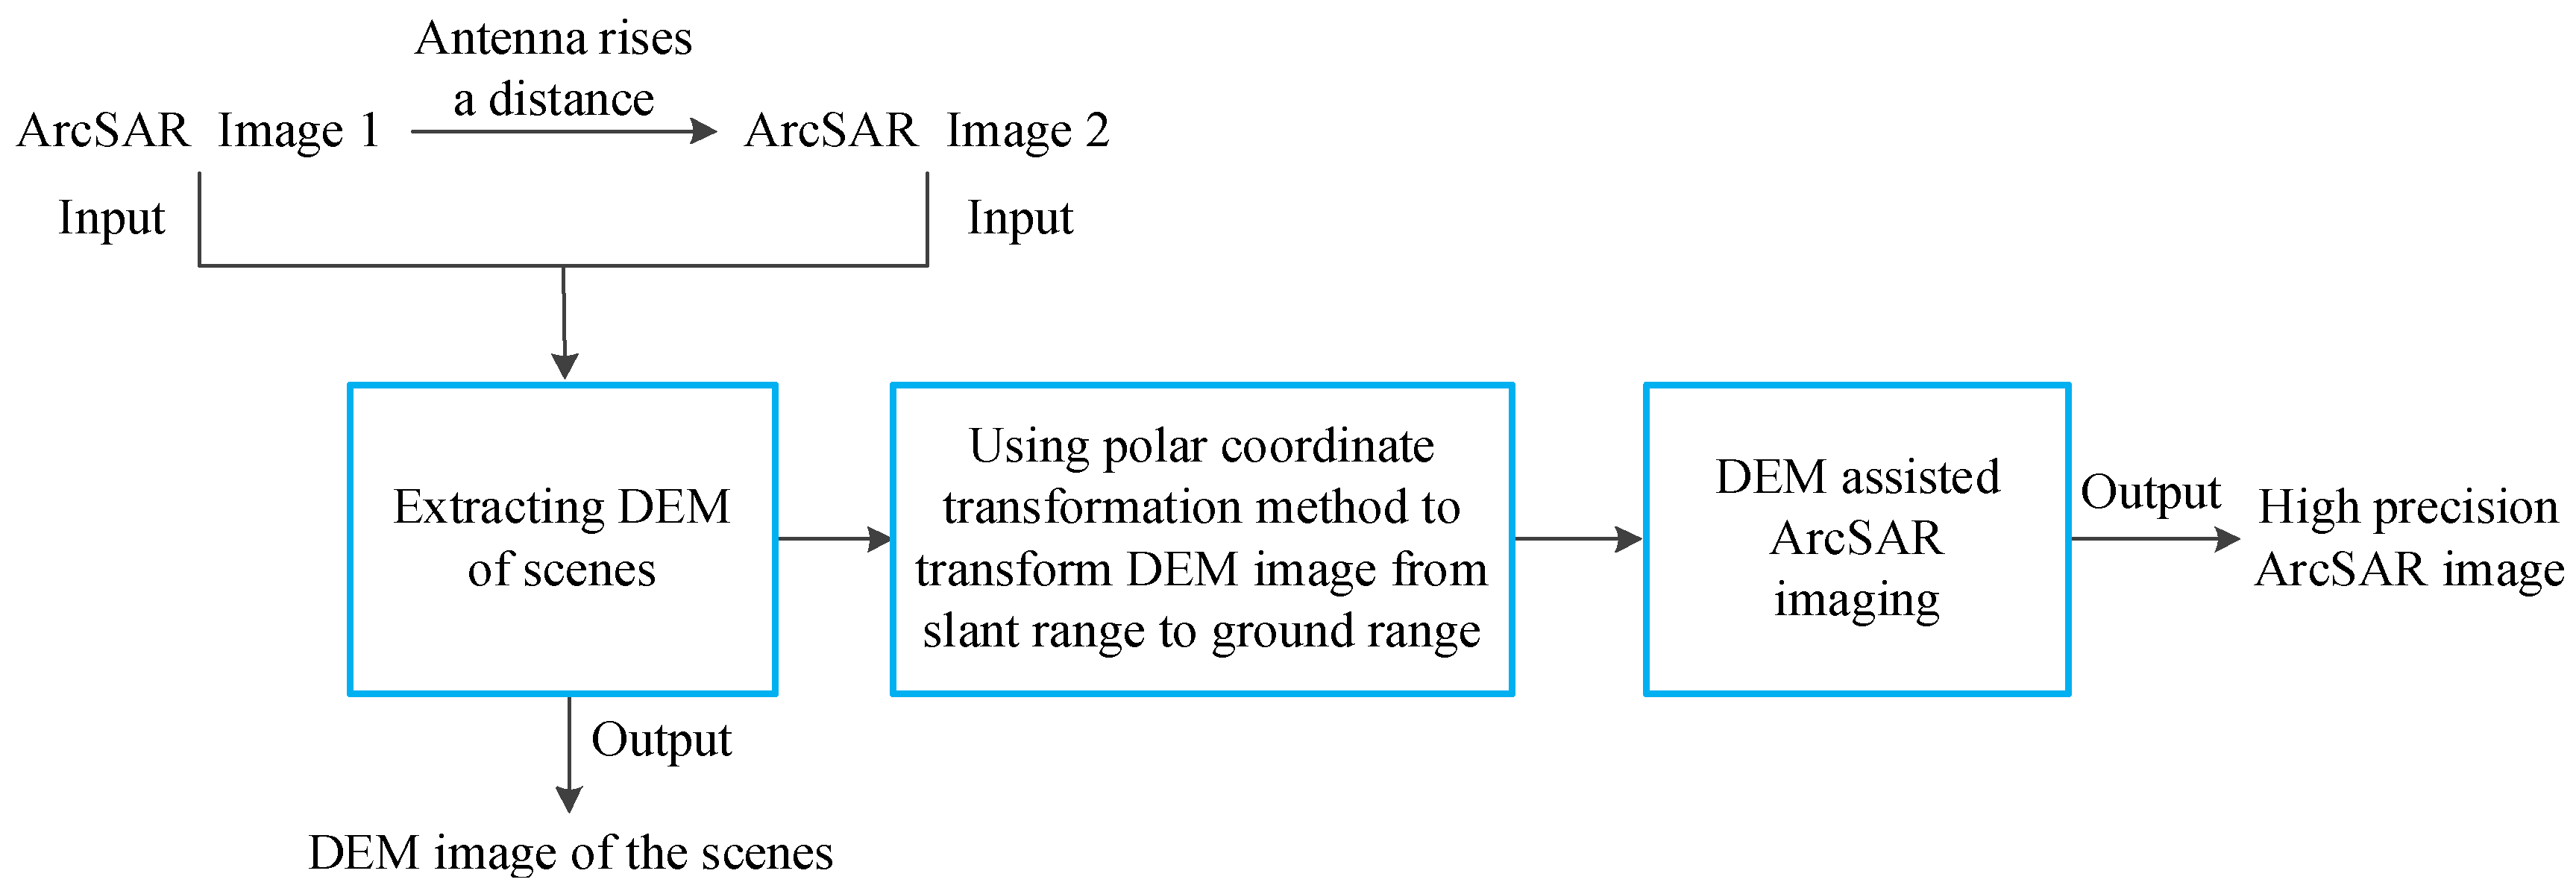
From the analysis of previous section, the ArcSAR imaging result on the reference plane is affected by the terrain fluctuation. For acquiring high precision ArcSAR image, an interferometric DEM-assisted high precision imaging method for ArcSAR is proposed in this paper. The interferometric ArcSAR is utilized to acquire the scenes DEM on the slant range. Since DEM-assisted ArcSAR imaging requires the DEM image on the ground range, we propose a polar coordinate transformation method for transforming DEM image from slant range to ground range. With the assist of DEM image on the ground range, the target in the scenes can be imaged on its actual height.
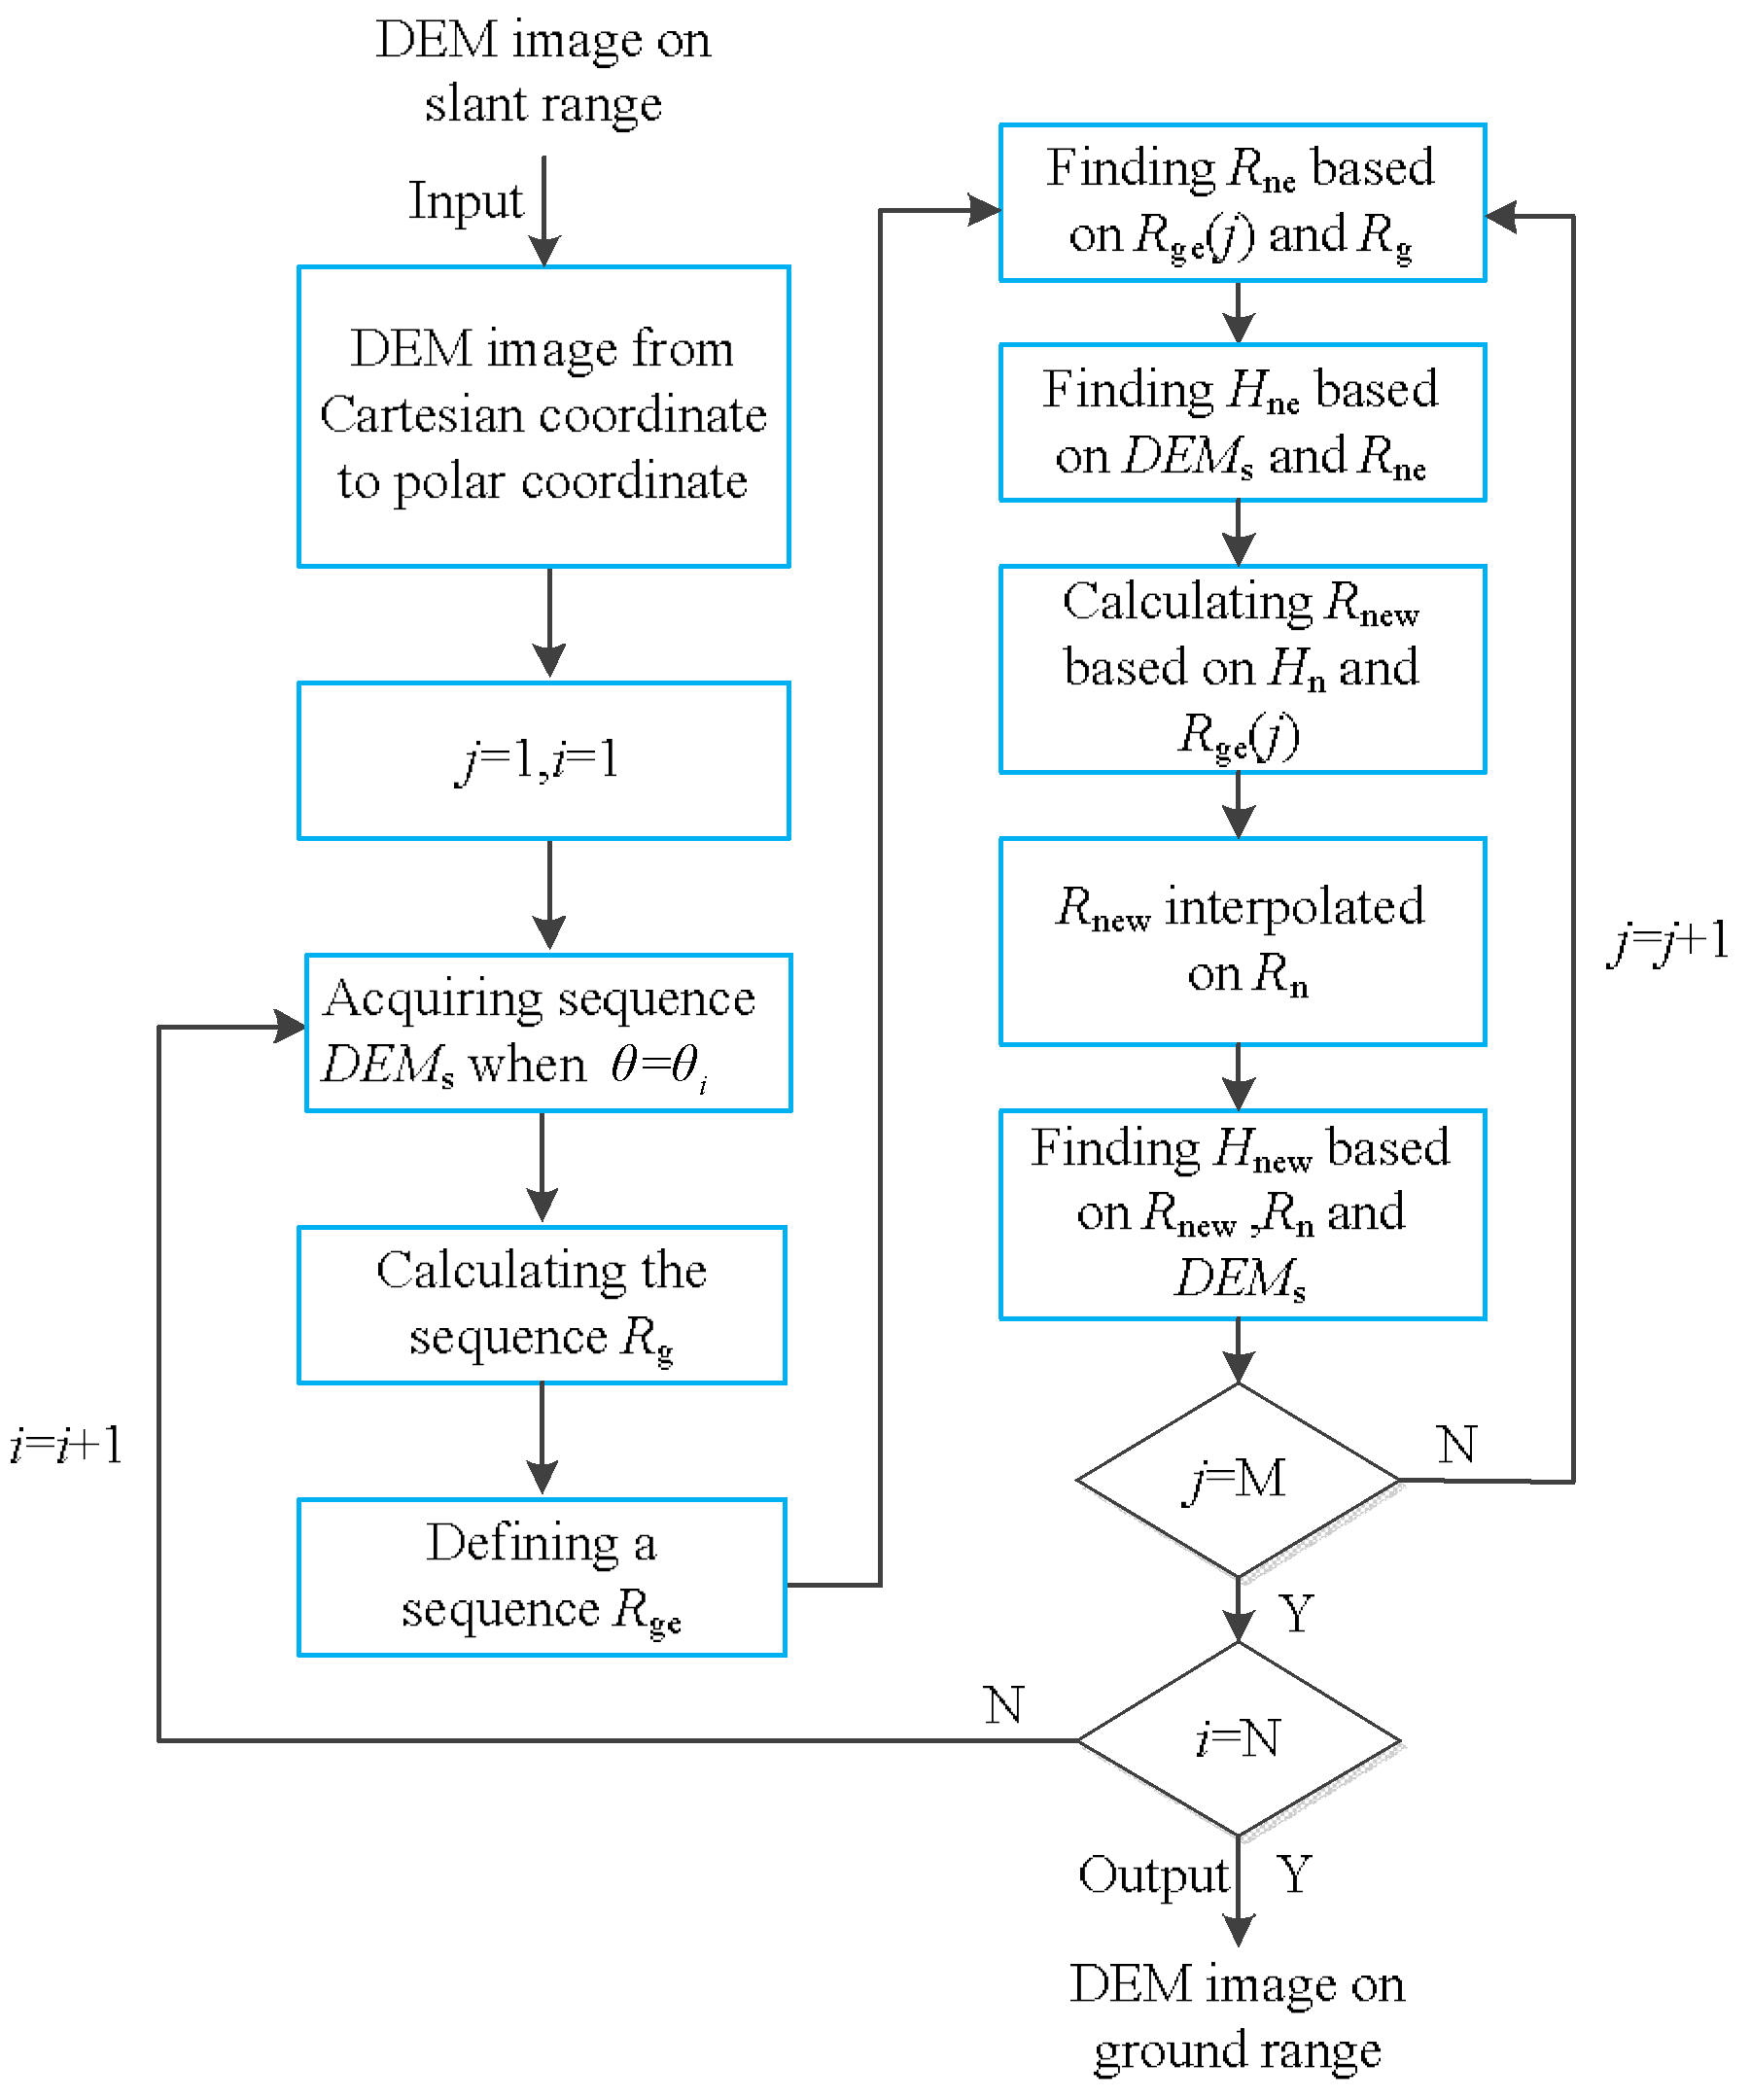
The steps of the above method are as follows: (1) The ArcSAR system is utilized to scan the same scenes at two different heights for getting ArcSAR Image 1 and ArcSAR Image 2. It should be noted that the acquired two ArcSAR images are the imaging results on the reference plane. Although the imaging accuracy of them is affected by the terrain fluctuation, their phase information can be used to obtain the interferometric phase. (2) ArcSAR Image 1 and ArcSAR Image 2 are used for interference to obtain interferometric phase. (3) We perform the operations of flat phase removing and phase unwrapping for the interferometric phase. (4) The unwrapped interferometric phase is used to inverse the DEM of the scenes. (5) The DEM image in slant range is transformed to the ground range by proposed polar coordinate transformation method. (6) The DEM of the scenes is used to assist ArcSAR imaging. A flow chart of the above method is shown in Figure 6.

4.1. Interferometric ArcSAR Extraction DEM of Scenes

Since the method of extracting DEM of the scenes using InSAR is relatively mature [22,23], we only briefly describe the main principle of interferometric ArcSAR in this section.
The model of interferometric ArcSAR is shown in Figure 7. Firstly, the antenna scans the target P at two different heights to obtain the imaging results on the reference plane, which can be shown as:
G 1 = E s exp ( - j 4 π λ R sp )
G 2 = E s exp ( - j 4 π λ R sp 2 )
where G1 is the ArcSAR image taken when antenna is rotating on the xoy plane and G2 is the ArcSAR image taken after raising the antenna to leave the xoy plane. The height baseline is ∆z. Es stands for the amplitude information of the SAR image. Rsp2 represents the distance from S3 to the target P.
Then, we can acquire the complex conjugate result of G1and G2:
G 2 G 1 = E s 2 exp ( - j 4 π λ R sp 2 ) exp ( j 4 π λ R sp ) = E s 2 exp ( j 4 π λ ( R sp - R sp 2 ) )
According to Equation (22), the interferometric phase p1 can be expressed as:
p 1 = 4 π λ ( R sp - R sp 2 )
Based on the work in [22], plane wave approximation is used to simplify the derivation process. Thus, Rsp2 can be approximated as:
R sp 2 = R sp - δ
where δ is the difference of Rsp and Rsp2, which can be expressed as
δ = Δ z h R sp = Δ z sin β
Thus, the p1 is rewritten as:
p 1 = 4 π λ Δ z sin β
β is the angle between Rsp and the reference plane, which can be expressed as:
β = sin - 1 ( λ 4 π Δ z p 1 )
The height of the target P can be expressed as:
h = R sp sin β = R sp ( λ 4 π Δ z p 1 )

4.2. DEM Image Transforming from Slant Range to Ground Range

In this paper, the ArcSAR images used for extracting DEM are the slant range images. Therefore, on the range direction, the pixel units of the ArcSAR image are equally spaced according to the slant range. The DEM image obtained by the interference with the ArcSAR images is also the slant range image (each pixel unit on the DEM image represents DEM data). However, assisted ArcSAR imaging requires the use of DEM image on the ground range. Thus, it is necessary to transform the DEM image from slant range to ground range.
The process of DEM image from slant range to ground range in linear scanning GBSAR is generally achieved in Cartesian coordinate system. This is because the range direction and azimuth direction of the linear scanning GBSAR are along the coordinate axes of the Cartesian coordinate. Thus, in the Cartesian coordinate system, the linear scanning of GBSAR only requires operating in one dimension to complete the transformation of the DEM image.
However, if we realize the transformation of ArcSAR DEM image in Cartesian coordinate system, we have to operate in two dimensions. Because the azimuth direction of the ArcSAR system is the rotation direction of the antenna, and the range distance of the ArcSAR is the radial direction of the antenna motion track. To simplify the transformation process of ArcSAR DEM image, we propose a transformation method in polar coordinate system.
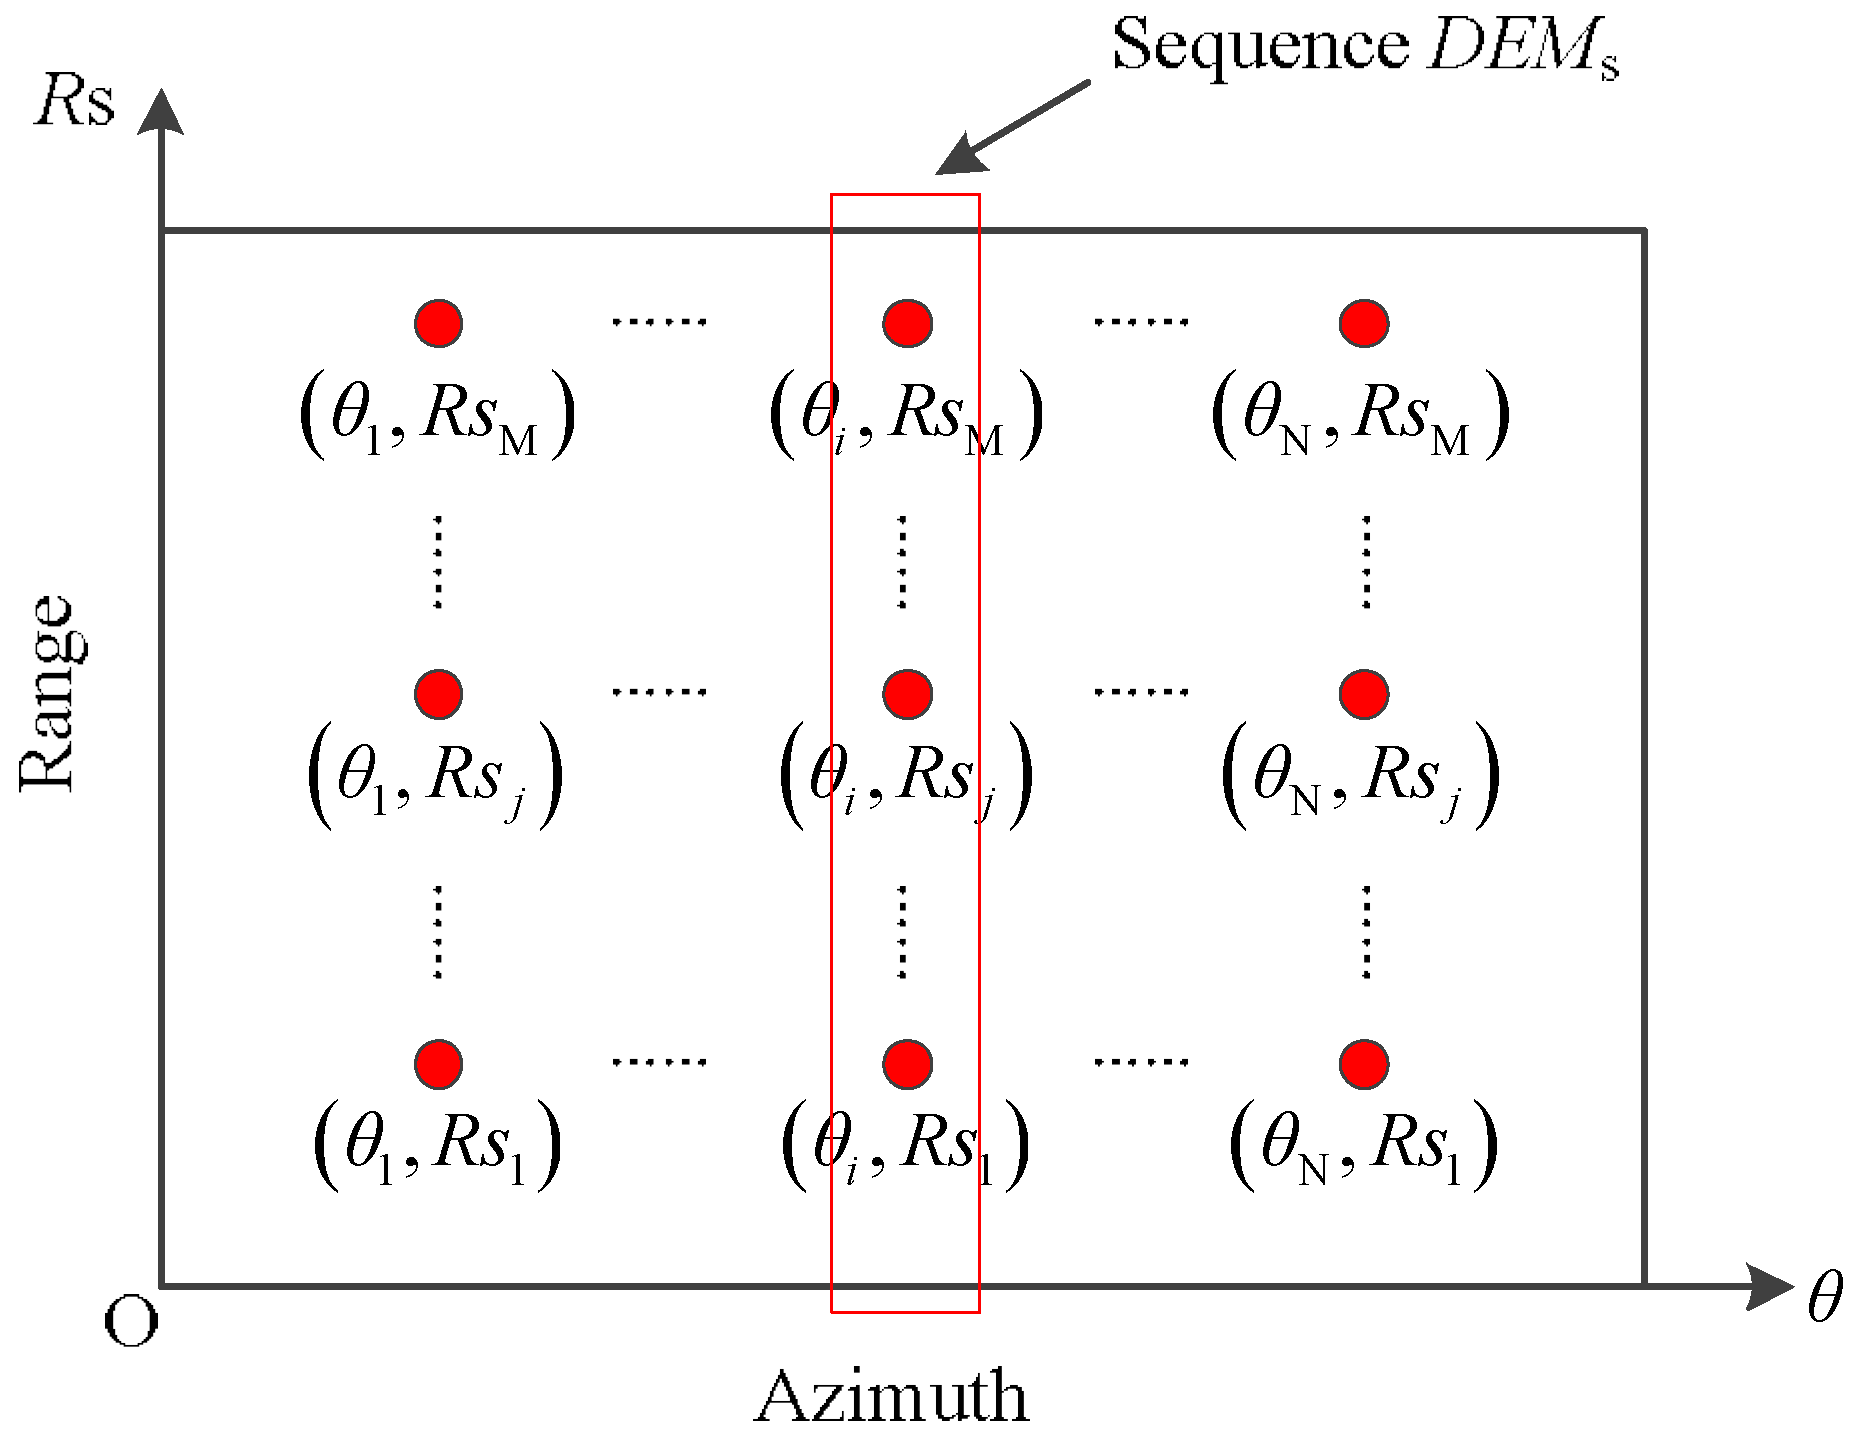
The DEM image in polar coordinate system is shown in Figure 8. The θ-axis of the coordinate system represents the azimuth direction. The pixel units in azimuth direction are equally spaced according to the rotation angle (θ) of the ArcSAR system, and there are N pixel units in this direction. The Rs-axis of the coordinate system represents the range direction. The pixel units in this direction are equally spaced according to the slant range (Rs), and there are M pixel units in this direction. The size of the DEM image is M×N. The coordinates of the pixel units are also indicated in Figure 8. Taking the pixel unit with coordinate (θi, Rsj) as an example, we discuss the process of transforming the pixel unit from slant range to ground range. The specific operation steps of the proposed transformation method are as follows,
  • When θ = θi (i = 1, 2, ..., N), the sequence DEMs are taken from the DEM image. This sequence stores the DEM data in the DEM image at θ = θi. Its size is M×1. At the same time, we define a slant range sequence Rn. It stores the slant range corresponding to each element in the sequence DEMs, which can be expressed as:
    R n = [ R s 1 , R s 2 , ... , R s j , ... , R s M ] ( j = 1 , 2 , ... , M )
  • We calculate the ground range sequence Rg using the geometric relationship between the sequence DEMs and the sequence Rn. The flow chart of the calculation process is shown in Figure 9. Sequence Rg stores the ground range corresponding to each DEM data in the sequence DEMs.
  • We define a ground range sequence Rge, which is an increasing sequence. Its size is M × 1. Furthermore, the largest element of this sequence is Rge(M), which is equal to the Rg(M). The difference of adjacent elements in Rge is fixed.
  • We acquire the element in the sequence Rg that is numerically closest to the element Rge (j), which we define as Rne.
  • According to the position of Rne in the sequence Rg, the DEM data corresponding to the element Rne in the sequence DEMs can be found. We named these DEM data as Hne.
  • Since Rge(j) is numerically close to Rne, the position of their corresponding DEM data on the DEM image will be very close. Therefore, we assume that the DEM data of Rge(j) are also Hne.
  • According to Rge(j) and Hne, the slant range corresponding to Rge(j) can be calculated:
    R new = R ge 2 ( j ) + H ne 2
  • Let Rnew interpolate on the sequence Rn (the purpose of this operation is to find the position of Rnew on the sequence Rn). According to the position of Rnew on the sequence Rn, we can find the DEM data corresponding to Rnew on the sequence DEMs, which we define as Hnew.
  • Since Rge(j) is the ground range corresponding to Rnew, the DEM data of Rge(j) are also Hnew.
Through the above steps, the DEM data with coordinate (θi, Rsj) on the slant range are transformed to the ground range. The coordinate of these DEM data on the ground range is (θi, Rge(j)). The above steps only describe the process of transforming one DEM datum in the DEM image from the slant range to ground range. The complete transformation process is shown in Figure 10.

5. Accuracy Analysis

We extract the DEM using the SAR images imaged on the reference plane. The defocusing of SAR image causes the larger phase error, which has the impact on the accuracy of the DEM and further affects the imaging quality. The defocusing can cause two types of phase error. The first is the random phase error due to the decrease of the SAR image’s signal-to-noise ratio (SNR). The second is the phase error due to the difference in phase distortion of the SAR image pair used for the interference. In this section, we analyze the impact of the above two phase errors on DEM accuracy. Since the application background of the interferometric ArcSAR in this paper is deformation monitoring, the deformation monitoring accuracy is also analyzed.
In addition, it should be noted that the purpose of analyzing DEM accuracy and deformation monitoring accuracy is to demonstrate the effect of DEM assist on improving the accuracy of the results. In practice, the analysis of DEM accuracy and deformation monitoring accuracy also needs to consider more complex factors such as baseline decoherence and time decoherence. Since these factors are not relevant to our topic, they are not considered in this paper.

5.1. The DEM Accuracy Analysis

5.1.1. Phase Error Analysis as the Decrease of the SNR Caused by Image Defocusing

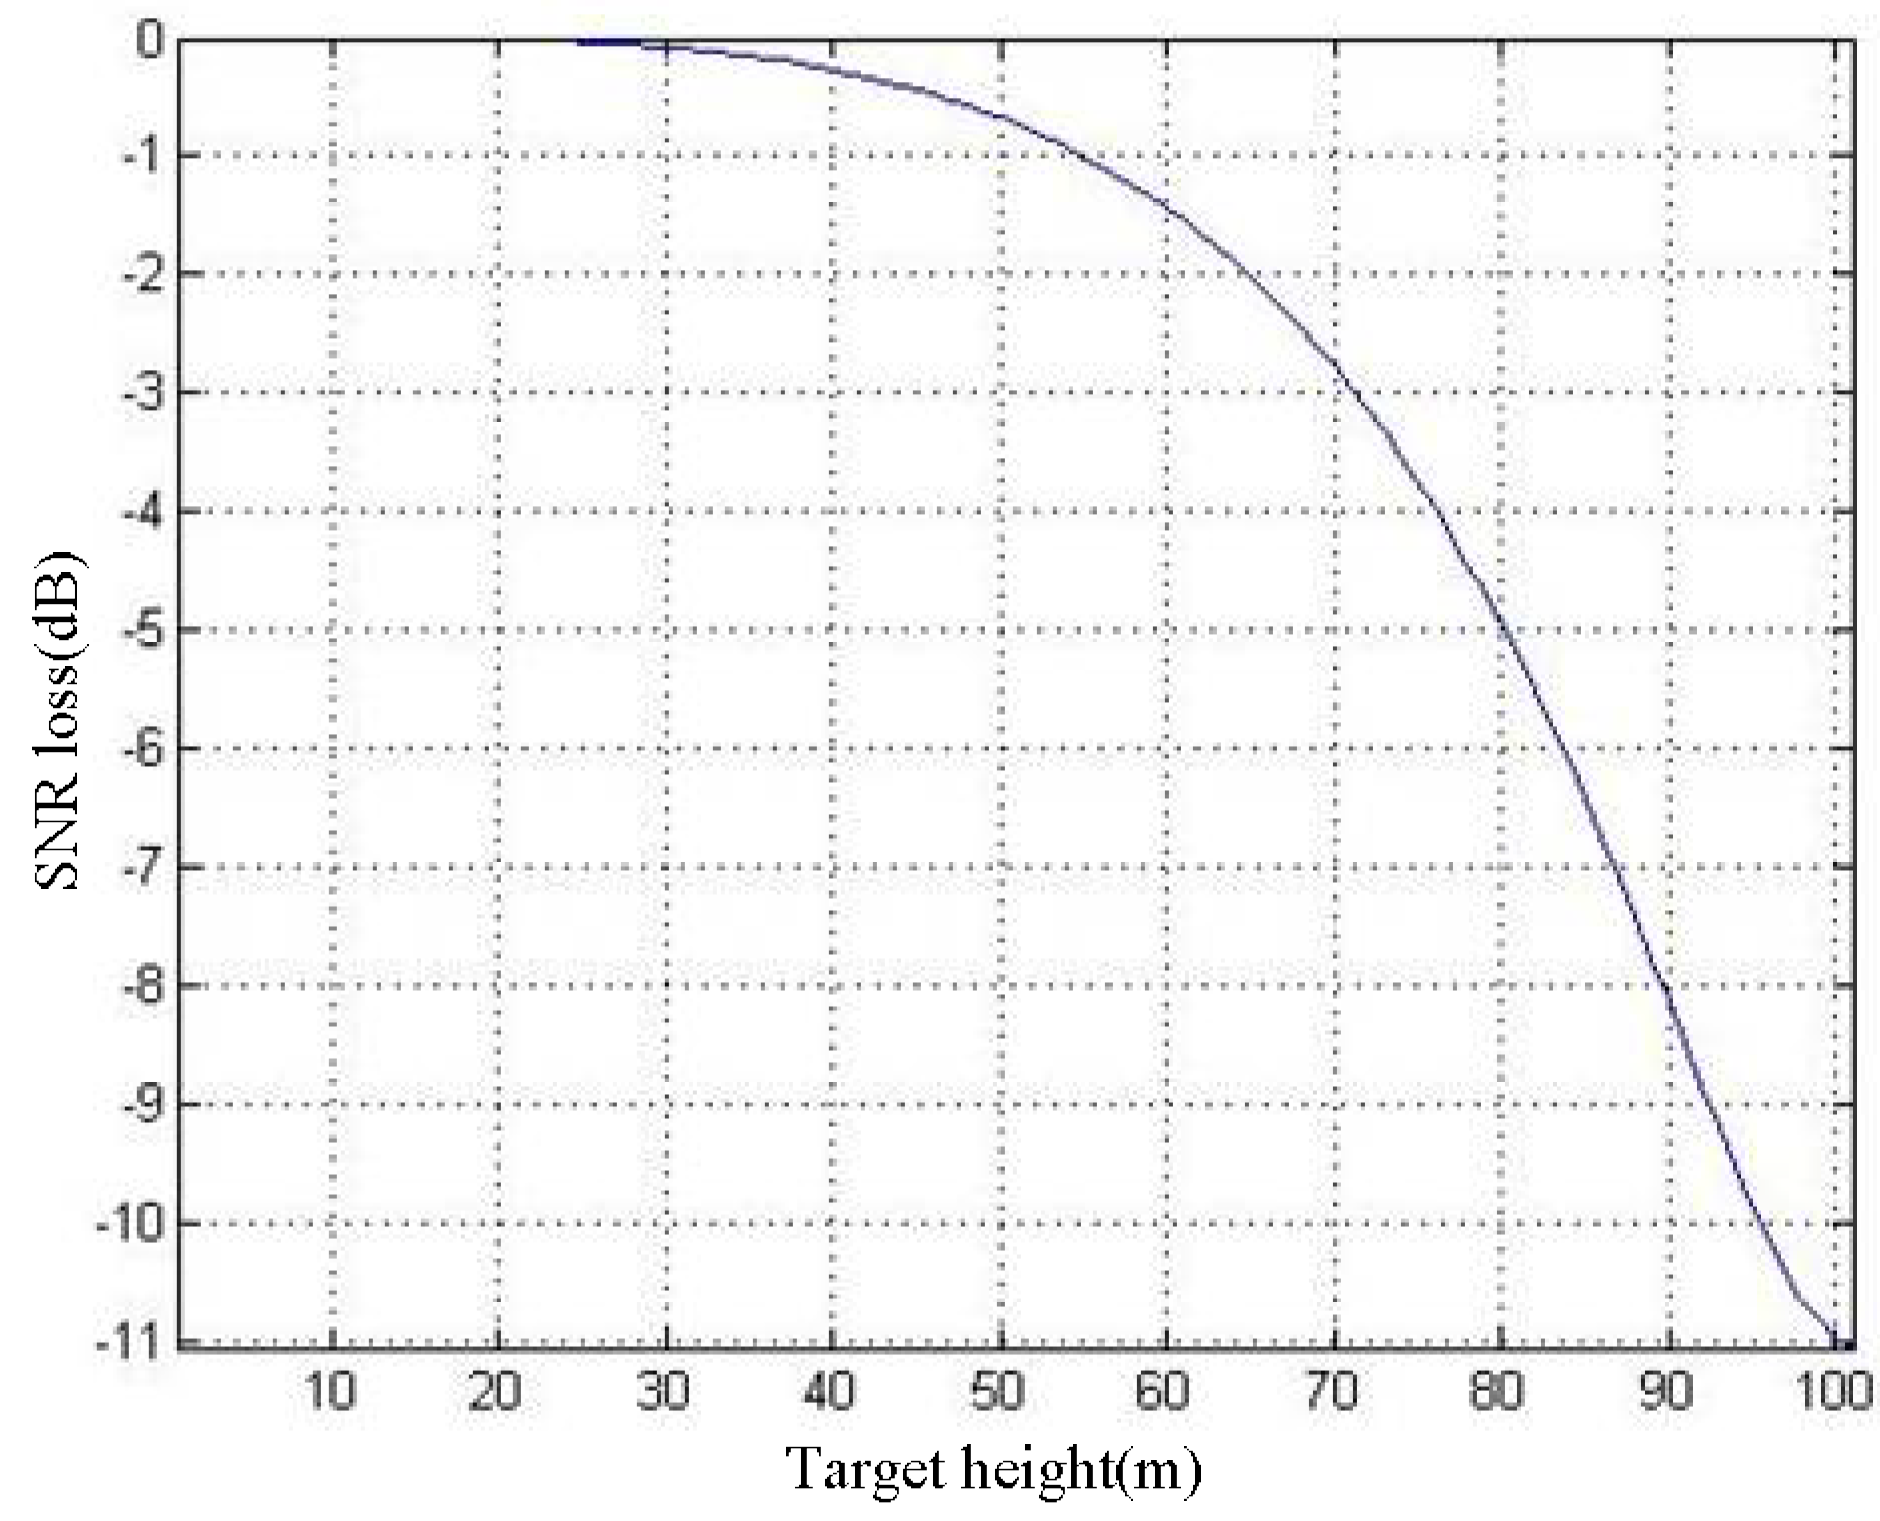
Defocusing causes the decrease of the SAR image’s SNR, which results in larger phase error. We analyze this type of phase error in this section. The SNR loss of the imaging result is defined as Sloss. According to the geometric model in Figure 7, we apply the numerical analysis method to obtain the hSloss curve of the imaging result P0. The relationship between h and Sloss can be expressed as:
S loss = 10 lg ( | i = θ 2 i = θ 2 exp ( j 4 π f c Δ R ( i , h ) ) θ | ) 2
The necessary parameters are given in Table 1. The hSloss curve is shown in Figure 11.
It can be seen in Figure 11 that, as h increases, the SNR loss gradually becomes severe. We assume that the SNR of the imaging result is 20 dB when h = 0 m. The SNR will decrease to 9.03 dB when h = 100 m, which means that the imaging result is seriously defocused.
According to the authors of [24], the root mean square error σps of the phase error due to the decrease of the SNR can be expressed as:
σ ps = 1 2 N L 1 ρ 2 ρ
where NL stands for the number of looks. ρ represents the coherence of the SAR image pair. It is related to the SNR, which is [24]:
ρ = 1 1 + S N R 1
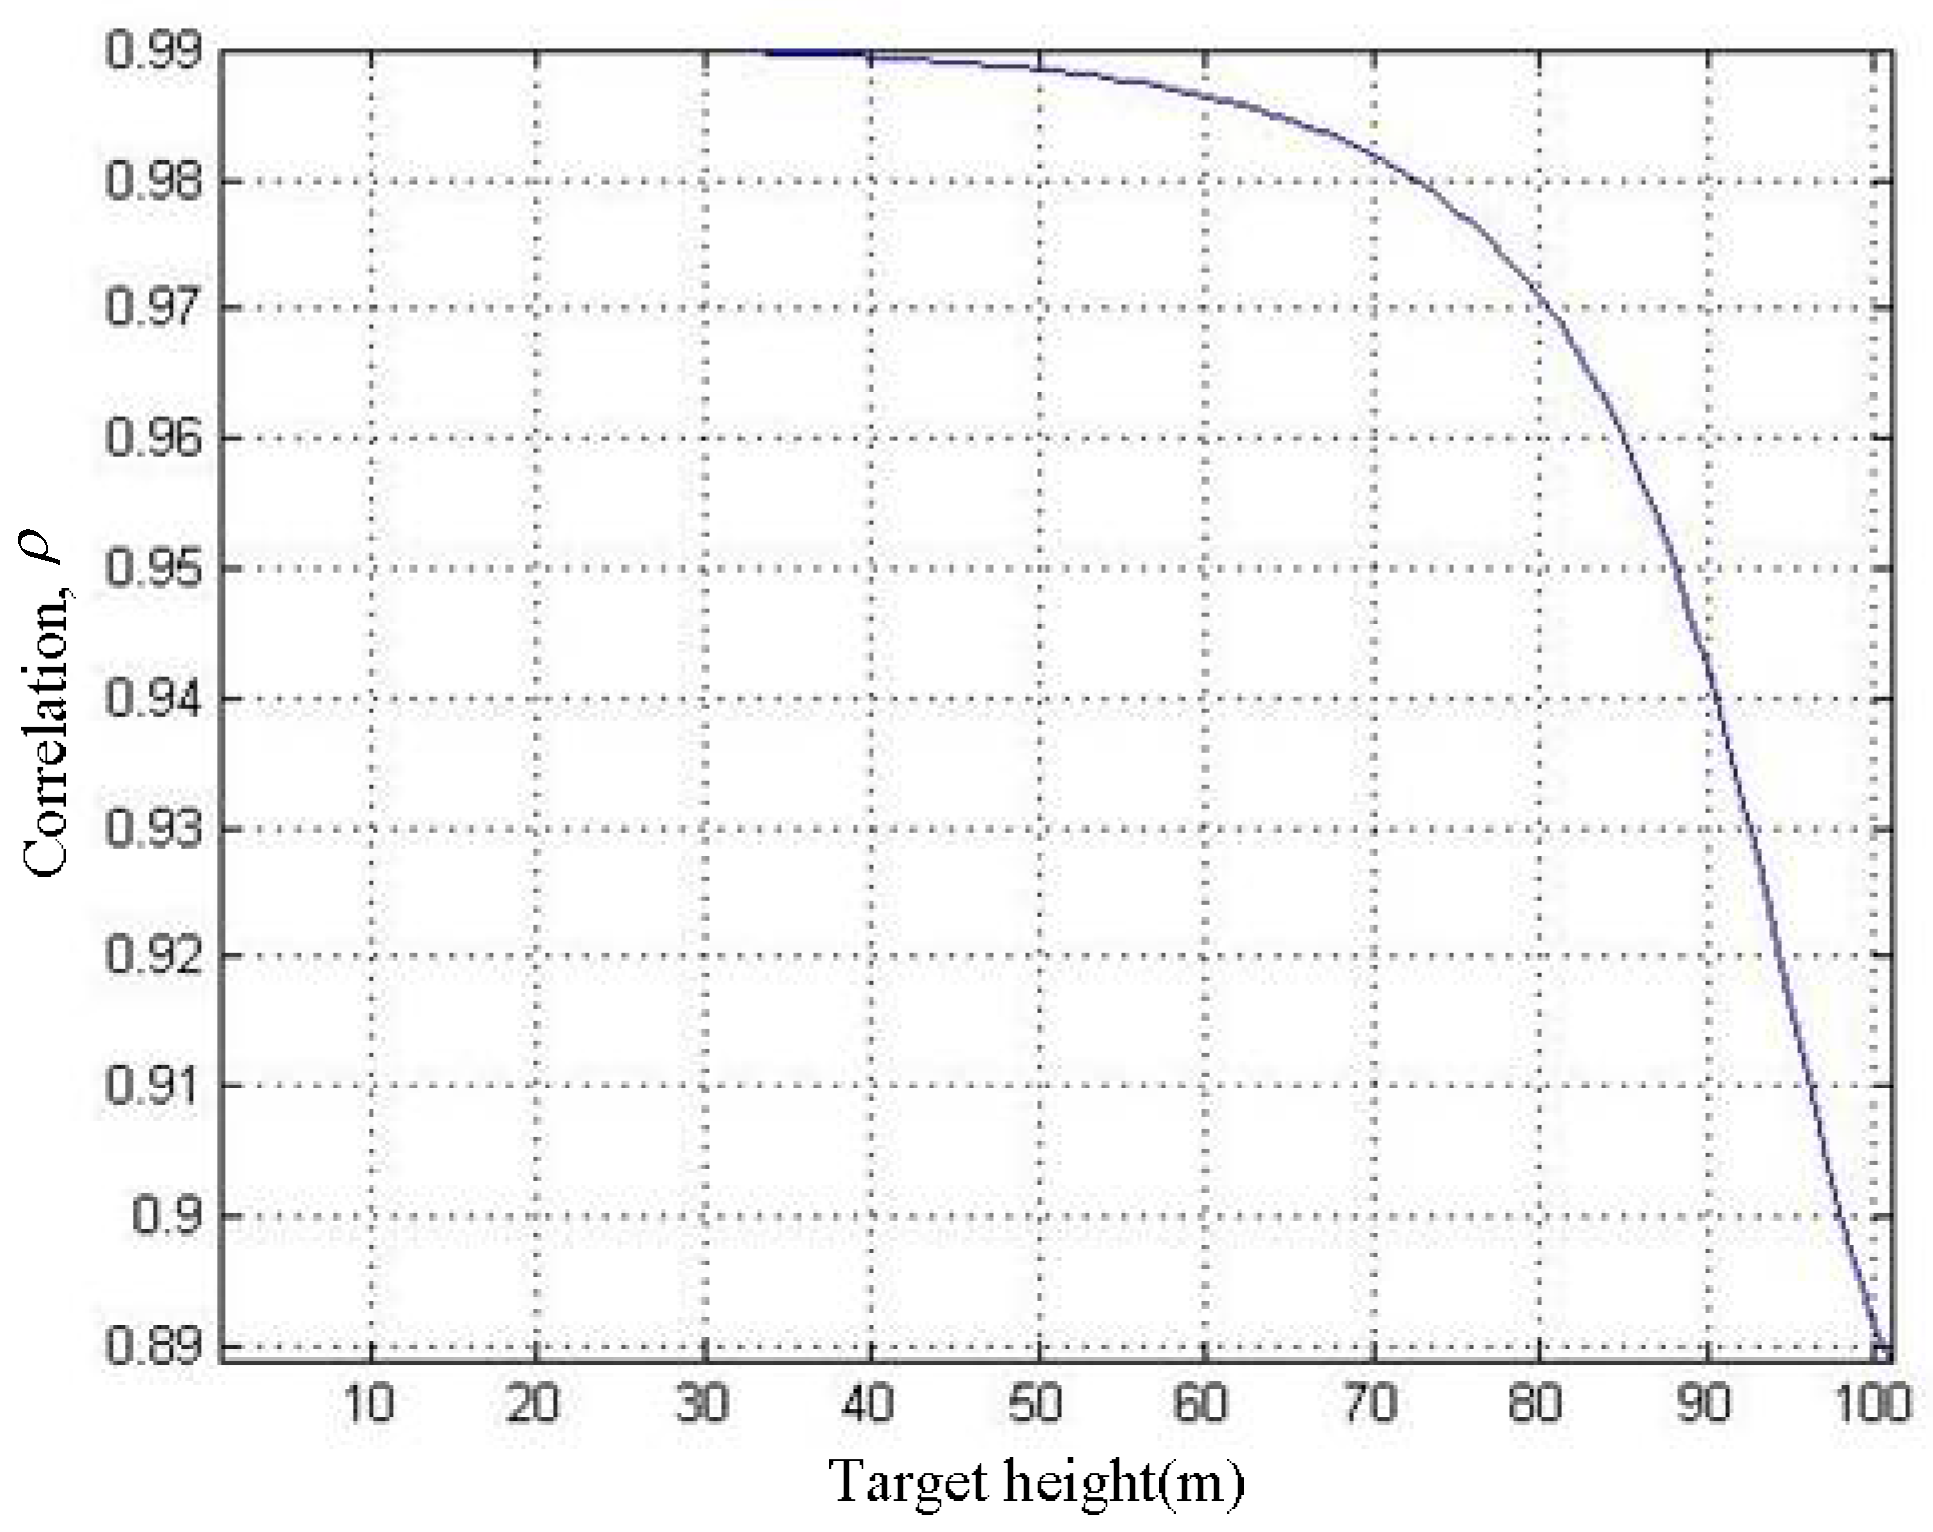
With reference to Equations (31) and (33), the hρ curve can be obtained, as shown in Figure 12.
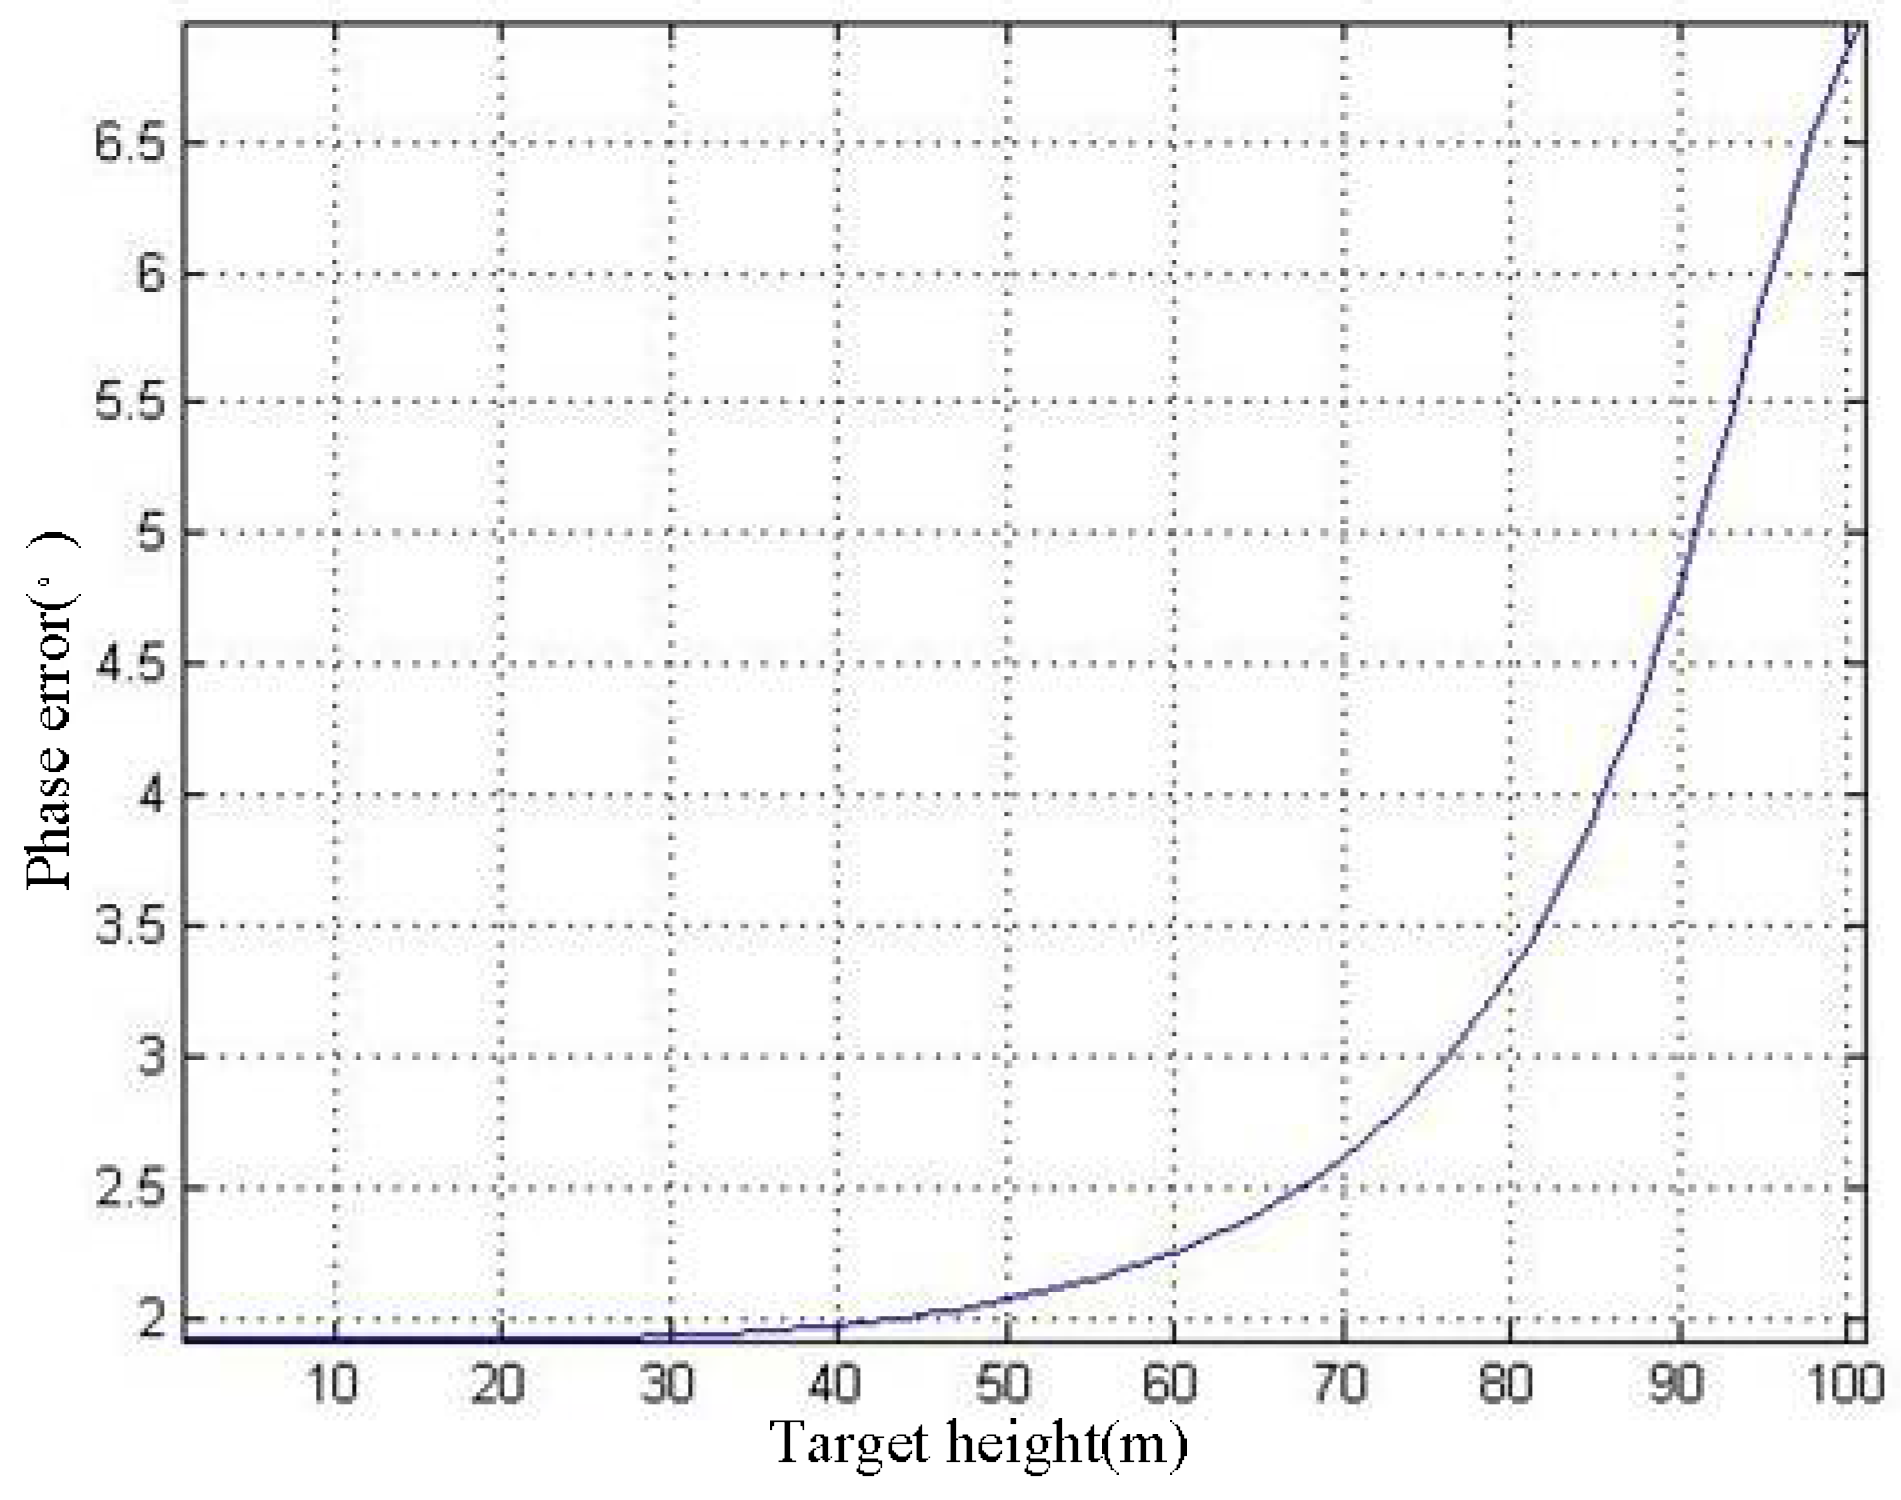
It can be seen in Figure 12 that as h increases, ρ gradually decreases. When h = 100 m, ρ decreases to 0.89. We use the 3 × 3 filter window for phase filtering, thus NL = 9. According to Equation (32) and Figure 12, the hσps curve can be acquired, as shown in Figure 13.
As shown in Figure 13, as h increases, σps gradually rises. When h = 100 m, the σps rises to 6.96.

5.1.2. Phase Error due to the Difference in Phase Distortion of the SAR Images

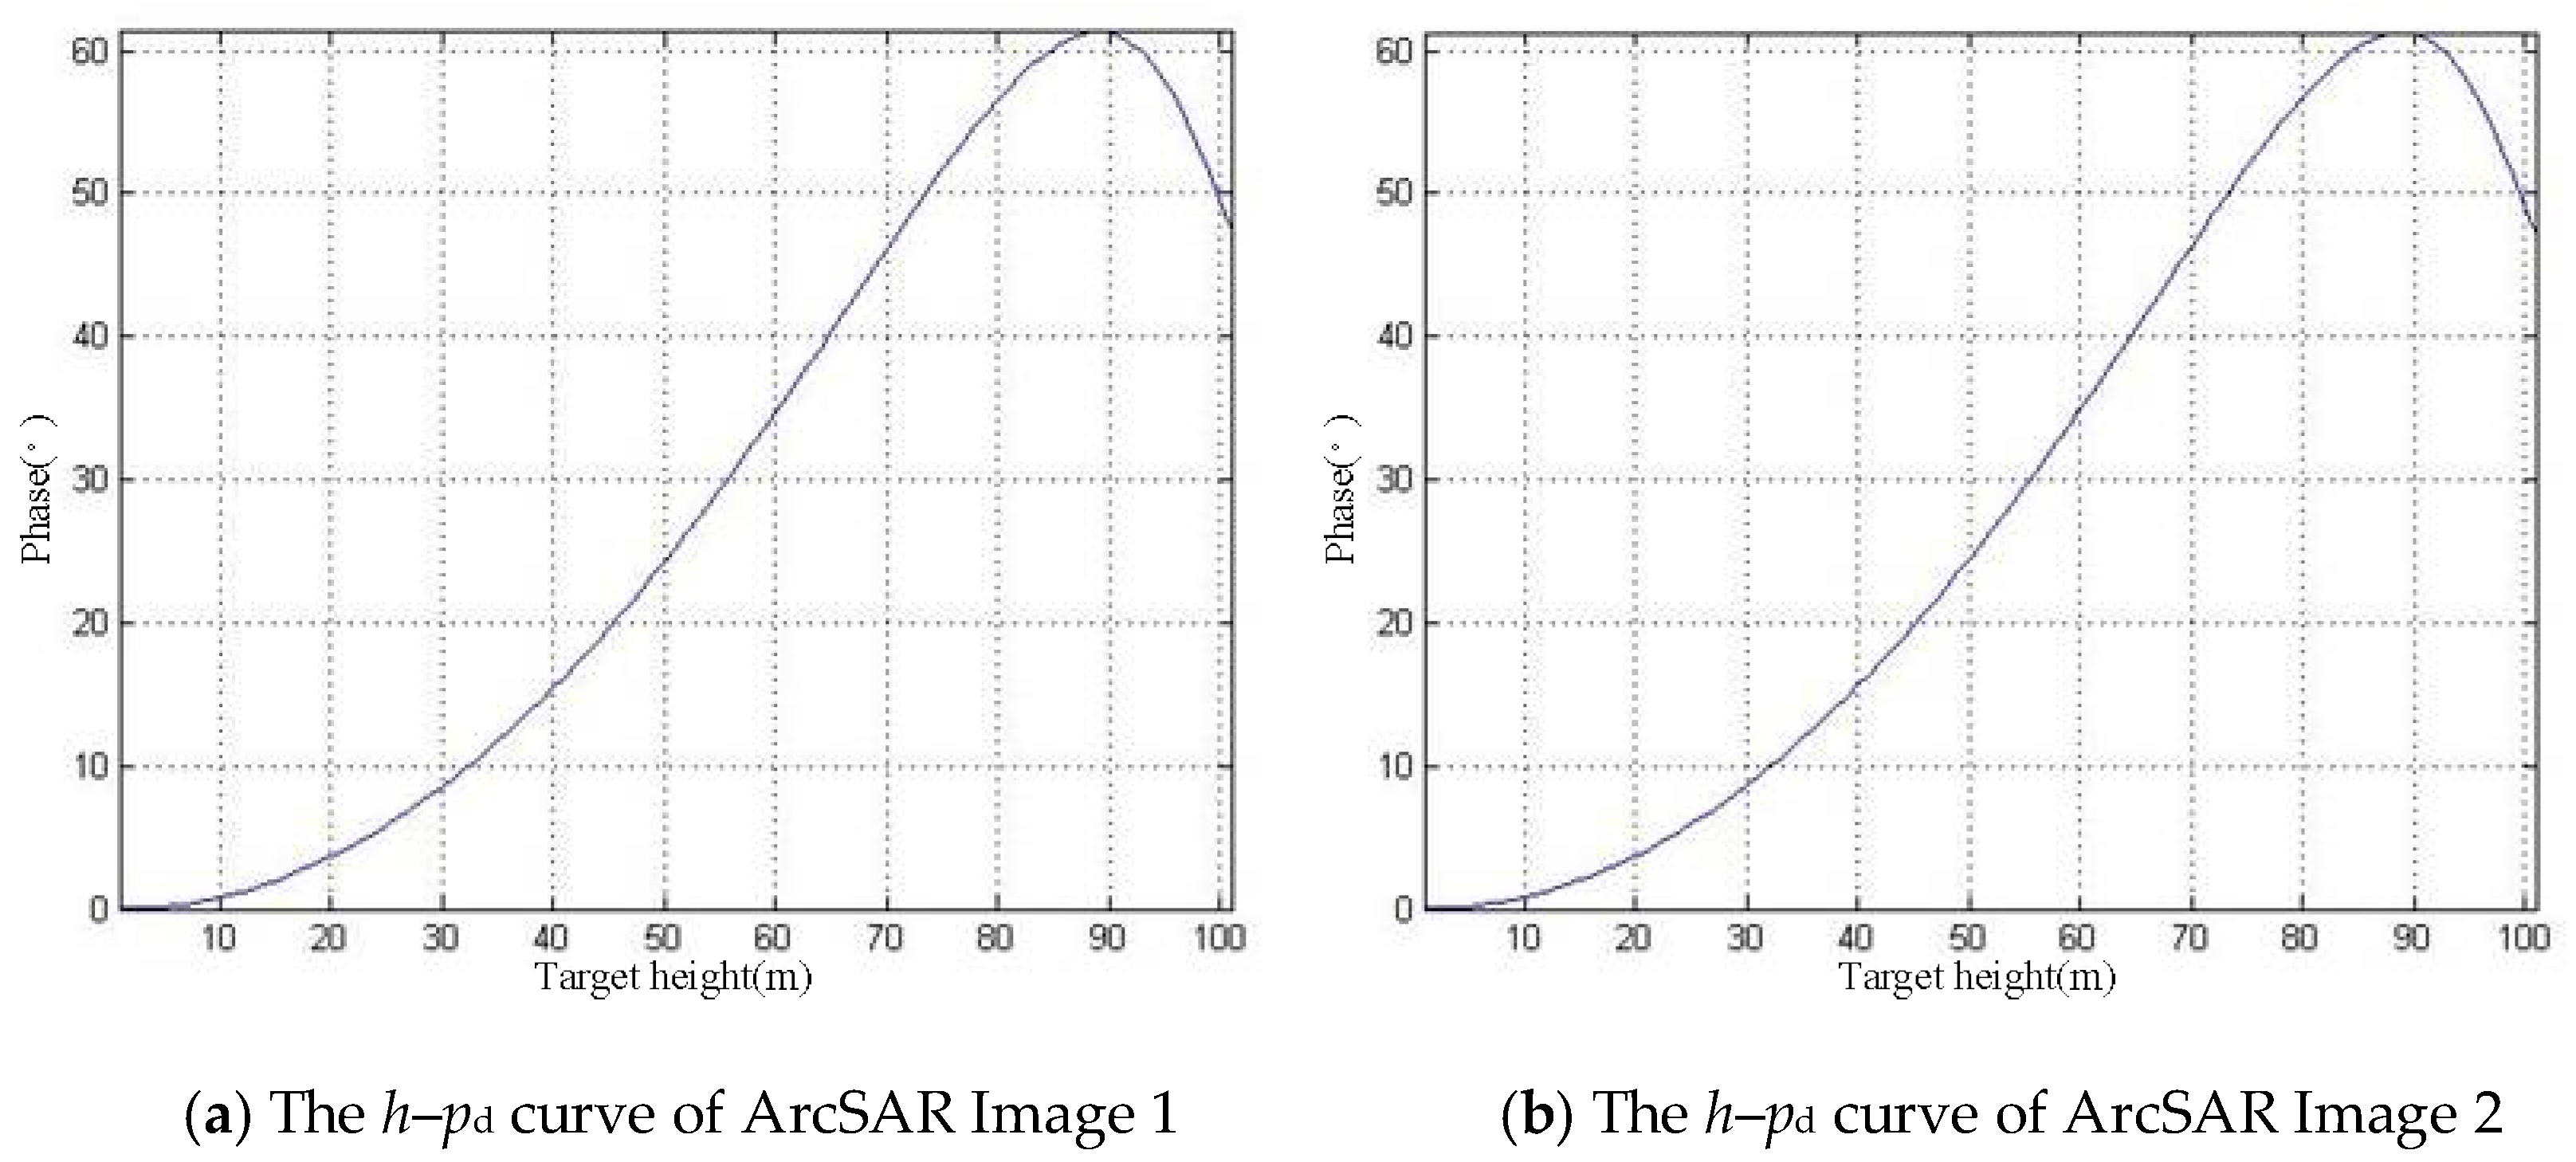
The defocusing can cause phase distortion in SAR images. If there is the difference in phase distortion of the SAR image pair used for interference, the phase error will be introduced during the interference process. In this section, we analyze this kind of phase error. We define the distortion phase as pd. The hpd curves of the SAR image pair are shown in Figure 14.
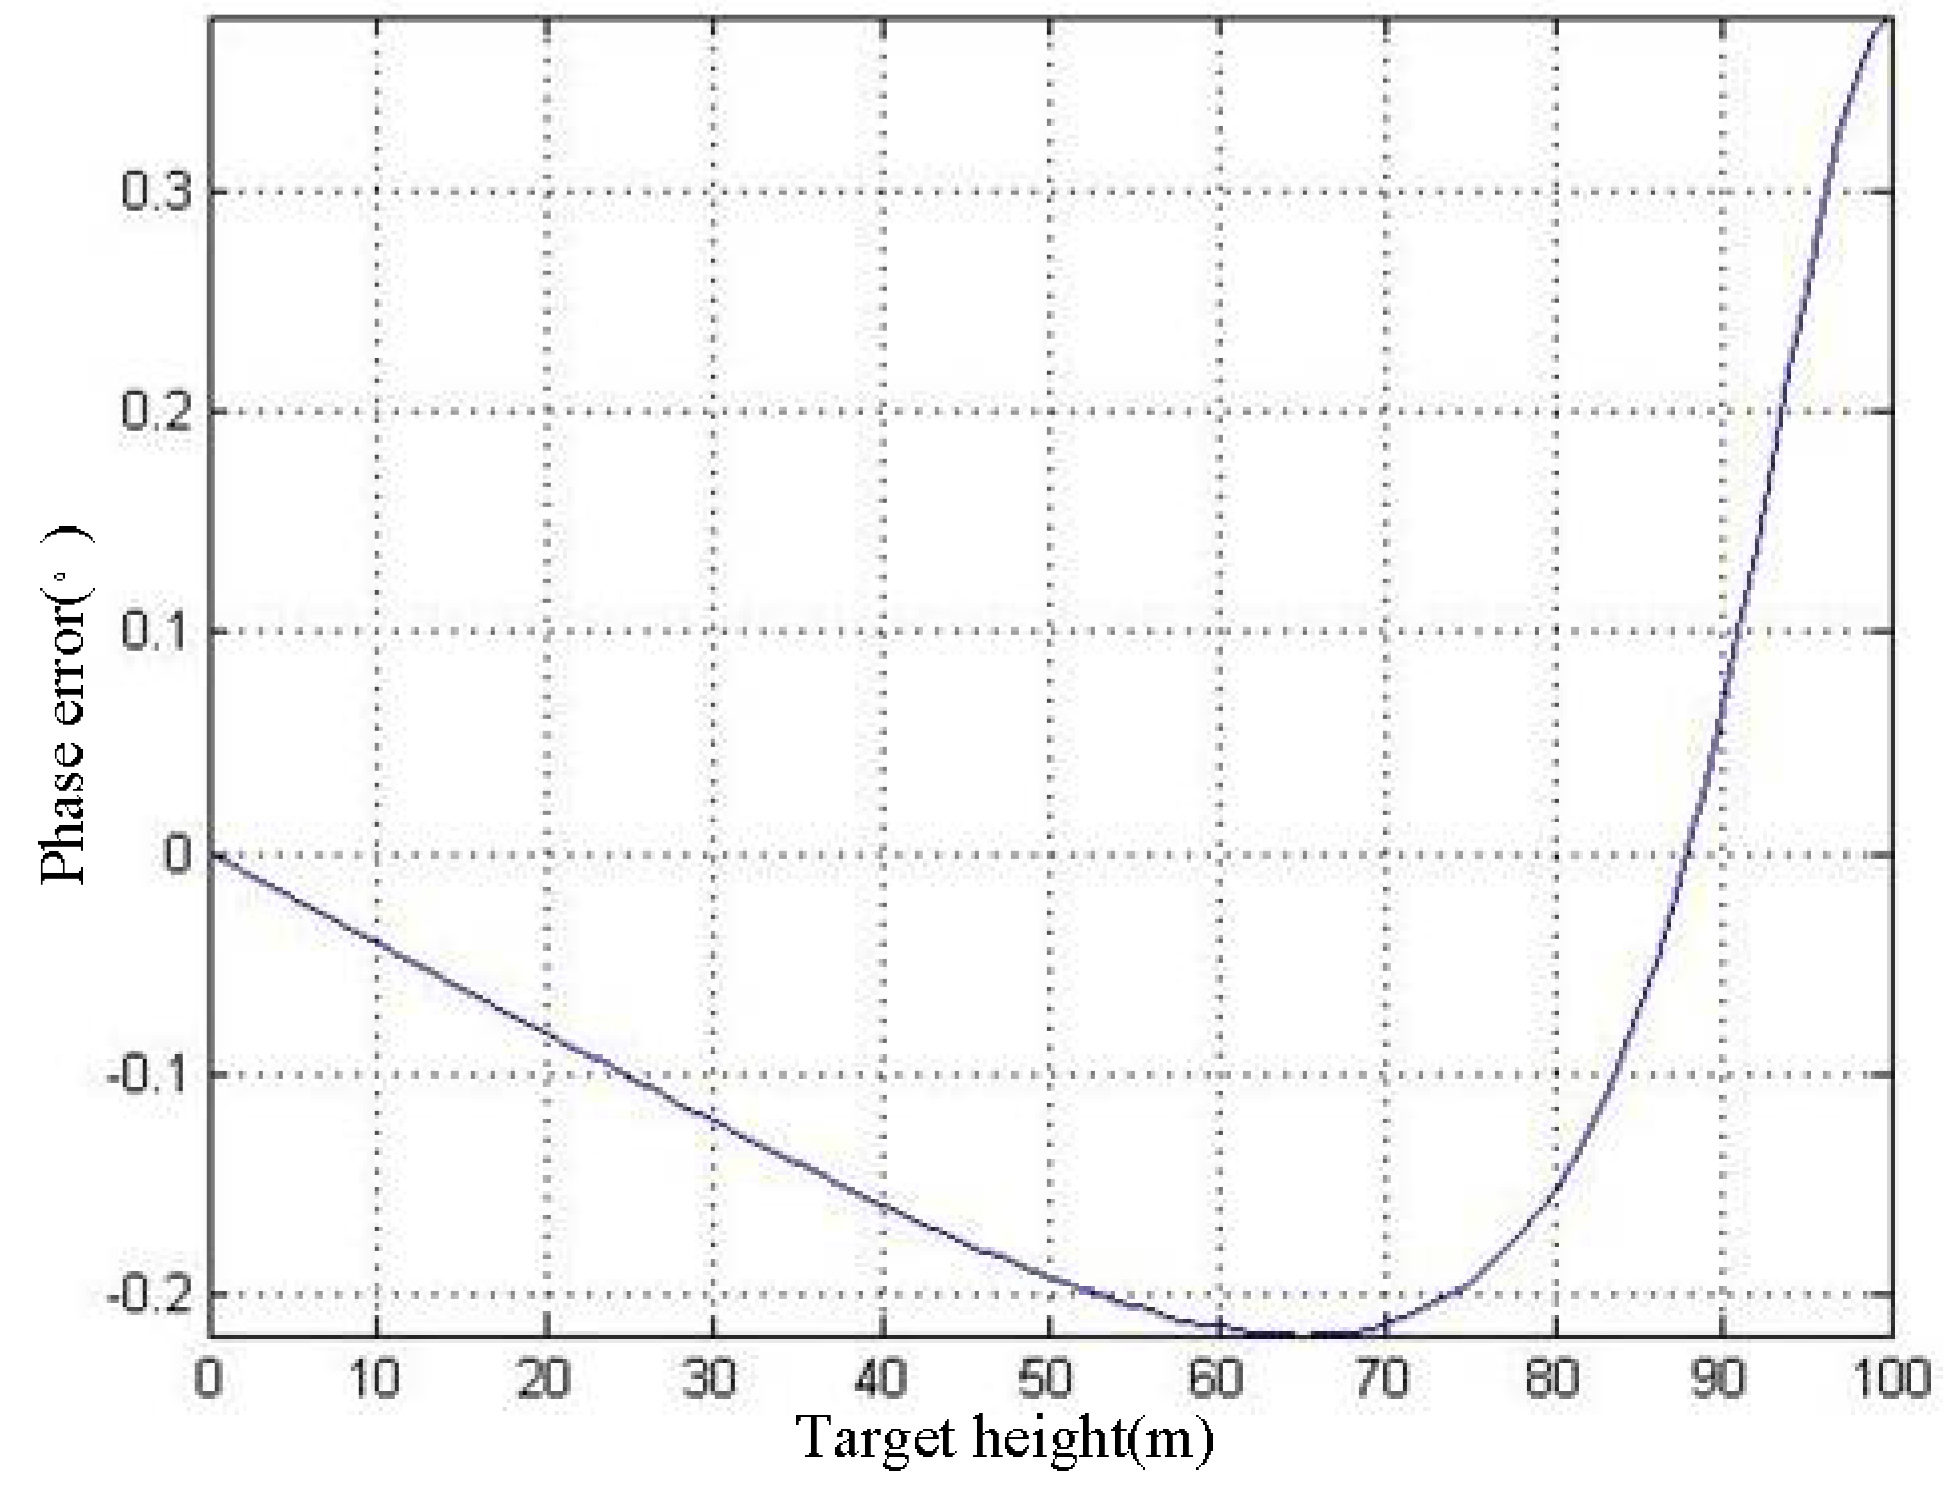
It can be found that the phase distortions of the above SAR image pair are similar, which means that most of the distortion phase will be offset during the interference process. Therefore, the phase error introduced by the process of interference is small, as shown in Figure 15.
σpd represents the phase error due to the difference in phase distortion of the SAR image pair.

5.1.3. The Effects of Phase Errors on DEM Accuracy

With reference to Equations (25), (26) and (28), we can derive the relationship between DEM accuracy σh and the above two types of phase error:
σ h = λ R sp 4 π Δ z ( | σ ps | + | σ pd | )
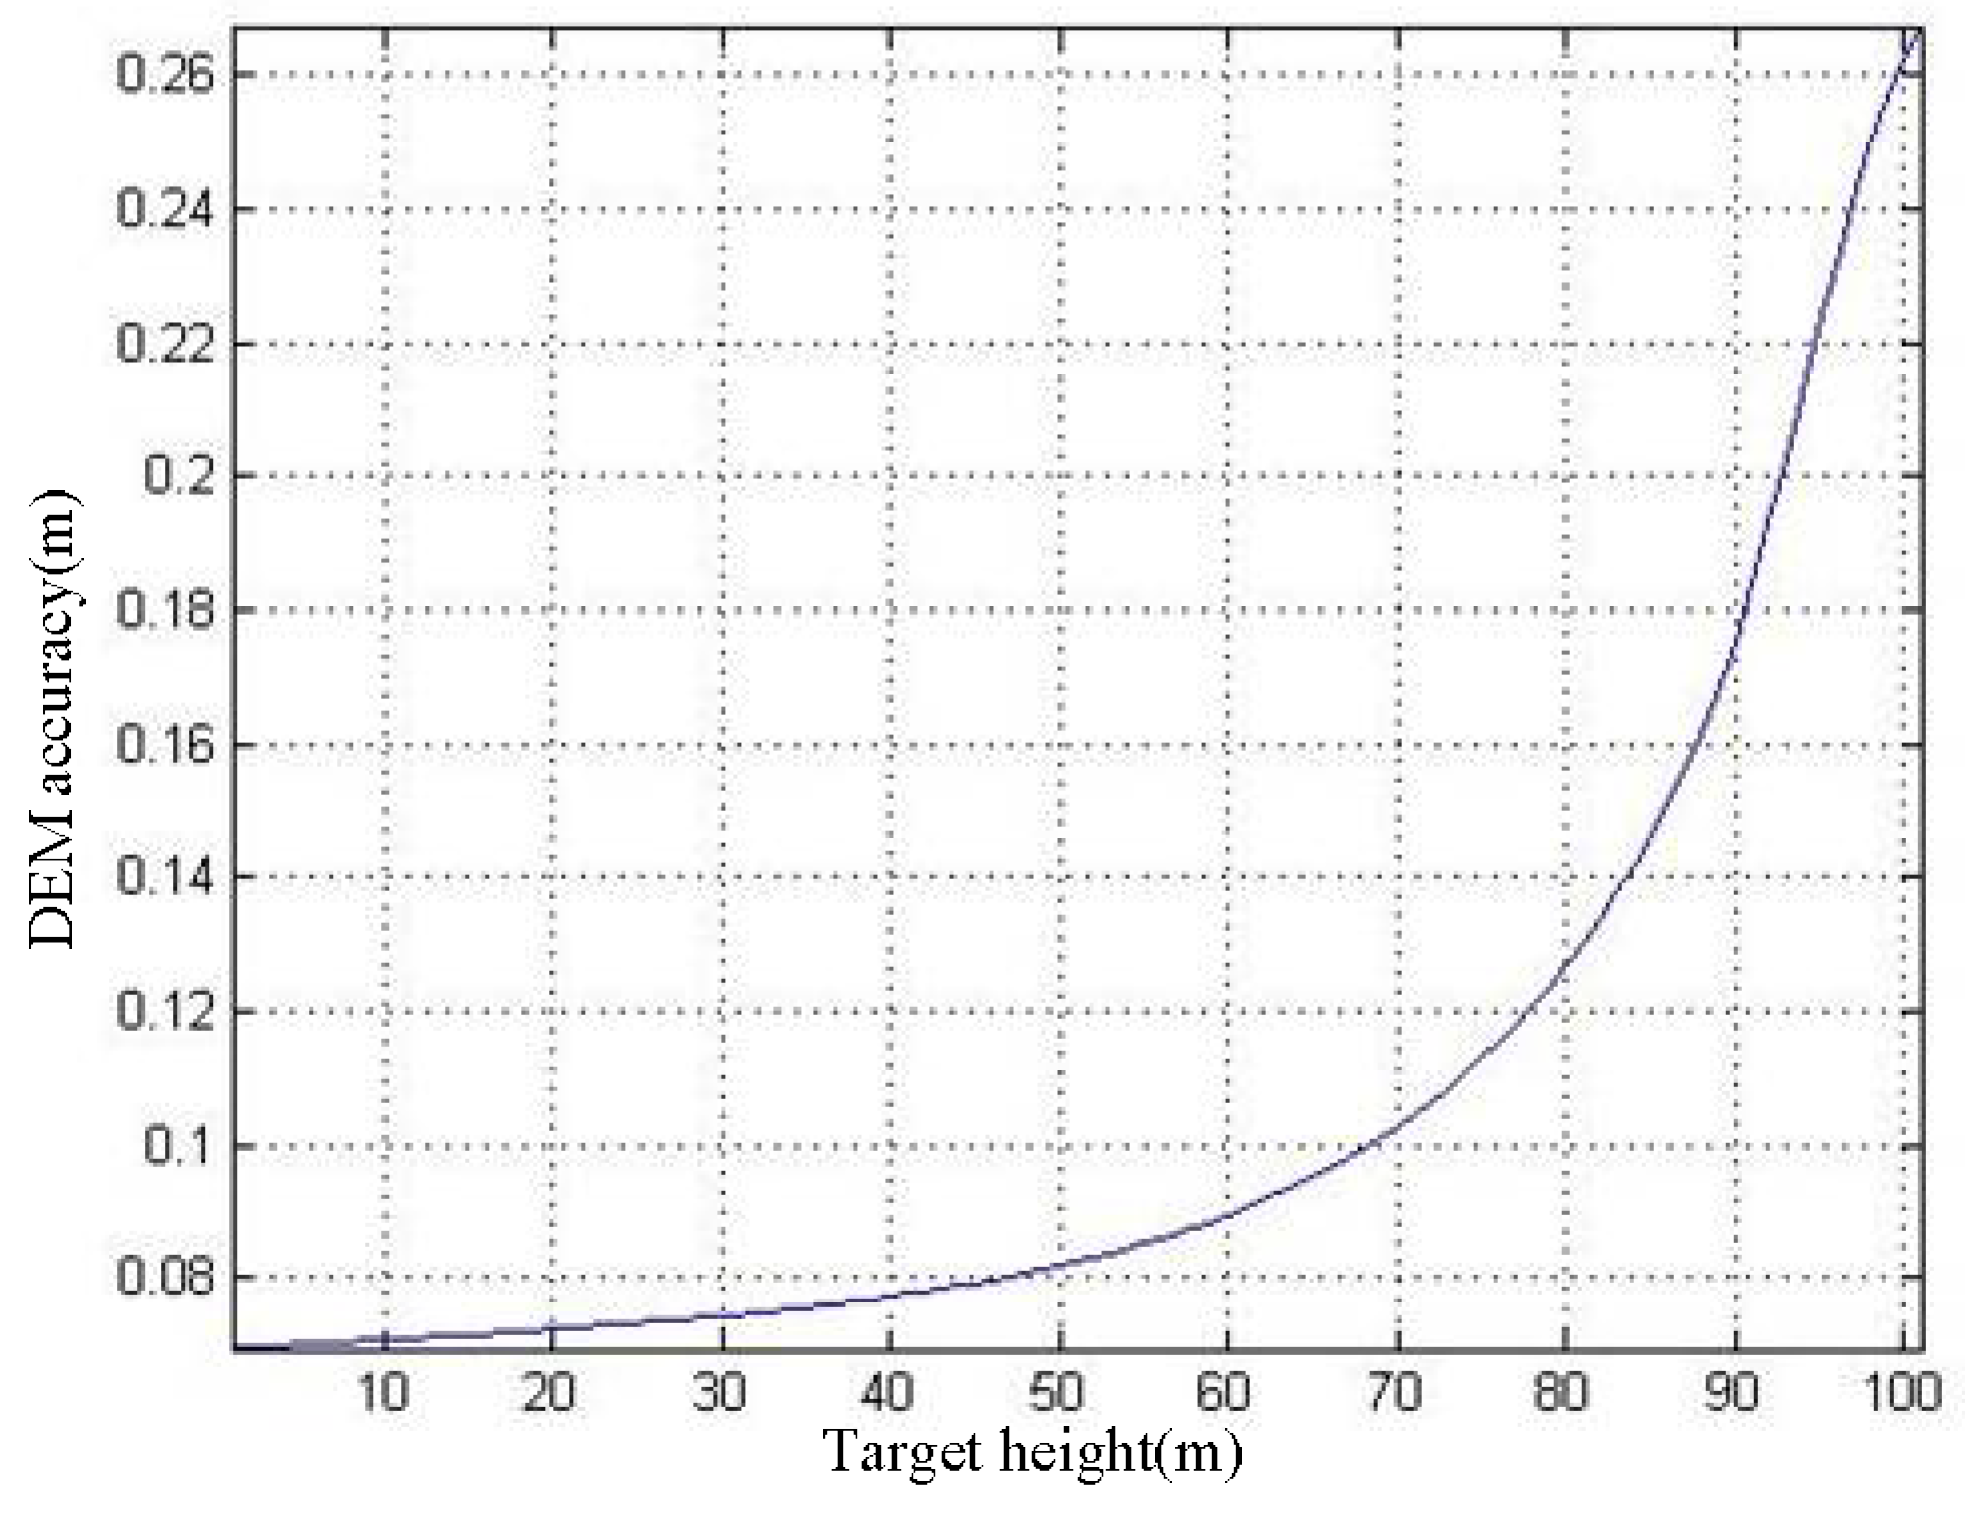
According to Equation (34), Figure 13 and Figure 15, the hσh curve can be obtained, as shown in Figure 16.
Referring to the conclusion of Section 3.2, when the Rsp = 300 m, the height difference threshold is 38.26 m. Therefore, if the accuracy of the DEM for assisting imaging is better than 38.26 m, the proposed imaging method can obtain high-precision ArcSAR imaging results. The curve in Figure 16 shows that the DEM accuracy does not exceed 0.5 m, which is much smaller than the height difference threshold. Thus, we can draw the following conclusion: Even if the SAR images used for interference appears defocused, the obtained DEM can still be used to assist ArcSAR imaging and acquire high precision image.

5.2. Deformation Monitoring Accuracy Analysis

We utilize the DEM obtained by interferometric ArcSAR to assist imaging, which can significantly improve the imaging quality. The improvement of image quality also helps to improve the deformation monitoring accuracy. In this part, the contribution of the proposed method to the improvement of deformation monitoring accuracy is analyzed. As a comparison, the impact of traditional ArcSAR imaging algorithm (the imaging method with the image on the reference plane) on the deformation monitoring accuracy is also discussed. With reference to Section 5.1, defocusing causes two types of phase error. They will affect the accuracy of deformation monitoring. We define the deformation monitoring accuracy as σd, which can be expressed as [7]:
σ d = λ 4 π ( | σ ps | + | σ pd | )
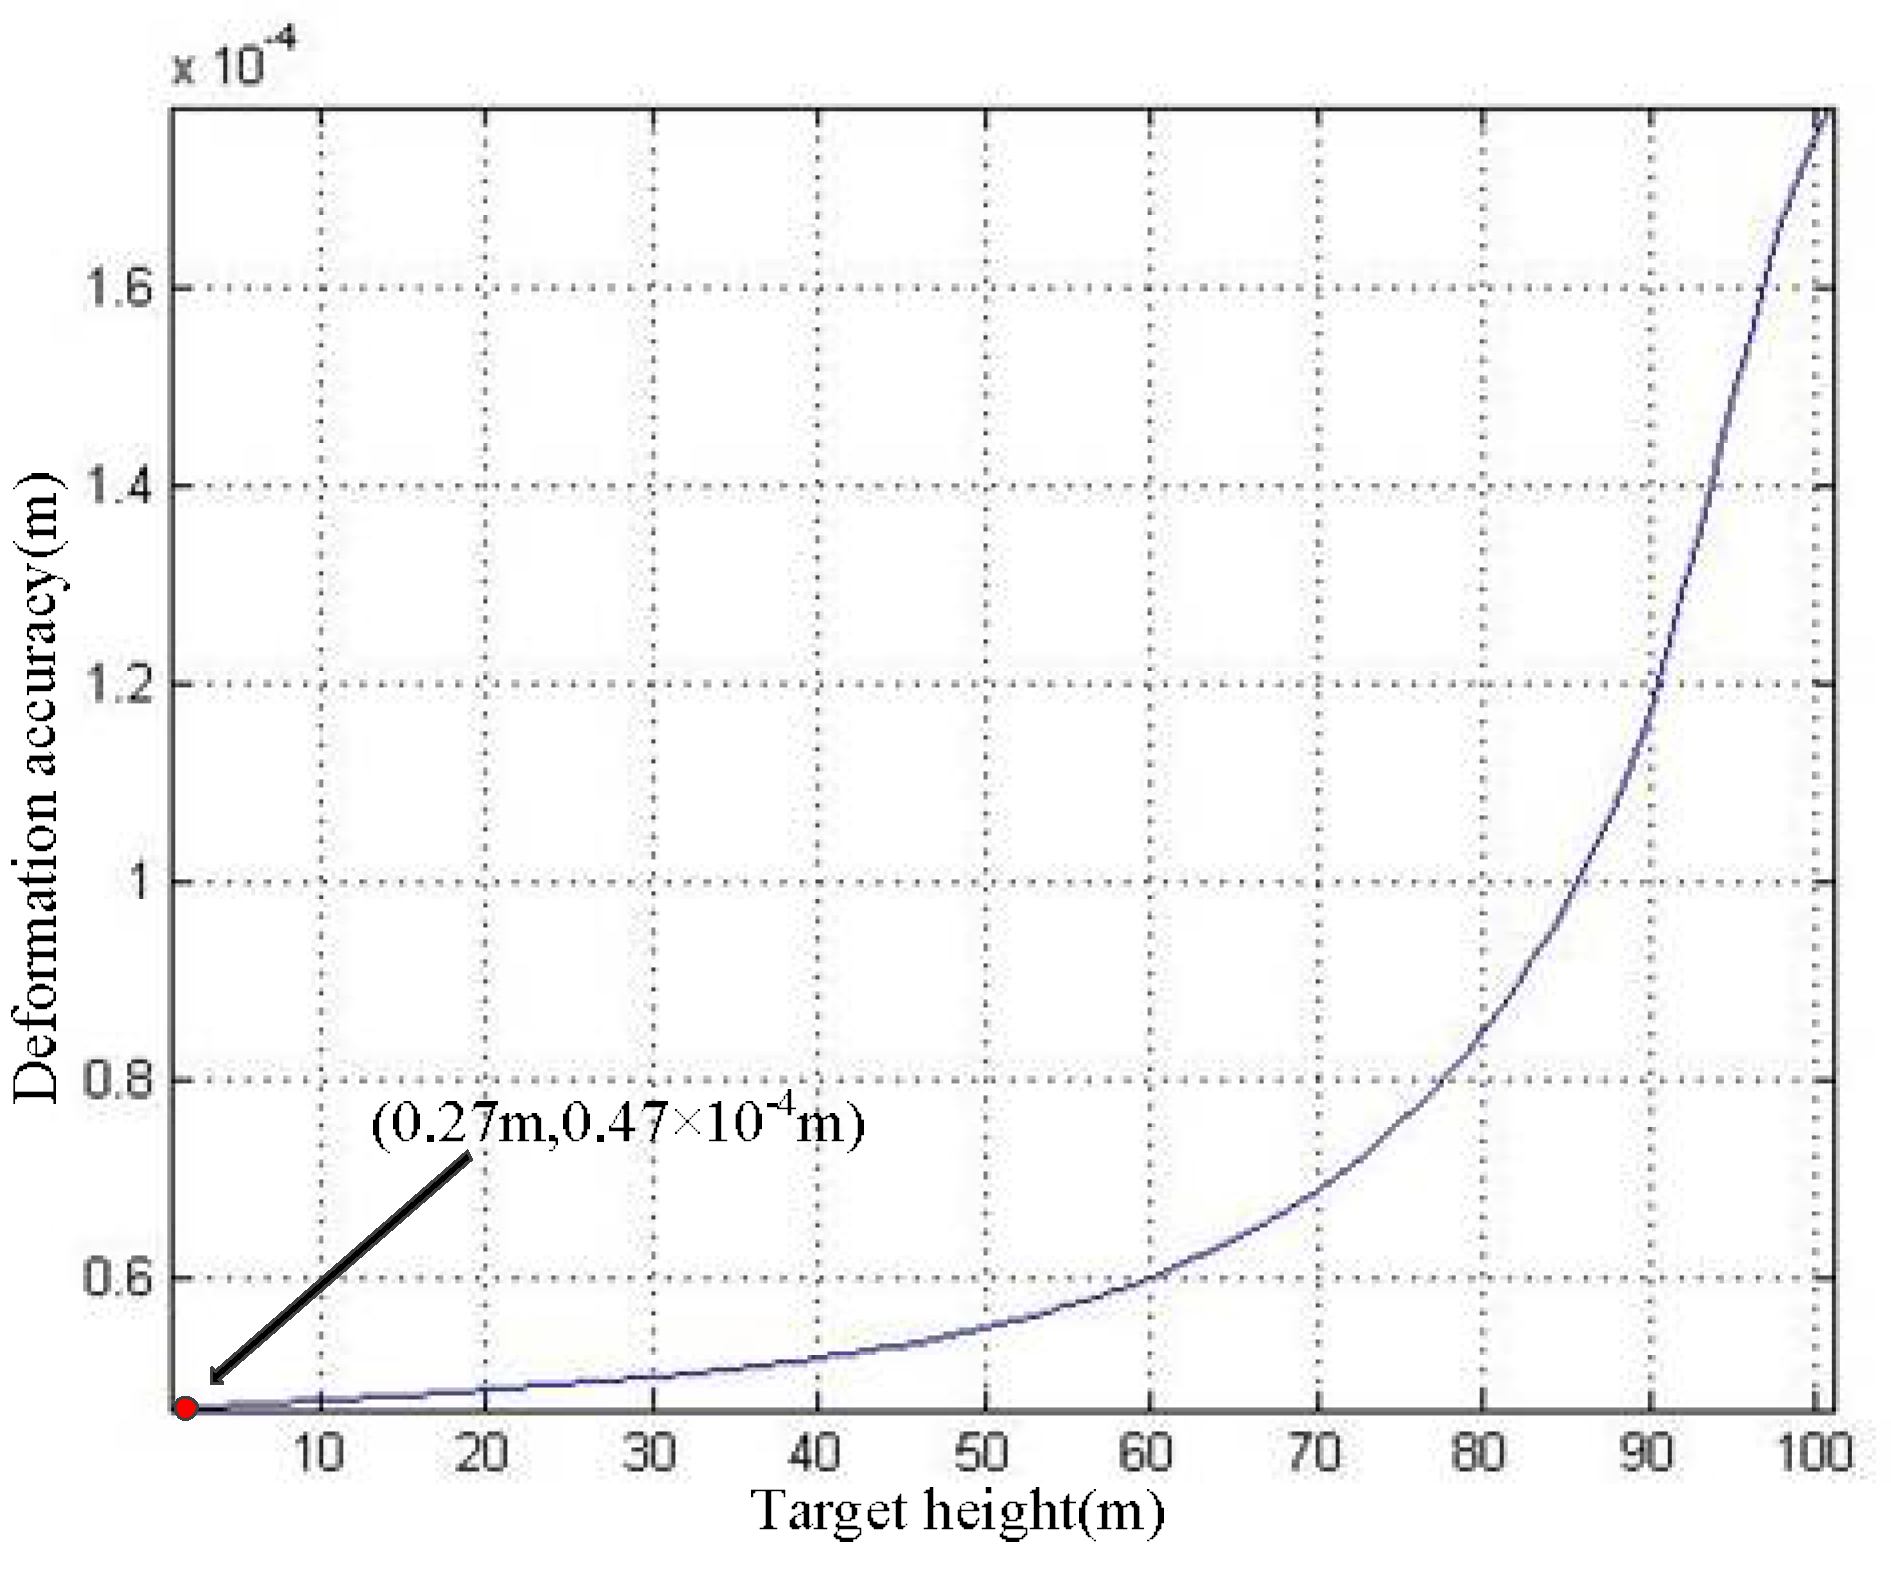
According to Equation (35), Figure 13 and Figure 15, the hσd curve can be acquired, as shown in Figure 17.
For the convenience of analysis, we take the deformation monitoring accuracy at h = 100 m as the example. Referring to the curve in Figure 17, the deformation monitoring accuracy of the traditional ArcSAR imaging algorithm is 1.78 × 10⁻⁴ m. If we use the proposed imaging method, the target in the scenes will be imaged on its real position. According to Figure 16, the DEM accuracy at h = 100 m is σh(100 m) = 0.27 m. Therefore, the deformation monitoring accuracy of the proposed method can reach to σd(0.27 m) = 0.47 × 10⁻⁴ m, as marked in Figure 17. Through the above analysis, we can conclude that, compared with the traditional ArcSAR imaging algorithm, the imaging method proposed in this paper can effectively improve the deformation monitoring accuracy.

6. Experiment

We used a distributed scenes imaging experiment of ArcSAR to verify the effectiveness of the proposed high-precision imaging method. The experiment contained two parts. First, we used the ArcSAR images of the distributed scenes for interference to extract the DEM image of the scenes. Then, the extracted DEM image was transformed from the slant range to the ground range using the polar coordinate transformation method proposed in Section 4.2. Second, we performed the distributed scenes ArcSAR imaging simulation experiment. The DEM image obtained in Experiment 1 was used for assisted imaging.

6.1. The Simulation Experiment of Interferometric ArcSAR Extraction DEM

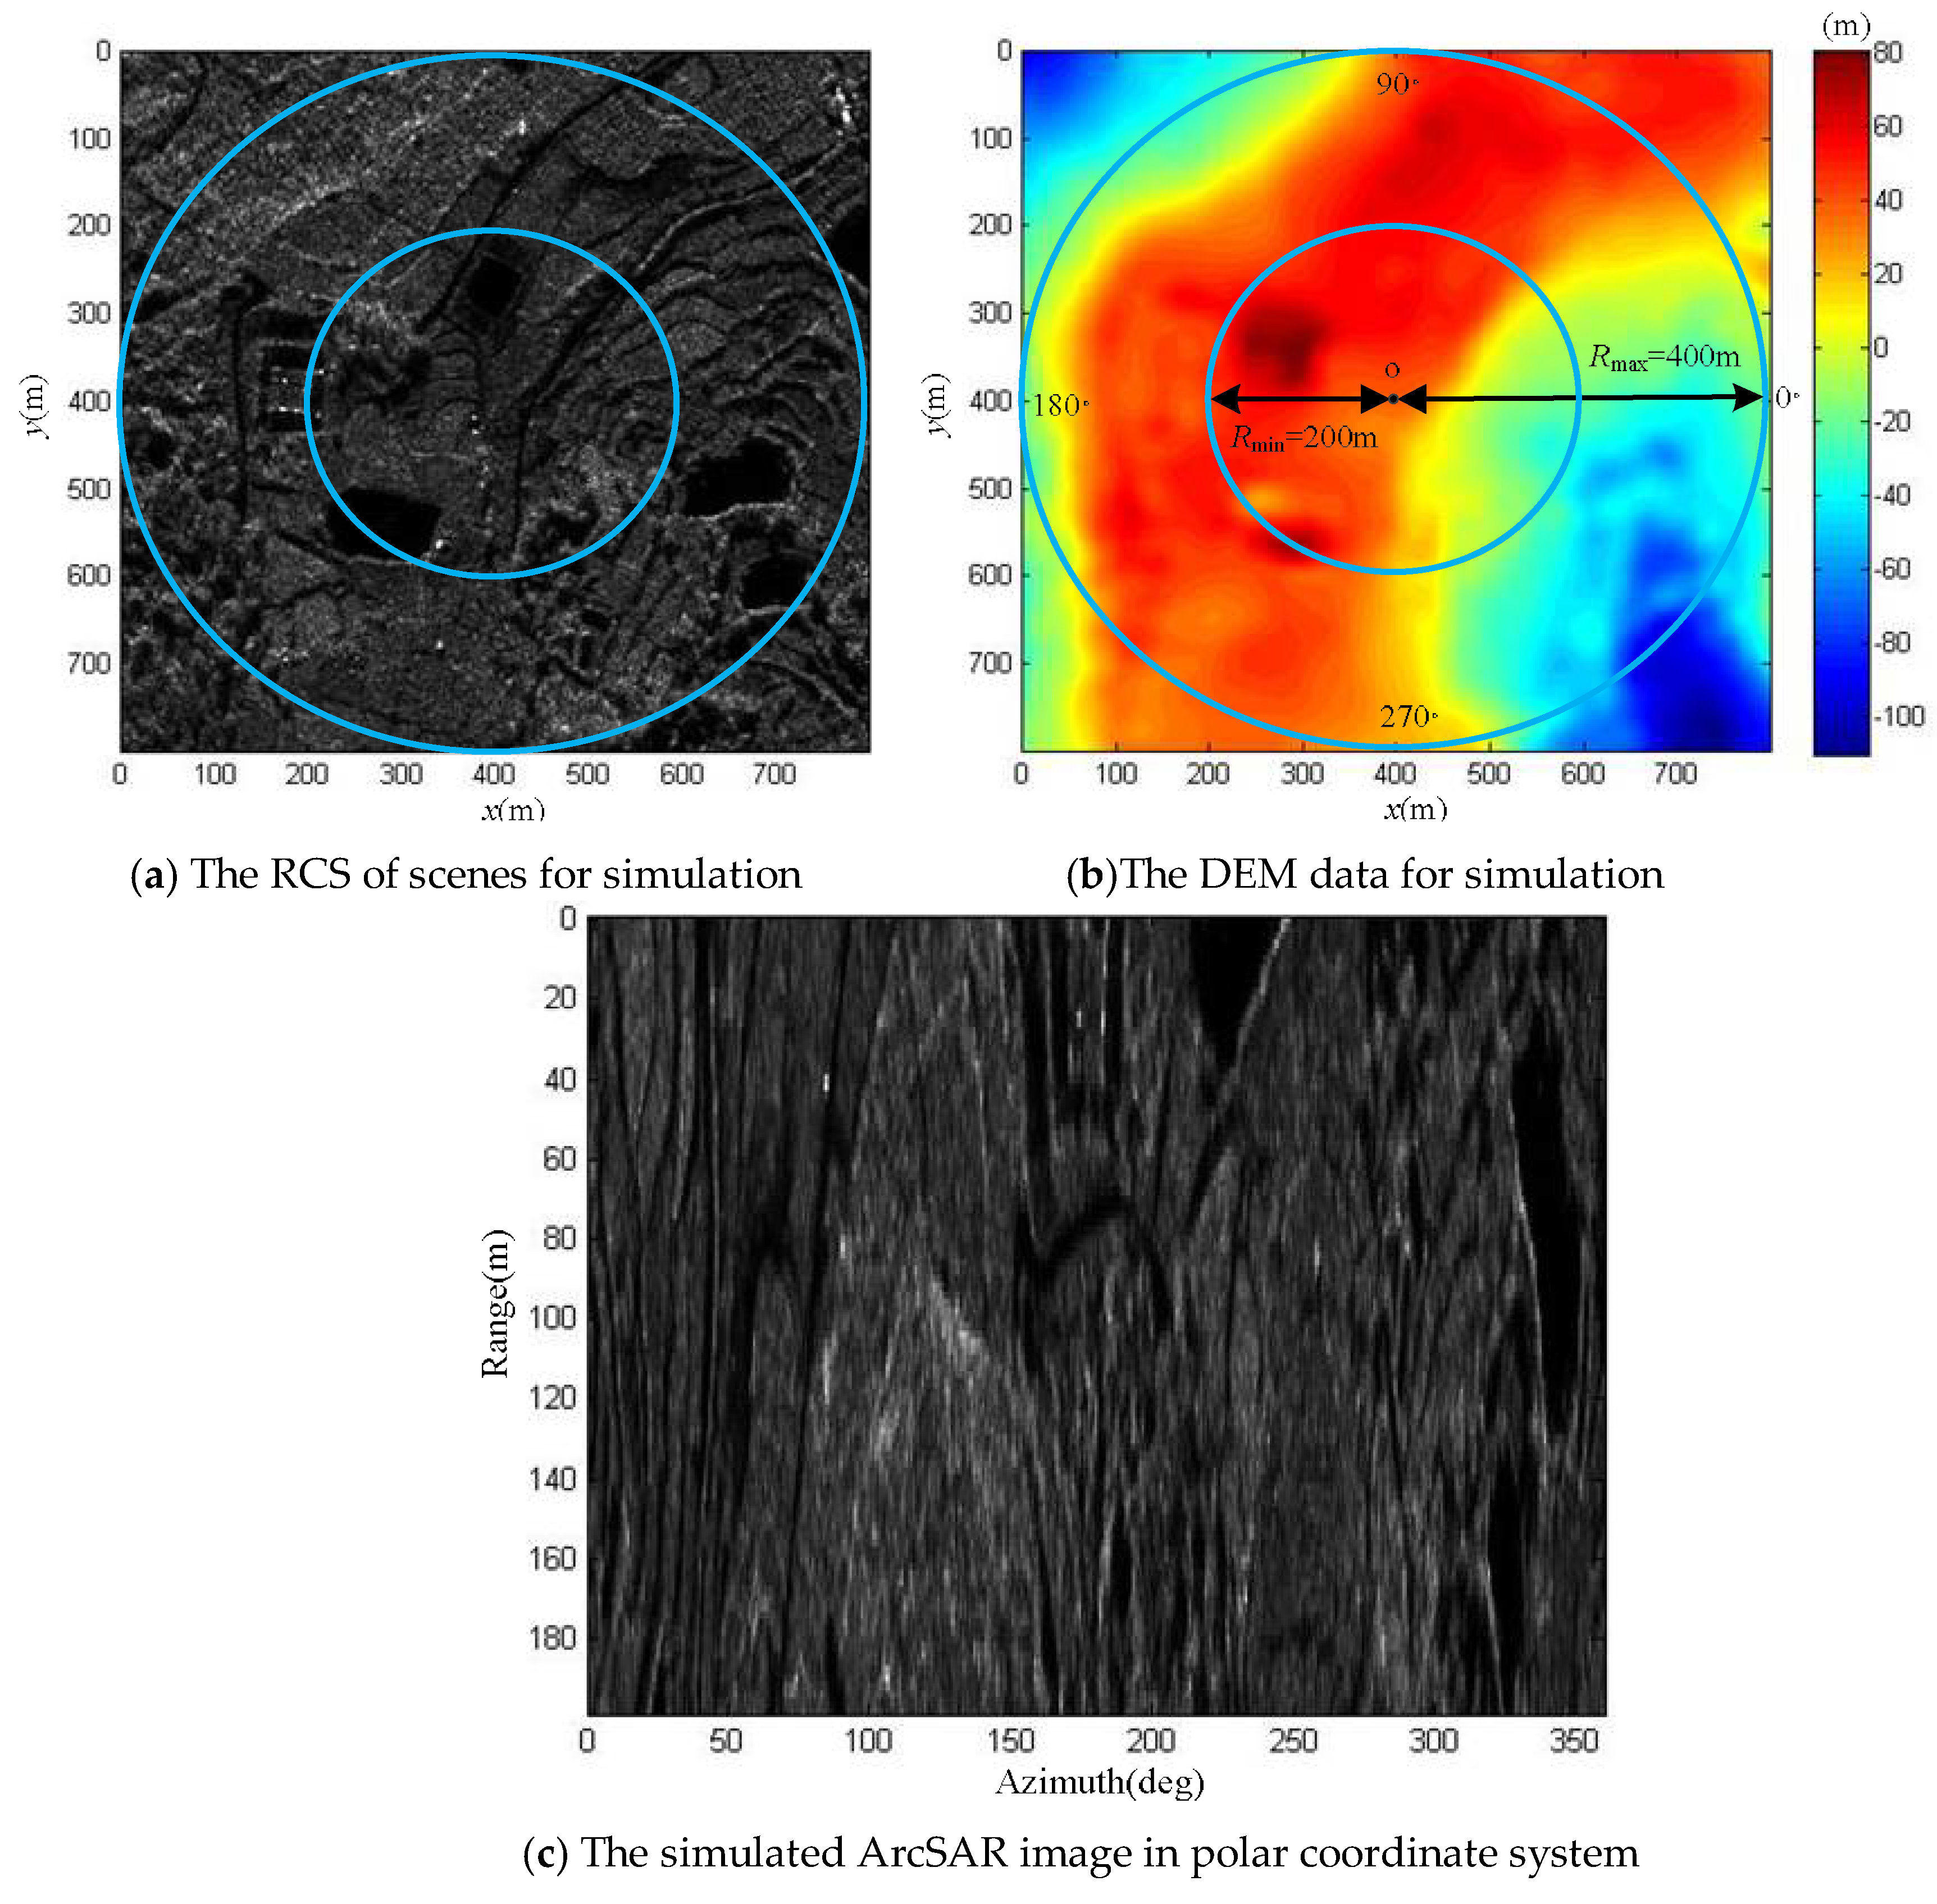
Based on the geometric model and working mode of the ArcSAR system, we uses the existing RCS scenes and DEM data to simulate the ArcSAR image on the slant range. To facilitate subsequent experiment, the simulated ArcSAR image is shown in the polar coordinate system in Figure 18. The necessary parameters are given in Table 2.
Rmax represents the maximum slant range from the imaging scenes to the ArcSAR system and Rmin represents the minimum slant range from the imaging scenes to the ArcSAR system. They are marked in Figure 18b. The point o in Figure 18b is the rotation center. We defined the height of rotation plane to be 0 m. In Figure 18c, the horizontal axis represents the rotation angle of the ArcSAR system, and the vertical axis is the interval from Rmin to Rmax.
The ArcSAR imaging result in Figure 18c was considered to be the main complex image for interference. The height baseline ∆z was 0.2 m. We simulated the sub SAR complex image for interference. The interferometric phase can be obtained by interference with the main SAR complex image and the sub SAR complex image. The interferometric phase image is shown in Figure 19.
The measured interferometric phase value shown in Figure 19 was modulated by 2π, ranging from −π to π, and there was an ambiguity of many cycles in the interferometric phase value. Thus, it was necessary to perform phase unwrapping on the interferometric phase image. The branch cut method was applied to interferometric phase unwrapping [25,26]. In addition, to reduce the complexity of phase unwrapping, we also removed the flat phase of the interferometric phase. After the flat phase removal and phase unwrapping operations, the interferometric phase image could be used for DEM inversion. The DEM image obtained by the interferometric phase inversion is the slant range image, as shown in Figure 20a. We utilized the proposed polar coordinate transformation method to transform it to the ground range. The DEM image on the ground range is shown in Figure 20b.
We also calculated the mean square error (MSE) of the DEM image in Figure 20b with the existing DEM data. The result of the MSE was only 1.69. It can be seen that the interferometric ArcSAR could acquire high-precision DEM image of the scenes.

6.2. Distributed Scenes Imaging Simulation Experiment Verification the DEM-Assisted High Precision Imaging Method for ArcSAR

We used the distributed scenes imaging simulation experiment to image the scenes given in Experiment 1. The necessary parameters are shown in Table 2. The DEM image acquired in Experiment 1 was applied to assist ArcSAR imaging. In addition, we also used the traditional imaging method of ArcSAR to image the distributed scenes on the reference plane as the comparison. The height of the reference plane was 0 m. Based on Equations (17)–(19) in Section 3.2, we found the defocused area and focused area of the distributed scenes imaging results on the reference plane, as shown in Figure 21.
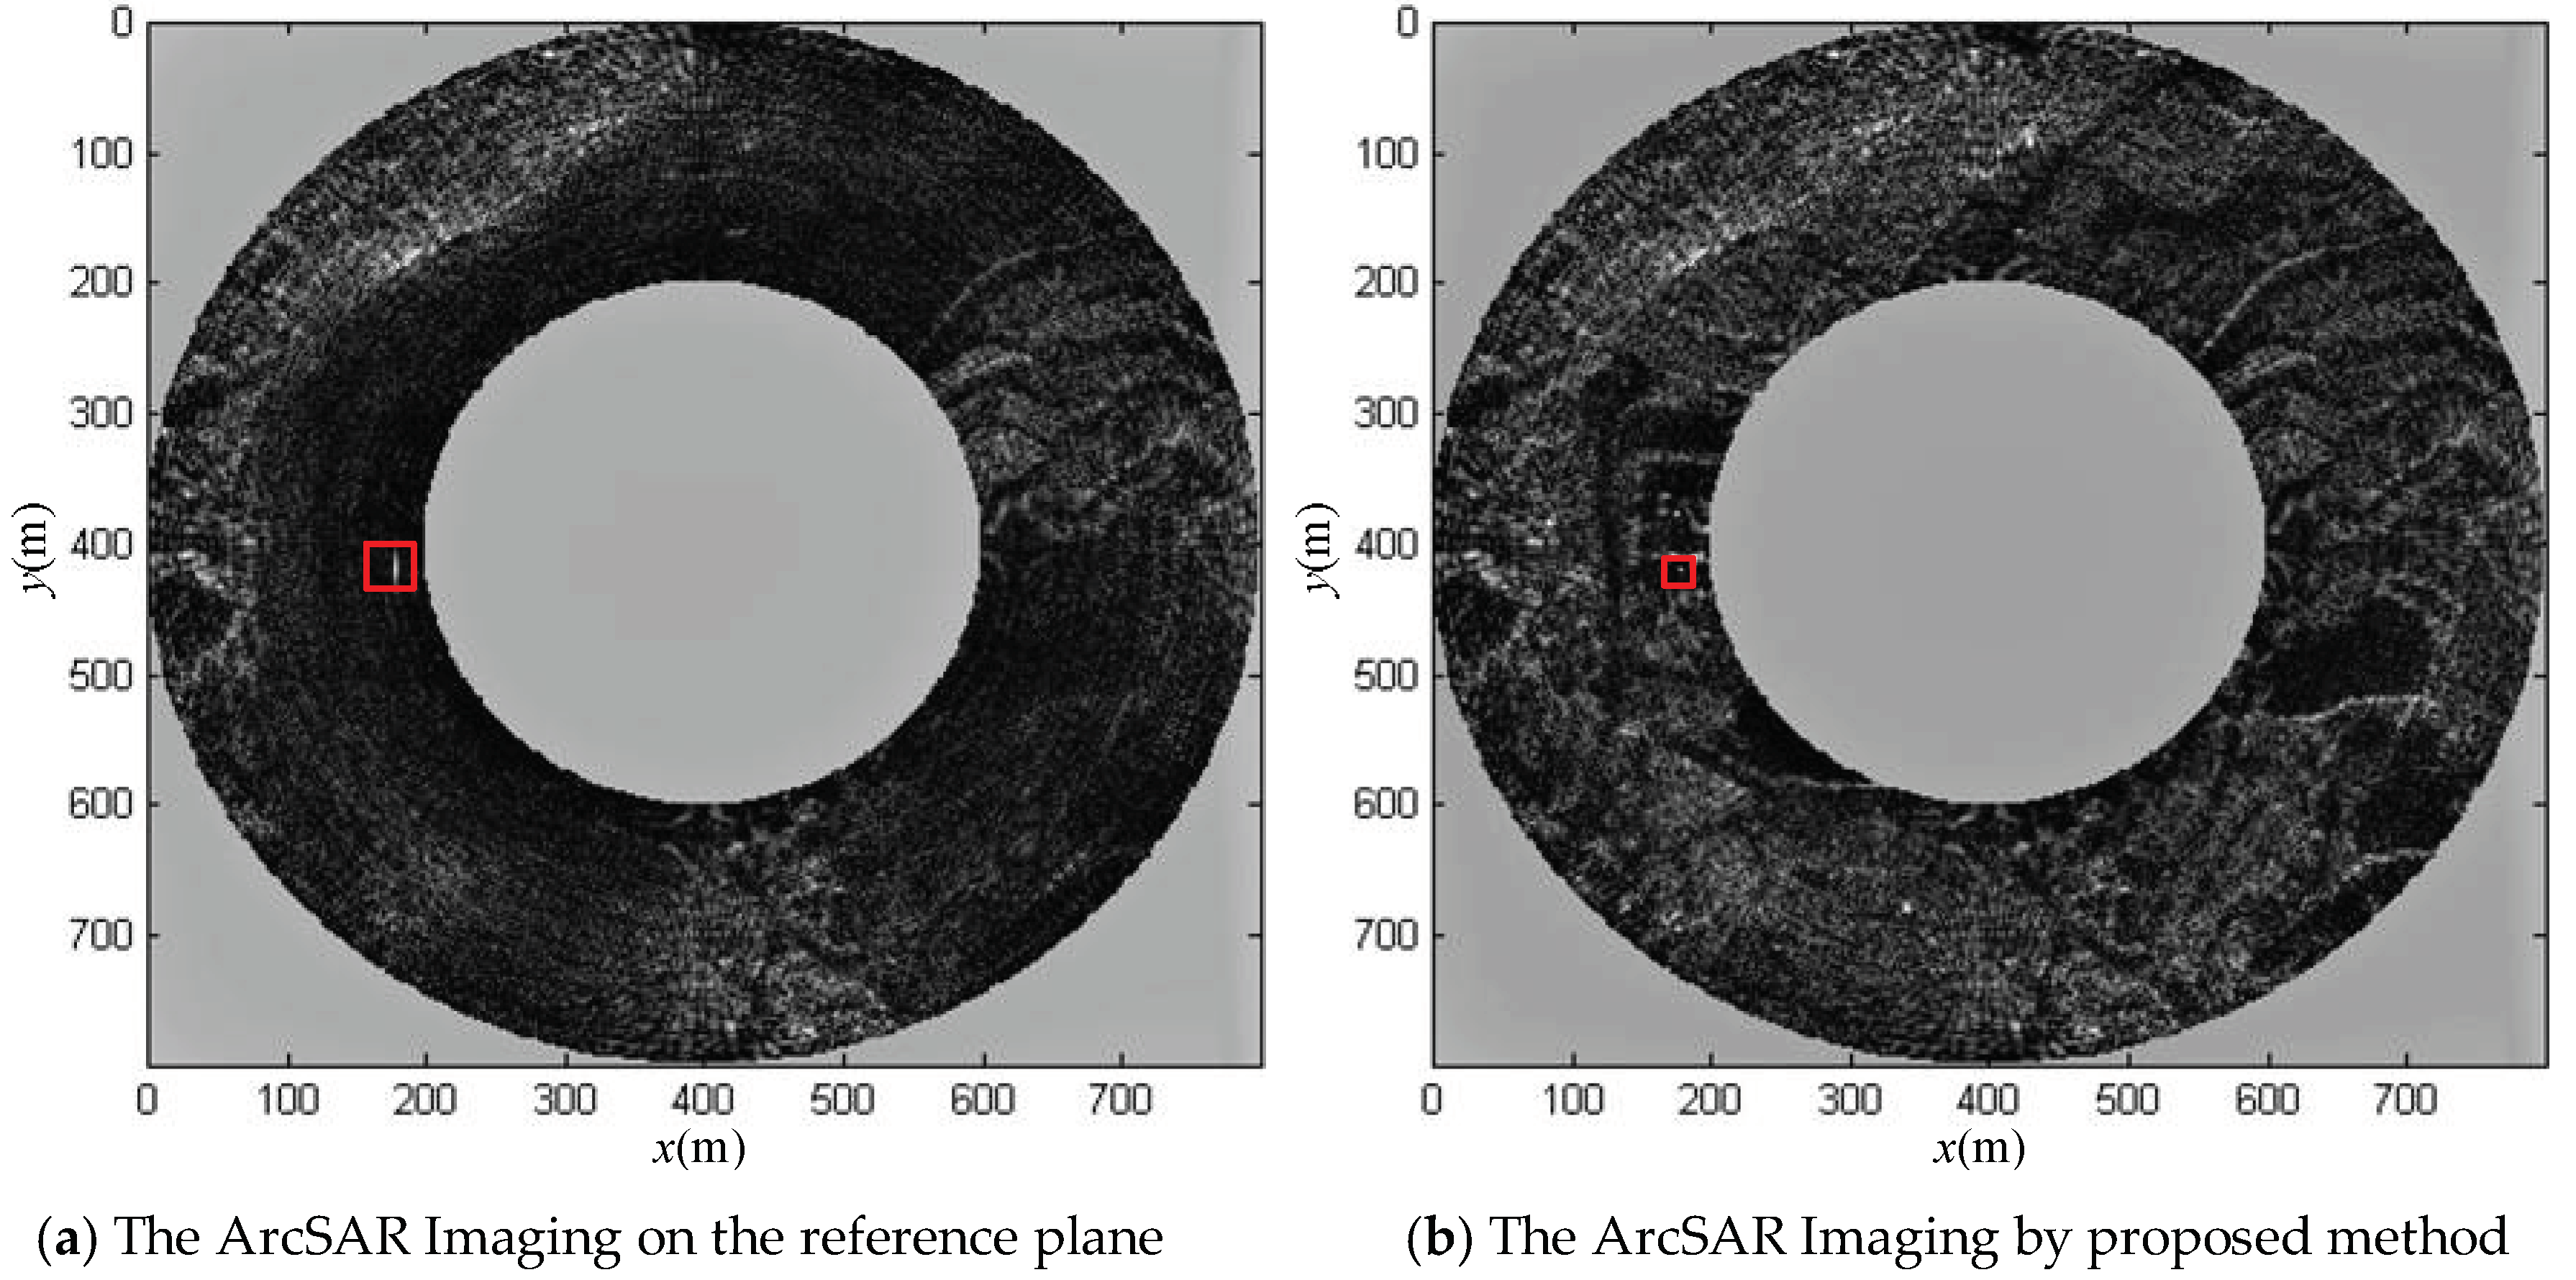
The imaging results by the two imaging methods in Cartesian coordinate system are shown in Figure 22.
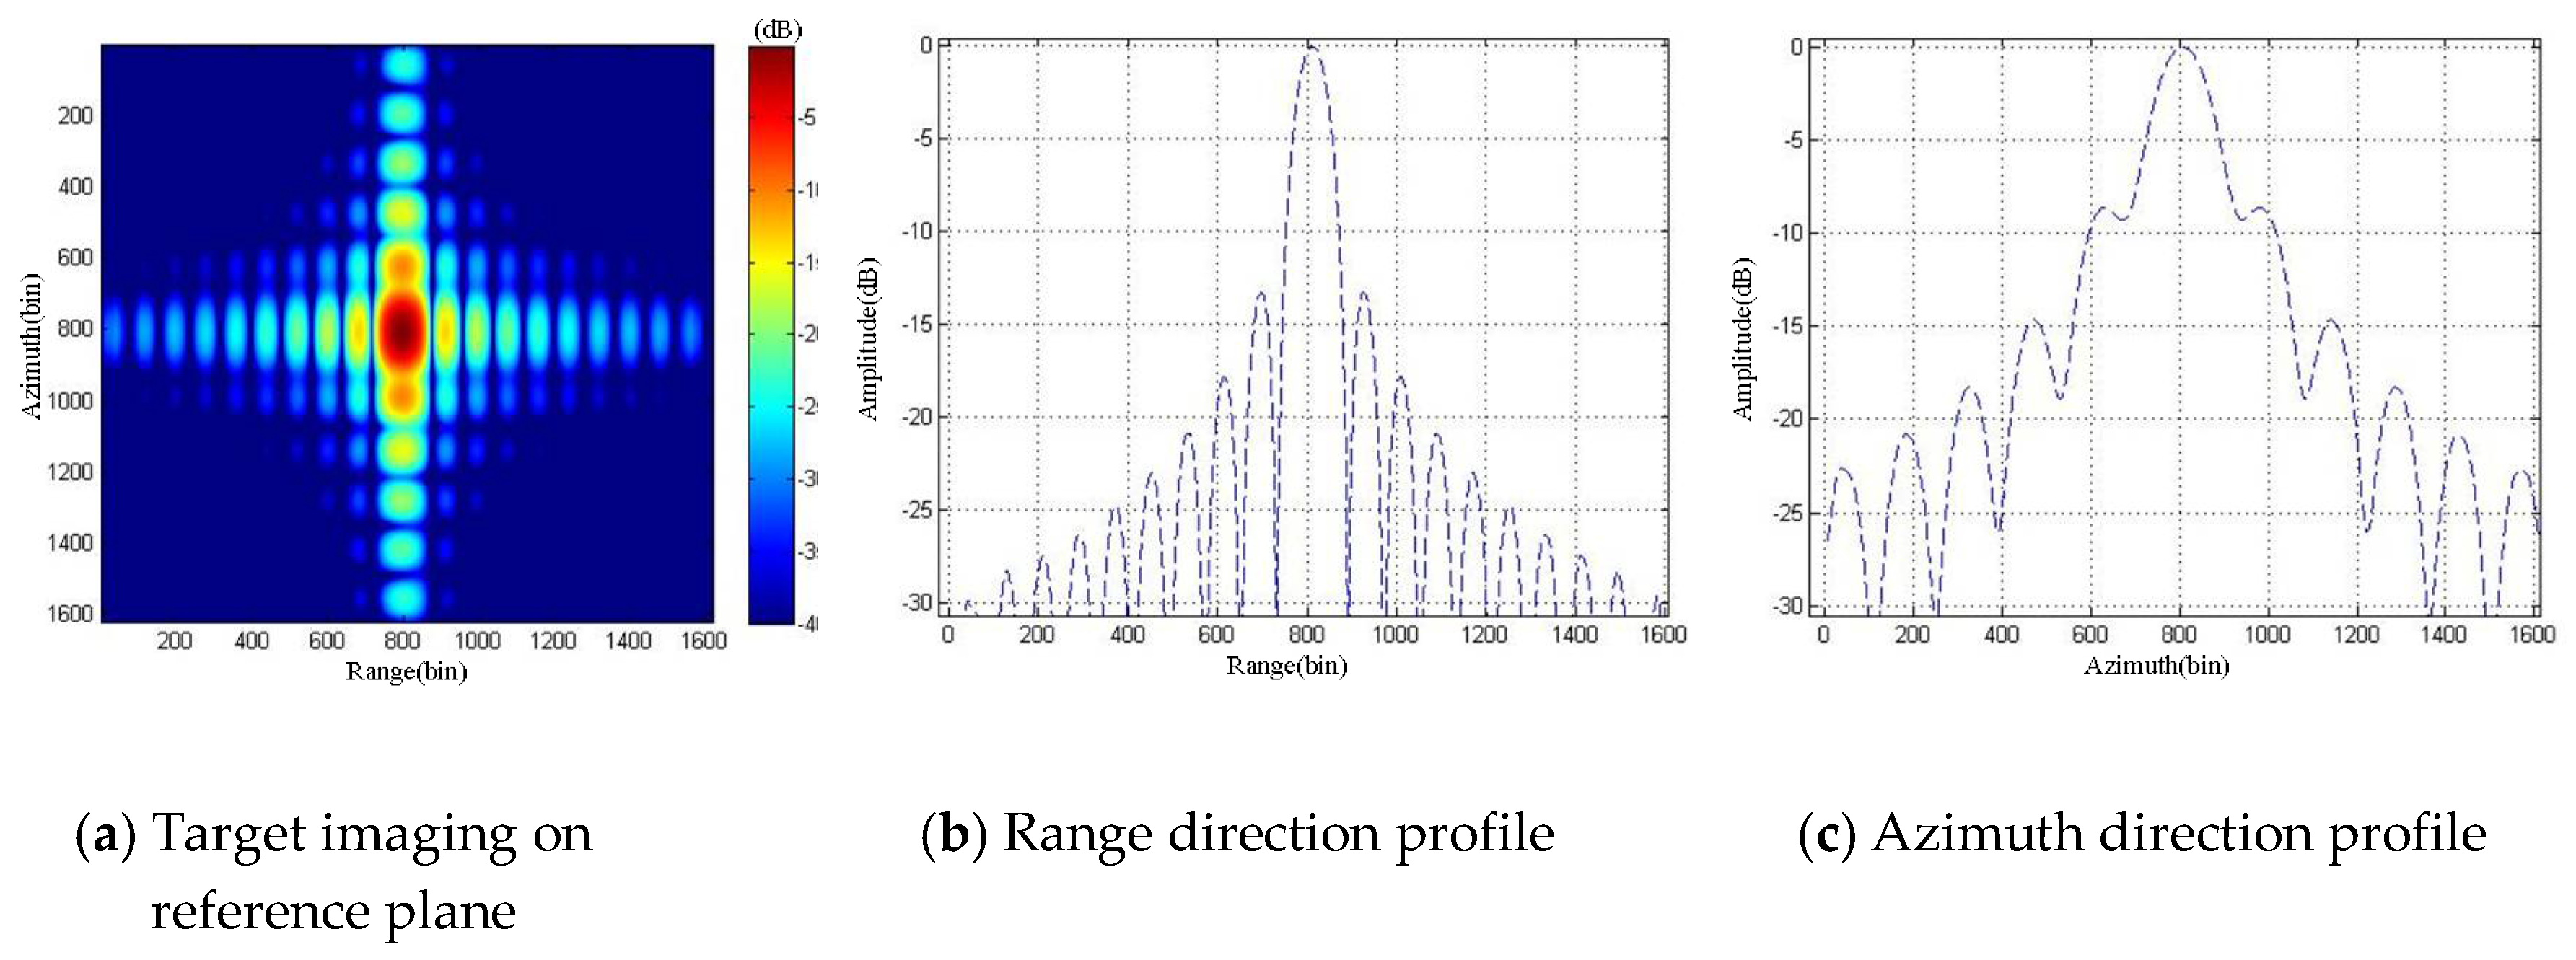
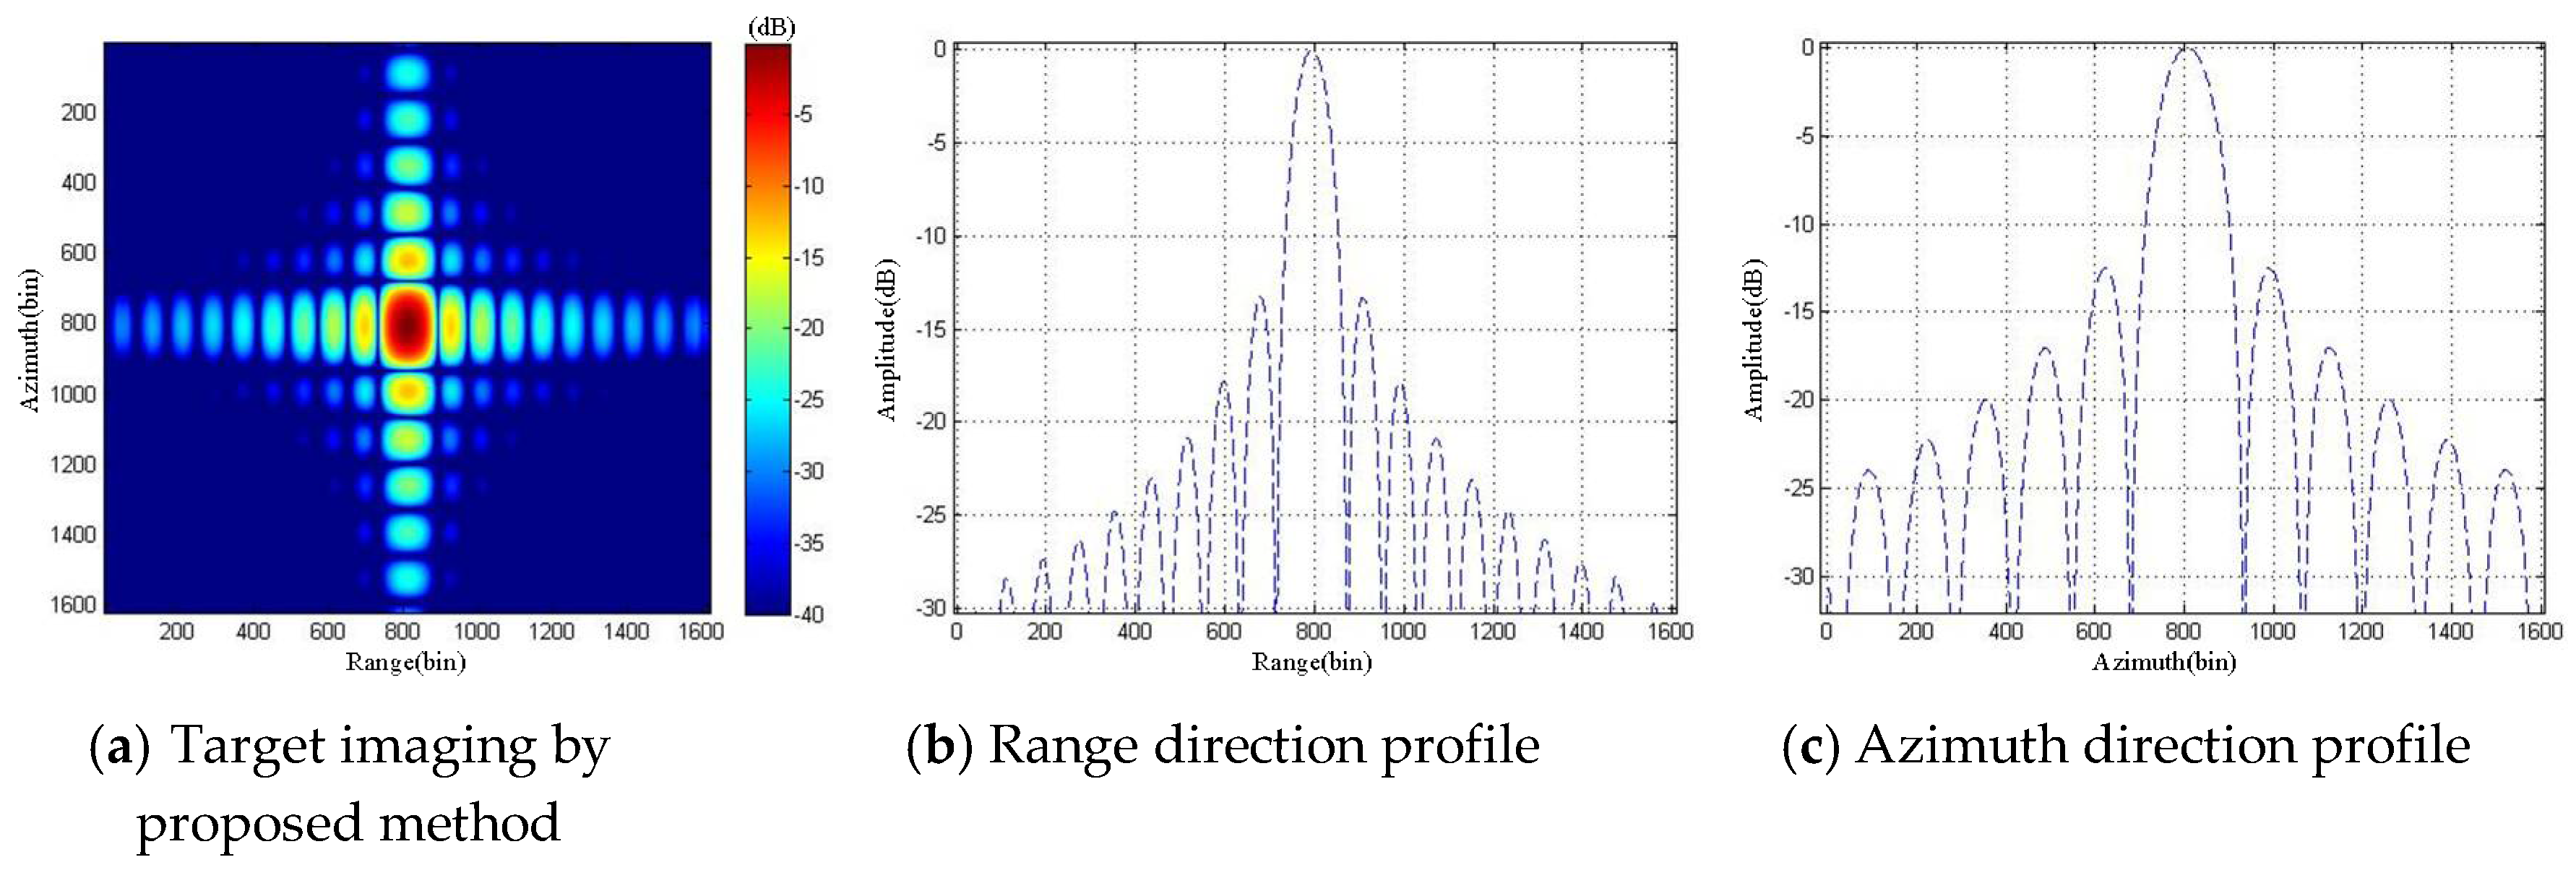
It can be seen that the ArcSAR imaging result of the scenes on the reference plane showed severe defocusing, and the ArcSAR image obtained by the proposed imaging method was not defocused. To further analyze the imaging accuracy of the proposed imaging method, we set a strong scattering target in the scenes and analyzed the quality of its imaging result. Its imaging result is marked in Figure 22. We sliced the imaging result of the target and up sampled it 20 times, as shown in Figure 23 and Figure 24. The imaging quality parameters of the strong scattering are shown in Table 3.
According to Equations (17)–(19) in Section 3.2, we calculated that the height difference threshold of the strong scattering target was 28.28 m. The height of the strong scattering target in Figure 22 was 36.82 m, which exceeded height difference threshold. Therefore, its imaging result on the reference plane showed severe defocusing, as shown in Figure 23. The imaging result of the strong scattering target obtained by the proposed high-precision imaging method was not defocused, as shown in Figure 24. Besides, it can be seen from the analysis results of the imaging quality in Table 3 that the proposed imaging method could effectively improve the quality of ArcSAR image and achieve the high-precision imaging.

7. Conclusions

In this paper, an interferometric DEM-assisted high precision imaging method for ArcSAR is proposed. The proposed method applies the interferometric ArcSAR to extract the DEM of scenes. The extracted DEM is utilized to assist ArcSAR imaging. This operation enables the target in the scenes image on its actual height. The proposed imaging method does not rely on external DEM data. Compared with the traditional ArcSAR algorithm imaged on the reference plane, the proposed method can effectively improve the accuracy of ArcSAR imaging.

Author Contributions

Y.L. (Yun Lin) and Y.S. performed the experiments and analysis. Y.W. and Y.S. wrote the manuscript. Y.L. (Yun Lin) contributed materials. Y.L. (Yang Li) and Y.Z. gave valuable advices on manuscript writing.

Funding

This research was funded by National Key R&D Program of China (grant number: 2018YFC1505103); Key international cooperation projects of the National Natural Science Foundation of China (grant number: No.61860206013); Natural Science Foundation of Beijing, China (grant number: No. 4192019); and Project No. 1921/008 Supported by “The Fundamental Research Funds for Beijing Universities”.

Conflicts of Interest

The authors declare no conflict of interest.

References

  1. Guaragnella, C.; D’Orazio, T. A Data-Driven Approach to SAR Data-Focusing. Sensors 2019, 19, 1649. [Google Scholar] [CrossRef] [PubMed]
  2. Xin, L.; Tingting, L.; Kaizhi, W.; Xingzhao, L. A novel concept of plane grid resolution for high-resolution SAR imaging systems. In Proceedings of the 2014 IEEE Geoscience and Remote Sensing Symposium, Quebec City, QC, Canada, 13–18 July 2014; pp. 358–361. [Google Scholar]
  3. Colesanti, C.; Locatelli, R.; Novali, F. Ground Deformation Monitoring Exploiting SAR Permanent Scatterers. In Proceedings of the IEEE International Geoscience and Remote Sensing Symposium, Toronto, ON, Canada, 24–28 June 2002; pp. 1219–1221. [Google Scholar]
  4. Xie, P.; Zhang, M.; Zhang, L.; Wang, G. Residual Motion Error Correction with Backprojection Multisquint Algorithm for Airborne Synthetic Aperture Radar Interferometry. Sensors 2019, 19, 2342. [Google Scholar] [CrossRef] [PubMed]
  5. Cao, N.; Lee, H.; Zaugg, E.; Shrestha, R.; Carter, W.E.; Glennie, C.; Lu, Z.; Yu, H. Estimation of Residual Motion Errors in Airborne SAR Interferometry Based on Time-Domain Backprojection and Multisquint Techniques. IEEE Trans. Geosci. Remote. Sens. 2018, 56, 2397–2407. [Google Scholar] [CrossRef]
  6. Ruiz-Armenteros, A.M.; Manuel Delgado, J.; Ballesteros-Navarro, B.J.; Lazecky, M.; Bakon, M.; Sousa, J.J. Deformation monitoring of the northern sector of the Valencia Basin (E Spain) using Ps-InSAR (1993–2010). In Proceedings of the IGARSS 2018-2018 IEEE International Geoscience and Remote Sensing Symposium, Valencia, Spain, 23–27 July 2018; pp. 2244–2247. [Google Scholar]
  7. Qi, Y.; Wang, Y.; Yang, X.; Li, H. Application of Microwave Imaging in Regional Deformation Monitoring using Ground Based SAR. In Proceedings of the Asian-Pacific Conference on Synthetic Aperture Radar (APSAR 2015), Singapore, 1–4 September 2015. [Google Scholar]
  8. Pieraccini, M.; Miccinesi, L.; Rojhani, N. A GBSAR Operating in Monostatic and Bistatic Modalities for Retrieving the Displacement Vector. IEEE Geosci. Remote. Sens. Lett. 2017, 14, 1–5. [Google Scholar] [CrossRef]
  9. Chan, Y.K.; Chu, C.Y. Ground based synthetic aperture radar for land deformation monitoring: Preliminary result. In Proceedings of the 2016 Progress in Electromagnetic Research Symposium (PIERS), Shanghai, China, 8–11 August 2016; pp. 2540–2542. [Google Scholar]
  10. Liu, Y.; Lee, C.; Yong, H.; Jia, L.; Youshi, W.; Placidi, S.; Roedelsperger, S. FastGBSAR case studies in China: Monitoring of a dam and instable slope. In Proceedings of the 2015 IEEE 5th Asia-Pacific Conference on Synthetic Aperture Radar (APSAR), Marina Bay Sands, Singapore, 1–4 September 2015; pp. 849–852. [Google Scholar]
  11. Yang, X.; Wang, Y.; Qi, Y.; Tan, W.; Hong, W. Experiment Study on Deformation Monitoring Using Ground-Based SAR. In Proceedings of the Asian-Pacific Conference on Synthetic Aperture Radar (APSAR 2013), Tsukuba, Japan, 23–27 September 2013. [Google Scholar]
  12. Garmatyuk, D.; Narayanan, R. Ultra-wideband continuous-wave random noise arc-SAR. IEEE Trans. Geosci. Remote. Sens. 2002, 40, 2543–2552. [Google Scholar] [CrossRef]
  13. Zhang, J. The static small object detection based on ground-based arc SAR. In Proceedings of the 2012 International Conference on Microwave and Millimeter Wave Technology (ICMMT), Shenzhen, China, 5–8 May 2012. [Google Scholar]
  14. Huang, Z.; Tan, W.; Huang, P.; Sun, J.; Qi, Y.; Wang, Y. Imaging algorithm study on ARC antenna array ground-based SAR. In Proceedings of the 2017 IEEE International Geoscience and Remote Sensing Symposium (IGARSS), Fort Worth, TX, USA, 23–28 July 2017; pp. 1634–1637. [Google Scholar]
  15. Rodriguez, A.C.F.; Fraidenraich, G.; Soares, T.A.P.; Filho, J.C.S.S.; Miranda, M.A.M.; Yacoub, M.D. Optimal and Suboptimal Velocity Estimators for ArcSAR with Distributed Target. IEEE Geosci. Remote. Sens. Lett. 2018, 15, 252–256. [Google Scholar] [CrossRef]
  16. Viviani, F.; Michelini, A.; Mayer, L.; Conni, F. IBIS-ArcSAR: an Innovative Ground-Based SAR System for Slope Monitoring. In Proceedings of the IGARSS 2018 IEEE International Geoscience and Remote Sensing Symposium, Valencia, Spain, 23–27 July 2018; pp. 1348–1351. [Google Scholar]
  17. Luo, Y.; Song, H.; Wang, R.; Xu, Z.; Li, Y. Signal processing of Arc FMCW SAR. Proceedings of 2013 Asia-Pacific Conference on Synthetic Aperture Radar (APSAR), Tsukuba, Japan, 23–27 September 2013. [Google Scholar]
  18. Luo, Y.; Song, H.; Wang, R.; Deng, Y.; Zhao, F.; Xu, Z. Arc FMCW SAR and Applications in Ground Monitoring. IEEE Trans. Geosci. Remote. Sens. 2014, 52, 5989–5998. [Google Scholar] [CrossRef]
  19. Lee, H.; Cho, S.-J.; Kim, K.-E. A ground-based Arc-scanning synthetic aperture radar (ArcSAR) system and focusing algorithms. In Proceedings of the 2010 IEEE International Geoscience and Remote Sensing Symposium, Honolulu, HI, USA, 25–30 July 2010; pp. 3490–3493. [Google Scholar]
  20. Lee, H.; Lee, J.-H.; Kim, K.-E.; Sung, N.-H.; Cho, S.-J. Development of a Truck-Mounted Arc-Scanning Synthetic Aperture Radar. IEEE Trans. Geosci. Remote Sens. 2014, 52, 2773–2779. [Google Scholar] [CrossRef]
  21. Cumming, I.G.; Wong, F.H. Digital processing of synthetic aperture radar data: Algorithms and implementation. ARTECH HOUSE: Norwood, MA, USA, 2004; ISBN 978-1-580-53058-3. [Google Scholar]
  22. Pieraccini, M.; Miccinesi, L. ArcSAR for detecting target elevation. Electron. Lett. 2016, 52, 1559–1561. [Google Scholar] [CrossRef]
  23. Pieraccini, M.; Miccinesi, L. ArcSAR: Theory, Simulations, and Experimental Verification. IEEE Trans. Microw. Theory Tech. 2017, 65, 293–301. [Google Scholar] [CrossRef]
  24. Zebker, H.; Werner, C.; Rosen, P.; Hensley, S. Accuracy of topographic maps derived from ERS-1 interferometric radar. IEEE Trans. Geosci. Remote. Sens. 1994, 32, 823–836. [Google Scholar] [CrossRef] [Green Version]
  25. Li, F.; Han, B.; Lin, X.; Hu, D.; Ding, C. A method of airborne InSAR DEM reconstruction in layover areas. In Proceedings of the 2012 IEEE International Geoscience and Remote Sensing Symposium, Munich, Germany, 22–27 July 2012. [Google Scholar]
  26. Nico, G.; Leva, D.; Antonello, G.; Tarchi, D. Ground-based SAR interferometry for terrain mapping: Theory and sensitivity analysis. IEEE Trans. Geosci. Remote. Sens. 2004, 42, 1344–1350. [Google Scholar] [CrossRef]
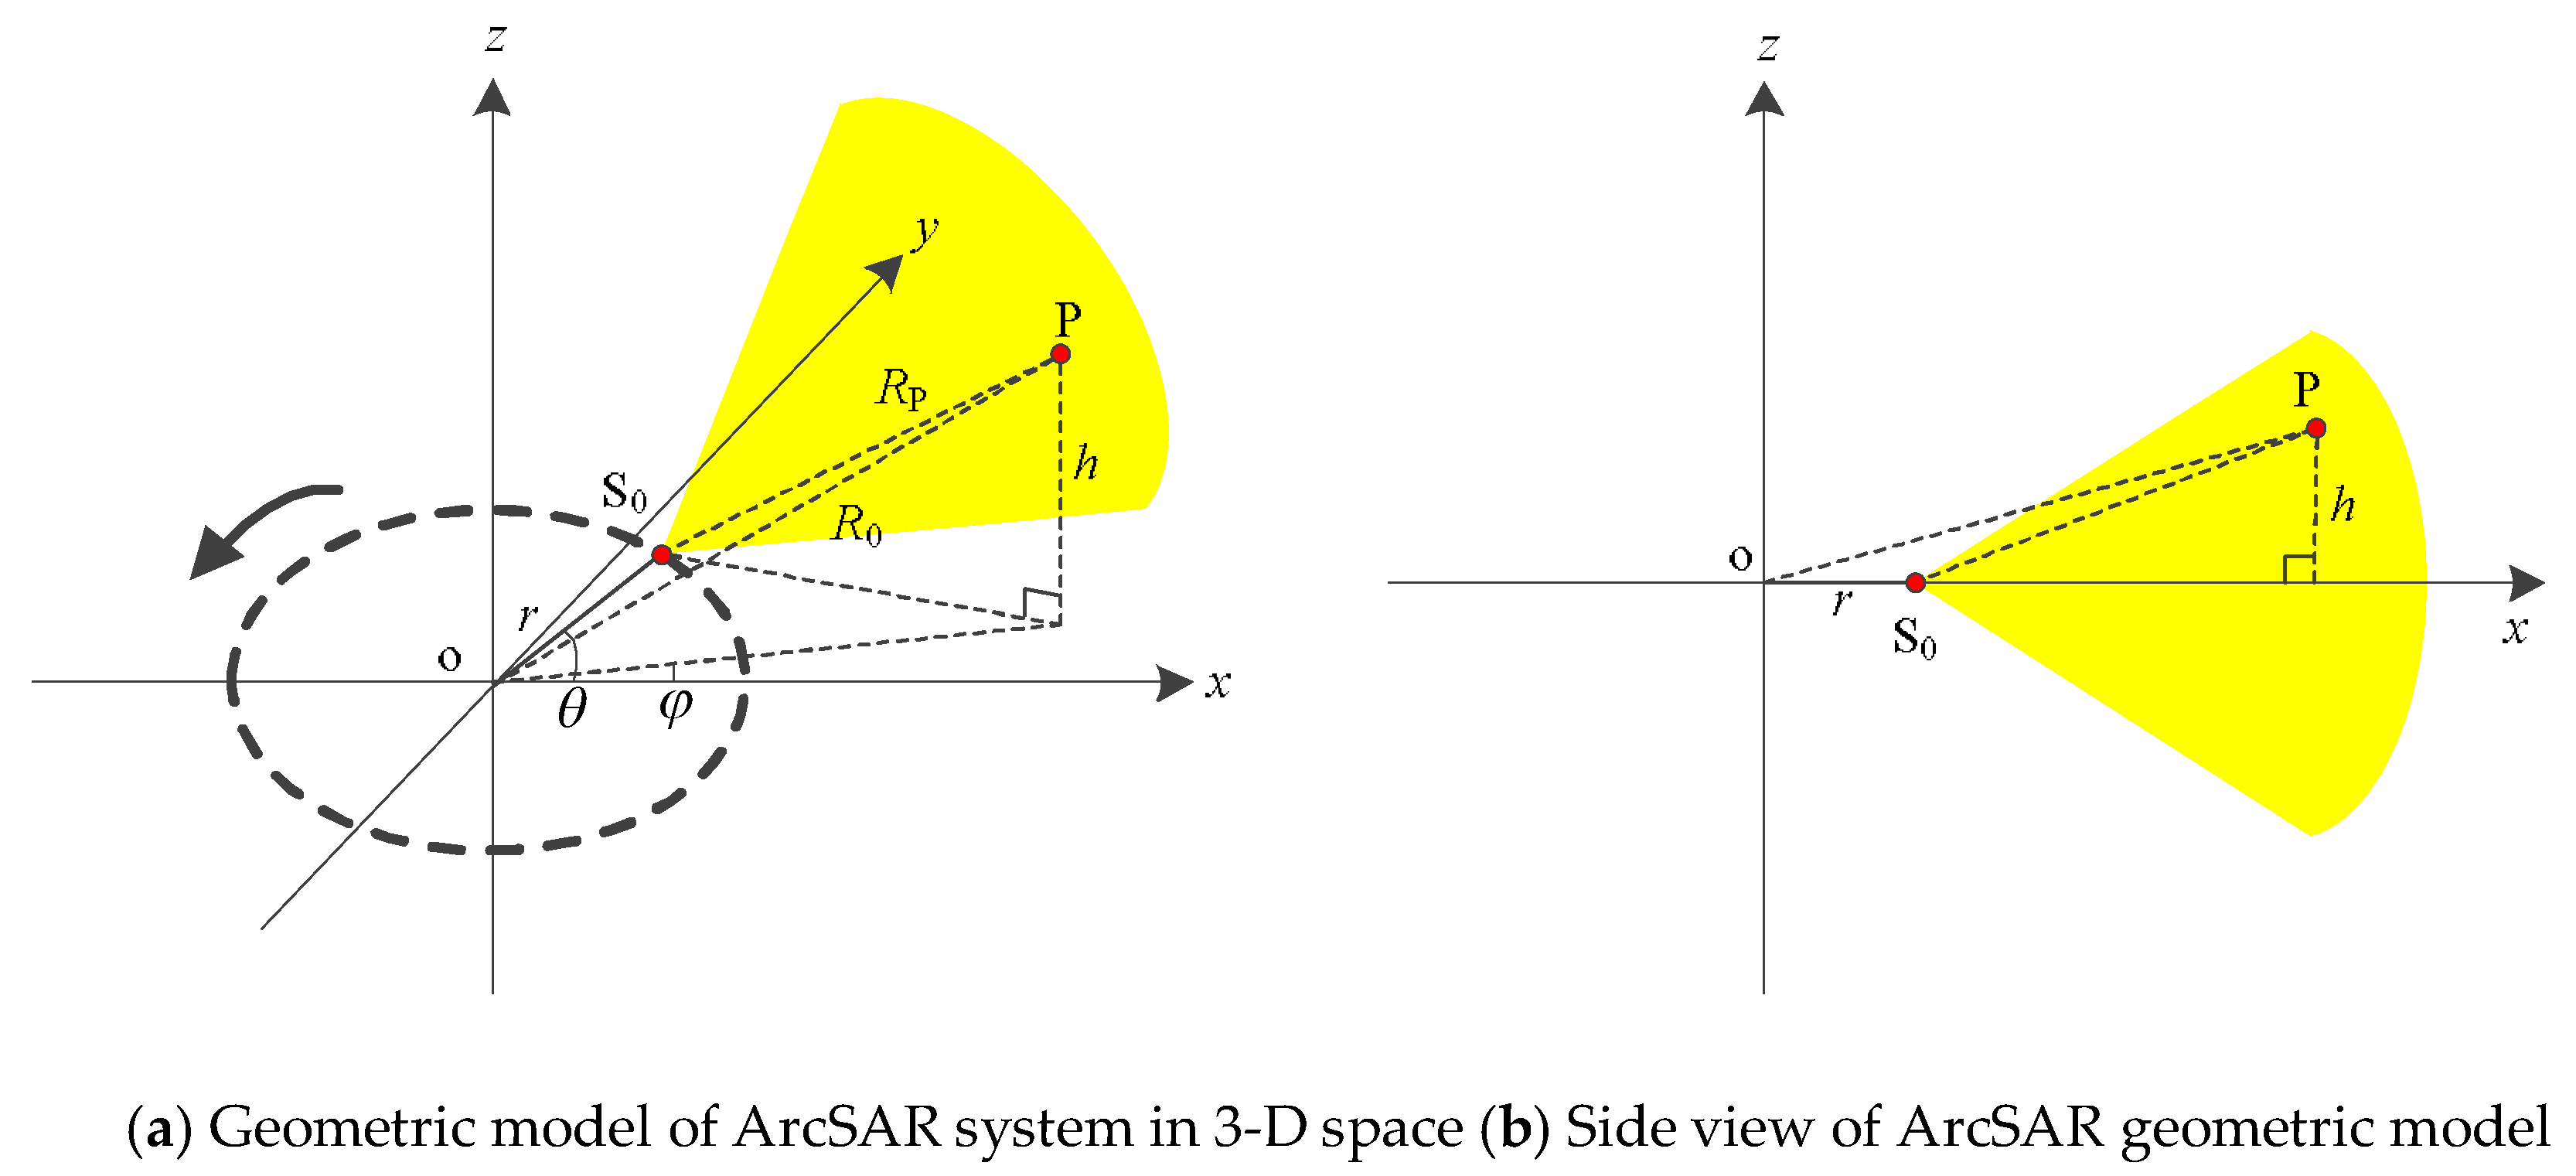
Figure 1. The geometric model of ArcSAR system.
Sensors 19 02921 g001aSensors 19 02921 g001b
Figure 2. Target P and its imaging result on the reference plane.
Sensors 19 02921 g002
Figure 3. The θ–∆R relationship curve.
Sensors 19 02921 g003
Figure 4. The h–∆Rmax relationship curve.
Sensors 19 02921 g004
Figure 5. Imaging simulation results of target P on the reference plane.
Sensors 19 02921 g005
Figure 6. Flow chart of the proposed high precision ArcSAR imaging method.
Sensors 19 02921 g006
Figure 7. The model of interferometric ArcSAR.
Sensors 19 02921 g007
Figure 8. The DEM image in the polar coordinate system.
Sensors 19 02921 g008
Figure 9. Flow chart of calculating the sequence Rg.
Sensors 19 02921 g009
Figure 10. The polar coordinate transformation method proposed in this paper.
Sensors 19 02921 g010
Figure 11. h–Slosscurve.
Sensors 19 02921 g011
Figure 12. hρ curve.
Sensors 19 02921 g012
Figure 13. hσps curve.
Sensors 19 02921 g013
Figure 14. The hpd curves.
Sensors 19 02921 g014
Figure 15. hσpd curve.
Sensors 19 02921 g015
Figure 16. hσh curve.
Sensors 19 02921 g016
Figure 17. hσd curve.
Sensors 19 02921 g017
Figure 18. The RCS scenes for simulation, the DEM data for simulation and the simulated ArcSAR image in polar coordinate system.
Sensors 19 02921 g018
Figure 19. Interferometric phase image of phase wrapping.
Sensors 19 02921 g019
Figure 20. Interferometric ArcSAR extraction the DEM image of scenes.
Sensors 19 02921 g020
Figure 21. The defocused area and focused area of imaging result on the reference plane.
Sensors 19 02921 g021
Figure 22. The distributed scenes imaging simulation results of ArcSAR in Cartesian coordinate system by traditional method and proposed method.
Sensors 19 02921 g022
Figure 23. Imaging simulation results of the strong scattering target on the reference plane.
Sensors 19 02921 g023
Figure 24. Imaging simulation results of the strong scattering target by proposed method.
Sensors 19 02921 g024
Table 1. The ArcSAR system parameters.
r (m)θbw (rad)θ (rad)λ (mm)Rsp (m)Br (MHz)
1π/3π/317.50300150
Table 2. Experiment parameters.
r (m)θbw (rad)θ (rad)λ (mm)Br (MHz)Rmax (m)Rmin (m)
1π/317.50150400200
Table 3. The quality parameters of the strong scattering target imaging result.
ParametersImaging on Reference PlaneImaging by Proposed Method
Coordinates (m,deg)(220.91,185.19)(220.91,185.19)
Height (m)36.8236.82
Range direction resolution (m)1.001.00
Range direction PSLR (dB)−13.21−13.22
Azimuth direction resolution (m)1.921.91
Azimuth direction PSLR (dB)−8.63−12.57