Characterization of Industry 4.0 Lean Management Problem-Solving Behavioral Patterns Using EEG Sensors and Deep Learning
Abstract
1. Introduction
2. Literature Review
- InhibitionA capacity to resist to distraction. While solving problems in industrial shopfloors with high levels of potential distractions [23], it is important to focus on the most important root-causes of value-stream variability and discard less relevant information.
- ShiftA capacity to shift smoothly from one task, routine, or context to another. When dealing with highly interdependent complex processes, typical for instance of re-configurable manufacturing systems [24], it is important to shift within several levels of complexity to flexibly conduct an analysis in a multidimensional complex environment.
- Working MemoryA capacity to hold and manipulate multiple ideas. Within a manufacturing environment with multiple interconnected processes, it is necessary to accurately hold a significant amount of relevant information when realizing problem-solving tasks [25].
- Outer/Inner World RepresentationOne of the first of these approaches in primates considers that the lateral PFC area represents the outer world related cognition and that the medial and ventral PFC represent our inner emotional world [39].
- Abstract/Social Cognition
- Inhibition/GenerativeAron [42] suggest that the PFC presents a hemispheric lateralization in which the right hemisphere inhibits improper emotions or actions, whereas the left hemisphere concentrates on generative processes. These results are in the same line of those exposed in the avoidance (BIS) vs. approach (BAS) resting state and personality component theory [43]. They explain how high levels of BAS explain high levels of cortical activity in the right hemisphere while in the resting state and in experimental conditions with positive stimuli. In contrast, high BIS levels indicate cortical activity in the right hemisphere while in the resting state and under experimental conditions with negative stimuli.
- Context-Dependent Goal ModulationMore recently, researchers have recognized that context-dependent, goal-directed behavioral control and decision-making ‘involves constant reciprocal and dynamic communication between PFC cortices and posterior brain regions’ [44]. Specifically, the ventromedial PFC supplies the basis for goal-directed decision-making [45] and the context-dependent functionality originates in a modulation of the ventromedial PFC by the dorsolateral PFC [46]. Correlative interaction between such brain regions, ‘enable goal modulation of brain activity based on goal states’ [47,48].
- StressManufacturing leaders are constantly under environmental pressure. It has been proven by that ‘exposure to uncontrollable stress, acute, or chronic, causes temporal loss of PFC cognitive functions’ [50], which leads to poor decision-making. The fact that even mildly ’acute uncontrollable stress induces a rapid and dramatic loss of PFC cognitive abilities’ is particularly relevant for organizational leaders and decision-making when dealing with subordinates [51].
- PsychopathyPsychopaths present a demonstrated, reduced neural synchronization between ventromedial PFC and dorsolateral PFC while engaged in cognitive tasks with an emotional component [52]. Such cerebral functional configuration seems to (1) suppress decentralized information that is a-priori irrelevant to the goal at hand [53] and (2) lead to a predisposition of moral judgement impairment [54]. This might be why there is a disturbingly high number of individuals with such a personality trait who assume leadership roles [55].
- Context-Independent
- Context-Dependent
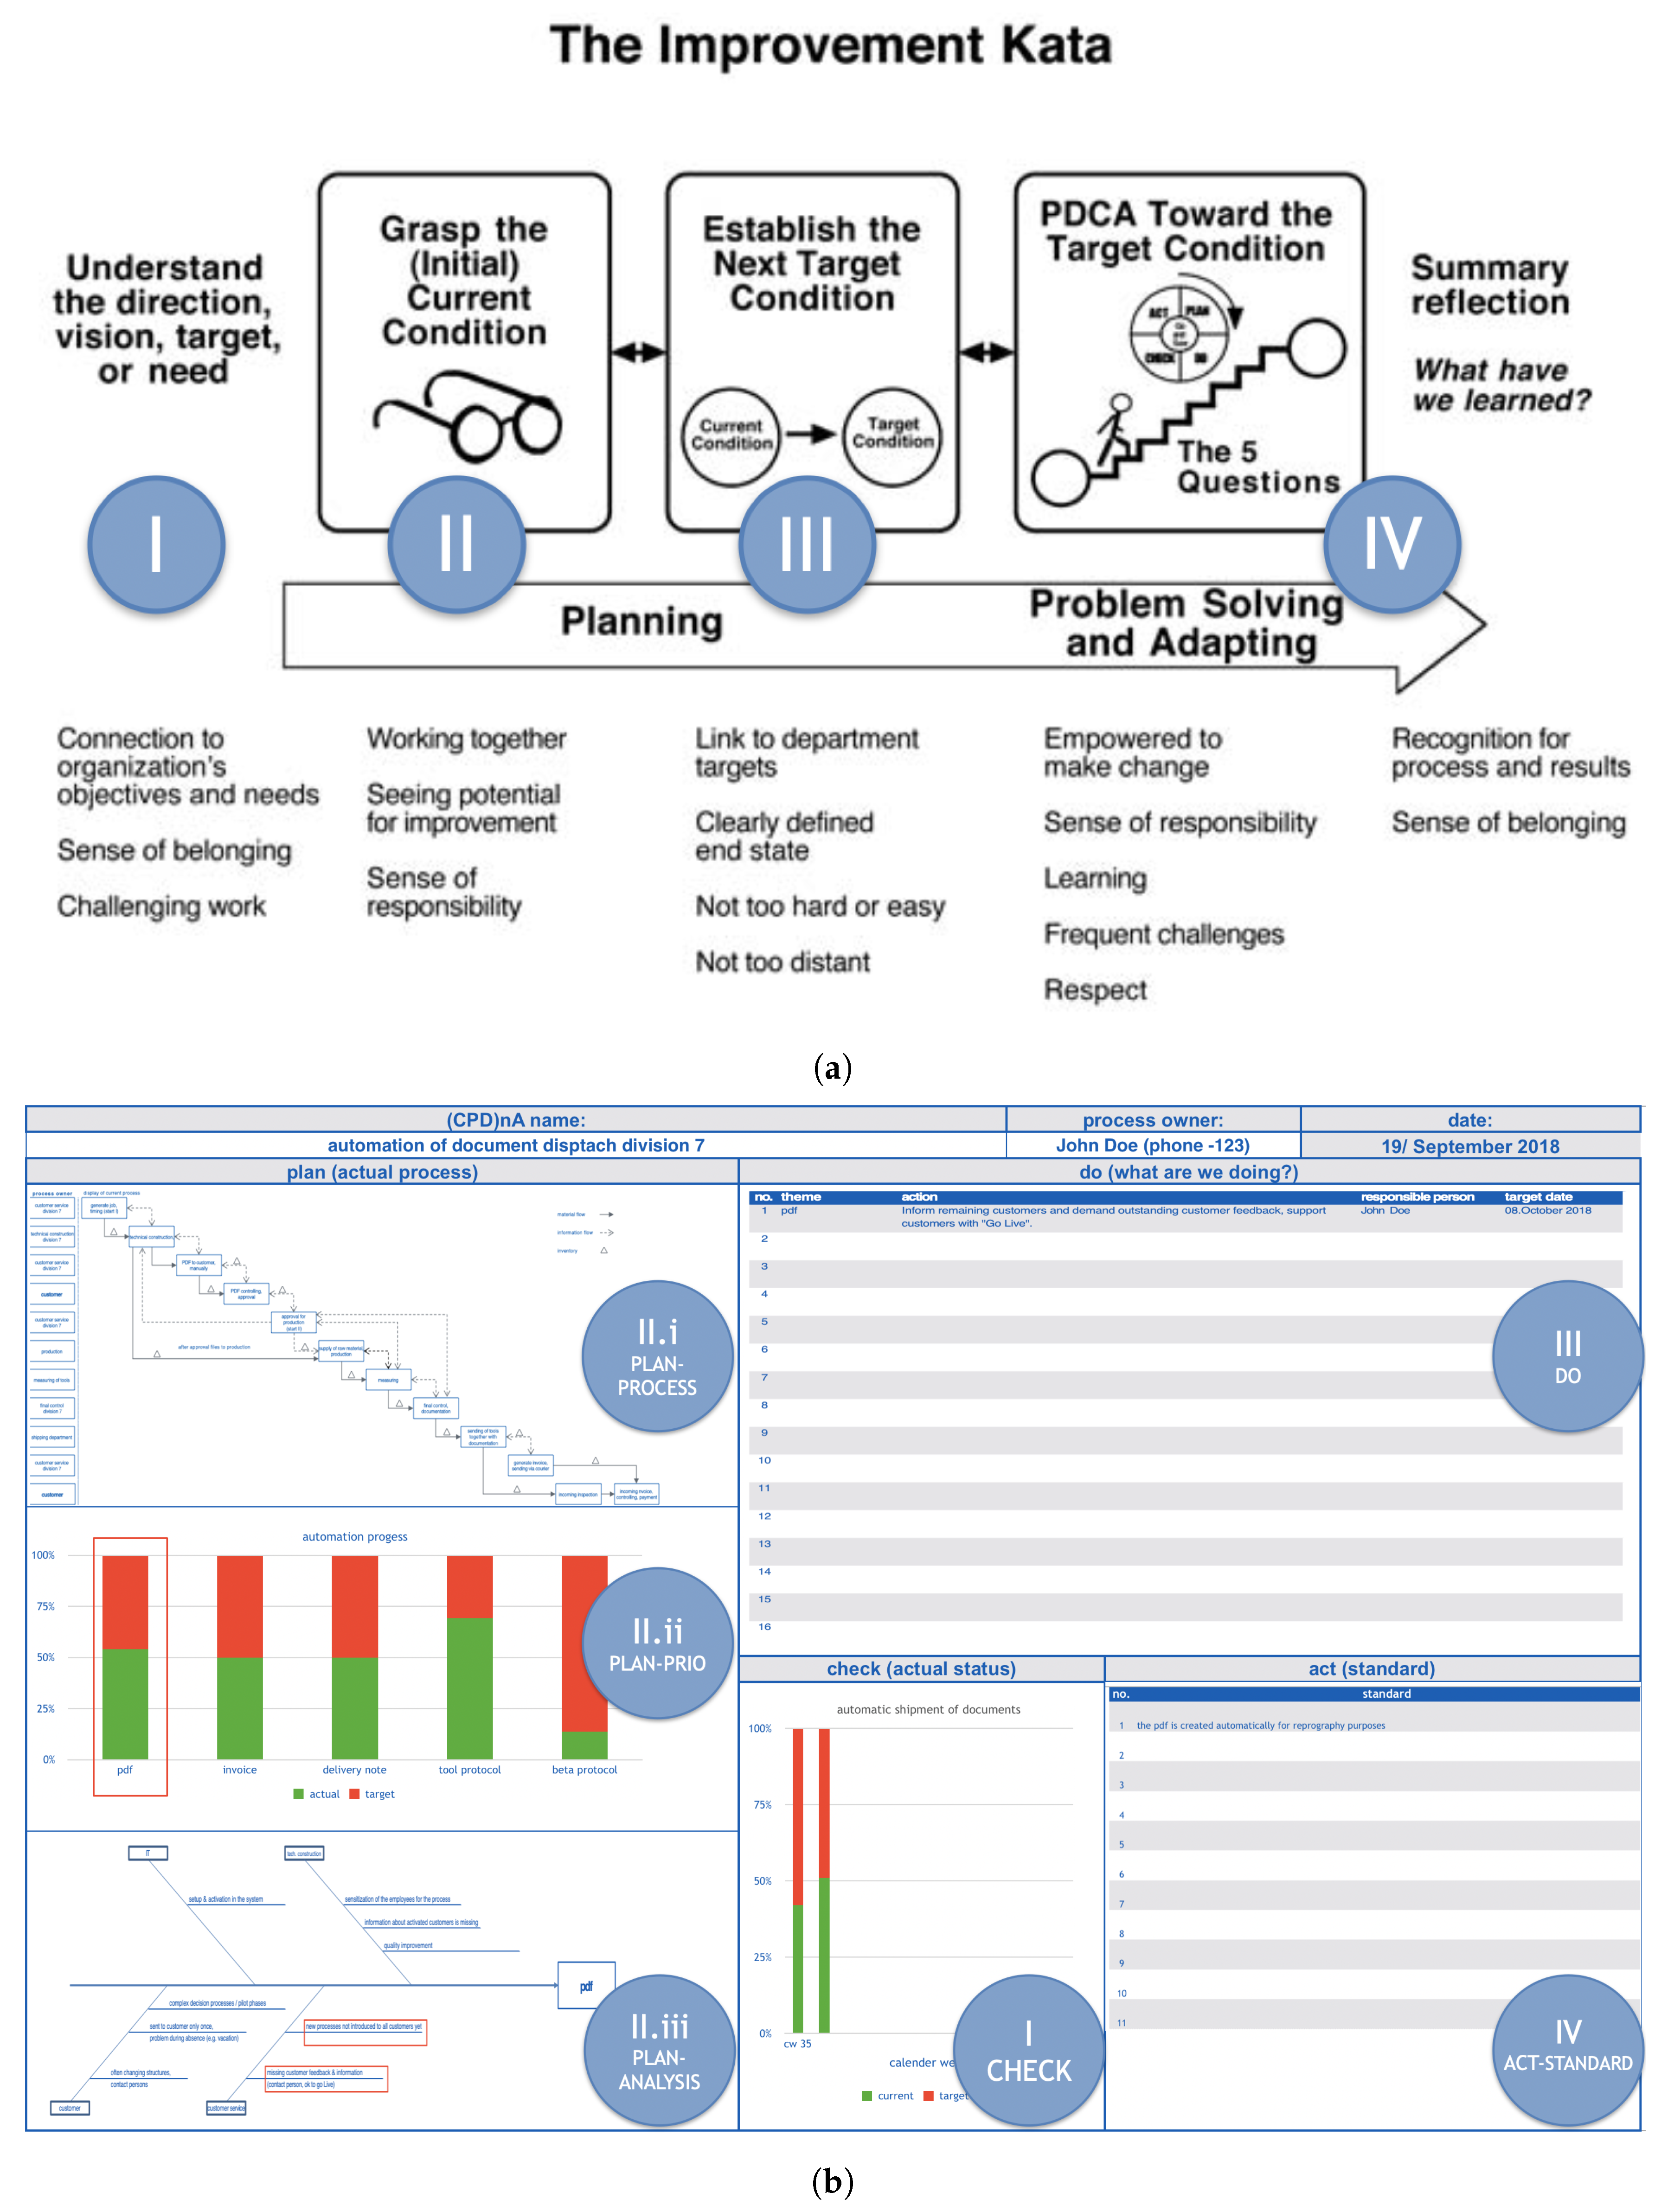
- KATA [11] is a standardized behavioral pattern that can be summarized in four steps:
- I
- Set direction. Decide in which direction there can be improvement.
- II
- Understand the current state. Create a common understanding of the factual reality of the value stream at hand.
- III
- Establish target condition. Fix a target state for the subject to achieve.
- IV
- Perform PDCA towards the target condition. Systematically and iteratively approach the target state.
KATA fixes the subject’s attention to a certain set of target-state conditions (Step 3) and does not permit these to be changed until they are achieved (through Step 4). This does not permit the subject to shift between contexts, for his/her mind is concentrated on target-state achievement. - (CPD)nA [14] derives from Japanese interpretations of continuous improvement [61] and its standardized behavioral pattern can be summarized in four steps:
- I
- Check. Decide how to measure success.
- II
- Plan.
- Plan-Process. Separate what is known from what is unknown in the value stream.
- Plan-Priority. Understand the main sources of value-stream variability.
- Plan-Root Cause Analysis. Analyze the main source of internal process variability in search of its root cause.
- III
- Do. Define an action to eliminate the source of internal process variability.
- IV
- Act. Standardization of the best-known way to carry out the process.
(CPD)nA does not set any specific target state, and instead, encourages continuous improvement of the given success measurement (calculated from the Check) based solely on the knowledge of the current state of the value stream. This permits the subject to shift flexibly between contexts to adapt his/her behavior to the current state condition.
- Cross-Correlation FunctionThe most frequently used measure of interdependence between EEG signals in neuroscience is probably the cross-correlation function [78]. The cross-correlation function represents the inner product between two normalized signals and provides a measure of the linear synchronization or similarity between them [79]. Cross-correlation function combined with expert knowledge has been used, for example, in pattern recognition to correlate EEG frequency bands and other bodily signals, such as one’s heart rate for sleep classification [80], in neurophysiology to detect the risk level of schizophrenia [81] or to analyze the relationship of brain activity and breathing [82], and even as a calibration method for brain–computer interfaces [83].
- Deep LearningAdditionally, in the analysis of EEG signals, several approaches have been used that mostly consist of extracting features from the signals in several domains [84,85,86] that are selected by experts or by dimensional reduction algorithms, such as principal and independent component analysis [87] or more recently with differential entropy and linear discriminant analysis filters [88]. However, there is a fundamental inherent limitation in all these methods, as they require expert knowledge and manual expert manipulation of data is biased. Therefore, an automatic feature selection that is independent of human expertise is desirable.DL can serve this purpose, as is an artificial intelligence method that can learn features purely from data [89]. This method presents two main advantages: first, it learns features directly from the raw data using several layers (deep) in a hierarchical manner [90], and second, it can be applied to unlabeled data by unsupervised methods, this is without the need for expert supervision [91]. In general, DL architectures such as deep neural networks, contain an input layer and an output layer of ‘neurons’. In between, there are numerous layers of hidden units [92]. More specifically, deep neural networks use unsupervised learning to adjust the weights between hidden layers, enabling the network to identify the best internal features of the inputs [93].Recent research has involved DL techniques to classify EEG datasets of subjects’ executed movements [94,95,96] or motor imagery movements [97]. In addition, some contributions propose to use the EEG signals for DL biometric identification [98]. Also, there have been some results that are related to the identification of relevant sensors in emotion recognition EEG tests [99]. Recently scholars have used DL to perform human activity recognition from brain activity in Industry 4.0 environments [100] in which several transforms of raw data into images are depicted. Our research aims to expand this approach on the characterization of complex LM problem-solving behavioral patterns in an Industry 4.0 environment.
3. Materials and Methods
3.1. Scope Establishment
3.2. Specifications of Population and Sampling
3.3. Data Collection
- Sampling method: Sequential sampling. Single ADC.
- Sampling rate: 128 samples per second (2048 Hz internal).
- Resolution: 14 bits 1 least significant beat = 0.51 V (16-bit ADC, 2 bits instrumental noise floor discarded), or 16 bits.
- Bandwidth: 0.2–43 Hz, digital notch filters at 50 Hz.
- Filtering: Built in digital 5th order Sinc filter.
- Dynamic range (input referred): 8400 V.
- Coupling mode: AC coupled.
3.4. Data Pre-Processing
- First, a high-pass filter is first performed to remove the DC components from the signal (a cut-off of 1 Hz is considered sufficient and consistently produced good results in terms of SNR). [108]. This is because large drifts in the data were observed.
- Next, as indicated in the EEG sensor specifications, a hardware embedded low pass filter was implemented to eliminate frequencies above 50 Hz. This reduced the noise is associated with higher frequencies.
- Finally, in order to ensure the maximum level of anonymity for the subjects and to be scrupulous with the compliance standards of the company in which the study is carried out, a normalization in the range [0.1] of the values is performed. This can only be done because this study will not make comparisons between subjects.
3.5. Standardization Procedure
3.6. Data Analysis
3.6.1. Experimental Setup
3.6.2. Deep Learning
- Data SegmentationThe time-dependent EEG data set is separated into 1-s segments during the data segmentation process. All subsequent operations, including feature extraction, classification, and validation, etc., are based on this previous segmentation. The nature of the segments depends on the application context and the sampling frequency of the EEG sensors. Increasing the length of the segments may improve the accuracy of the recognition, but the learning time will increase, and more time will be needed to obtain sufficient data. This could lead to delays in the response of applications in real time and restrict application scenarios [110].
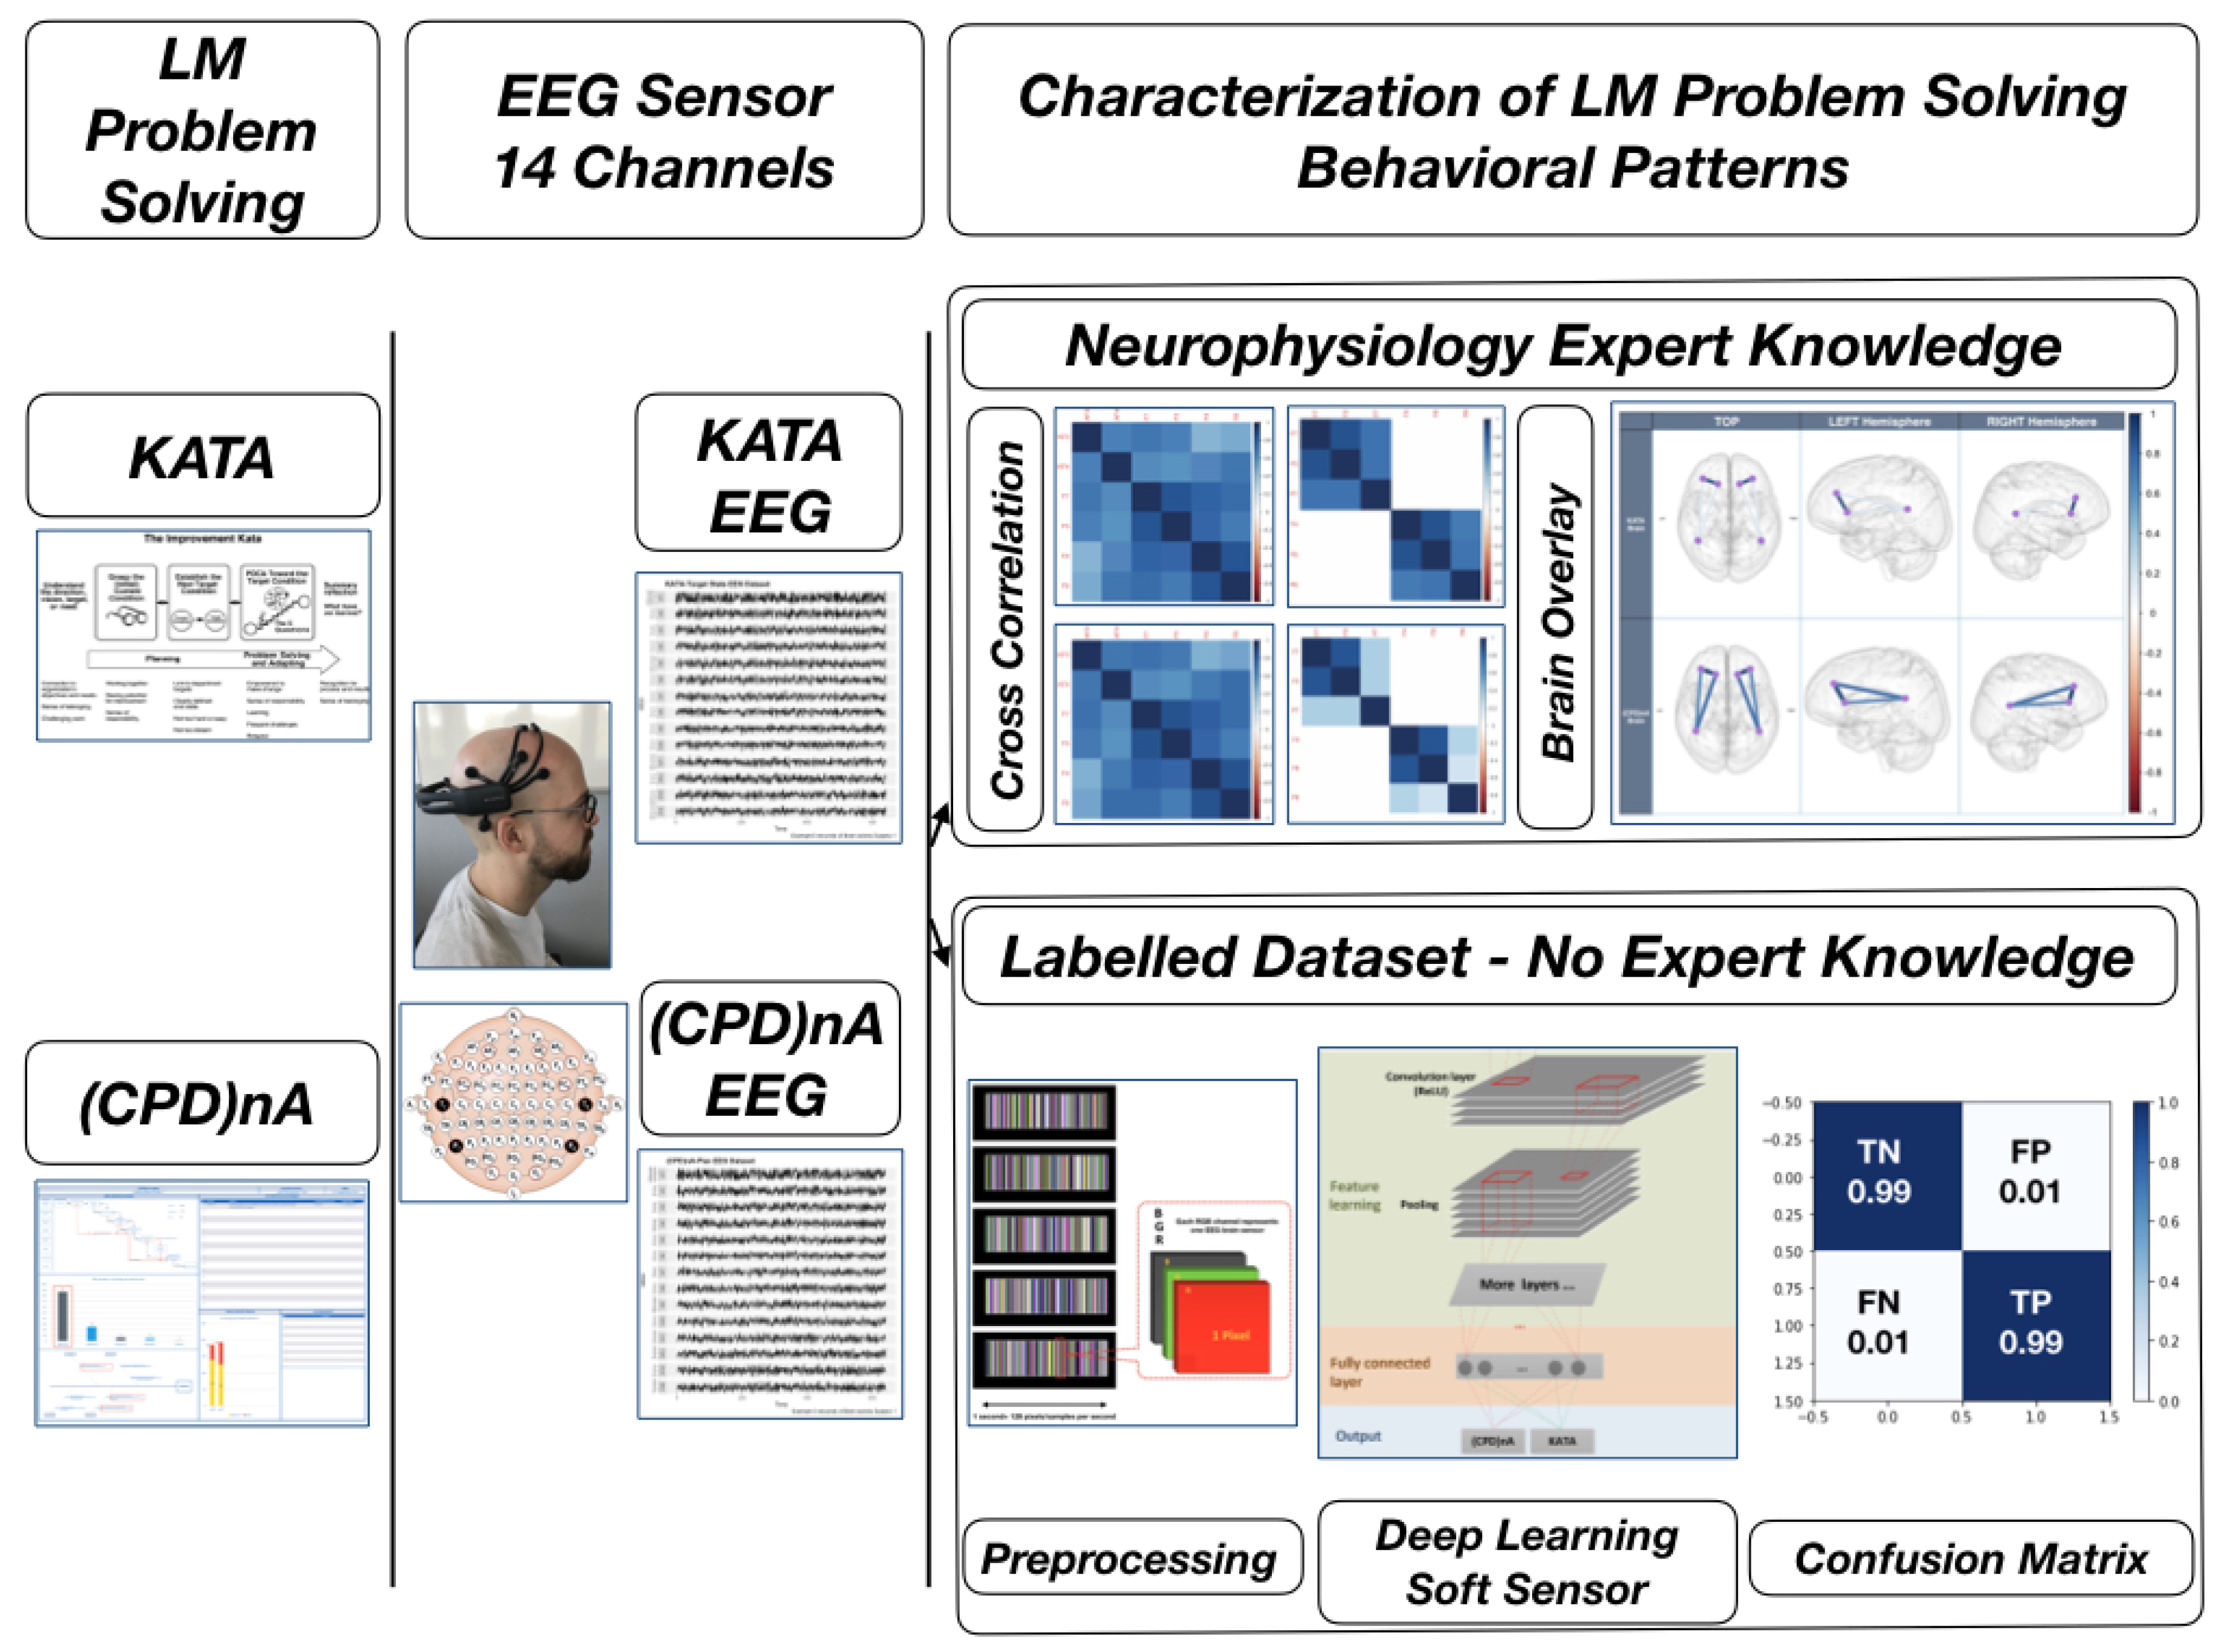
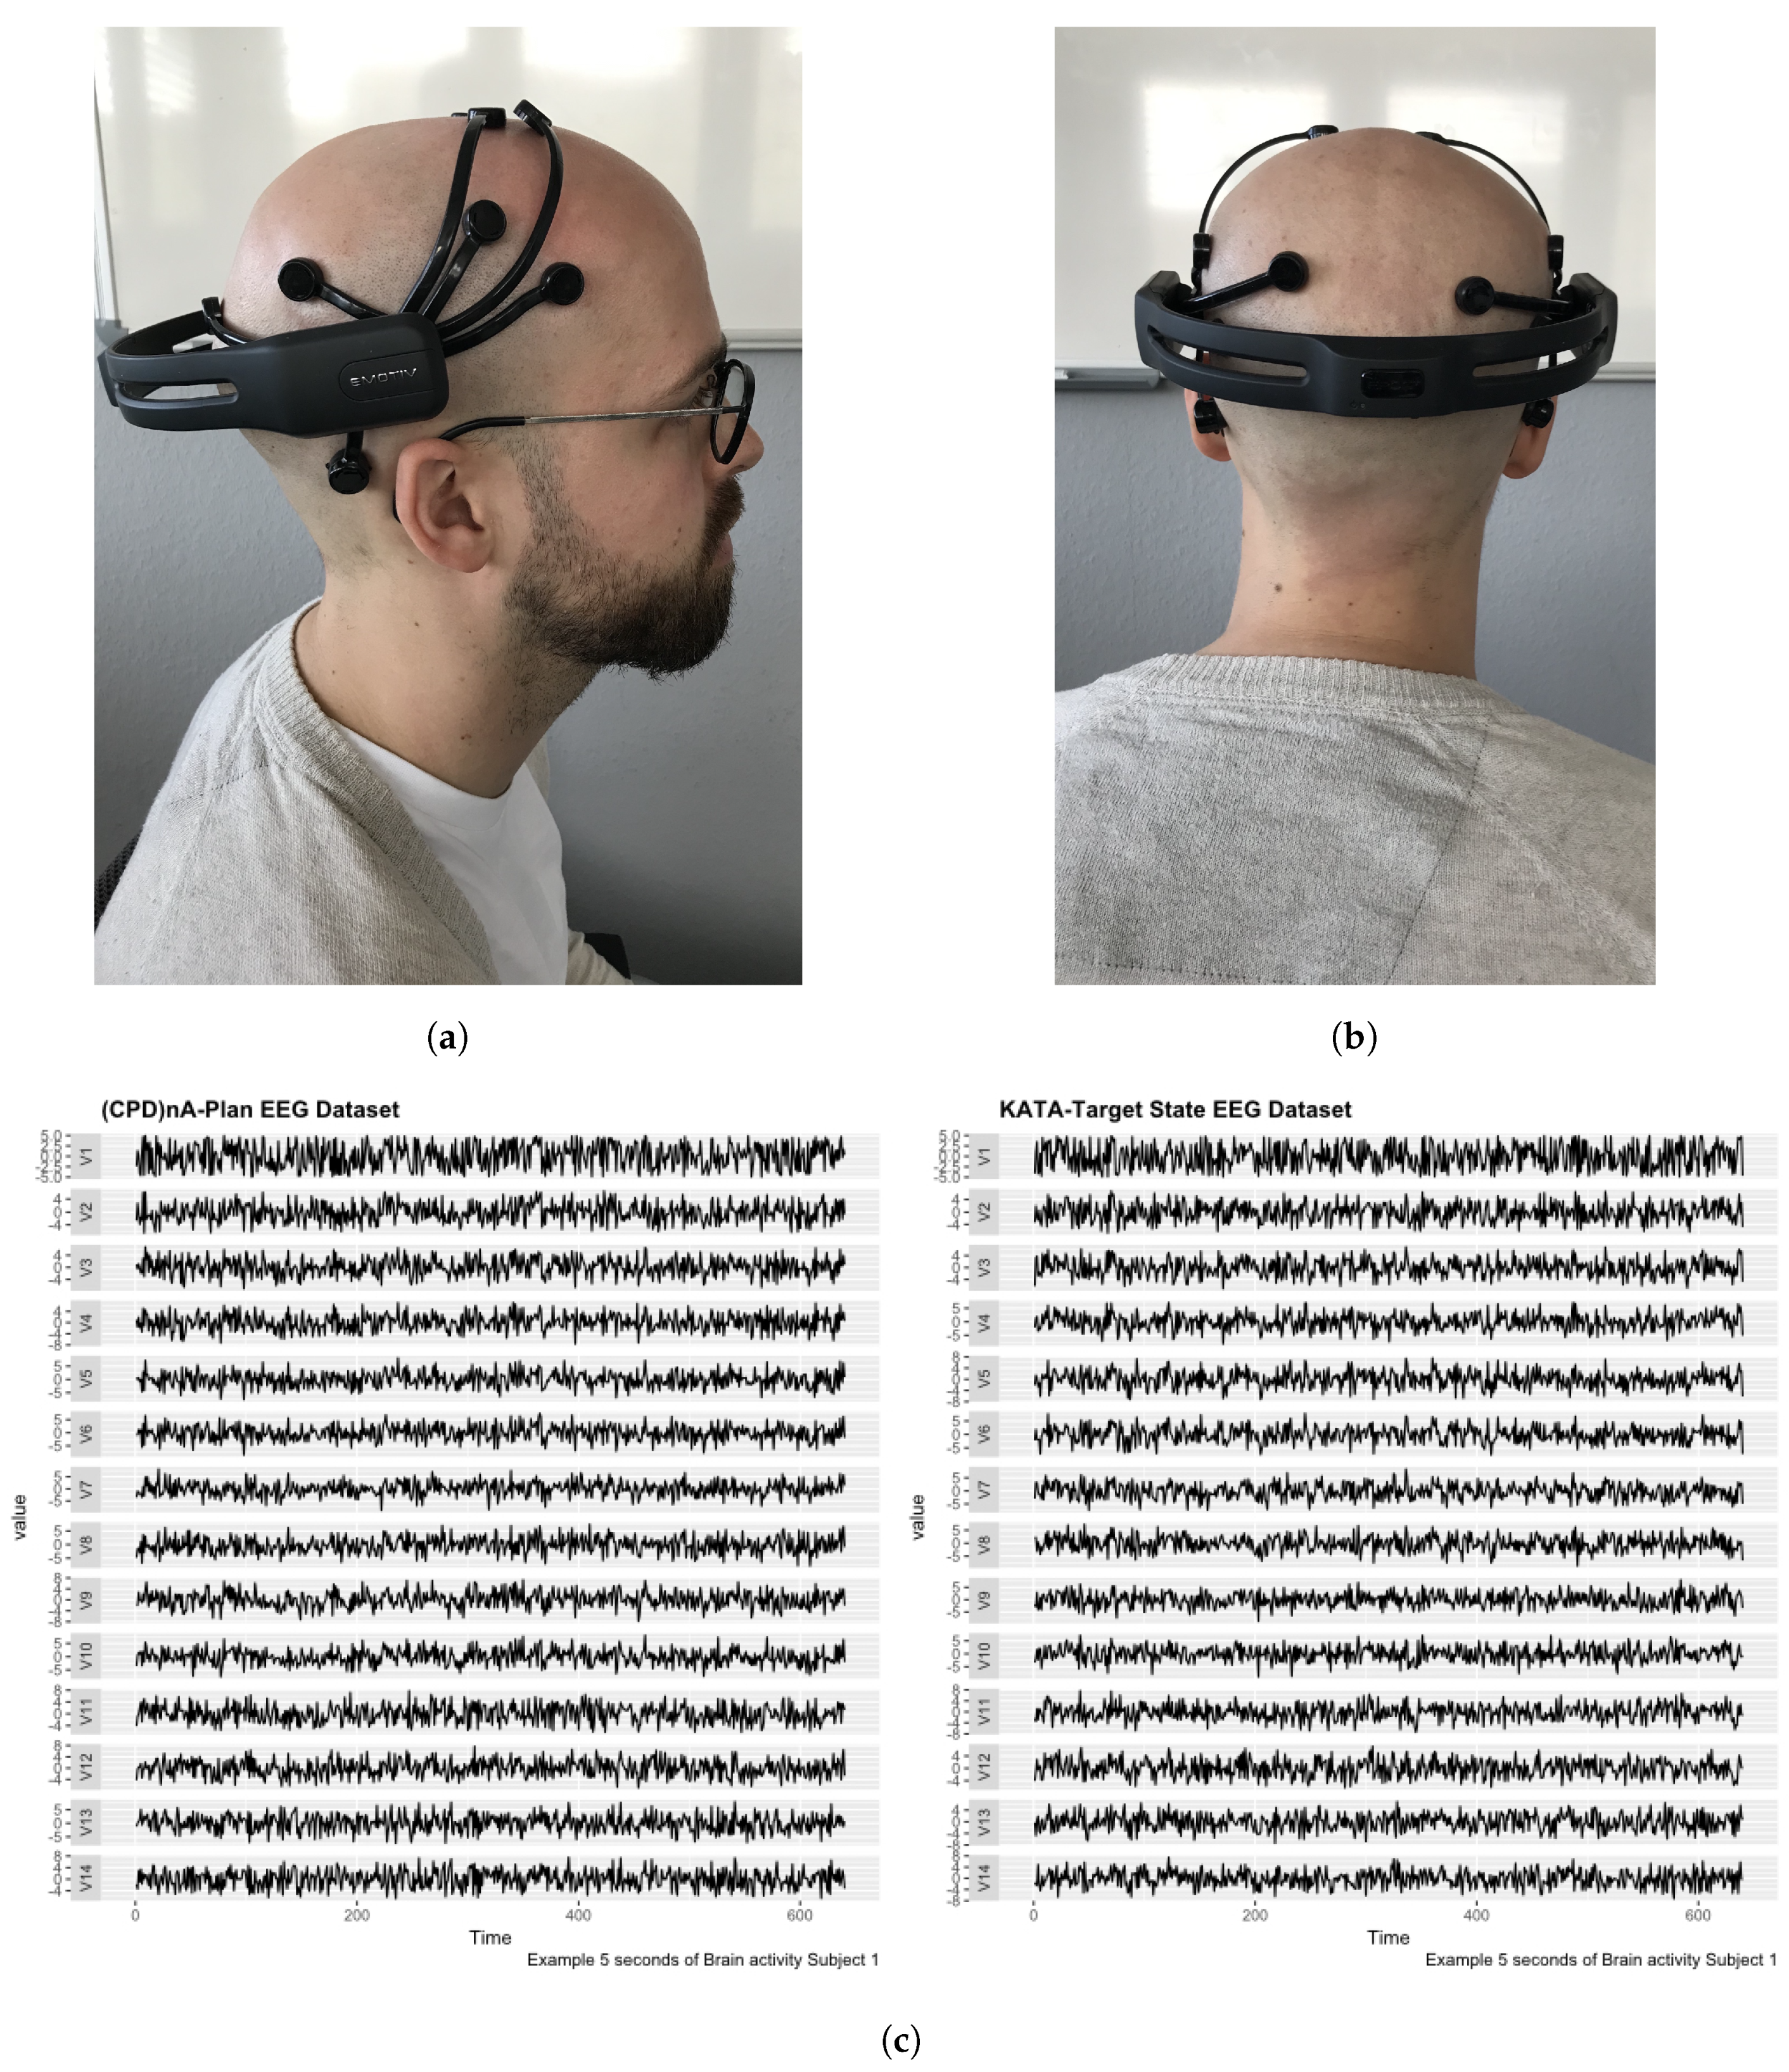
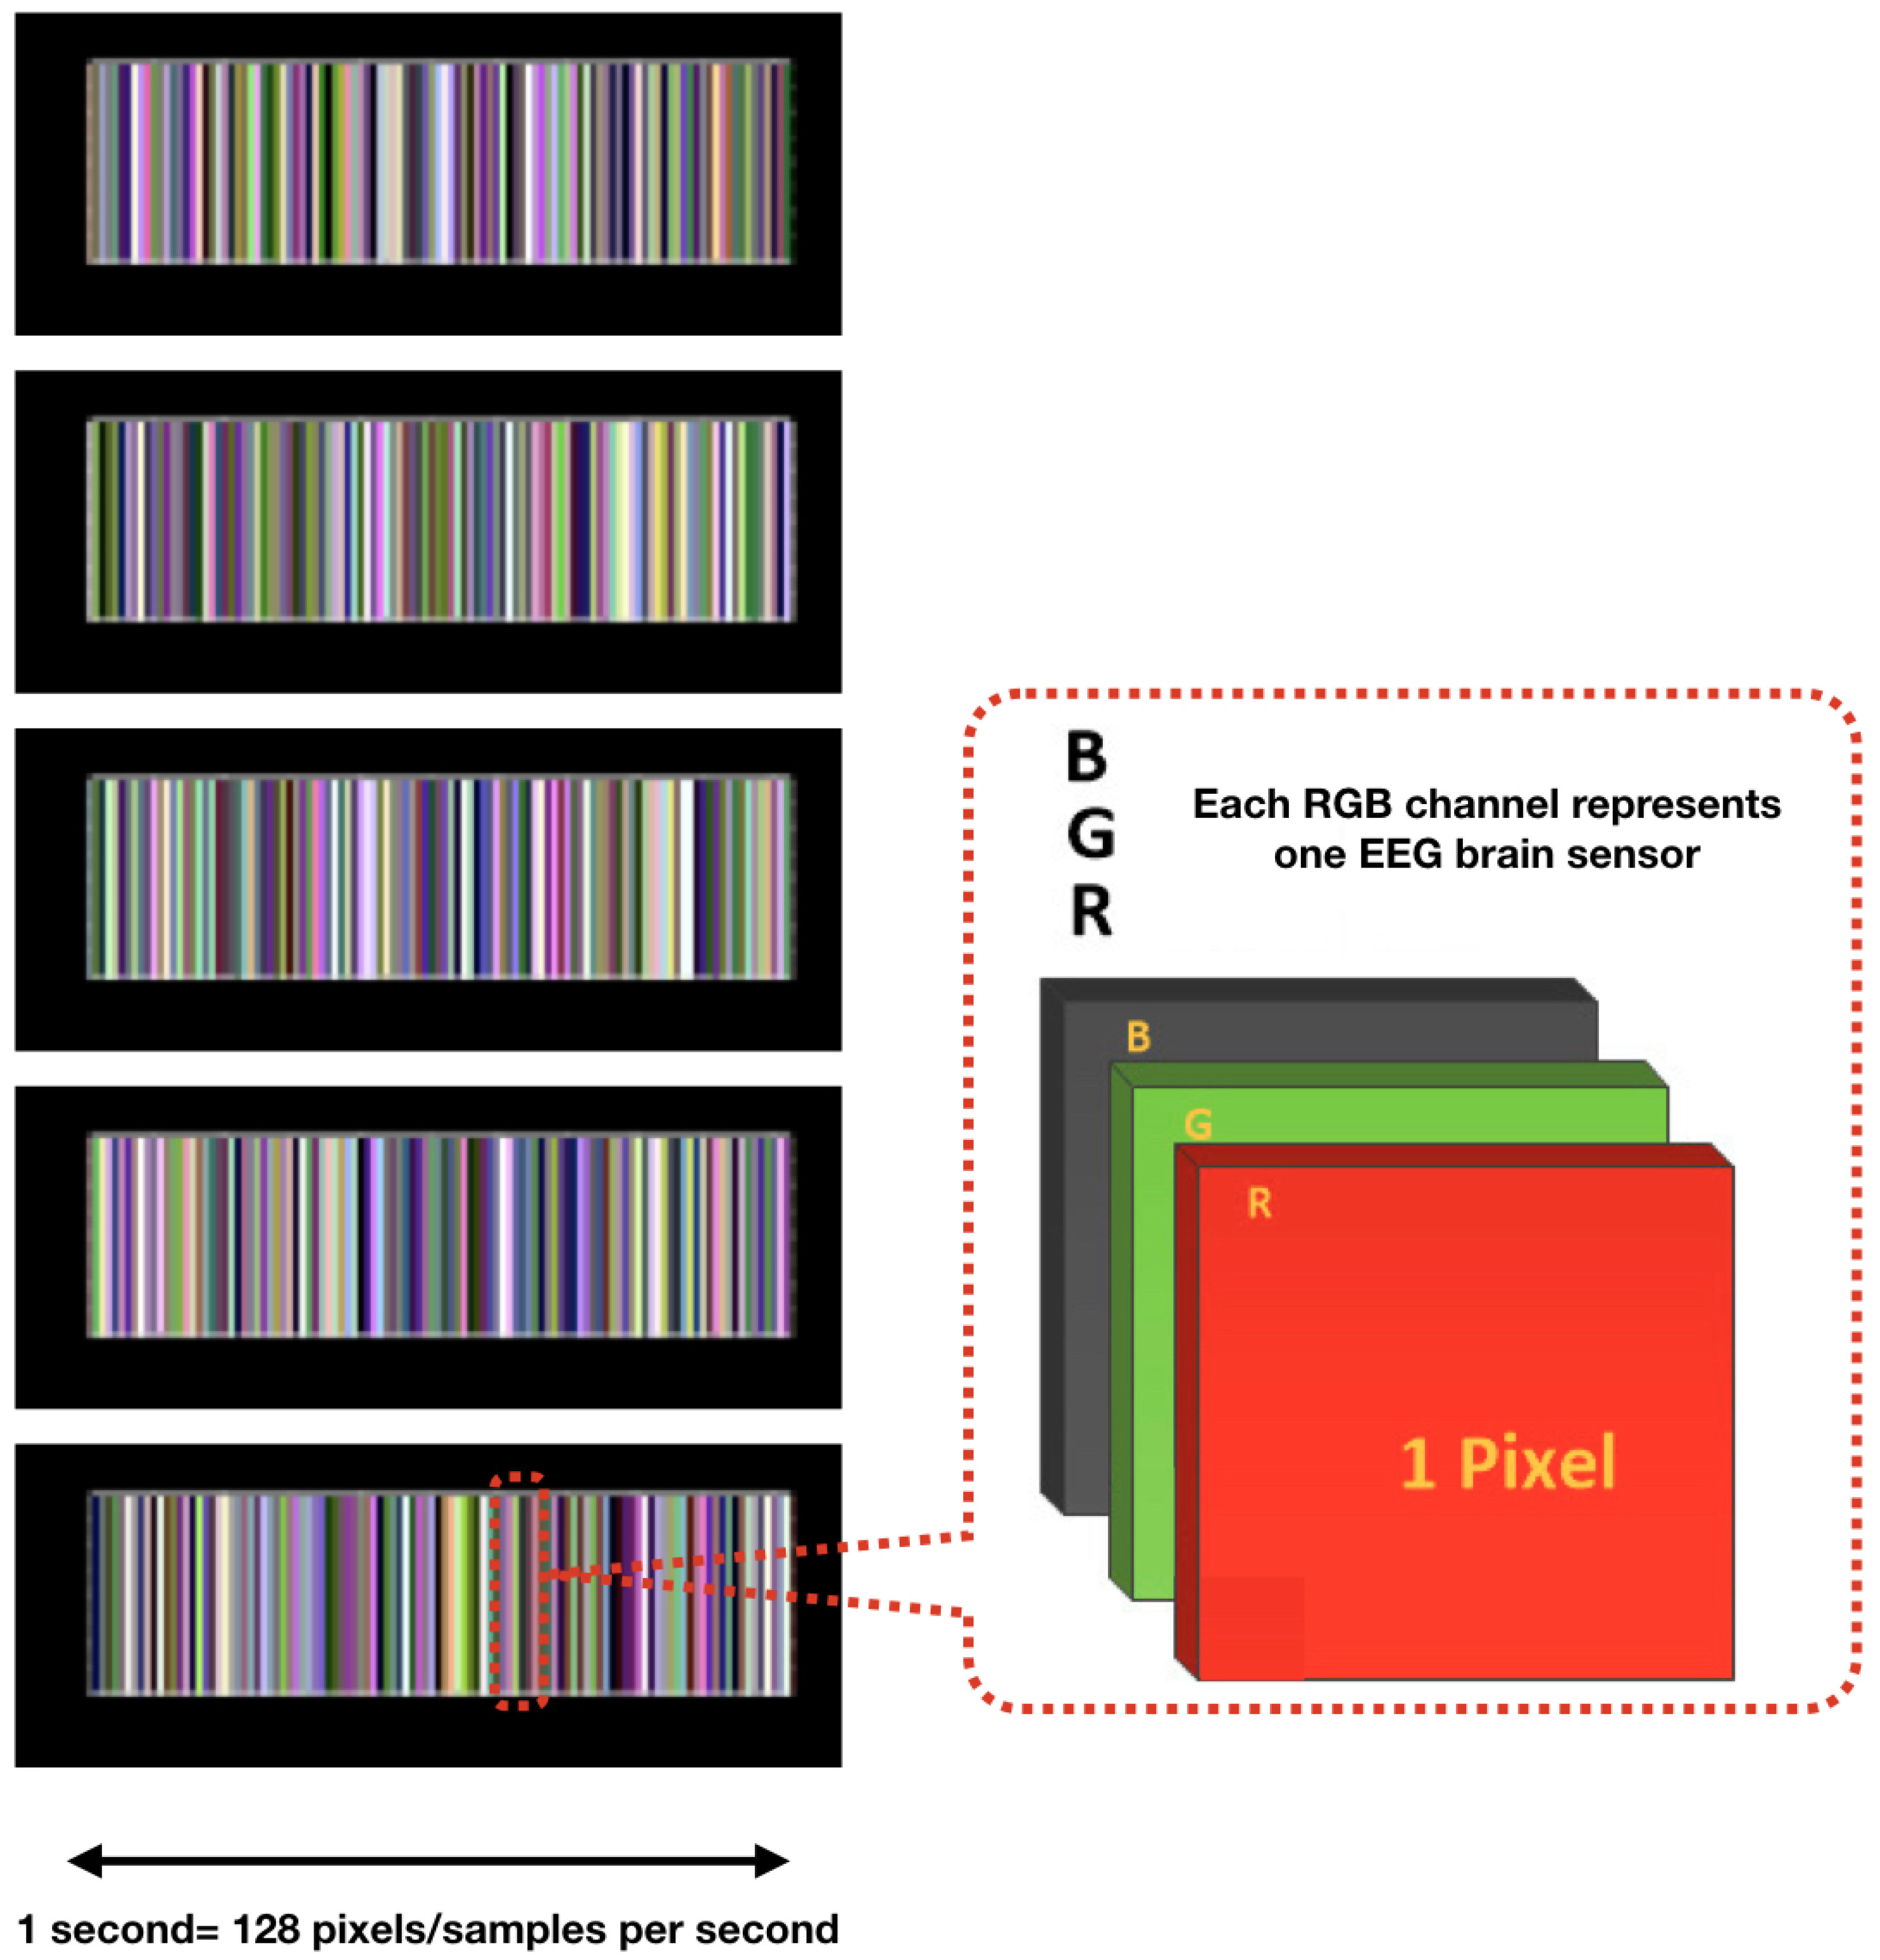
- Multichannel MethodAs described in [100], the multichannel data pre-processing method for DL treats data from three EEG channels as three superimposed color levels corresponding to red, green, and blue elements in the RGB color format. The EEG signal strength is projected to a corresponding color value in the [0.1] range. The three values of each point are represented as one pixel in the image. The resolution of the image is the same as the length of the segment (1 s/128 pixels because the sampling rate is 128 samples per second). The data collected from the different sensors are grouped in rows. The advantage of this method is that it greatly reduces the size of the image and results in a much shorter training time than that of the raw EEG time series analysis, and does not require expert knowledge. Figure 6 shows the principle of the application of this method and an example image. The data fragment used in this figure shows the first five seconds of the one used in Figure 5c.
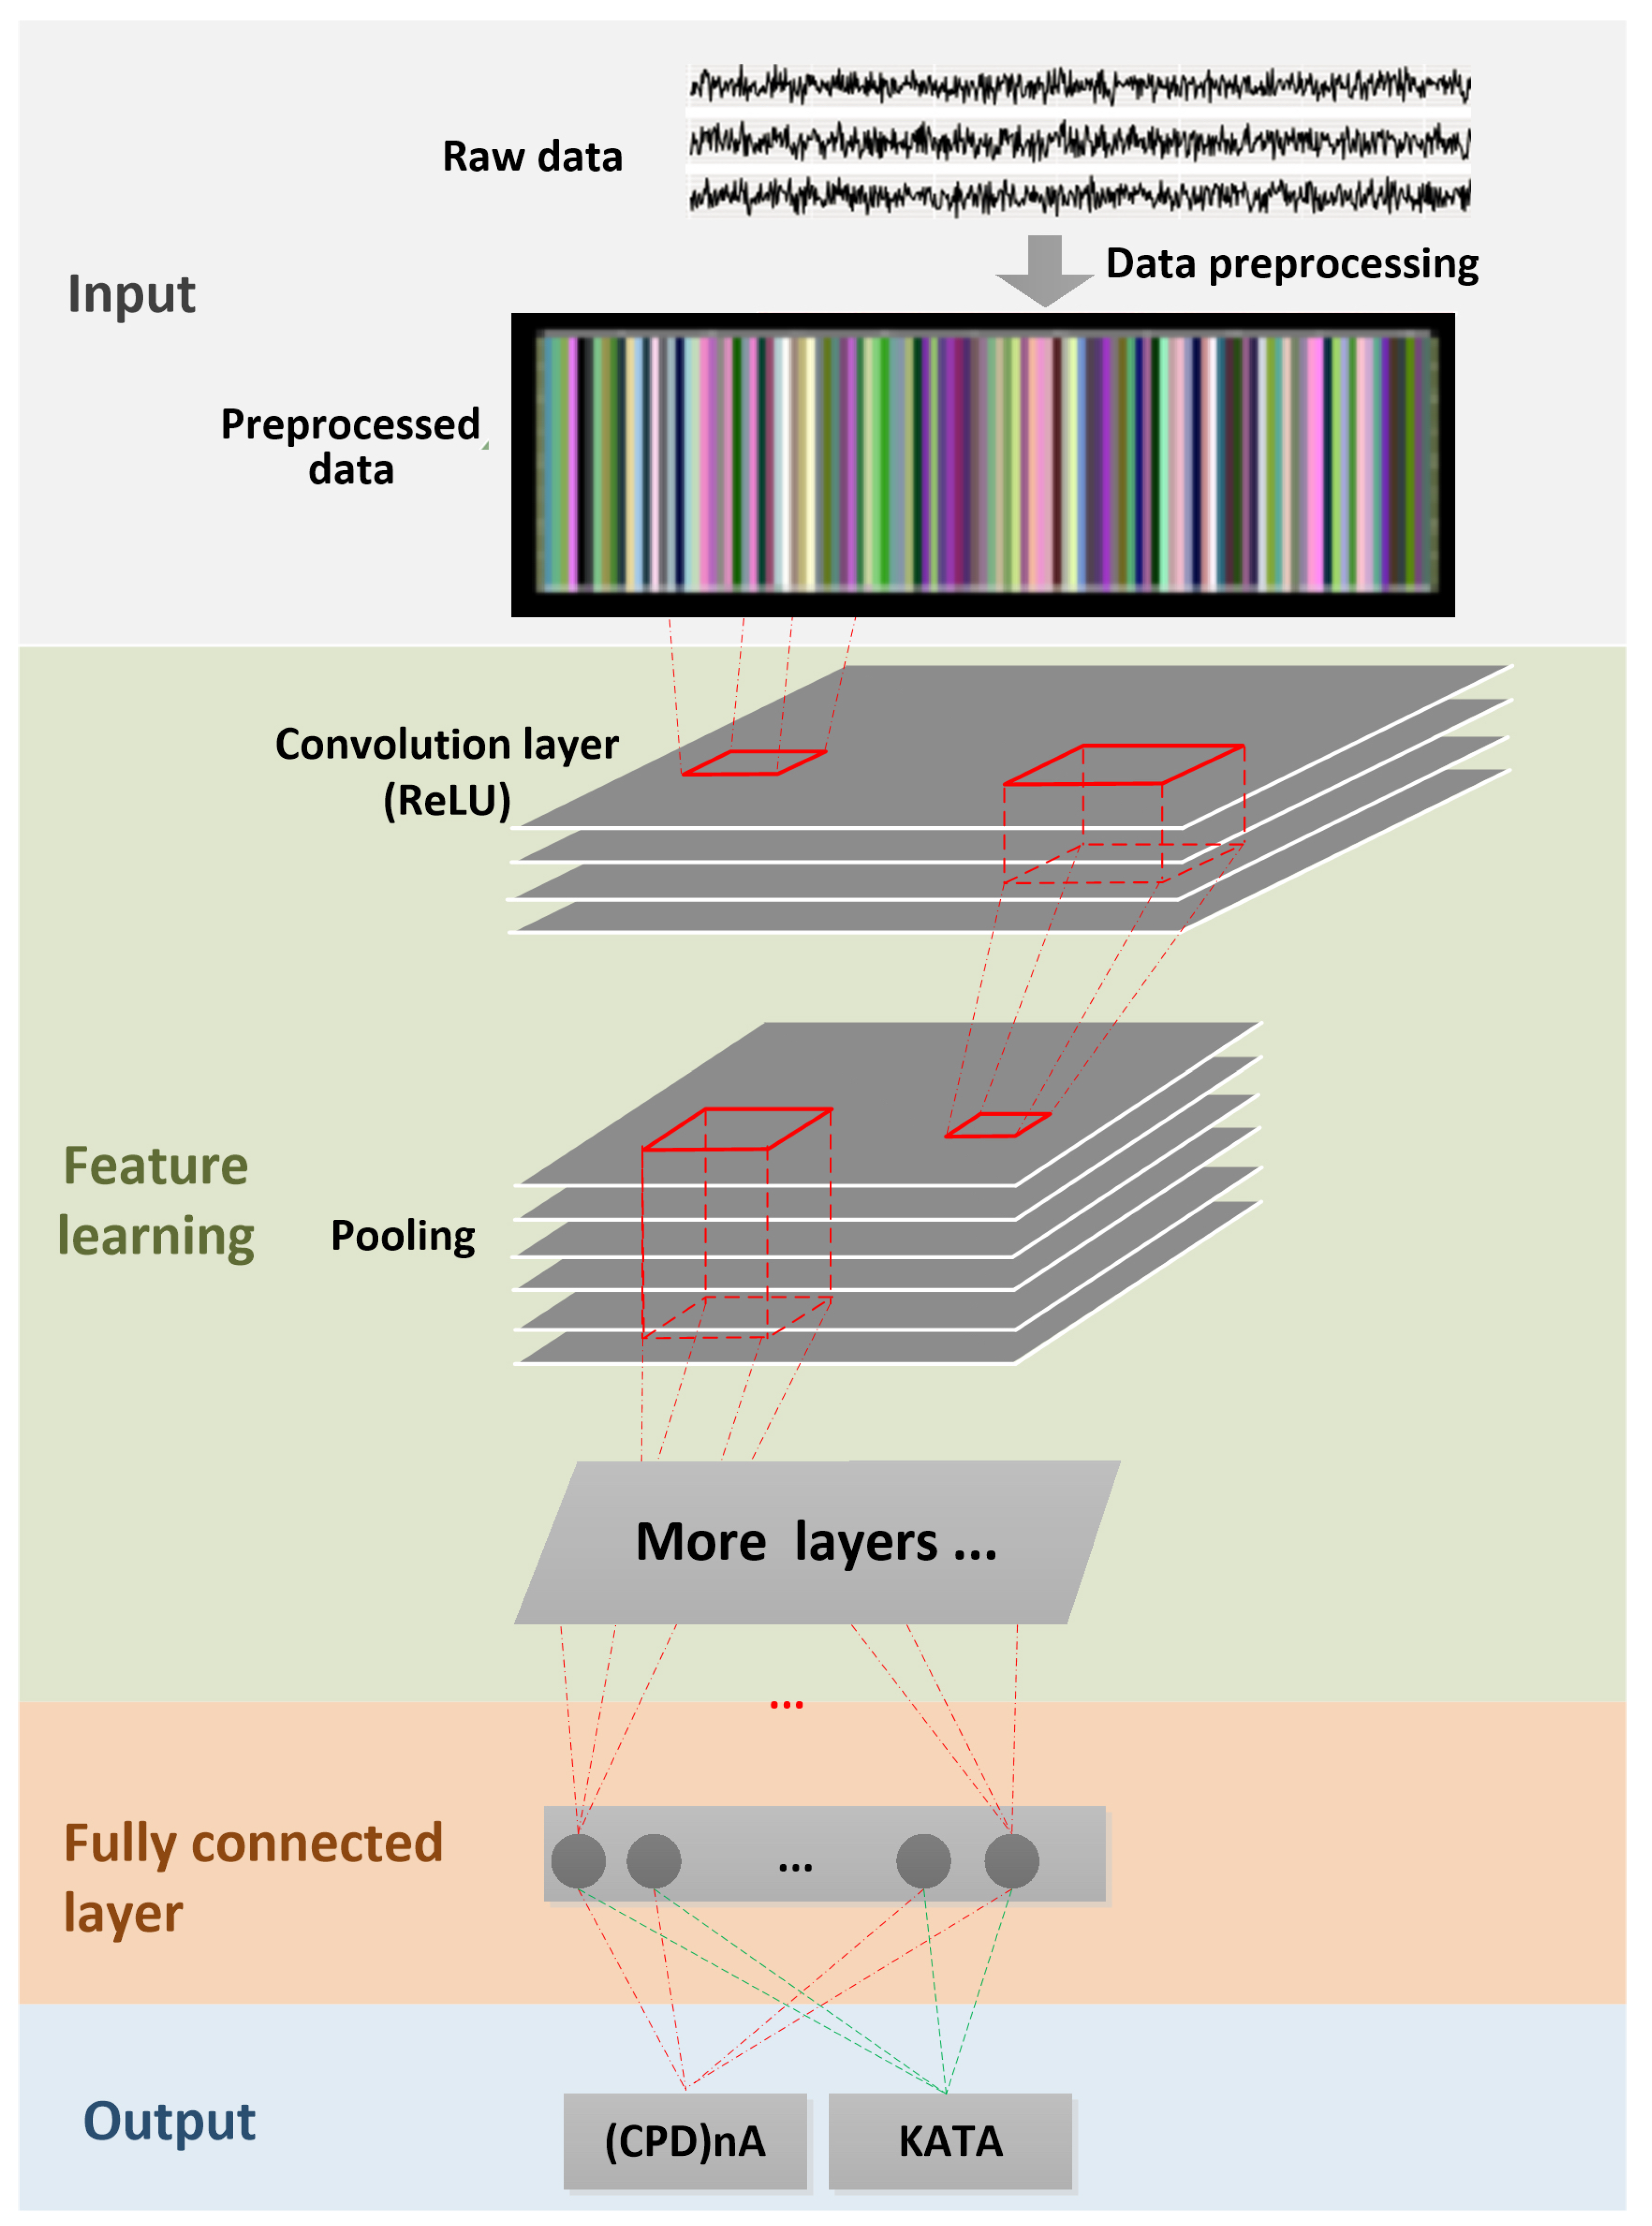
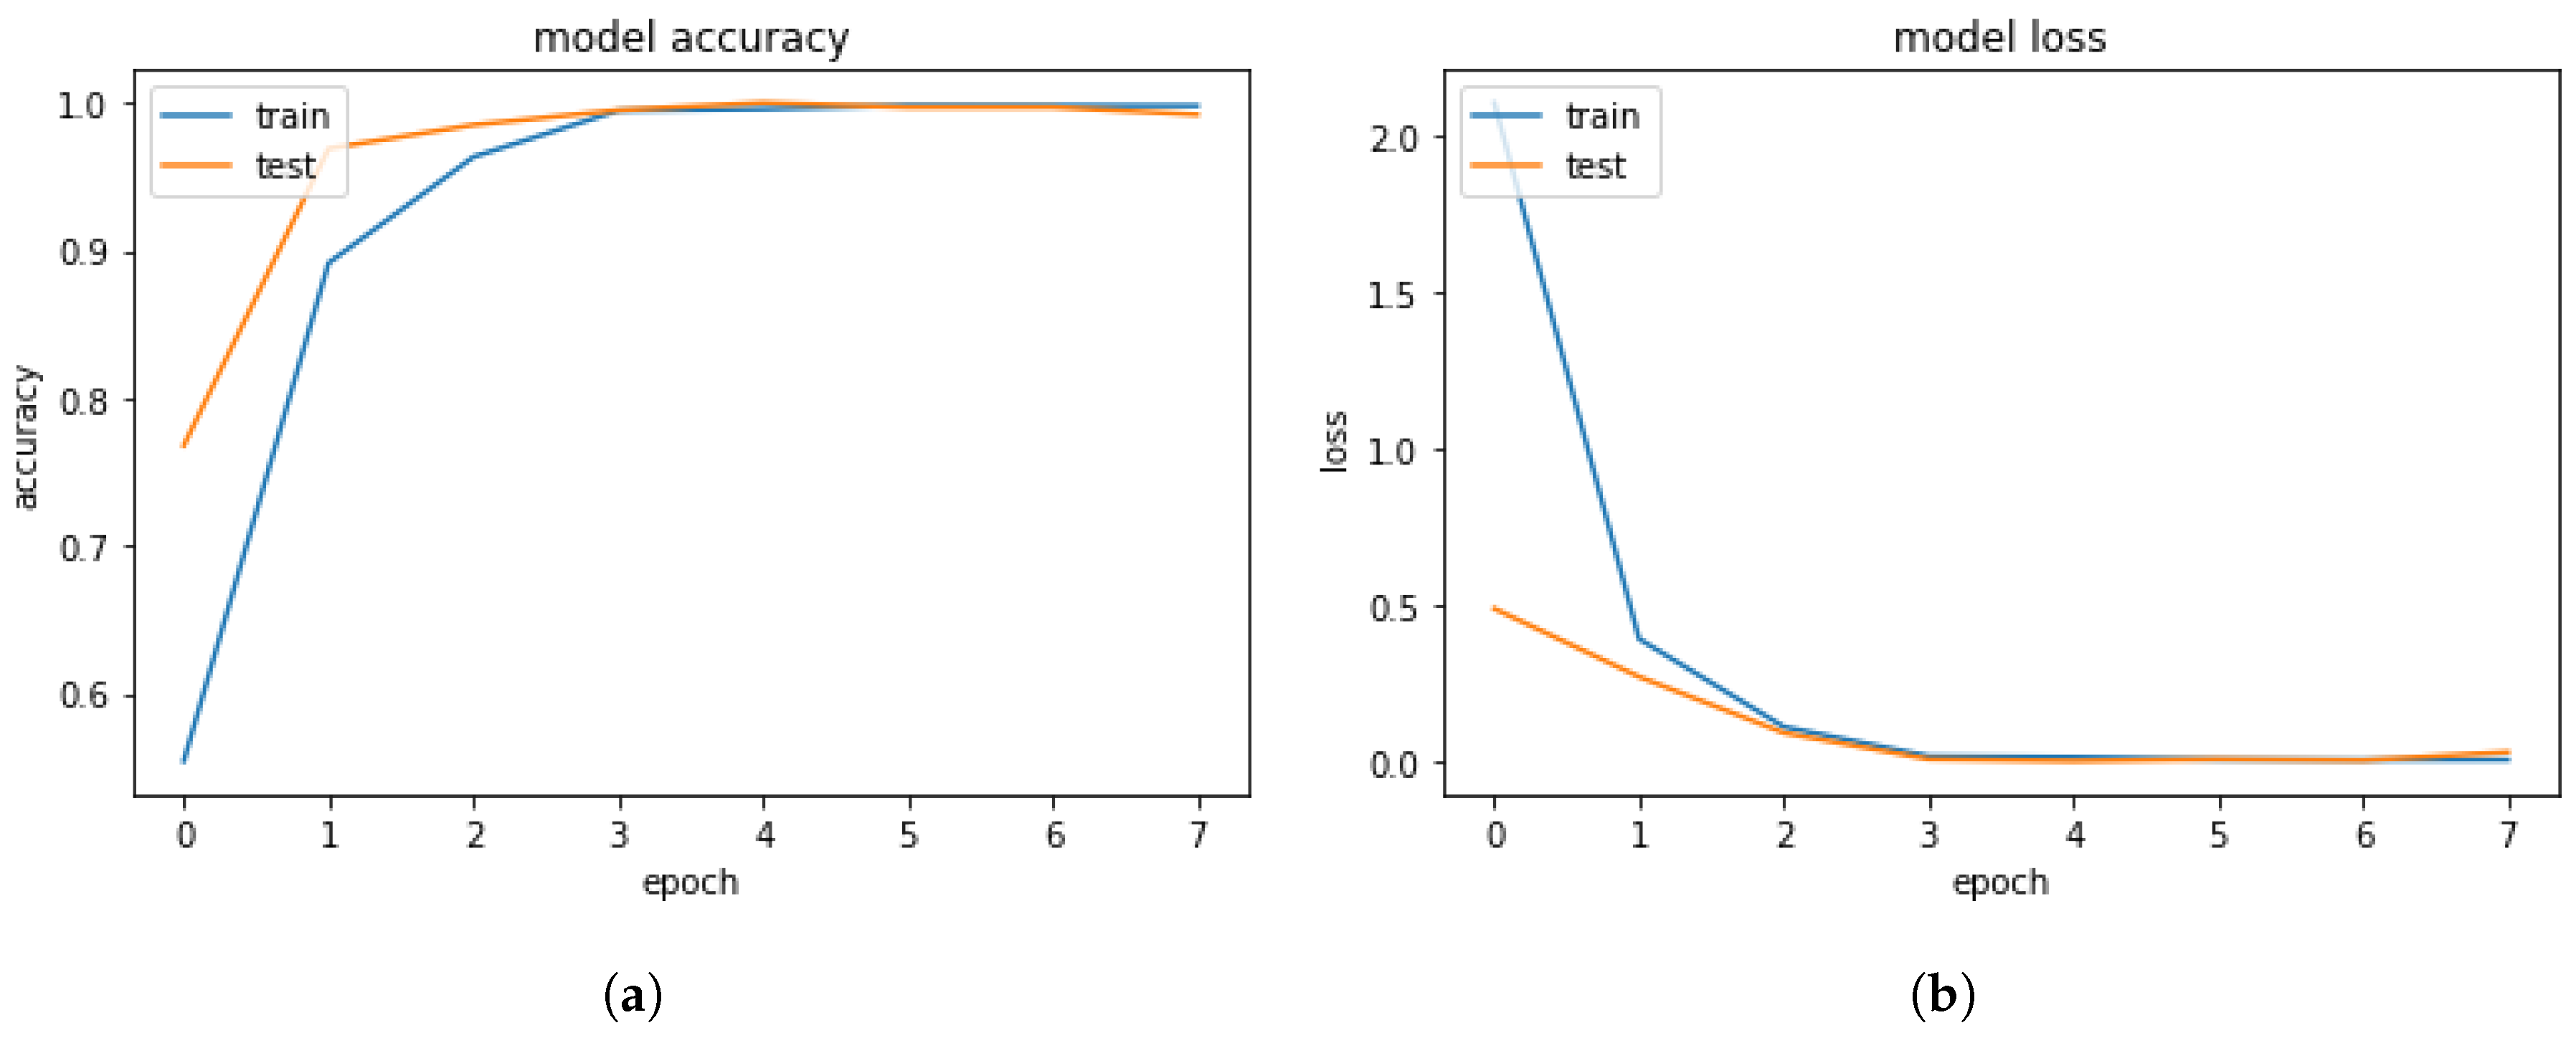
- Deep-Learning Soft Sensor ArchitectureAfter pre-processing and segmentation, the original data segments are transformed into images, to which the DL methods are applied. In this study, the deep convolutional neural network algorithm is used [111]. This model has its own parameters, such as the number of convolutional layers, the learning rate, pooling size, etc. Figure 7 shows the DL soft sensor architecture and workflow. The first layer to extract features from an input image is the convolution layer. It preserves the relationship between pixels by learning image features using small squares of input data. The Rectified Linear Unit (ReLU) method is used for the non-linear operation to introduce non-linearity in the DL model. Following the convolution layer is the pooling layer which can reduce the dimensionality size. The max pooling method is used in our model, which takes the largest element from the rectified feature map. Multiple convolution layers and pooling layer can be added to the DL model to obtain the best performance. Finally, the feature map matrix produced by the convolution and pooling layers is flattened and fed into the fully connected layer to output the classes using the SoftMax activation function. Following the approach in [110], in order to classify between the LM behavioral patterns, the shallow features are merged with the deep-learned features on the last fully connected layer, as shown in Figure 7. More details of the DL models are available online at Open Access Repository.
4. Results and Discussion
4.1. Results and Discussion of Cross-Correlation Function
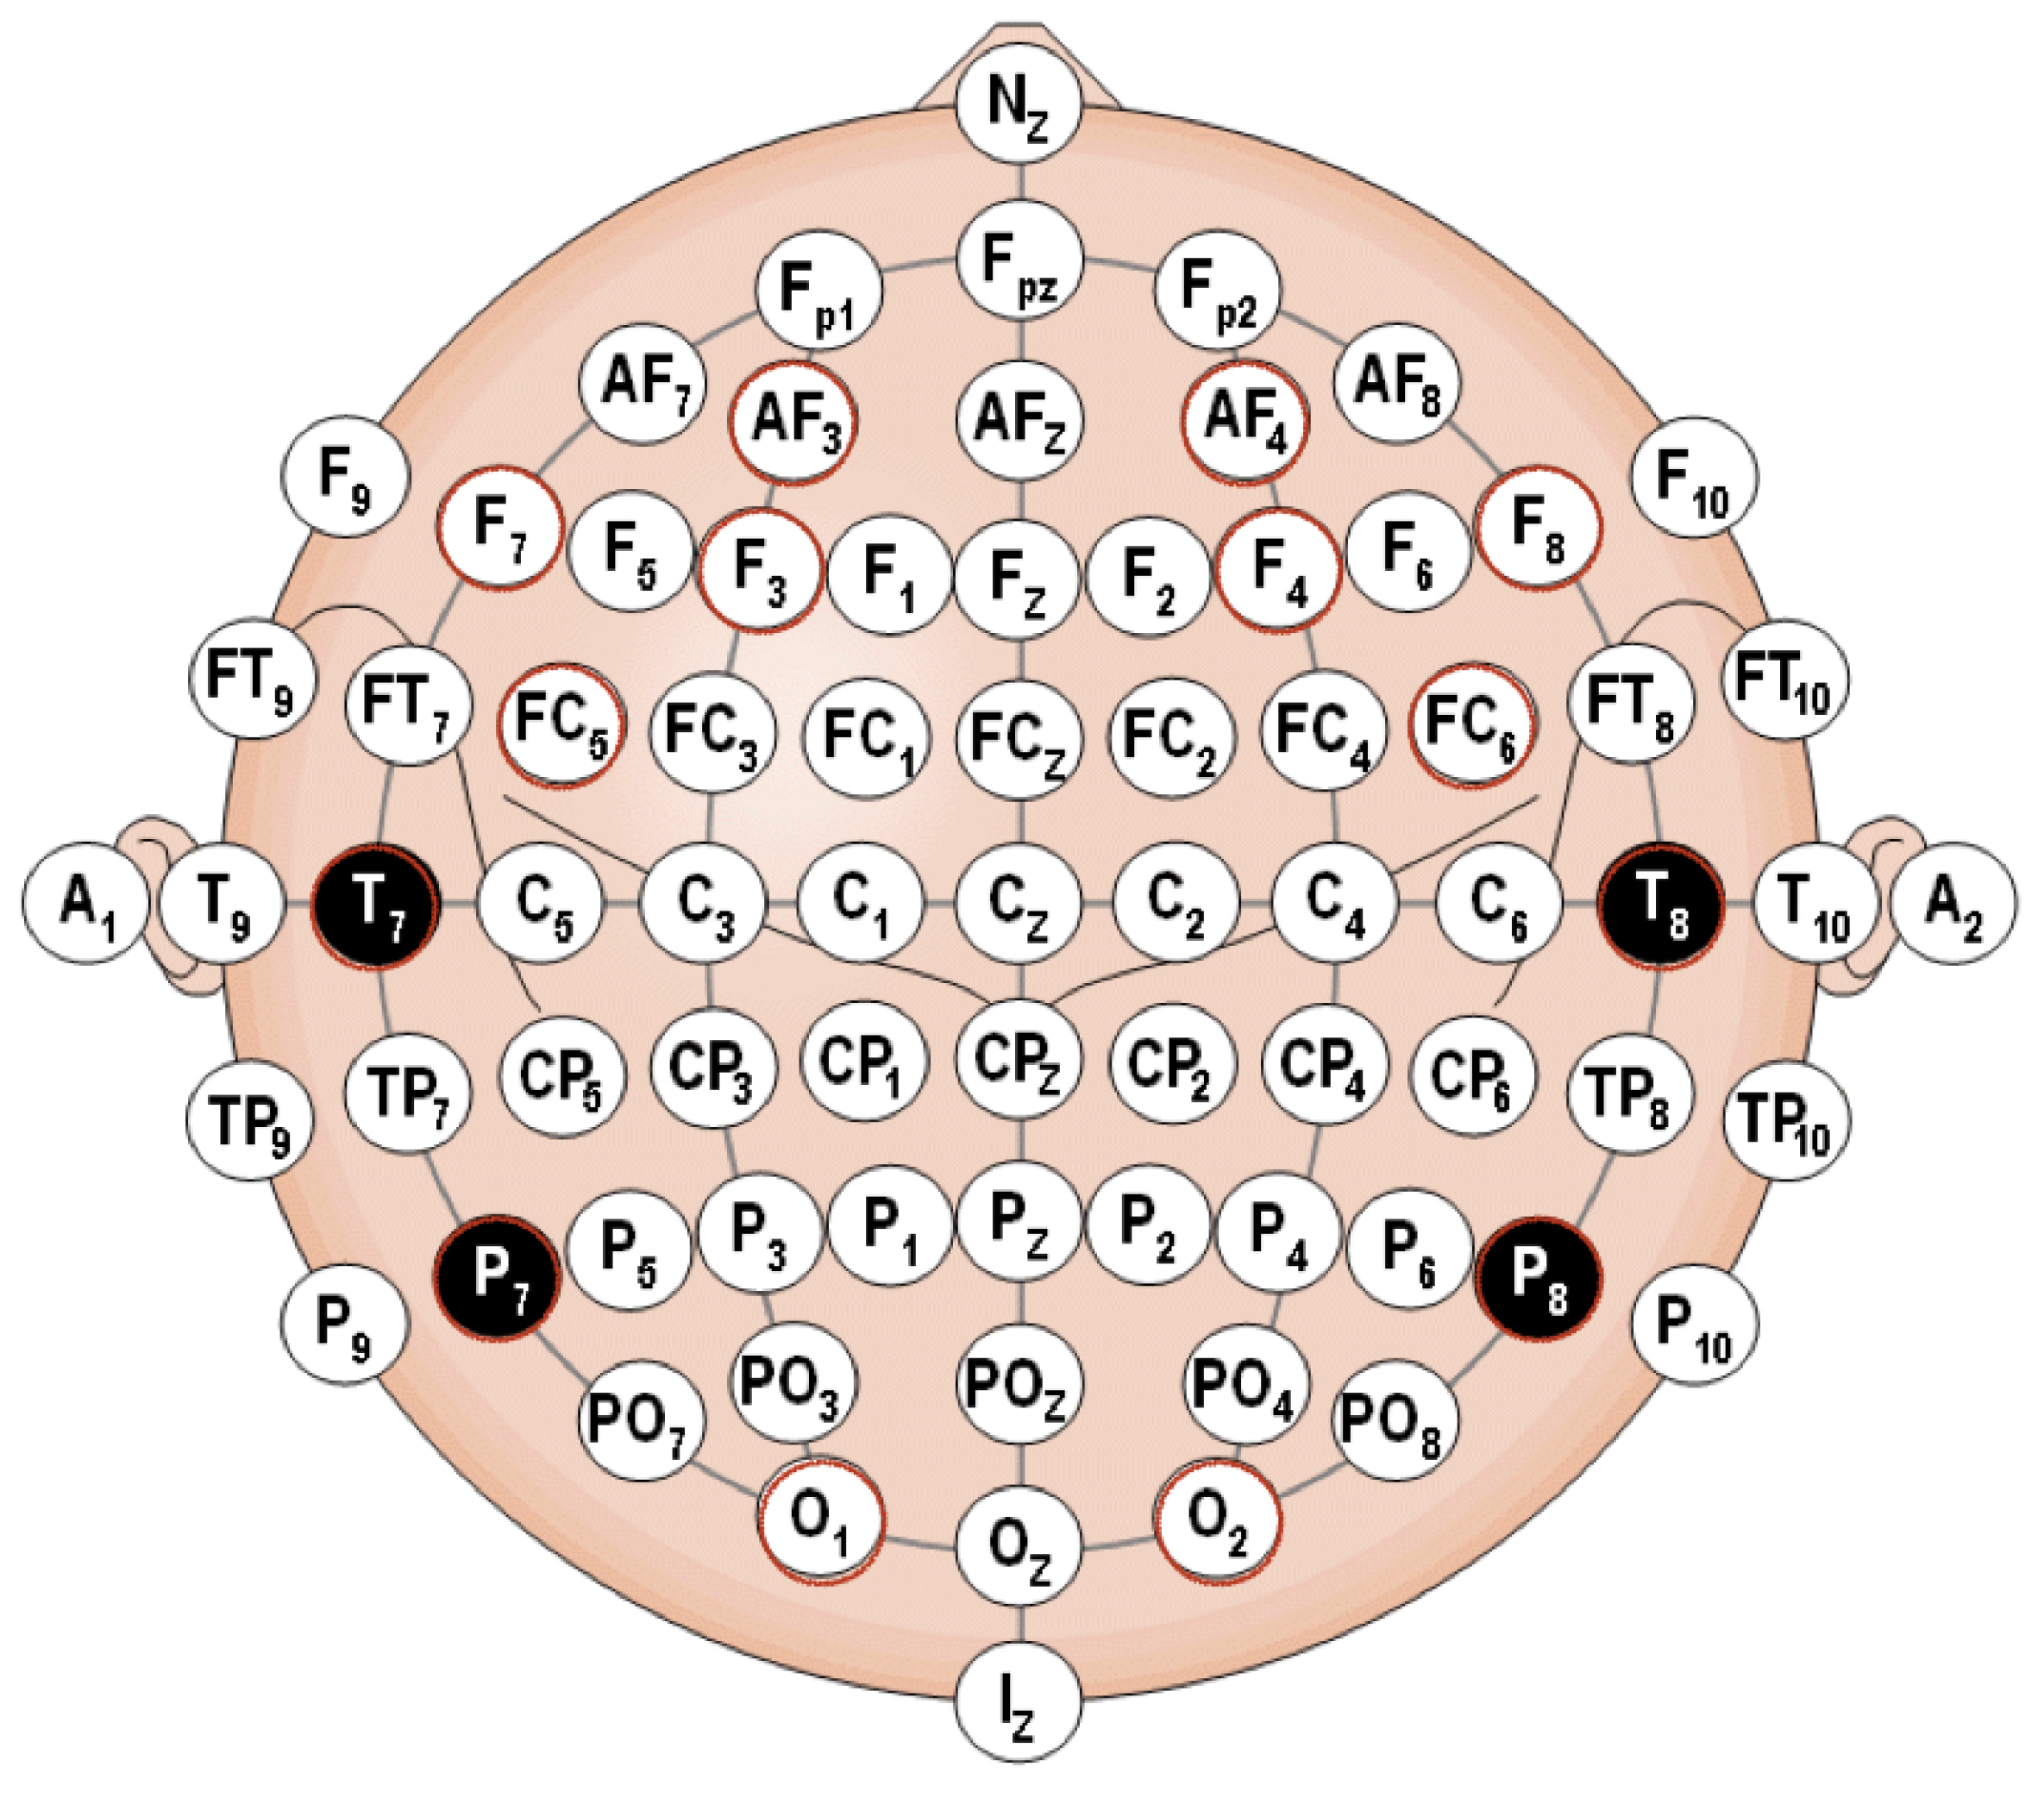
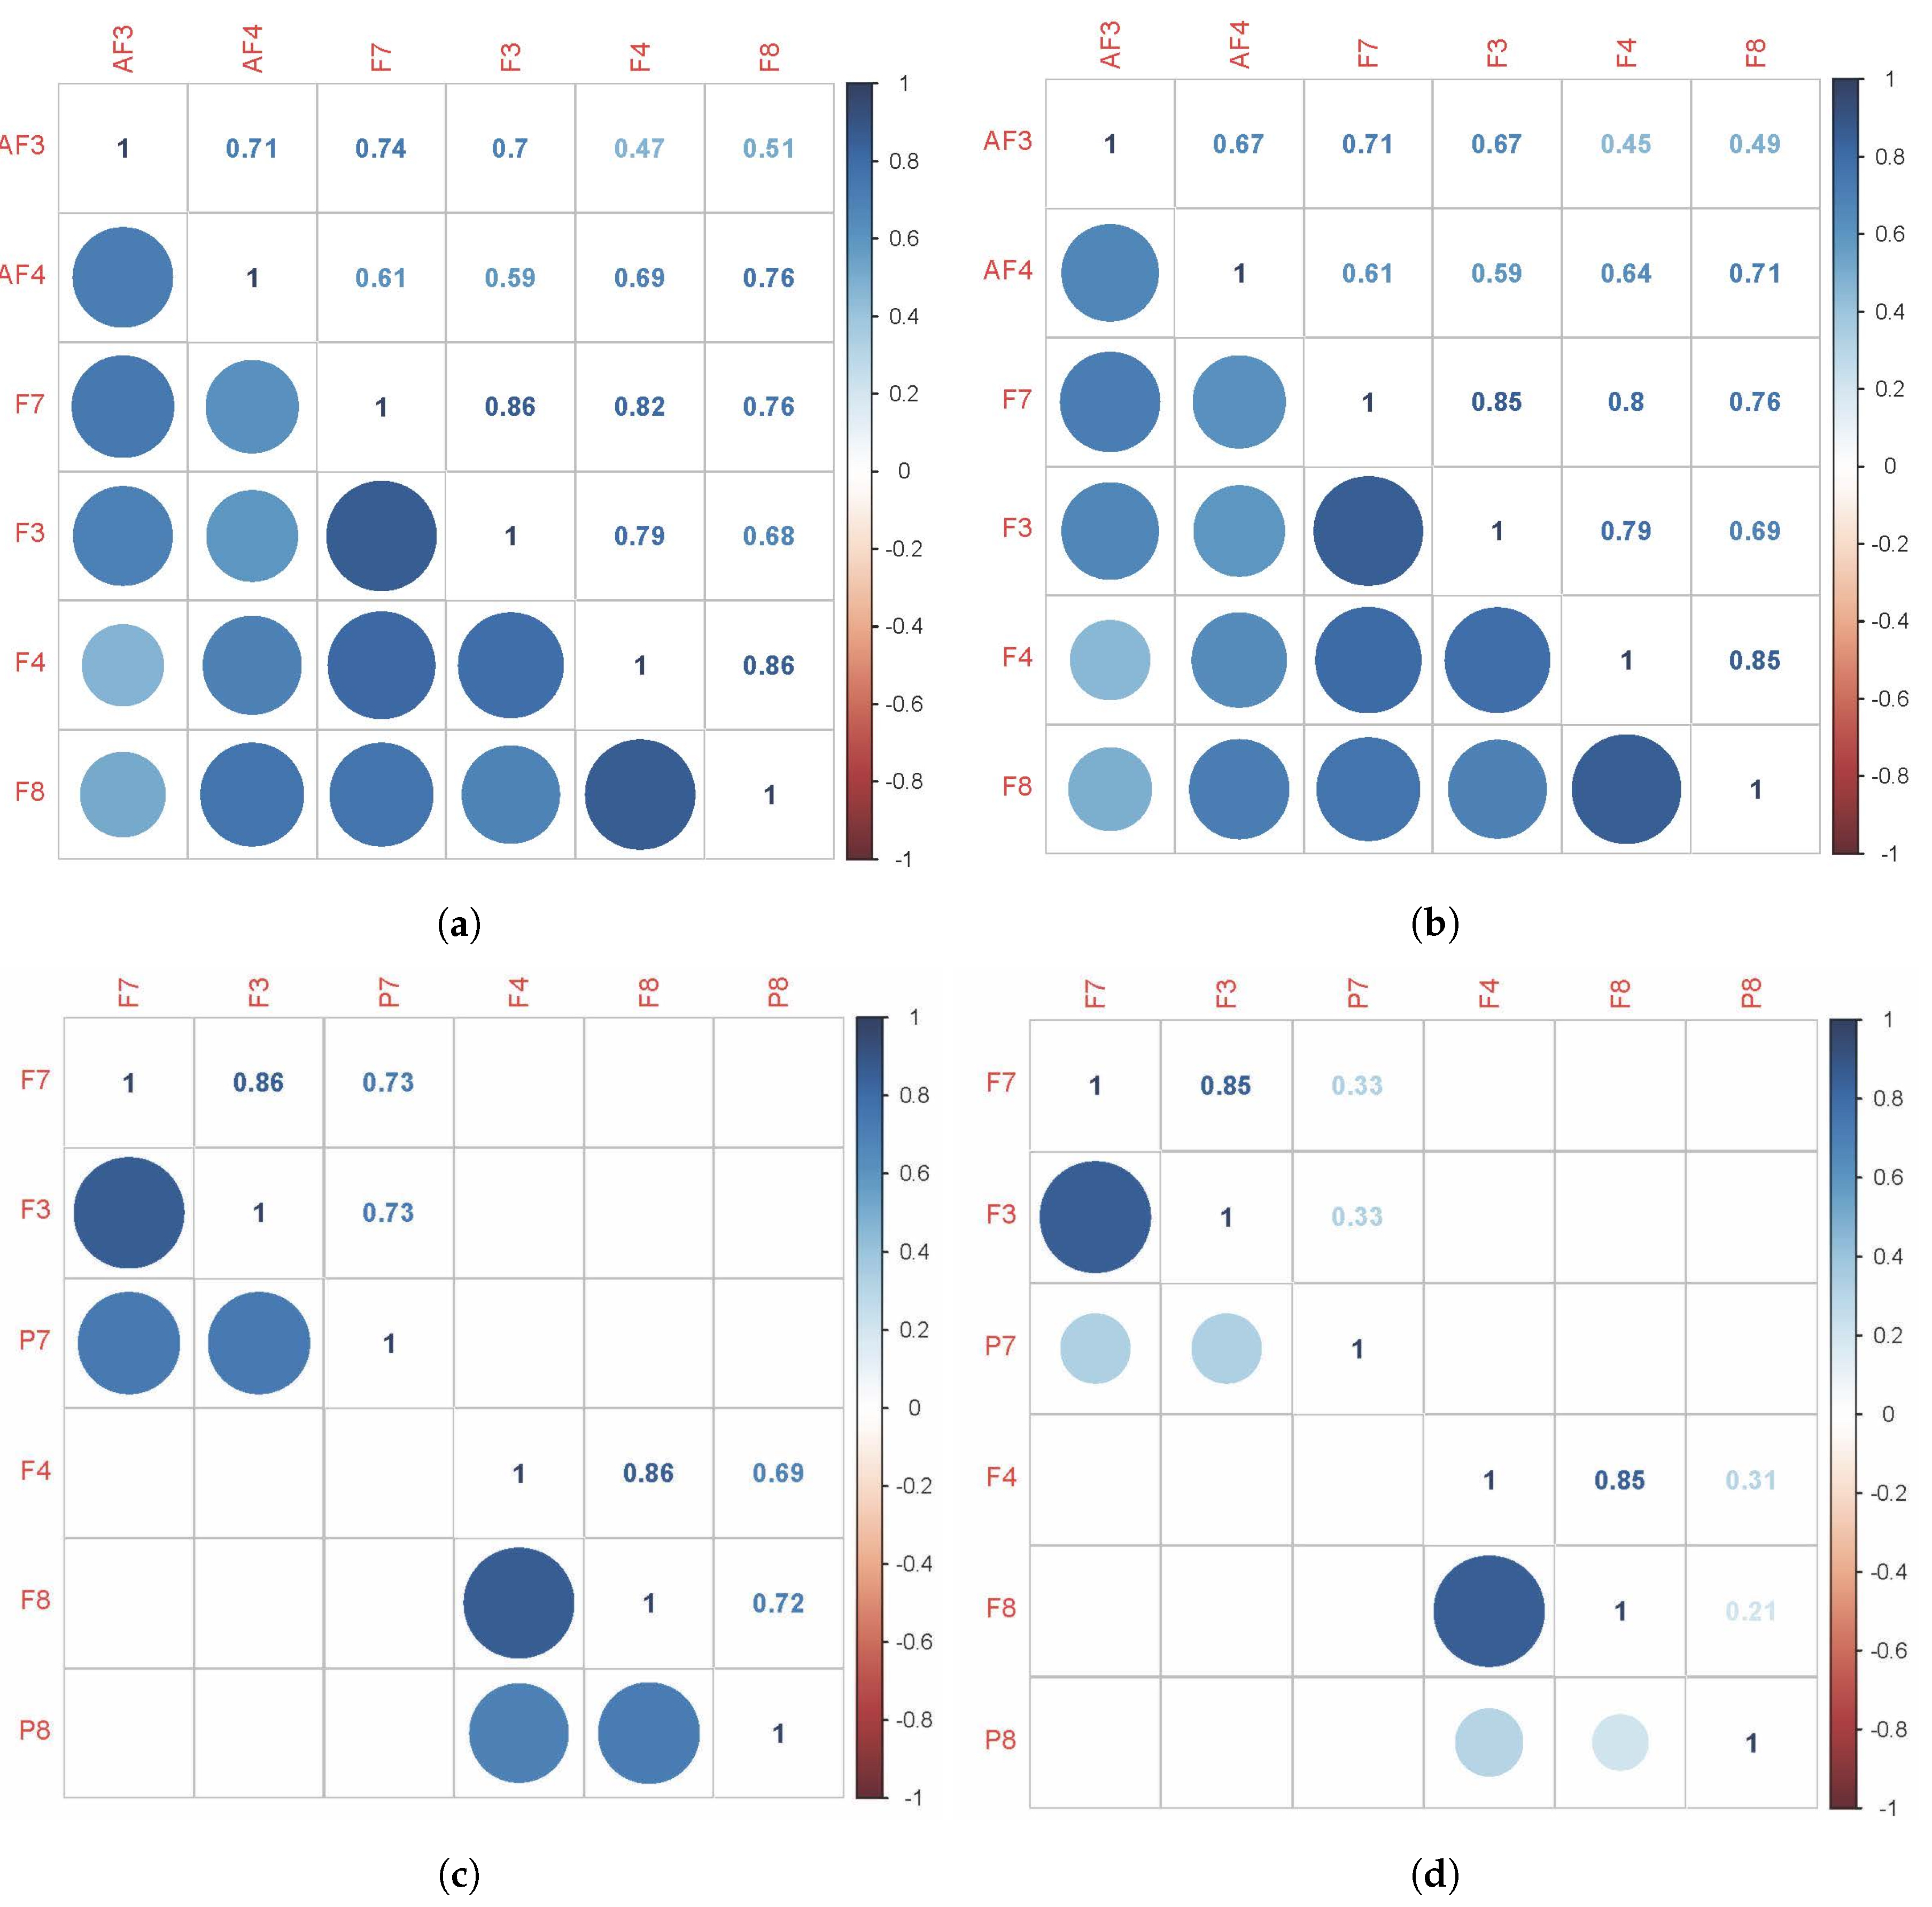
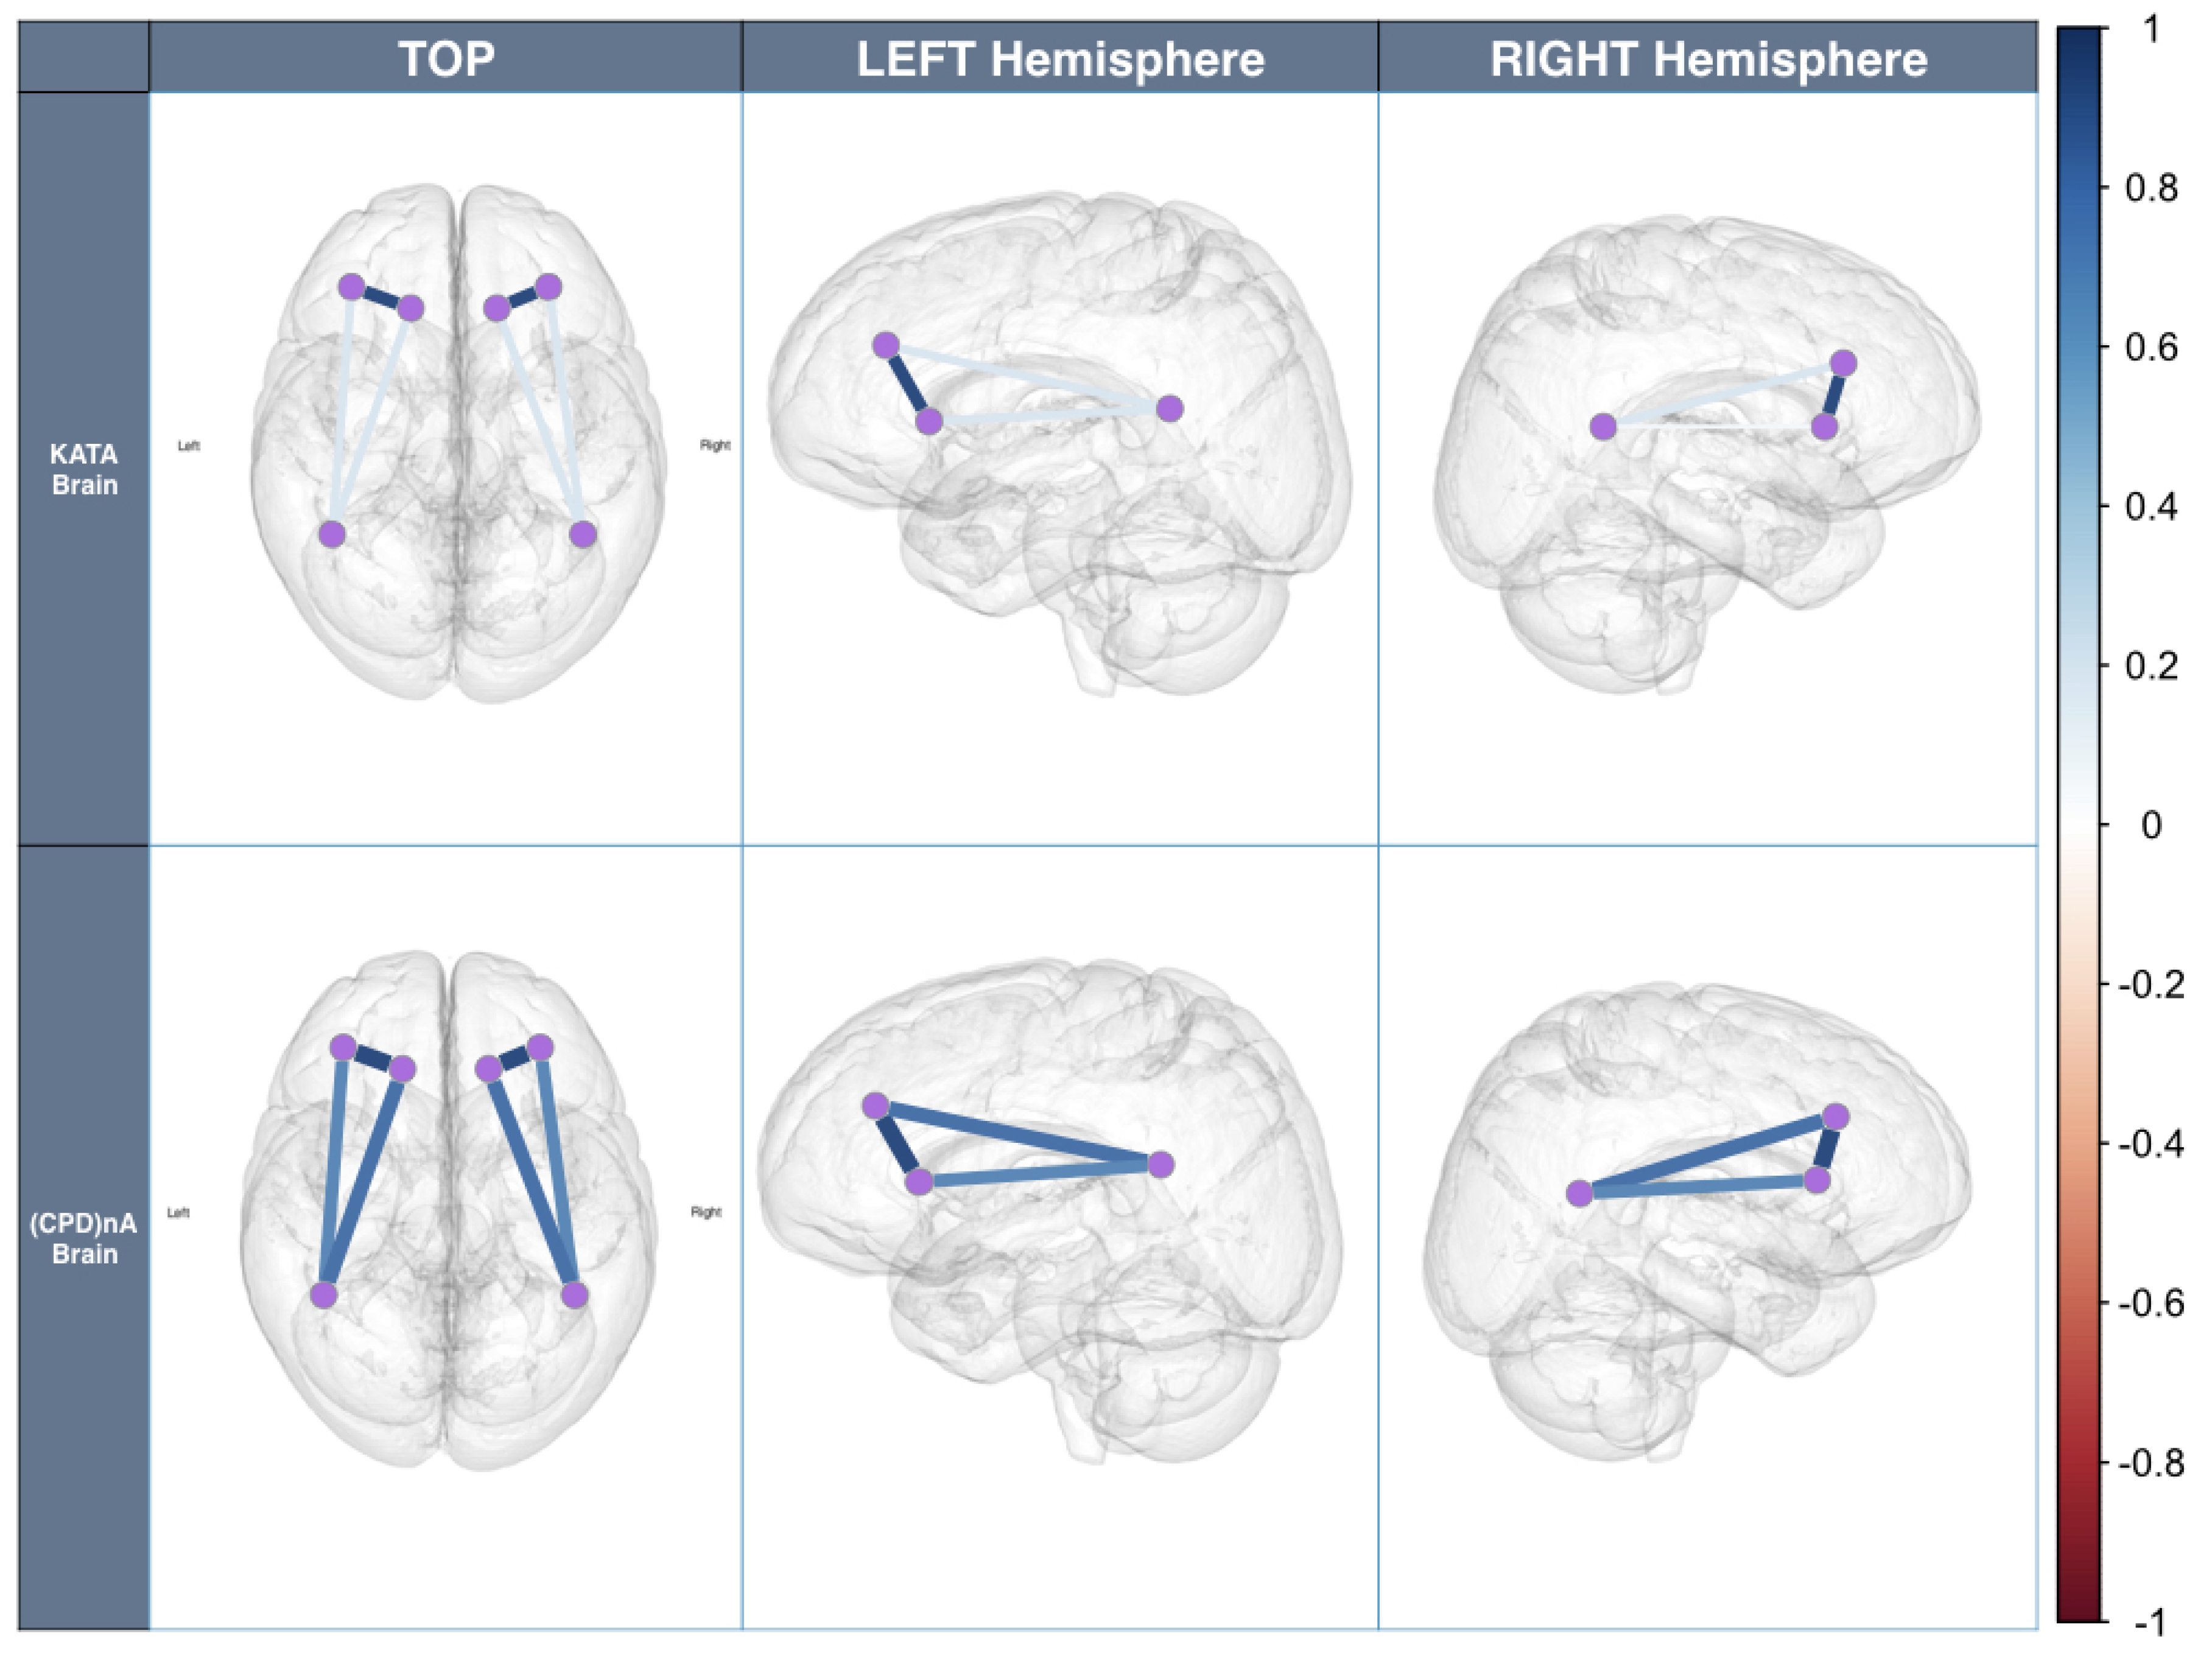
- Corresponding to H1All sensors AF3-F7-F3-AF4-F4-F8 are expected to correlate with each other, although the strength of correlations may differ, which means that the task is executive.Figure 8a,b shows the cross-correlation among sensors AF3-F7-F3-AF4-F4-F8 of Subject 1. These results show that for the same subject, all sensors AF3-F7-F3-AF4-F4-F8 presented a correlation that exceeds 0.45. This supports H1 which stated that subjects engaging in LM problem-solving behavioral patterns present a strong correlation in their PFC activity.
- Corresponding to H2Sensors F7 and F3, as well as sensors F4 and F8, are expected to present stronger correlation, which means that the task is goal driven.Figure 8c,d shows that the correlations between sensors F7 and F3, as well as sensors F4 and F8, are stronger than others, which exceed 0.85. This supports H2 which stated that subjects engaging in LM problem-solving behavioral patterns present a coordinated a dorsolateral- and ventromedial PFC activity.
- Corresponding to H3Sensors F7 and P7, as well as sensors F8 and P8, are expected to present no correlation or a very weak correlation.The results show that for KATA, the correlations between sensor P7 to sensors F7 and F3 (0.21–0.33), and sensor P8 to sensors F4 and F8 between 0.21 and 0.34, are much weaker than (CPD)nA. This supports H3 which stated that goal-oriented, context-independent LM problem-solving behavioral patterns would present a low correlation between the dorsolateral PFC and the TPJ.
- Corresponding to H4Sensors F7 and P7, as well as sensors F8 and P8, are expected to present a strong correlation.The result shows that for (CPD)nA, sensor P7 is correlated with sensors F7 and F3 between 0.69 and 0.73, sensor P8 is correlated with sensors F4 and F8 between 0.68 and 0.73. This supports H4 which stated that goal-directed, context-dependent LM problem-solving behavioral patterns would present a high correlation between the dorsolateral PFC and the TPJ.
4.2. Results and Discussion of Deep-Learning Soft Sensor
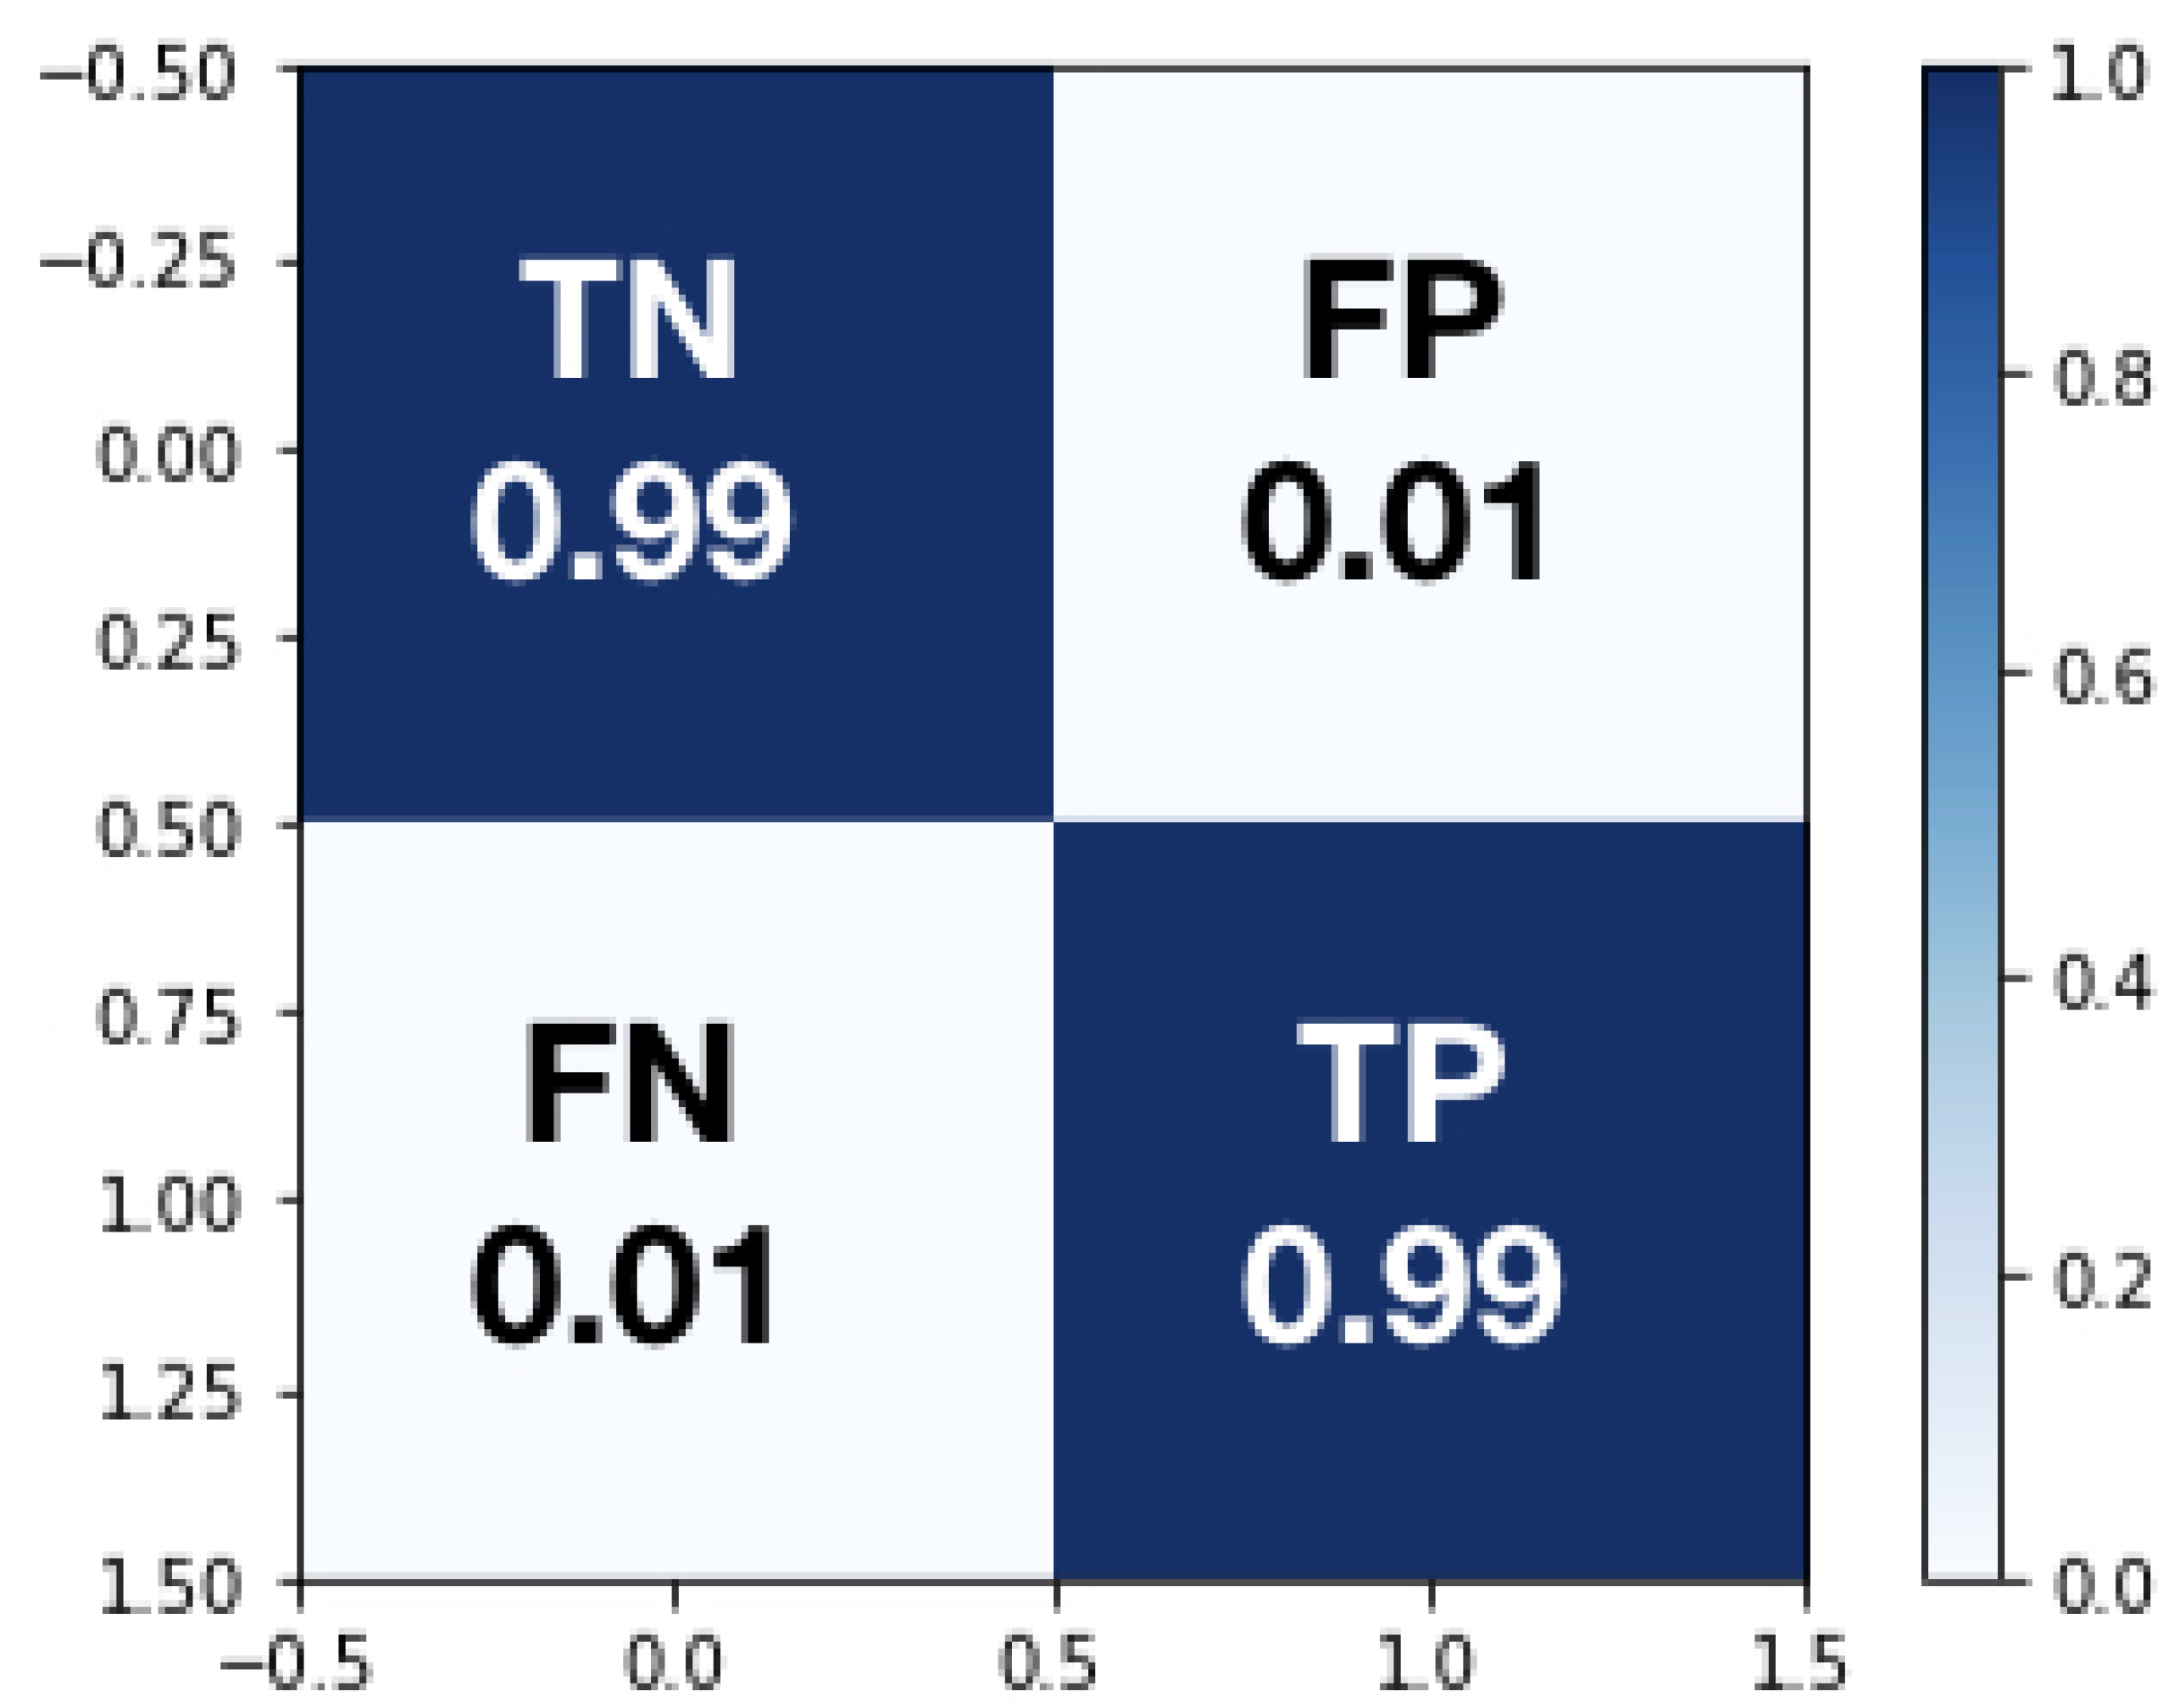
- True Negative (TN), which is an error and has been predicted as an error
- False Positive (FP), which is an error but has not been predicted as an error, and is by far the most damaging category
- False Negative (FN) which is not an error but has been predicted as an error
- True Positive (TP) which is not an error and has not been predicted as an error.
5. Management Conclusions and Future Steps
- The LM tasks studied can be regarded as goal-oriented tasks due to the highly coordinated activity of the dorsolateral and ventromedial PFC. This means that organizational leaders who exhibit such problem-solving behavioral patterns are intending to attain certain goals and perform a cerebral internal modulation of those goals. The immediate consequence is that strategic goals such as operational excellence are more likely to be achieved when implementing LM.
- LM tasks can be regarded as executive tasks that are guided mainly by the PFC. This means that organizational leaders, when dealing with such problem-solving behavioral patterns, consistently exercise decision-making, working memory, and self-control while performing LM. The consequence is that LM is provably a managerial conglomerate that induces and executive cerebral state and therefore, organizational leaders that decide to implement LM within their organizations and setting them in a systematic path of execution towards operational excellence.
- The LM problem-solving behavioral pattern, KATA, after definition of the target states apparently induces the subjects into a mental state in which information that is not relevant to the target-state achievement is not taken into consideration. This is shown by the lack of coordinated activity between PFC areas and the TPJ. This has powerful implications for the operations management community. It could mean that target-state setting would induce subjects into undesirable inflexible problem-solving behavioral patterns in which the decision-making process is not modulated by the complexity of ever-changing organizational value-stream settings. Individuals could make decisions independently of their context to serve their individual targets. This could potentially not serve a higher organizational alignment. In highly complex organizational settings where interdependent behavior is essential for organizational alignment, this could have dire consequences.
- In contrast, the LM problem-solving behavioral pattern (CPD)nA-Plan, which advocates only continuous improvement without target conditions, seems to enable cerebral modulation of the PFC activity by providing for coordination with the TPJ. In highly complex environments where interdependent value-stream constraints are to be simultaneously considered, such an LM behavioral trait seems to permit the flexibility that is necessary for a coordinated organizational effort towards the demands of alignment and, from a cerebral perspective, offers a better promise to ensure individual and organizational fitness.
- EEG combined with DL at a shoopfloor level shall impact quality, reliability, and cost.In an Industry 4.0 shopfloor environment, in which man and machine interact constantly to create value, it is essential that they communicate effectively and efficiently in real time. The creation of intelligent algorithms capable of characterizing the complex behaviors of the human brain and making them understandable to the machine seems of vital importance to ensure a symbiosis that increases machine efficiency and human effectiveness.Future lines of research should try to better understand how the human brain can integrate its work into the Industry 4.0 shopfloor by means of brain sensors, making possible the cerebral interface between man and machine without the need for low-bandwidth elements such as touch screens or verbal commands.The DL-based algorithms based on process EEG signals presented in this paper can be a spearhead that allows the classification and training of Industry 4.0 intelligence systems that allow this integration. This intelligence integrated in the value streams will allow humans and machines to co-exist in a way in which artificial and human intelligence will complement each other, thus increasing the process capability of generating higher standards of quality, reliability, and ultimately reducing cost.
- EEG combined with DL at a strategic manufacturing system level.The DL characterization of LM problem-solving behavioral patterns is expected to help Industry 4.0 leaders in their choice of adequate manufacturing systems and their related problem-solving methods in their future pursuit of strategic organizational goals.As demonstrated by the presented DL algorithms, no neurophysiological expert knowledge is necessary to discriminate between two different complex LM problem-solving behavioral patterns performed by Industry 4.0 process owners. This could help future industry leaders make better decisions about which manufacturing systems to choose from a neurological point of view. This bottom-up approach is novel in the field of management and represents in itself a breakthrough in the study of manufacturing systems in Industry 4.0 environments.DL-based applications combined with multiple simultaneous EEG measurements to different actors during the performance of different complex tasks such as decision-making, data analysis, leadership interactions with subordinates, or other relevant actors, could lead to new revelations in the field of neuroeconomics among other fields. Likewise, by establishing a feedback loop to the leadership process of each individual, this knowledge could provide specific knowledge of each individual during their interaction with other stakeholders. This could mean a breakthrough towards a customization of leadership and towards a transformation of business culture from the neuroscientific knowledge of human behavior in an Industry 4.0 environment.
Author Contributions
Acknowledgments
Conflicts of Interest
Abbreviations
| LM | Lean Management |
| SNR | Signal-to-Noise Ratio |
| PFC | Prefrontal Cortex |
| PDCA | Plan-Do-Check-Act |
| (CPD)nA | Check-Plan-Do-...-Act |
| EEG | Electroencephalography |
| DL | Deep Learning |
| H | Hypothesis |
References
- Imai, M. KAIZEN: The Key to Japan’s Competitive Success; McGraw-Hill Higher Education: New York, NY, USA, 1986. [Google Scholar]
- Womack, J.; Jones, D. Introduction. In Lean Thinking, 2nd ed.; Simon & Schuster: New York, NY, USA, 2003; p. 4. [Google Scholar]
- Shah, R.; Chandrasekaran, A.; Lindeman, K. In pursuit of implementation patterns: The context of Lean and Six Sigma. Int. J. Prod. Econ. 2008, 46, 6679–6699. [Google Scholar] [CrossRef]
- Villalba-Diez, J. The HOSHIN KANRI FOREST. Lean Strategic Organizational Design, 1st ed.; CRC Press/Taylor and Francis Group LLC: Boca Raton, FL, USA, 2017. [Google Scholar]
- Villalba-Diez, J. The Lean Brain Theory. Complex Networked Lean Strategic Organizational Design; CRC Press/Taylor and Francis Group LLC: Boca Raton, FL, USA, 2017. [Google Scholar]
- Shah, R.; Ward, P. Lean Manufacturing: Context, practice bundles and performance. J. Oper. Manag. 2003, 21, 129–149. [Google Scholar] [CrossRef]
- Shah, R.; Ward, P. Defining and developing measures of lean production. J. Oper. Manag. 2007, 25, 785–805. [Google Scholar] [CrossRef]
- Shewhart, W.; Deming, E. Statistical Method. From the Viewpoint of Quality Control; Department of Agriculture, The Graduate School: Washington, DC, USA, 1939. [Google Scholar]
- Madanhire, I.; Mbohwa, C. Application of just in time as a total quality management tool: The case of an aluminium foundry manufacturing. Total Qual. Manag. Bus. Excell. 2016, 27, 184–197. [Google Scholar] [CrossRef]
- Yang, C.C. The effectiveness analysis of the practices in five quality management stages for SMEs. Total Qual. Manag. Bus. Excell. 2018. [Google Scholar] [CrossRef]
- Rother, M. Toyota Kata: Managing People for Improvement, Adaptiveness and Superior Results, 1st ed.; McGraw-Hill: New York, NY, USA, 2009. [Google Scholar]
- Sobek, D., II; Smalley, A. Understanding A3 Thinking: A Critical Component of Toyota’s PDCA Management System, 1st ed.; Productivity Press: Boca Raton, FL, USA, 2008. [Google Scholar]
- Balle, M.; Balle, F. Lead with Respect: A Novel of Lean Practice; Lean Enterprises Inst Inc.: Boston, MA, USA, 2014. [Google Scholar]
- Villalba-Diez, J.; Ordieres-Mere, J. Improving manufacturing operational performance by standardizing process management. Trans. Eng. Manag. 2015, 62, 351–360. [Google Scholar] [CrossRef]
- Rother, M.; Aulinger, G. Toyota Kata Culture: Building Organizational Capability and Mindset through Kata Coaching; McGraw-Hill Higher Education: New York, NY, USA, 2017. [Google Scholar]
- Villalba-Diez, J.; Ordieres-Mere, J.; Rubio-Valdehita, S. Lean Learning Patterns. (CPD)nA vs. KATA. Procedia CIRP 2016, 54, 147–151. [Google Scholar] [CrossRef][Green Version]
- Di Flumeri, G.; Aricò, P.; Borghini, G.; Sciaraffa, N.; Di Florio, A.; Babiloni, F. The Dry Revolution: Evaluation of Three Different EEG Dry Electrode Types in Terms of Signal Spectral Features, Mental States Classification and Usability. Sensors 2019, 19, 1365. [Google Scholar] [CrossRef]
- Lopez-Gordo, M.A.; Sanchez-Morillo, D.; Valle, F.P. Dry EEG Electrodes. Sensors 2014, 14, 12847–12870. [Google Scholar] [CrossRef]
- Pathirana, S.; Asirvatham, D.; Johar, G. A Critical Evaluation on Low-Cost Consumer-Grade Electroencephalographic Devices. In Proceedings of the 2018 2nd International Conference on BioSignal Analysis, Processing and Systems (ICBAPS), Kuching, Malaysia, 24–26 July 2018; pp. 160–165. [Google Scholar] [CrossRef]
- Aricò, P.; Borghini, G.; Flumeri, G.D.; Sciaraffa, N.; Babiloni, F. Passive BCI beyond the lab: Current trends and future directions. Physiol. Meas. 2018, 39, 08TR02. [Google Scholar] [CrossRef]
- Goldberg, E. The New Executive Brain. Frontal Lobes in a Complex World; Oxford University Press: New York, NY, USA, 2009. [Google Scholar]
- Miyake, A.; Friedman, N.; Emerson, M.; Witzki, A.; Howerter, A.; Wager, T. The unity and diversity of executive functions and their contributions to complex “Frontal Lobe” tasks: A latent variable analysis. Cogn. Psychol. 2000, 41, 49–100. [Google Scholar] [CrossRef] [PubMed]
- Imai, M. Gemba Kaizen: A Commonsense Approach to a Continuous Improvement Strategy, 2nd ed.; McGraw-Hill Professional: New York, NY, USA, 2012. [Google Scholar]
- Wang, W.; Koren, Y. Scalability planning for reconfigurable manufacturing systems. J. Manuf. Syst. 2012, 31, 83–91. [Google Scholar] [CrossRef]
- Swanson, H.; Fung, W. Working memory components and problem-solving accuracy: Are there multiple pathways? J. Educ. Psychol. 2016, 108, 1153–1177. [Google Scholar] [CrossRef]
- Fuster, J. The Prefrontal Cortex, 5th ed.; Academic Press: Cambridge, MA, USA, 2015. [Google Scholar]
- Brümmer, V.; Schneider, S.; Abel, T.; Vogt, T.; Strüder, H. Brain cortical activity is influenced by exercise mode and intensity. Med. Sci. Sports Exerc. 2011, 43, 1863–1872. [Google Scholar] [CrossRef] [PubMed]
- Leslie, G.; Ojeda, A.; Makeig, S. Measuring musical engagement using expressive movement and EEG brain dynamics. Psychomusicol. Music Mind Brain 2014, 24, 75–91. [Google Scholar] [CrossRef]
- Ito, H.T.; Zhang, S.J.; Witter, M.P.; Moser, E.I.; Moser, M.B. A prefrontal–thalamo–hippocampal circuit for goal-directed spatial navigation. Nature 2015, 522, 50. [Google Scholar] [CrossRef] [PubMed]
- Brown, T.I.; Carr, V.A.; LaRocque, K.F.; Favila, S.E.; Gordon, A.M.; Bowles, B.; Bailenson, J.N.; Wagner, A.D. Prospective representation of navigational goals in the human hippocampus. Science 2016, 352, 1323. [Google Scholar] [CrossRef] [PubMed]
- Janssen, L.K.; Duif, I.; van Loon, I.; Wegman, J.; de Vries, J.H.; Cools, R.; Aarts, E. Loss of lateral prefrontal cortex control in food-directed attention and goal-directed food choice in obesity. NeuroImage 2017, 146, 148–156. [Google Scholar] [CrossRef] [PubMed]
- Cicerone, K.; Dahlberg, C.; Malec, J.; Langenbahn, D.; Felicetti, T.; Kneipp, S.; Ellmo, W.; Kalmar, K.; Giacino, J.; Harley, P.; et al. Evidence-Based Cognitive Rehabilitation: Updated Review of the Literature From 1998 Through 2002. Arch. Phys. Med. Rehabil. 2011, 92, 519–530. [Google Scholar] [CrossRef] [PubMed]
- Helfrich, R.F.; Knight, R.T. Oscillatory Dynamics of Prefrontal Cognitive Control. Trends Cogn. Sci. 2016, 20, 916–930. [Google Scholar] [CrossRef] [PubMed]
- Merre, P.L.; Esmaeili, V.; Charrière, E.; Galan, K.; Salin, P.A.; Petersen, C.C.H.; Crochet, S. Reward-Based Learning Drives Rapid Sensory Signals in Medial Prefrontal Cortex and Dorsal Hippocampus Necessary for Goal-Directed Behavior. Neuron 2018, 97, 83–91.e5. [Google Scholar] [CrossRef] [PubMed]
- Reber, J.; Feinstein, J.S.; O’Doherty, J.P.; Liljeholm, M.; Adolphs, R.; Tranel, D. Selective impairment of goal-directed decision-making following lesions to the human ventromedial prefrontal cortex. Brain 2017, 140, 1743–1756. [Google Scholar] [CrossRef] [PubMed]
- Zhou, X.; Zhu, D.; King, S.G.; Lees, C.J.; Bennett, A.J.; Salinas, E.; Stanford, T.R.; Constantinidis, C. Behavioral response inhibition and maturation of goal representation in prefrontal cortex after puberty. Proc. Natl. Acad. Sci. USA 2016, 113, 3353–3358. [Google Scholar] [CrossRef] [PubMed]
- Voytek, B.; Kayser, A.S.; Badre, D.; Fegen, D.; Chang, E.F.; Crone, N.E.; Parvizi, J.; Knight, R.T.; D’Esposito, M. Oscillatory dynamics coordinating human frontal networks in support of goal maintenance. Nat. Neurosci. 2015, 18, 1318. [Google Scholar] [CrossRef] [PubMed]
- Gazzaley, A.; Cooney, J.; McEvoy, K.; Knight, R.; D’Esposito, M. Top-down Enhancement and Suppression of the Magnitude and Speed of Neural Activity. J. Cogn. Neurosci. 2005, 17, 507–517. [Google Scholar] [CrossRef]
- Goldman-Rakic, P. Circuitry of primate prefrontal cortex and regulation of behavior by representational memory. In Comprehensive Physiology, Supplement 5: Handbookof Physiology, the Nervous System, Higher Functions of the Brain; John Wiley & Sons, Inc.: Hoboken, NJ, USA, 1987; pp. 373–417. [Google Scholar]
- Badre, D.; D’Esposito, M. Functional magnetic resonance imaging evidence for a hierarchical organization of the prefrontal cortex. J. Cogn. Neurosci. 2007, 19, 2082–2099. [Google Scholar] [CrossRef]
- Amodio, D.; Frith, C. Meeting ofminds: The medial frontal cortex and social cognition. Nat. Rev. Neurosci. 2006, 88, 615–626. [Google Scholar]
- Aron, A. From reactive to proactive and selective control: Developing a richer model for stopping inappropriate responses. Biol. Psychiatry 2011, 69, e55–e68. [Google Scholar] [CrossRef]
- Balconi, M.; Vanutelli, M.E.; Grippa, E. Resting state and personality component (BIS/BAS) predict the brain activity (EEG and fNIRS measure) in response to emotional cues. Brain Behav. 2017, 7, e00686. [Google Scholar] [CrossRef]
- Waskom, M.; Frank, M.; Wagner, A. Adaptive Engagement of Cognitive Control in Context-Dependent Decision Making. Cereb. Cortex 2017, 27, 1270–1284. [Google Scholar] [CrossRef]
- Hare, T.; Camerer, C.; Rangel, A. Self-Control in Decision-Maiking Involves Modulation of the vmPFC Valuation System. Science 2009, 324, 646–648. [Google Scholar] [CrossRef] [PubMed]
- Rudort, S.; Hare, T. Interactions between Dorsolateral and Ventromedial Prefrontal Cortex Underlie Context-Dependent Stimulus Valuation in Goal-Directed Choice. J. Neurosci. 2014, 34, 15988–15996. [Google Scholar] [CrossRef] [PubMed]
- Chao, L.; Knight, R. Human prefrontal lesions increase distractability to irrelevant sensory inputs. Neuroreport 1995, 6, 1605–1610. [Google Scholar] [CrossRef] [PubMed]
- Lorenc, E.; Lee, T.; Chen, A.W.; D’Esposito, M. The Effect of Disruption of Prefrontal Cortical Function with Transcranial Magnetic Stimulation on Visual Working Memory. Front. Syst. Neurosci. 2015, 9, 1–11. [Google Scholar] [CrossRef] [PubMed]
- Spreng, R.; Shoemaker, L.; Turner, G. Executive Functions and Neurocognitive Aging. In Executive Functions in Health and Disease, 1st ed.; Academic Press: Cambridge, MA, USA, 2017; pp. 169–196. [Google Scholar]
- Arnsten, A.; Raskind, M.; Taylor, F.; Connor, D. The effects of stress exposure on prefrontal cortex: Translating absic research into successful treatments for post-traumatic stress disorder. Neurobiol. Stress 2015, 1, 89–99. [Google Scholar] [CrossRef] [PubMed]
- Arnsten, A. Stress signalling pathways that impair prefrontal cortex structure and function. Nat. Rev. Neurosci. 2009, 10, 410–422. [Google Scholar] [CrossRef]
- Birbaumer, N.; Veit, R.; Lotze, M.; Erb, M.; Hermann, C.; Grodd, W.; Flor, H. Deficient fear conditioning in psychopathy: a functional magnetic resonance imaging study. Arch. Gen. Psychiatry 2005, 62, 799–805. [Google Scholar] [CrossRef]
- Contreras-Rodríguez, O.; Pujol, J.; Batalla, I.; Harrison, B.; Soriano-Mas, C.; Deus, J.; López-Solà, M.; Macià, D.; Pera, V.; Hernández-Ribas, R.; et al. Functional Connectivity Bias in the Prefrontal Cortex of Psychopaths. Biol. Psychiatry 2014, 78, 647–655. [Google Scholar] [CrossRef]
- Pujol, J.; Batalla, I.; Contreras-Rodríguez, O.; Harrison, B.; Pera, V.; Hernández-Ribas, R.; Bosa, L.; Soriano-Mas, C.; Deus, J.; López-Solà, M.; et al. Breakdown in the brain network subserving moral judgment in criminal psychopathy. Soc. Cogn. Affect. Neurosci. 2012, 7, 917–923. [Google Scholar] [CrossRef]
- Babiak, P.; Hare, R. Snakes in Suits: When Psychopaths Go to Work, Reprint edition; HarperBusiness: New York, NY, USA, 2007. [Google Scholar]
- Tei, S.; Fujino, J.; Kawada, R.; Jankowski, K.; Kauppi, J.P.; van den Bos, W.; Abe, N.; Sugihara, G.; Miyata, J.; Murai, T.; et al. Collaborative roles of Temporoparietal Junction and Dorsolateral Prefrontal Cortex in Different Types of Behavioural Flexibility. Sci. Rep. 2017, 7, 6415. [Google Scholar] [CrossRef]
- Hearne, L.; Cocchi, L.; Zalesky, A.; Mattingley, J. Reconfiguration of brain network architectures between resting state and complexity-dependent cognitive reasoning. J. Neurosci. 2017, 37, 8399–8411. [Google Scholar] [CrossRef] [PubMed]
- Rother, M.; Shook, J. Learning to See: Value Stream Mapping to Add Value and Eliminate MUDA, 1st ed.; Lean Enterprise Insititute: Cambridge, MA, USA, 1999. [Google Scholar]
- Womack, J.; Jones, D. Seeing the Whole Value Stream, 2nd ed.; Lean Enterprise Institute: Boston, MA, USA, 2011. [Google Scholar]
- Baba, F. Study on stable facility conservation activities based on PDCA cycle. Yokohama Int. Soc. Sci. Res. 2012, 17, 99. [Google Scholar]
- Center, J.M.A.M. PDCA Starting from C Works Faster! Japan Management Association Management Center: Tokyo, Japan, 2013. [Google Scholar]
- Valentin, O.; Ducharme, M.; Crétot-Richert, G.; Monsarrat-Chanon, H.; Viallet, G.; Delnavaz, A.; Voix, J. Validation and Benchmarking of a Wearable EEG Acquisition Platform for Real-World Applications. IEEE Trans. Biomed. Circuits Syst. 2019, 13, 103–111. [Google Scholar] [CrossRef] [PubMed]
- Lin, C.; Chuang, C.; Huang, C.; Tsai, S.; Lu, S.; Chen, Y.; Ko, L. Wireless and Wearable EEG System for Evaluating Driver Vigilance. IEEE Trans. Biomed. Circuits Syst. 2014, 8, 165–176. [Google Scholar] [CrossRef] [PubMed]
- Zhang, Z.; Luo, D.; Rasim, Y.; Li, Y.; Meng, G.; Xu, J.; Wang, C. A Vehicle Active Safety Model: Vehicle Speed Control Based on Driver Vigilance Detection Using Wearable EEG and Sparse Representation. Sensors 2016, 16, 242. [Google Scholar] [CrossRef] [PubMed]
- Zhang, X.; Li, J.; Liu, Y.; Zhang, Z.; Wang, Z.; Luo, D.; Zhou, X.; Zhu, M.; Salman, W.; Hu, G.; et al. Design of a Fatigue Detection System for High-Speed Trains Based on Driver Vigilance Using a Wireless Wearable EEG. Sensors 2017, 17, 486. [Google Scholar] [CrossRef] [PubMed]
- Mohamed, Z.; El Halaby, M.; Said, T.; Shawky, D.; Badawi, A. Characterizing Focused Attention and Working Memory Using EEG. Sensors 2018, 18, 3743. [Google Scholar] [CrossRef] [PubMed]
- Masood, N.; Farooq, H. Investigating EEG Patterns for Dual-Stimuli Induced Human Fear Emotional State. Sensors 2019, 19, 522. [Google Scholar] [CrossRef] [PubMed]
- Ahn, J.W.; Ku, Y.; Kim, H.C. A Novel Wearable EEG and ECG Recording System for Stress Assessment. Sensors 2019, 19, 1991. [Google Scholar] [CrossRef]
- Blanco, J.A.; Vanleer, A.C.; Calibo, T.K.; Firebaugh, S.L. Single-Trial Cognitive Stress Classification Using Portable Wireless Electroencephalography. Sensors 2019, 19, 499. [Google Scholar] [CrossRef]
- Pérez-Vidal, A.F.; Garcia-Beltran, C.D.; Martínez-Sibaja, A.; Posada-Gómez, R. Use of the Stockwell Transform in the Detection of P300 Evoked Potentials with Low-Cost Brain Sensors. Sensors 2018, 18, 1483. [Google Scholar] [CrossRef] [PubMed]
- Zhang, Y.; Shen, Y. Parallel Mechanism of Spectral Feature-Enhanced Maps in EEG-Based Cognitive Workload Classification. Sensors 2019, 19, 808. [Google Scholar] [CrossRef] [PubMed]
- Borghini, G.; Aricò, P.; Di Flumeri, G.; Sciaraffa, N.; Babiloni, F. Correlation and Similarity between Cerebral and Non-Cerebral Electrical Activity for User’s States Assessment. Sensors 2019, 19, 704. [Google Scholar] [CrossRef] [PubMed]
- Khan, M.; Hong, M.; Hong, K. Decoding of four movement directions using hybrid NIRS-EEG brain-computer interface. Front. Hum. Neurosci. 2014, 8, 244. [Google Scholar] [CrossRef] [PubMed]
- American Electroencephalographic Society guidelines in electroencephalography, evoked potentials, and polysomnography. J. Clin. Neurophysiol. 1994, 11, 147.
- Li, J.; Struzik, Z.; Zhang, L.; Cichocki, A. Feature learning from incomplete EEG with denoising autoencoder. Neurocomputing 2015, 165, 23–31. [Google Scholar] [CrossRef]
- Runnova, A.; Zhuravlev, M.; Koronovskiy, A.; Hramov, A. Mathematical approach to recover EEG brain signals with artifacts by means of Gram-Schmidt transform. SPIE Proc. 2017, 10337, 103370Y. [Google Scholar]
- Elsayed, N.; Zaghloul, Z.; Bayoumi, M. Brain Computer Interface: EEG Signal Preprocessing Issues and Solutions. Int. J. Comput. Appl. 2017, 169, 12–16. [Google Scholar] [CrossRef]
- Shanbao, T.; Thankor, N. Cross-Correlation Function. In Quantitative EEG Analysis Methods and Applications (Engineering in Medicine & Biology); Artech House Publishers: Norwood, MA, USA, 2009; pp. 111–112. [Google Scholar]
- Chandaka, S.; Chatterjee, A.; Munshi, S. Cross-correlation aided support vector machine classifier for classification of EEG signals. Expert Syst. Appl. 2009, 36, 1329–1336. [Google Scholar] [CrossRef]
- Abdullah, H.; Maddage, N.; Cosic, I.; Cvetkovic, D. Cross-correlation of EEG frequency bands and heart rate variability for sleep apnoea classification. Med. Biol. Eng. Comput. 2010, 48, 1261–1269. [Google Scholar] [CrossRef]
- Panischev, O.; Demin, S.; Kaplan, A.; Varaksina, N. Use of Cross-Correlation Analysis of EEG Signals for Detecting Risk Level for Development of Schizophrenia. Biomed. Eng. 2013, 47, 153–156. [Google Scholar] [CrossRef]
- Morelli, M.; Giannoni, A.; Passino, C.; Landini, L.; Emdin, M.; Vanello, N. A Cross-Correlational Analysis between Electroencephalographic and End-Tidal Carbon Dioxide Signals: Methodological Issues in the Presence of Missing Data and Real Data Results. Sensors 2016, 16, 1828. [Google Scholar] [CrossRef] [PubMed]
- Hermanto, B.; Mengko, T.; Prihatmanto, A.; Indrayanto, A. Signal reference selection and dimensionality reduction for crosscorrelation based feature extraction in EEG signals of brain computer interface. Far East J. Electron. Commun. 2017, 17, 185–207. [Google Scholar] [CrossRef]
- Turner, J.; Page, A.; Mohsenin, T.; Oates, T. Deep Belief Networks used on High Resolution Multichannel Electroencephalography Data for Seizure Detection. In Proceedings of the 2014 AAAI Spring Symposium, Palo Alto, CA, USA, 24–26 March 2014; pp. 24–26. [Google Scholar]
- Jia, X.; Li, K.; Li, X.; Zhang, A. A novel semi-supervised deep learning framework for affective state recognition on eeg signals. In Proceedings of the 2014 IEEE International Conference on Bioinformatics and Bioengineering (BIBE), Boca Raton, FL, USA, 10–12 November 2014; pp. 30–37. [Google Scholar]
- Kasabov, N. From multilayer perceptrons and neurofuzzy systems to deep learning machines: Which method to use?—A survey. Int. J. Inf. Technol. Secur. 2017, 9, 3–24. [Google Scholar]
- Subasi, A.; Gursoy, M. EEG signal classification using PCA, ICA, LDA and support vector machines. Expert Syst. Appl. 2010, 37, 8659–8666. [Google Scholar] [CrossRef]
- Chen, D.W.; Miao, R.; Yang, W.Q.; Liang, Y.; Chen, H.H.; Huang, L.; Deng, C.J.; Han, N. A Feature Extraction Method Based on Differential Entropy and Linear Discriminant Analysis for Emotion Recognition. Sensors 2019, 19, 1631. [Google Scholar] [CrossRef]
- Goodfellow, I.; Bengio, Y.; Courville, A. Deep Learning, 1st ed.; Adaptive Computation and Machine Learning Series; The MIT Press: Cambridge, MA, USA, 2016. [Google Scholar]
- Glorot, X.; Bengio, Y. Understanding the difficulty of training deep feedforward neural networks. In Artificial Intelligence and Statistics (AISTATS); W&CP: Sardinia, Italy, 2010; Volume 9, pp. 249–256. [Google Scholar]
- Ngiam, J.; Khosla, A.; Kim, M.; Nam, J.; Lee, H.; Ng, A.Y. Multimodel deep learning. In Proceedings of the 28th International Conference on Machine Learning, Bellevue, WA, USA, 28 June–2 July 2011; pp. 689–696. [Google Scholar]
- Bengio, Y. Learning deep architechtures for AI. Found. Trends Mach. Learn. 2009, 2, 1–127. [Google Scholar] [CrossRef]
- Movahedi, F.; Coyle, J.; Sejdic, E. Deep belief networks for electroencephalography: A review of recent contributions and future outlooks. IEEE J. Biomed. Health Inform. 2018, 22, 642–652. [Google Scholar] [CrossRef]
- Schirrmeister, R.; Springenberg, J.; Fiederer, L.; Glasstetter, M.; Eggensperger, K.; Tangermann, M. Deep learning with convolutional neural networks for brain mapping and decoding of movement-related information from the human EEG. Hum. Brain Mapp. 2017, 38, 5391–5420. [Google Scholar] [CrossRef]
- Dai, M.; Zheng, D.; Na, R.; Wang, S.; Zhang, S. EEG Classification of Motor Imagery Using a Novel Deep Learning Framework. Sensors 2019, 19, 551. [Google Scholar] [CrossRef]
- Majidov, I.; Whangbo, T. Efficient Classification of Motor Imagery Electroencephalography Signals Using Deep Learning Methods. Sensors 2019, 19, 1736. [Google Scholar] [CrossRef] [PubMed]
- Tayeb, Z.; Fedjaev, J.; Ghaboosi, N.; Richter, C.; Everding, L.; Qu, X.; Wu, Y.; Cheng, G.; Conradt, J. Validating Deep Neural Networks for Online Decoding of Motor Imagery Movements from EEG Signals. Sensors 2019, 19, 210. [Google Scholar] [CrossRef] [PubMed]
- Mao, Z.; Yao, W.; Huang, Y. EEG-based biometric identification with deep learning. In Proceedings of the Neural Engineering (NER), Shanghai, China, 25–28 May 2017; pp. 609–612. [Google Scholar] [CrossRef]
- Zheng, W.L.; Lu, B.L. Investigating critical frequency bands and channels for EEG-based emotion recognition with deep neural networks. IEEE Trans. Auton. Ment. Dev. 2015, 7, 162–175. [Google Scholar] [CrossRef]
- Zheng, X.; Wang, M.; Ordieres-Mere, J. Comparison of Data Preprocessing Approaches for Applying Deep Learning to Human Activity Recognition in the Context of Industry 4.0. Sensors 2018, 18, 2146. [Google Scholar] [CrossRef] [PubMed]
- Byrd, T.; Turner, D. Measuring the flexibility of information technology infrastructure: Exploratory analysis of a construct. J. Manag. Inf. Syst. 2000, 17, 167–208. [Google Scholar]
- Eisenhardt, K. Building theories from case study research. Acad. Manag. Rev. 1989, 14, 532–550. [Google Scholar] [CrossRef]
- Provins, K.; Cunliffe, P. The Relationship Between E.E.G. Activity and Handedness. Cortex 1972, 8, 136–146. [Google Scholar] [CrossRef]
- Oldfield, R. The assessment and analysis of handedness: The Edinburgh Inventory. Neuropsychologia 1971, 9, 97–113. [Google Scholar] [CrossRef]
- Lyons, R. Understanding Digital Signal Processing, 2nd ed.; Prentice Hall PTR: Upper Saddle Rvier, NJ, USA, 2004. [Google Scholar]
- Oostenveld, R.; Fries, P.; Maris, E.; Schoffelen, J.M. FieldTrip: Open Source Software for Advanced Analysis of MEG, EEG, and Invasive Electrophysiological Data. Comput. Intell. Neurosci. 2011, 2011, 9. [Google Scholar] [CrossRef]
- Widmann, A.; Schröger, E. Filter effects and filter artifacts in the analysis of electrophysiological data. Front. Psychol. 2012, 3, 233. [Google Scholar] [CrossRef]
- Winkler, I.; Debener, S.; Mueller, K.; Tangermann, M. On the influence of high-pass filtering on ICA-based artifact reduction in EEG-ERP. In Proceedings of the 2015 37th Annual International Conference of the IEEE Engineering in Medicine and Biology Society (EMBC), Milano, Italy, 25–29 August 2015; pp. 4101–4105. [Google Scholar] [CrossRef]
- Van Rossum, G. Python Tutorial; Technical Report CS-R9526; Centrum voor Wikunde en Informatica (CWI): Amsterdam, The Netherlands, 1995. [Google Scholar]
- Ravi, D.; Wong, C.; Lo, L.; Yang, B. A Deep Learning Approach to on-Node Sensor Data Analytics for Mobile or Wearable Devices. IEEE J. Biomed. Health Inform. 2017, 21, 56–64. [Google Scholar] [CrossRef] [PubMed]
- LeCun, Y.; Bengio, Y.; Hinton, G. Deep learning. Nature 2015, 521, 436–444. [Google Scholar] [CrossRef] [PubMed]
| # | Hypotheses | LM Interpretation |
|---|---|---|
| 1 | H1. Subjects that engage in LM problem-solving behavioral patterns present a strong correlation in their PFC activity. In such a case, datasets from sensors AF3-F7-F3-AF4-F4-F8 would present a strong correlation. | This would mean that LM problem-solving behavioral patterns can be understood in neurological terms as executive behavioral pattern. |
| 2 | H2. Subjects that engage in KATA and (CPD)nA present strong correlations of their dorsolateral PFC-ventromedial PFC combined activity. In such a case, datasets from sensors F7 (ventromedial PFC Left Hemisphere) and F3 (dorsolateral PFC Left Hemisphere), as well as F4 (ventromedial PFC Right Hemisphere) and F8 (dorsolateral PFC Right Hemisphere), would present a strong correlation. | This would mean that both (CPD)nA and KATA can be regarded in neurological terms as goal-oriented LM behavioral pattern. |
| 3 | H3. Subjects that engage in KATA present weakly dorsolateral PFC-TPJ correlated combined activity. In such a case, datasets from sensors F7 (ventromedial PFC Left Hemisphere) and F3 (dorsolateral PFC Left Hemisphere) would not correlate strongly with P7 (TPJ Left Hemisphere), and sensors F4 (ventromedial PFC Right Hemisphere) and F8 (dorsolateral PFC Right Hemisphere) would not correlate strongly with P8 (TPJ Right Hemisphere). | This would mean that KATA could be understood in neurological terms as a goal-oriented, context-independent LM behavioral pattern. |
| 4 | H4. Subjects that engage in (CPD)nA present a strong dorsolateral PFC-TPJ correlated combined activity. In such a case, datasets from sensors F7 (ventromedial PFC Left Hemisphere) and F3 (dorsolateral PFC Left Hemisphere) would correlate strongly with P7 (TPJ Left Hemisphere), and sensors F4 (ventromedial PFC Right Hemisphere) and F8 (dorsolateral PFC Right Hemisphere) would correlate strongly with AF3 (dorsolateral PFC Left Hemisphere). | This would mean that (CPD)nA could be understood in neurological terms as a goal-oriented, context-dependent LM behavioral pattern. |
© 2019 by the authors. Licensee MDPI, Basel, Switzerland. This article is an open access article distributed under the terms and conditions of the Creative Commons Attribution (CC BY) license (http://creativecommons.org/licenses/by/4.0/).
Share and Cite
Villalba-Diez, J.; Zheng, X.; Schmidt, D.; Molina, M. Characterization of Industry 4.0 Lean Management Problem-Solving Behavioral Patterns Using EEG Sensors and Deep Learning. Sensors 2019, 19, 2841. https://doi.org/10.3390/s19132841
Villalba-Diez J, Zheng X, Schmidt D, Molina M. Characterization of Industry 4.0 Lean Management Problem-Solving Behavioral Patterns Using EEG Sensors and Deep Learning. Sensors. 2019; 19(13):2841. https://doi.org/10.3390/s19132841
Chicago/Turabian StyleVillalba-Diez, Javier, Xiaochen Zheng, Daniel Schmidt, and Martin Molina. 2019. "Characterization of Industry 4.0 Lean Management Problem-Solving Behavioral Patterns Using EEG Sensors and Deep Learning" Sensors 19, no. 13: 2841. https://doi.org/10.3390/s19132841
APA StyleVillalba-Diez, J., Zheng, X., Schmidt, D., & Molina, M. (2019). Characterization of Industry 4.0 Lean Management Problem-Solving Behavioral Patterns Using EEG Sensors and Deep Learning. Sensors, 19(13), 2841. https://doi.org/10.3390/s19132841


