Robust Shelf Monitoring Using Supervised Learning for Improving On-Shelf Availability in Retail Stores †

Abstract
:
1. Introduction
2. Related Work
3. Proposed Method
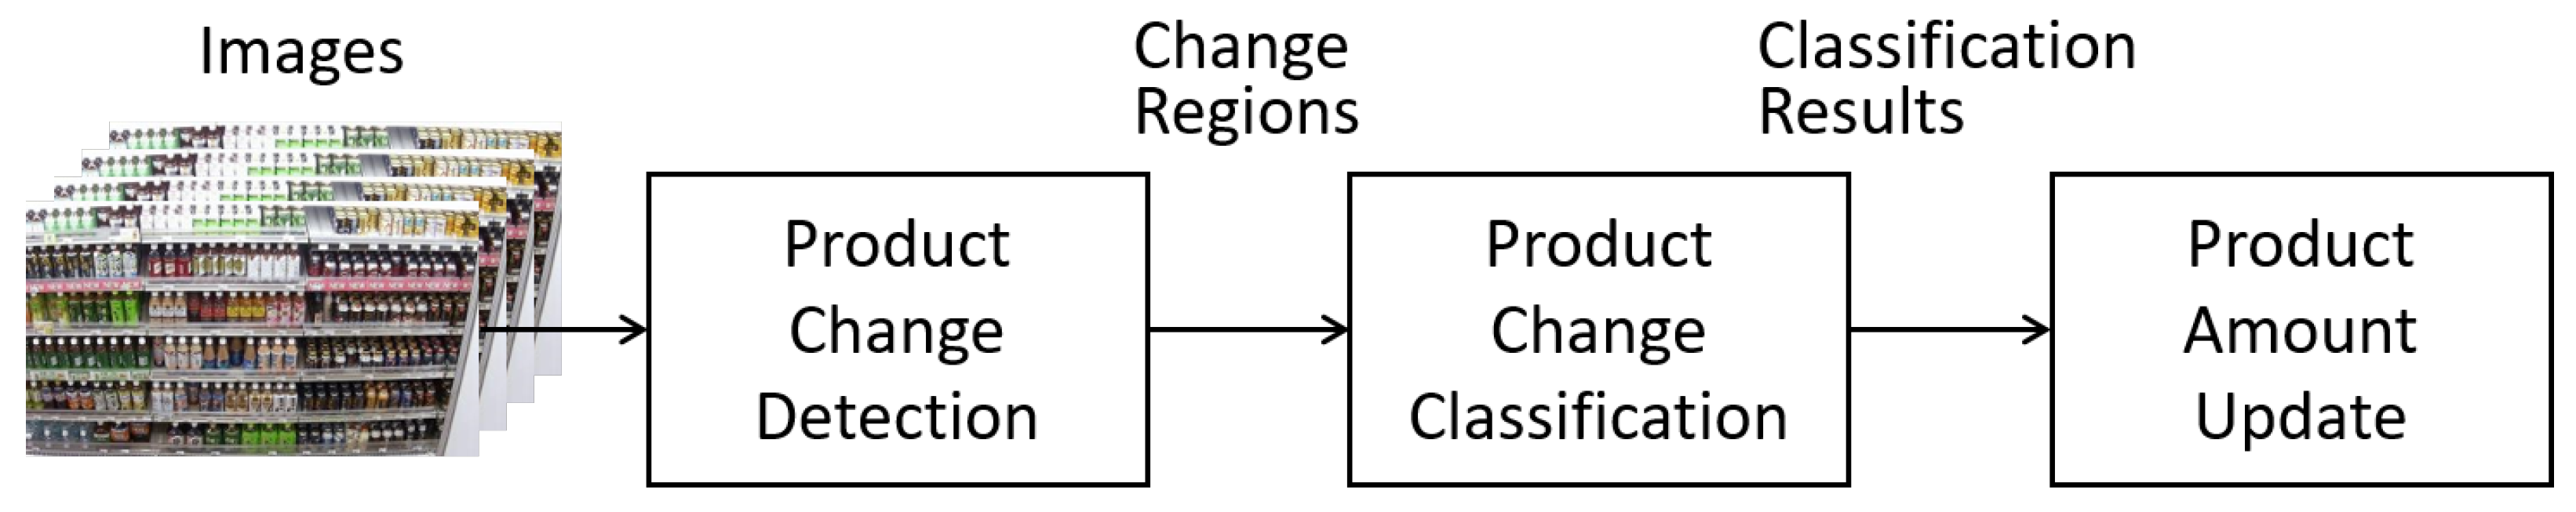
3.1. Overview
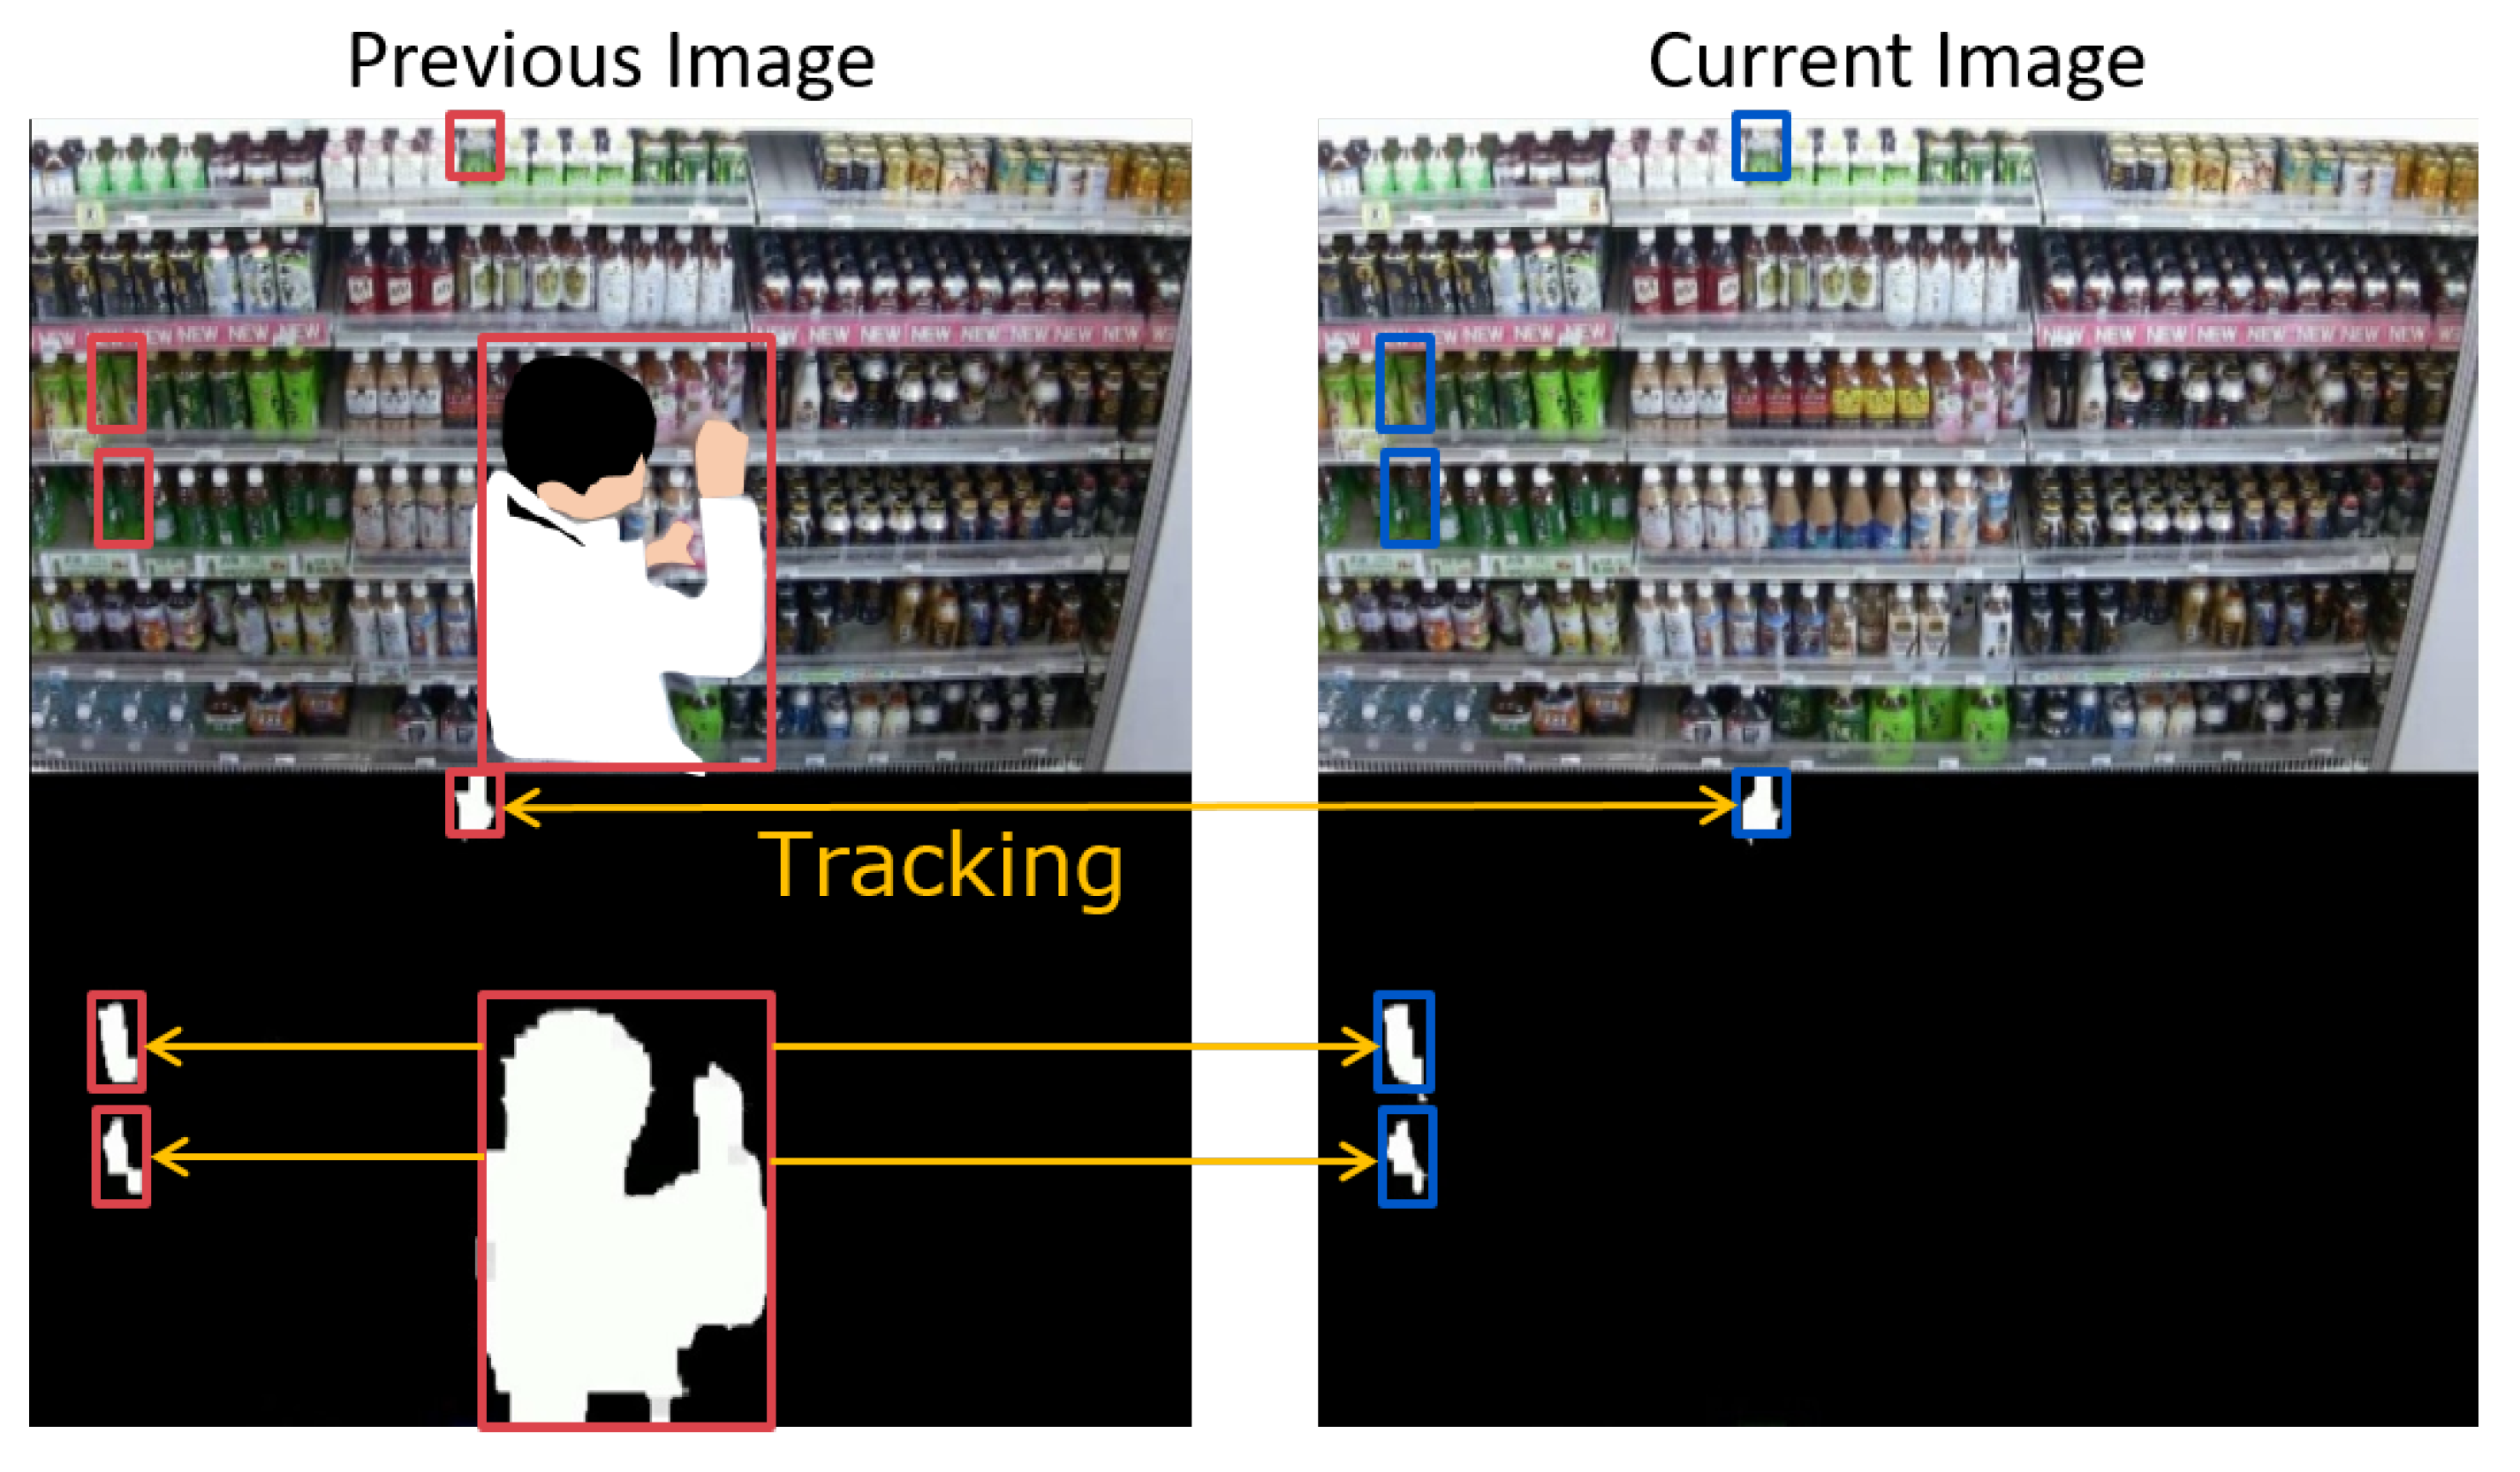
3.2. Detection of Product Changes
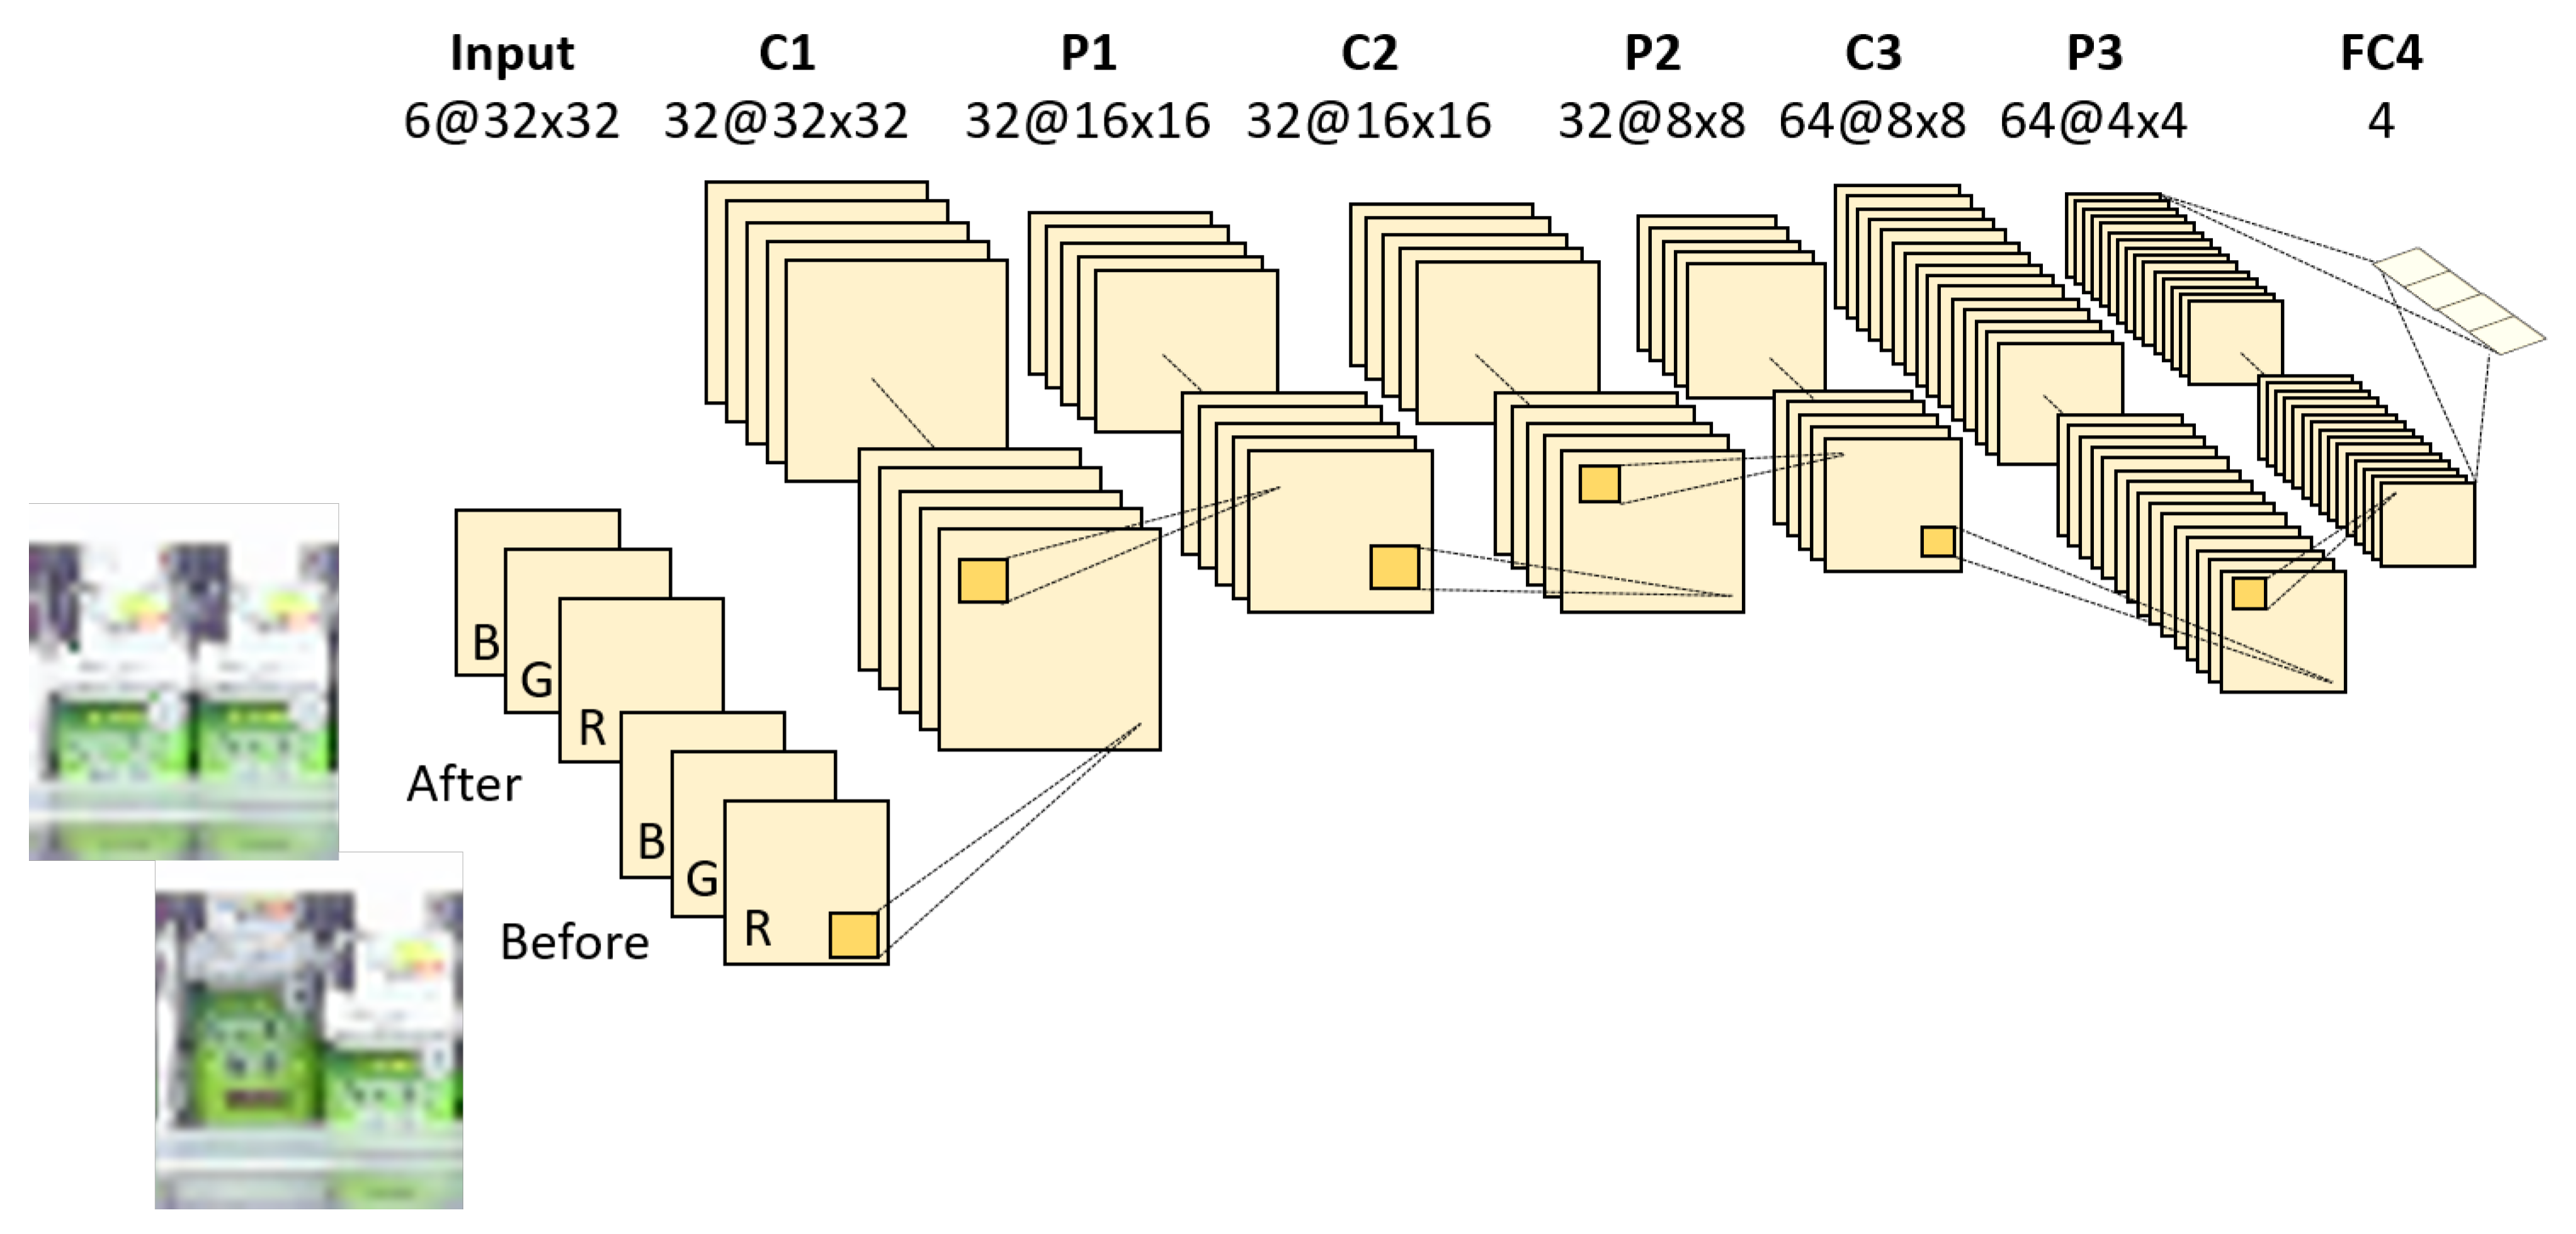
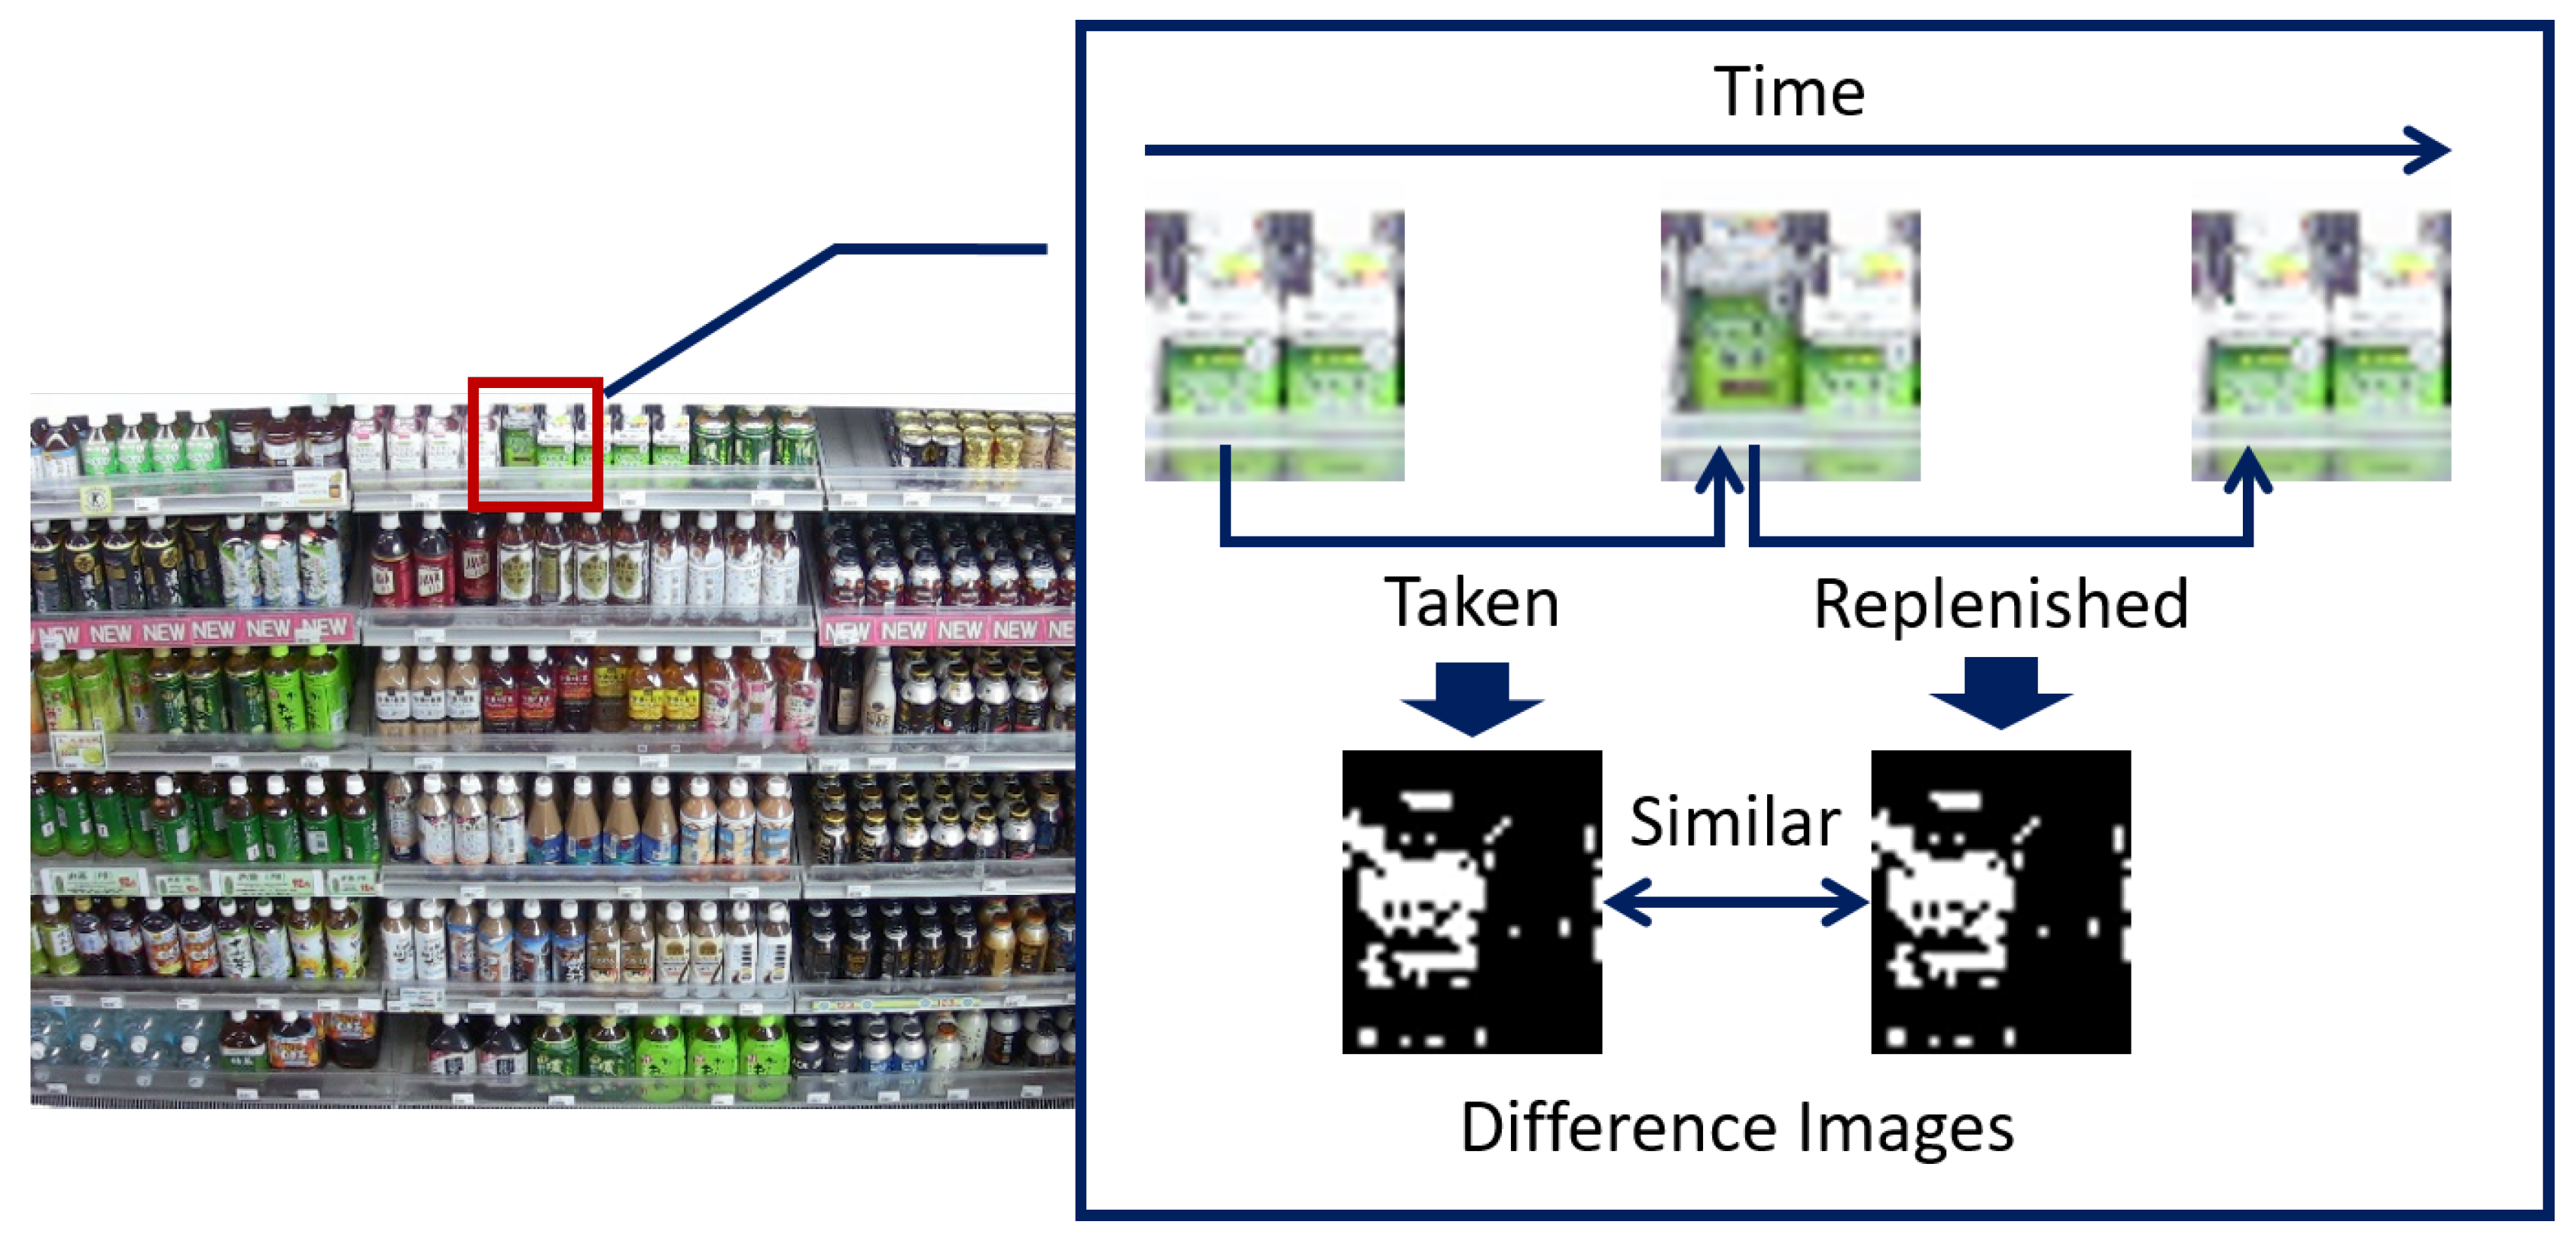
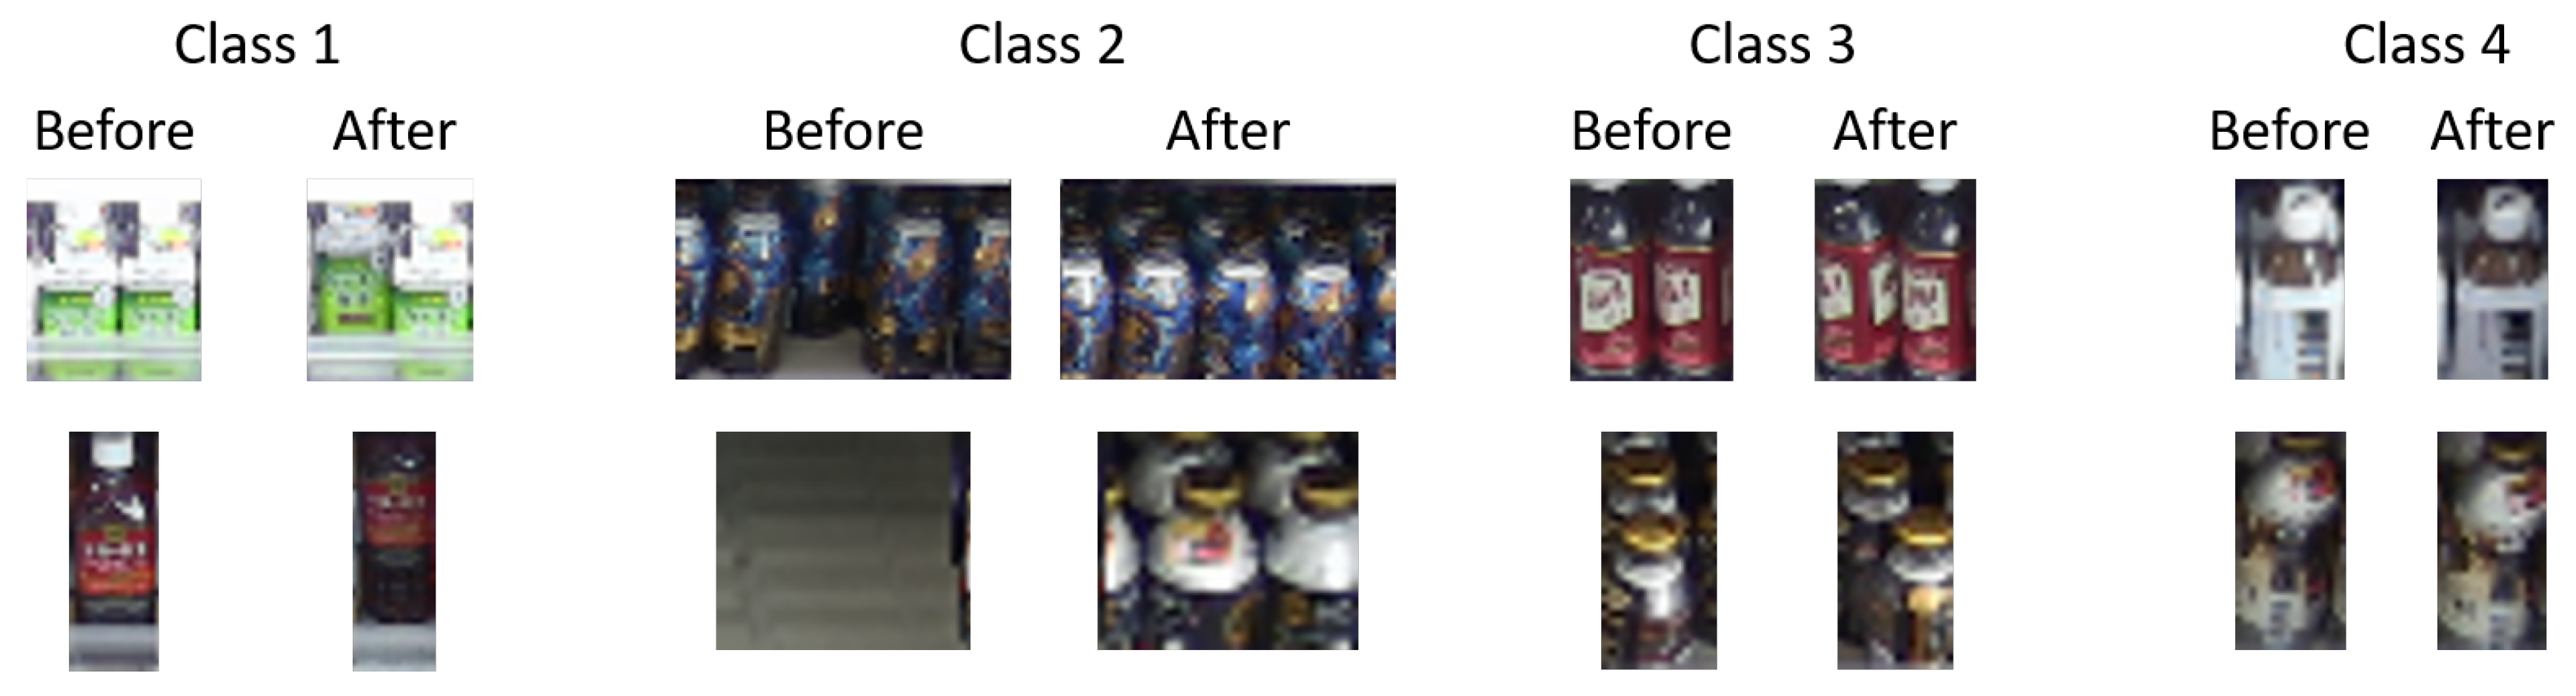
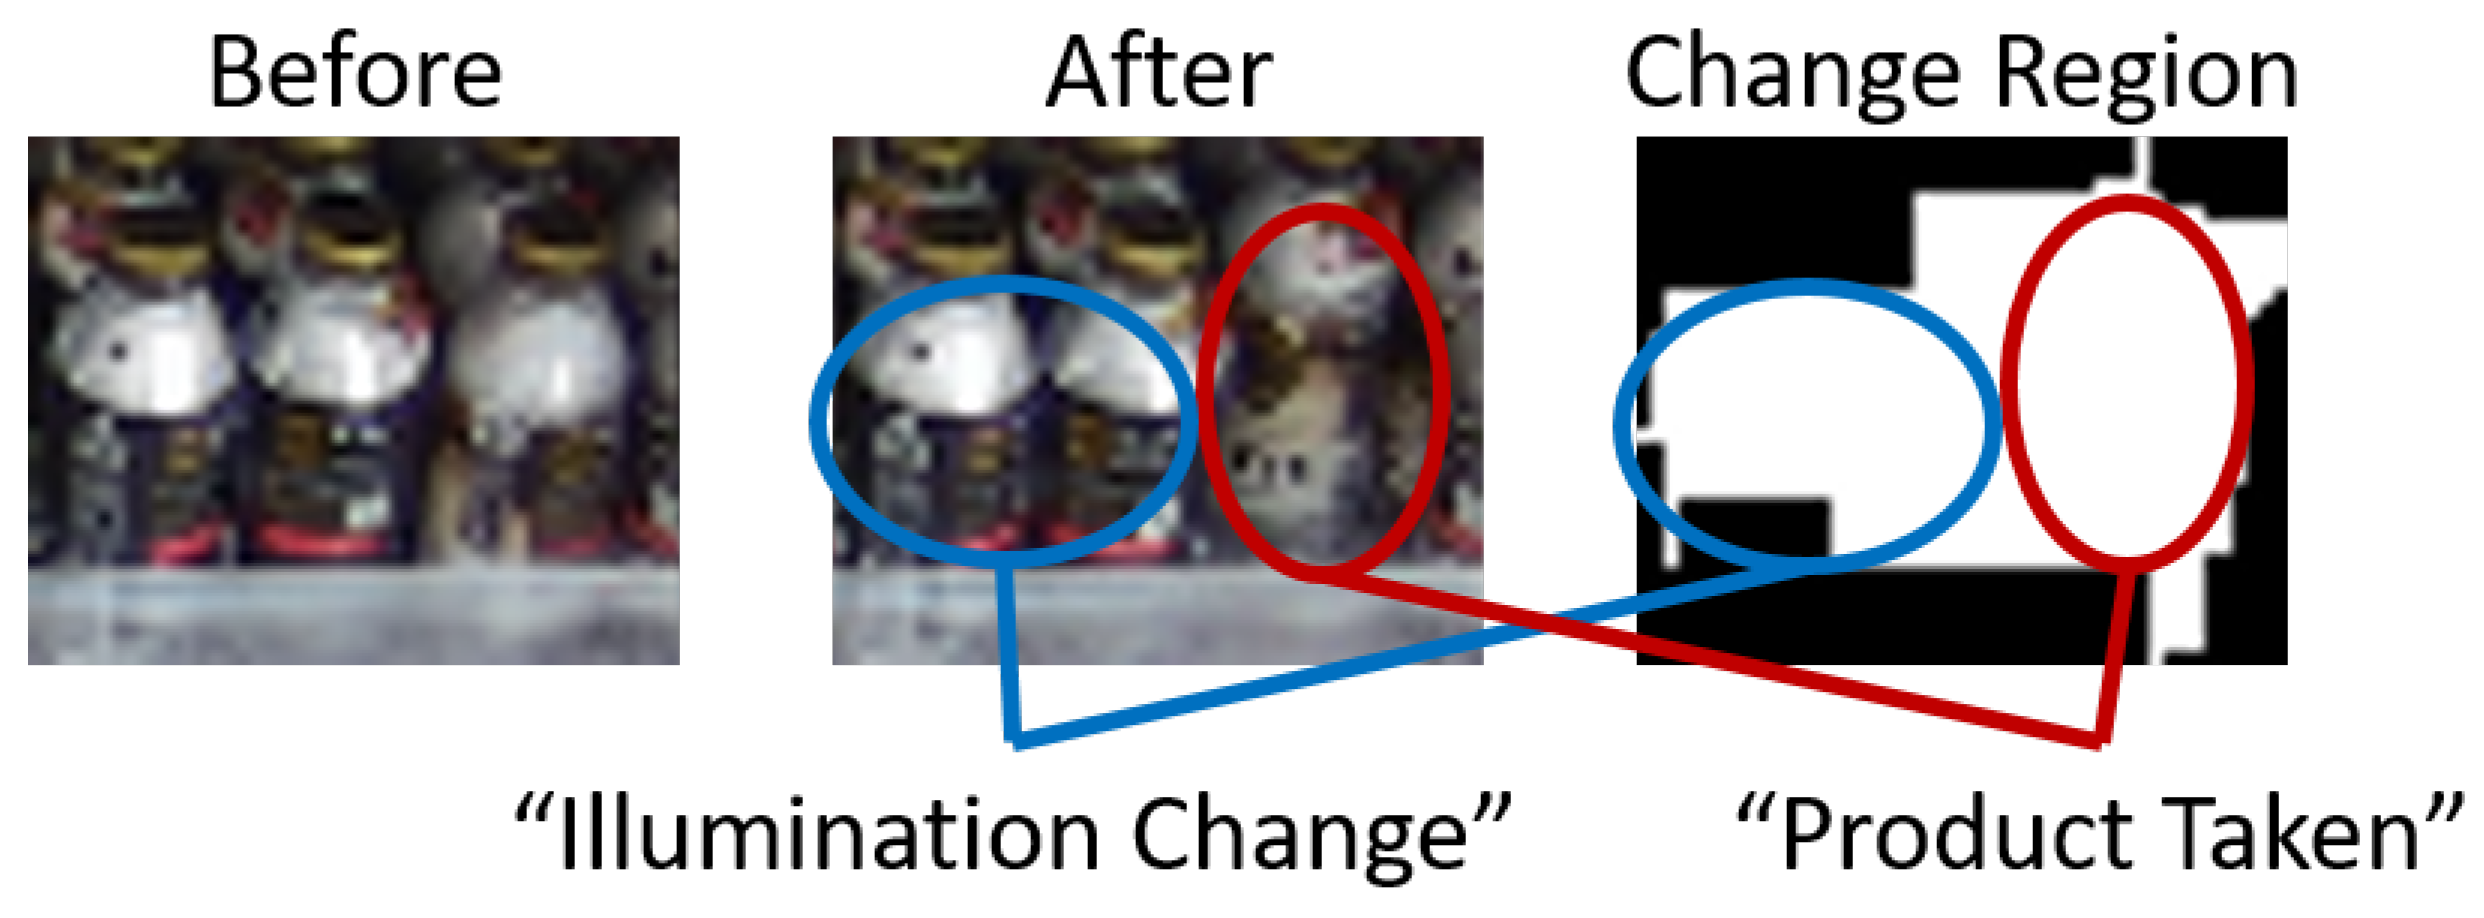
3.3. Classification of Product Changes
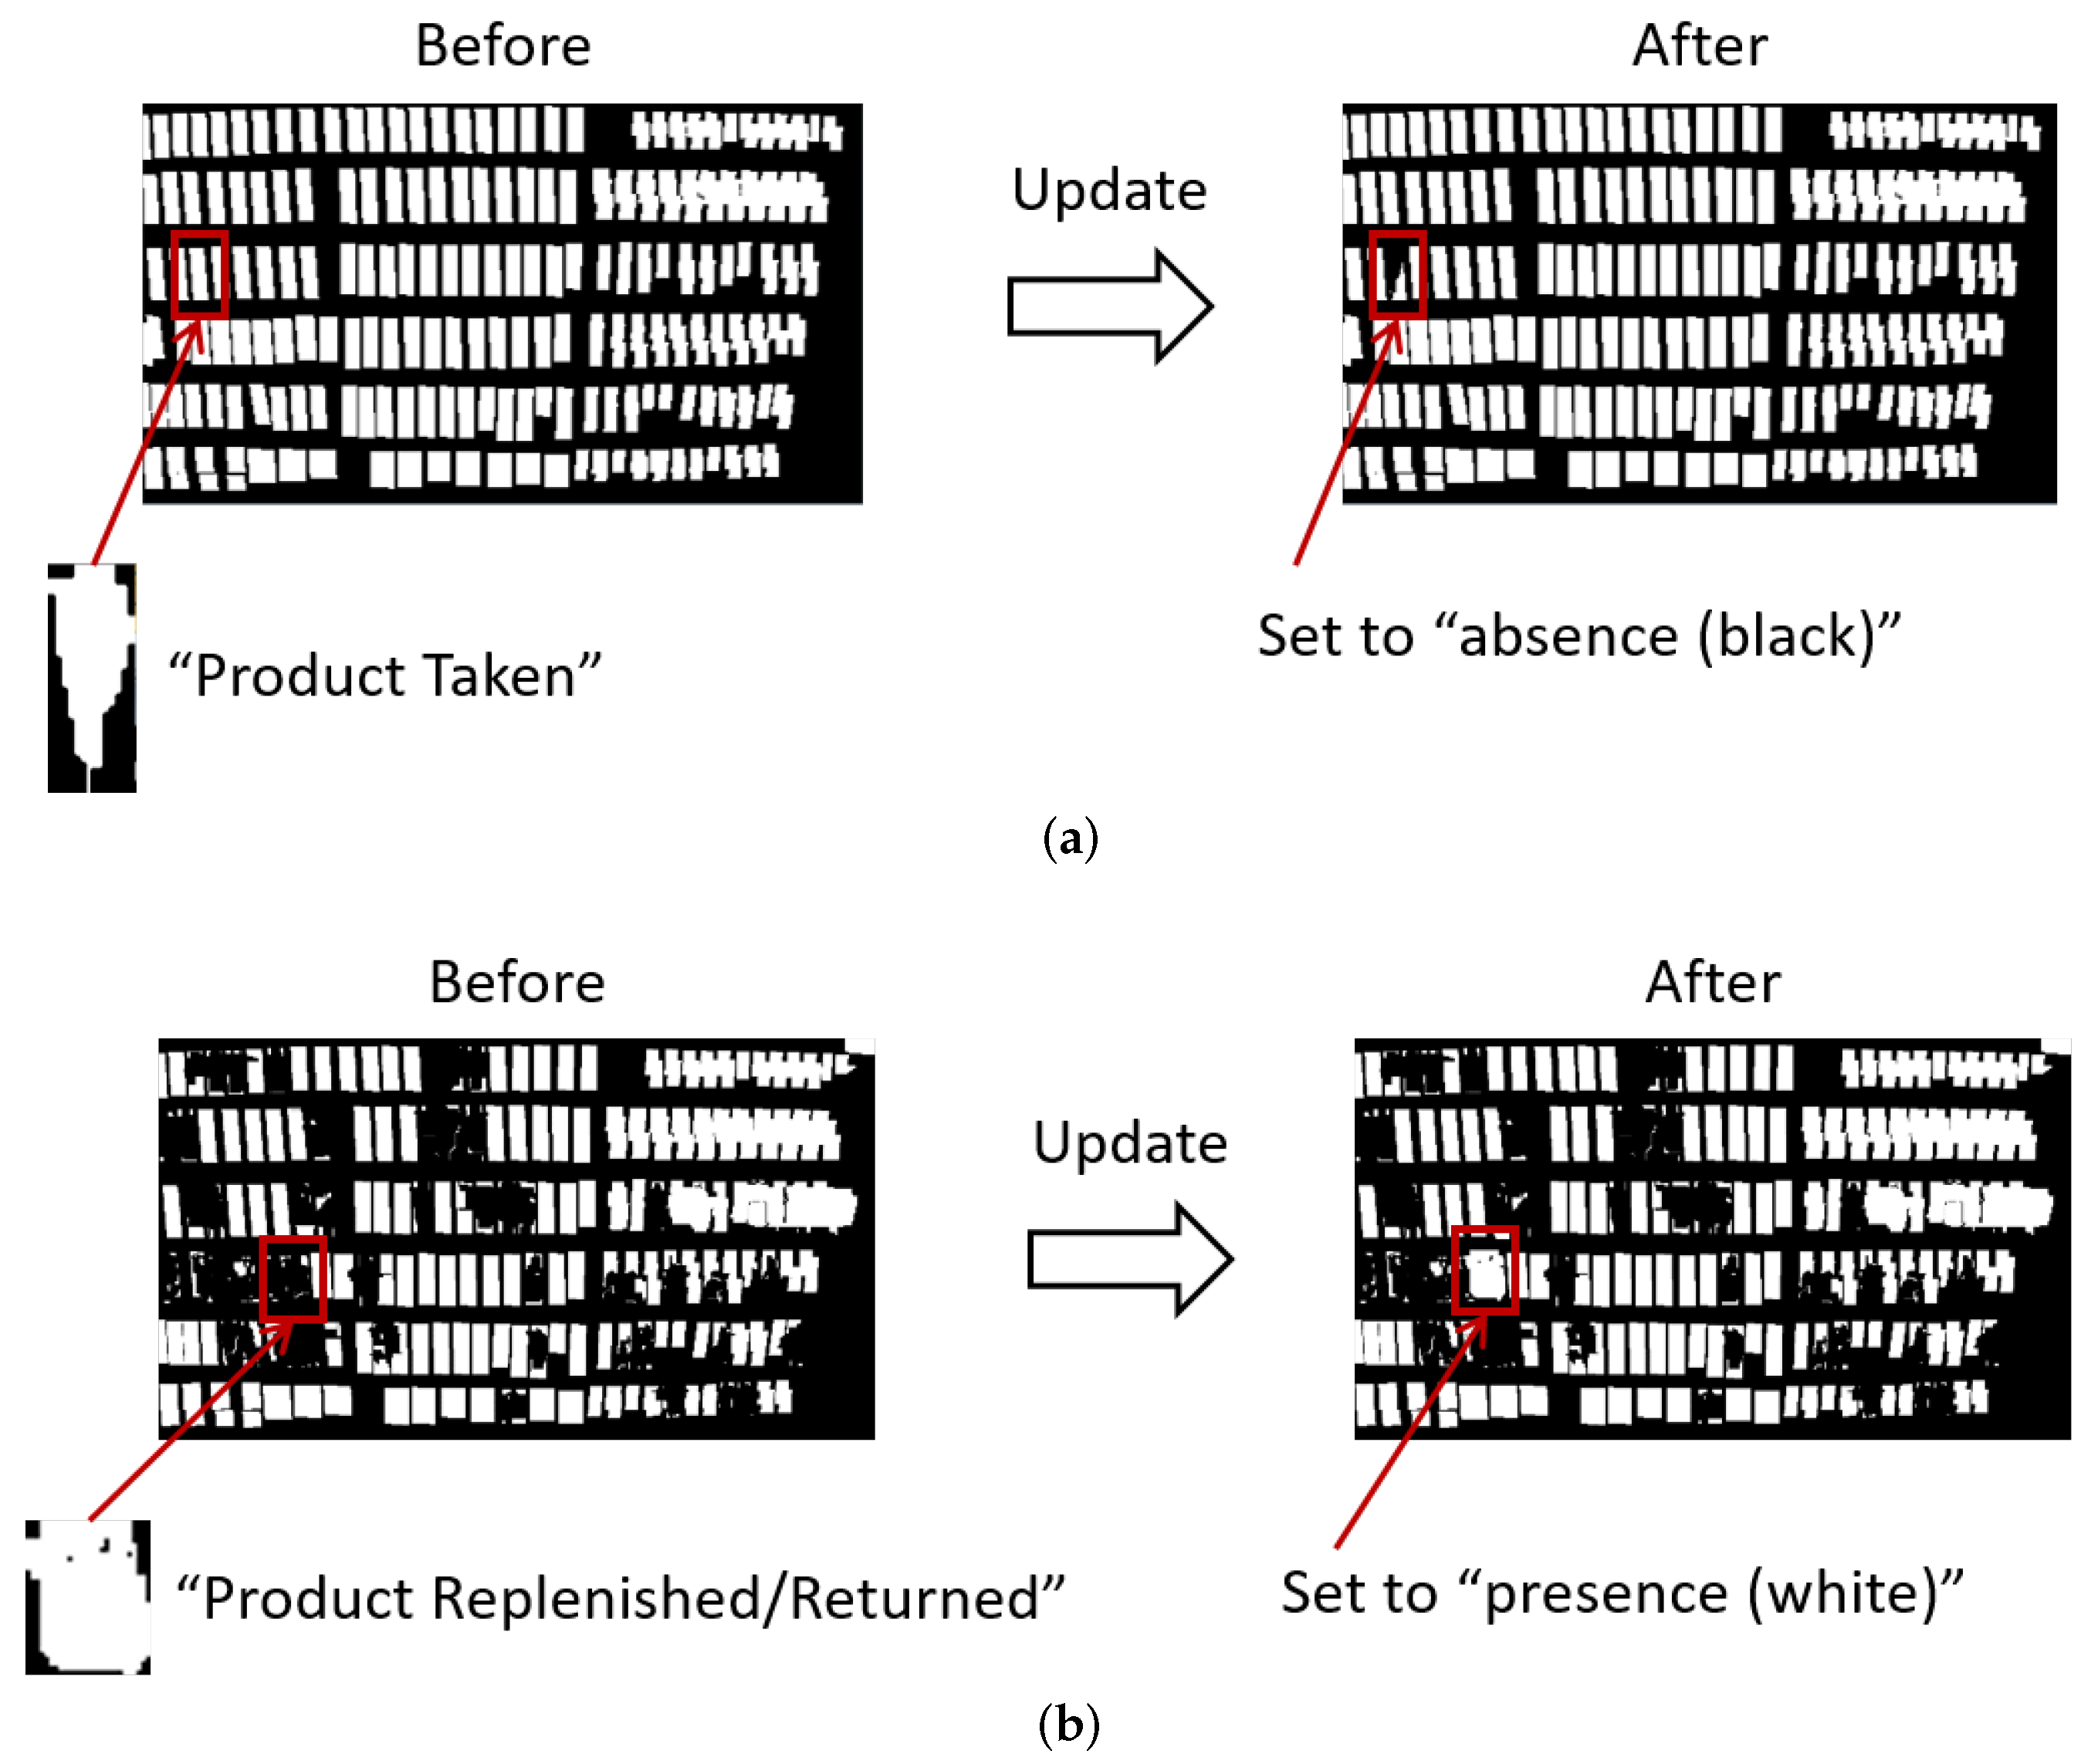
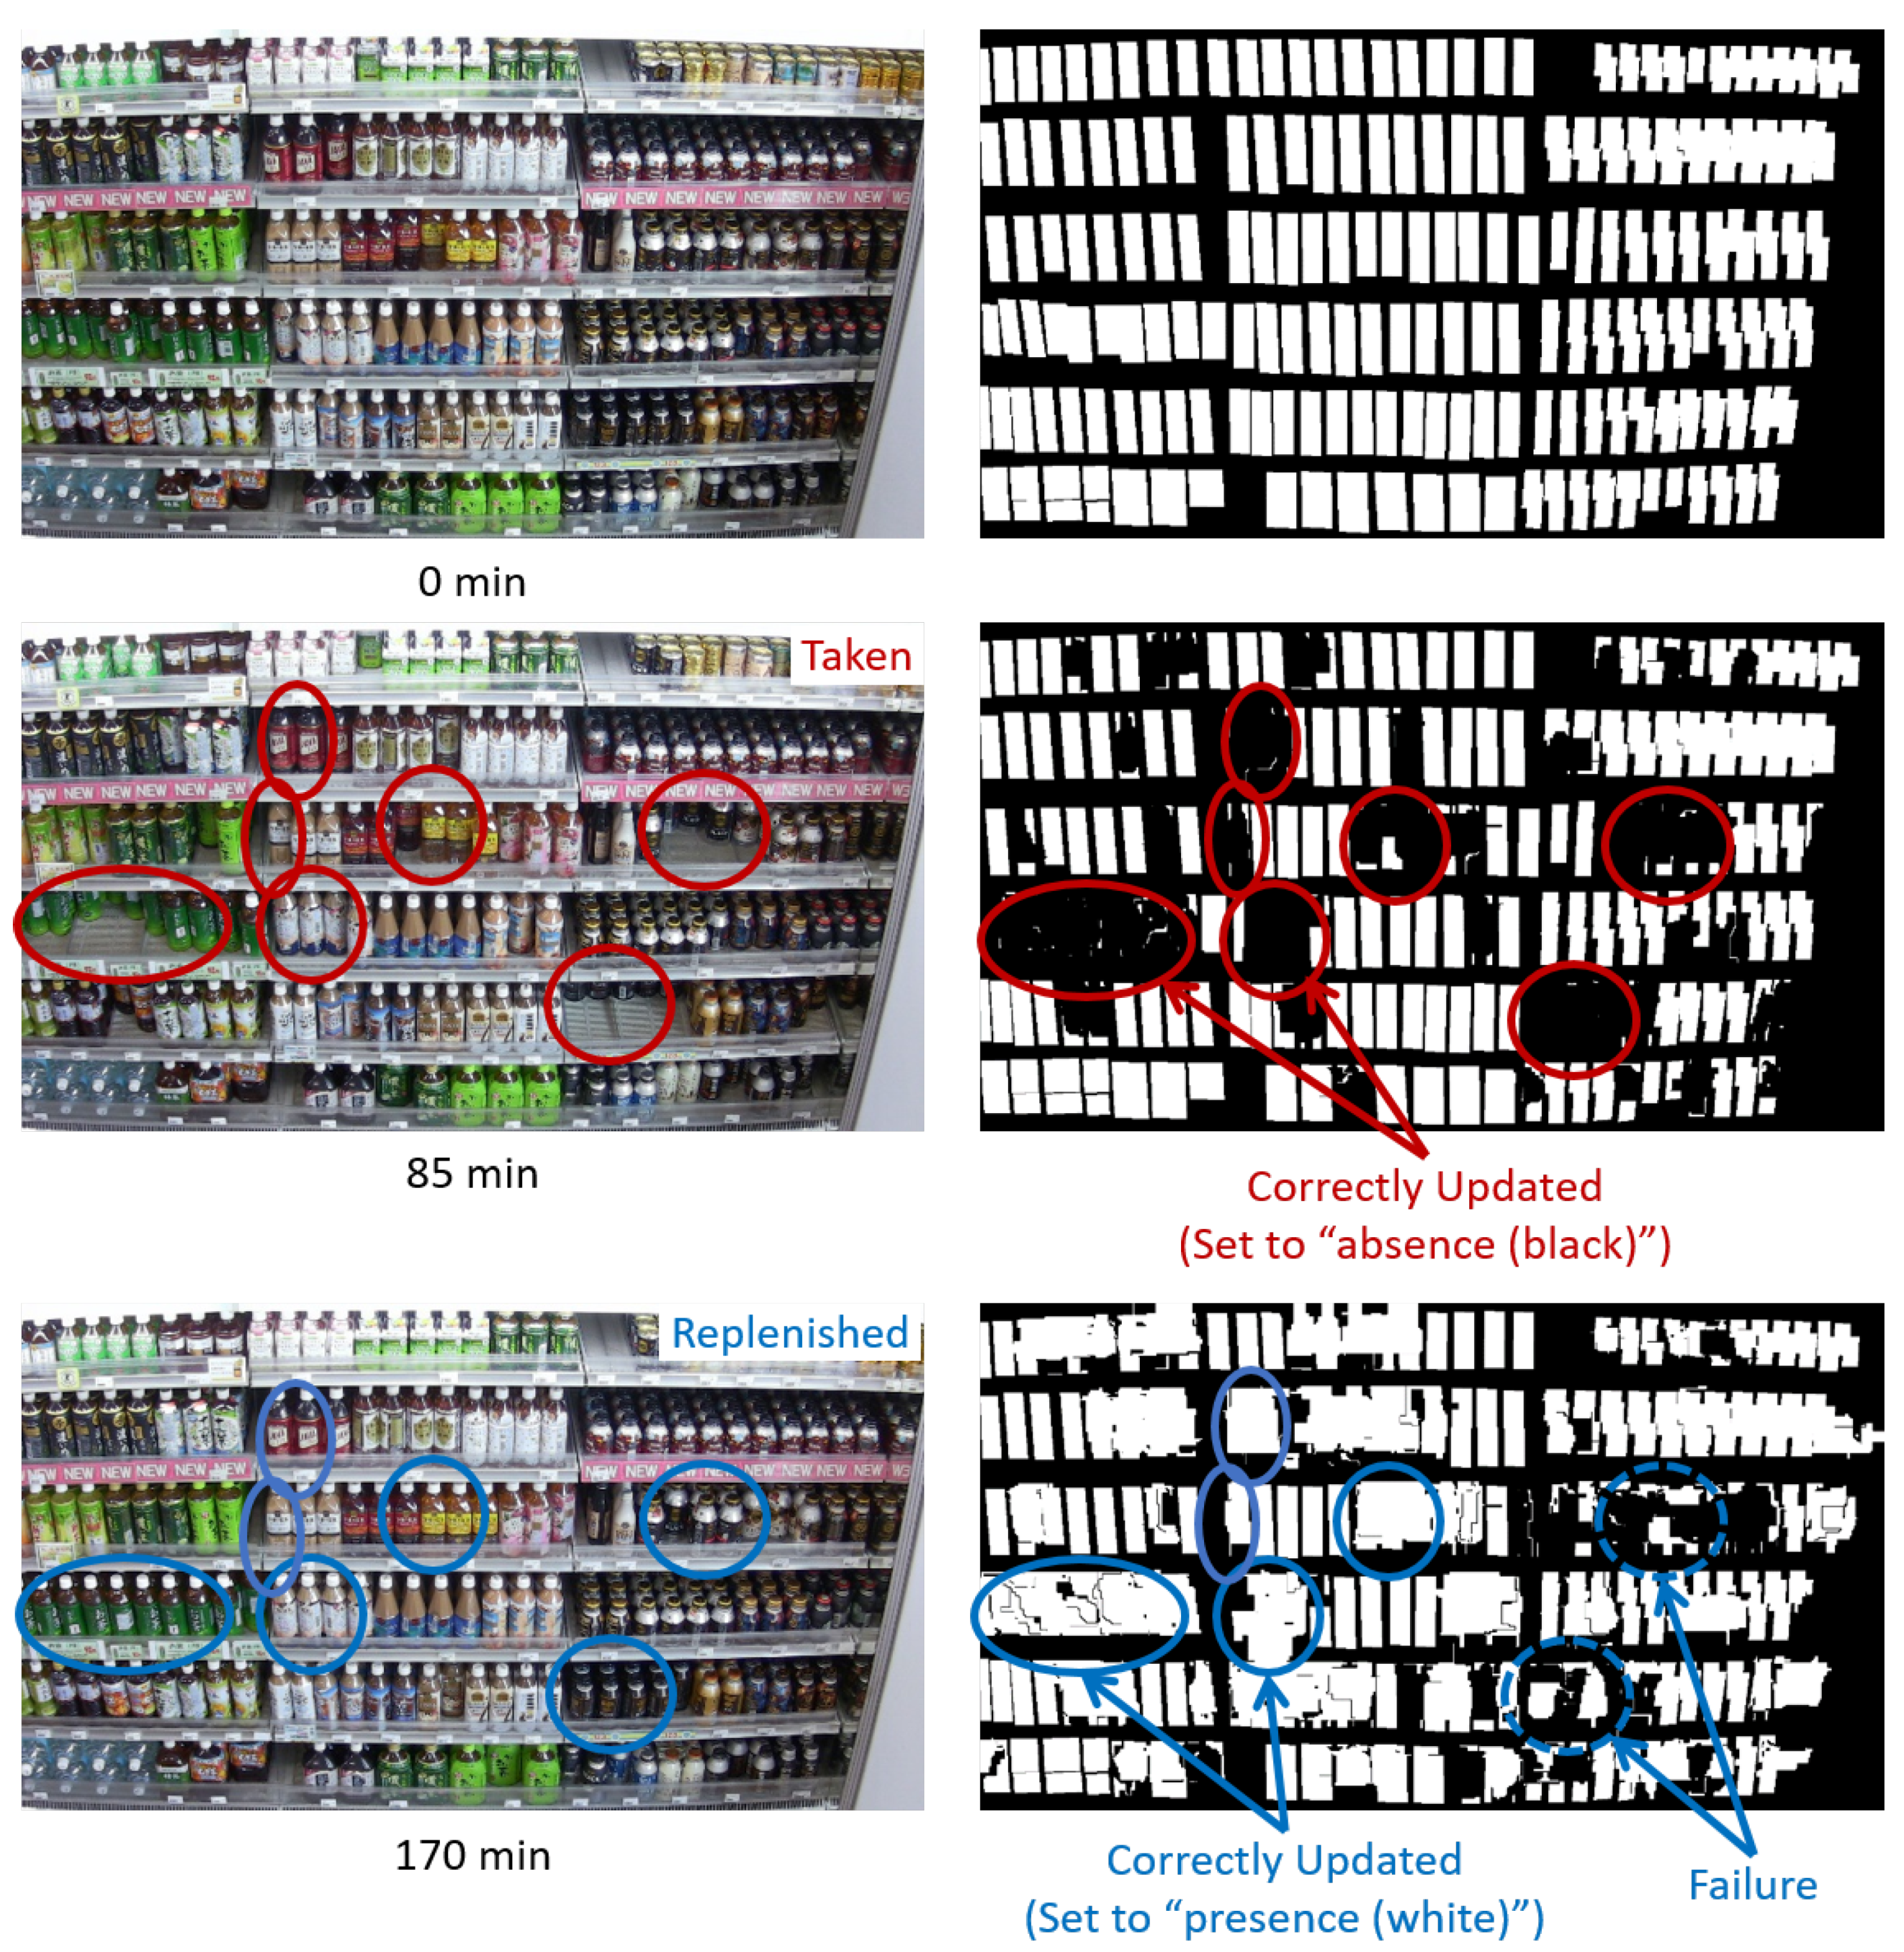
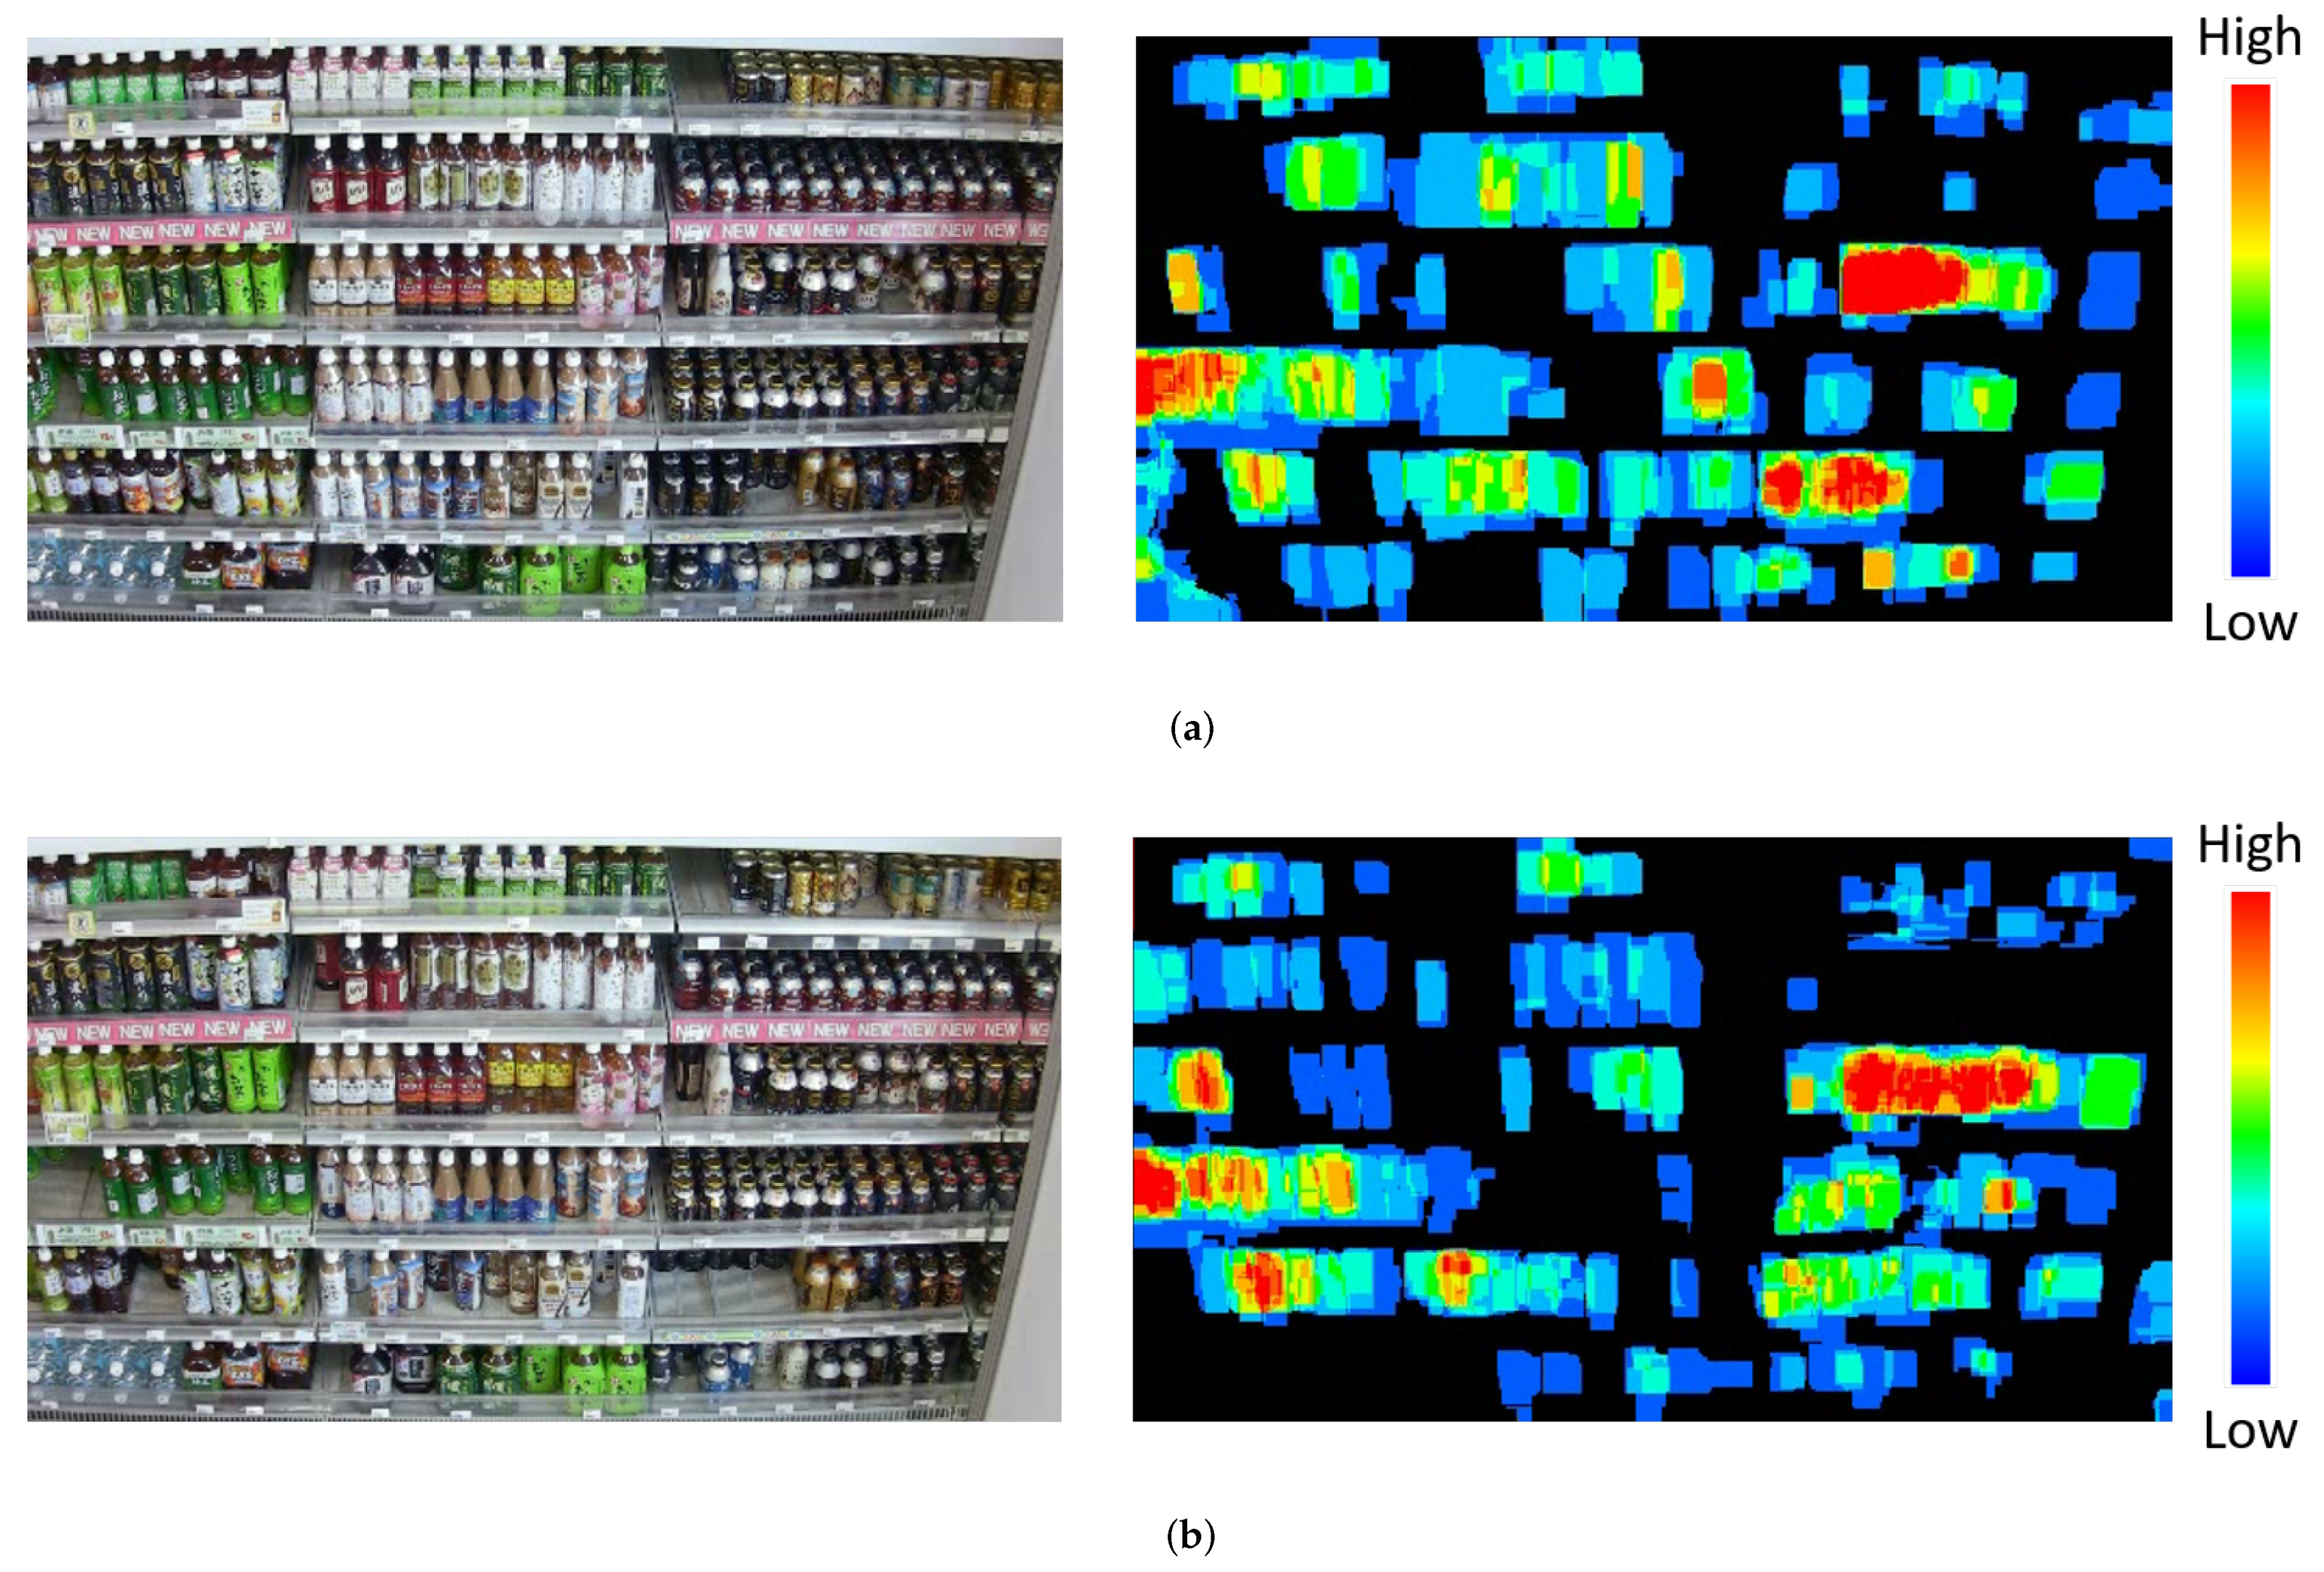
3.4. Update of Product Amount
4. Experiments
4.1. Experimental Conditions
4.2. Experiment 1: Comparison of Networks for Product Change Classification
4.3. Experiment 2: Evaluation of Effectiveness for Product Change Classification
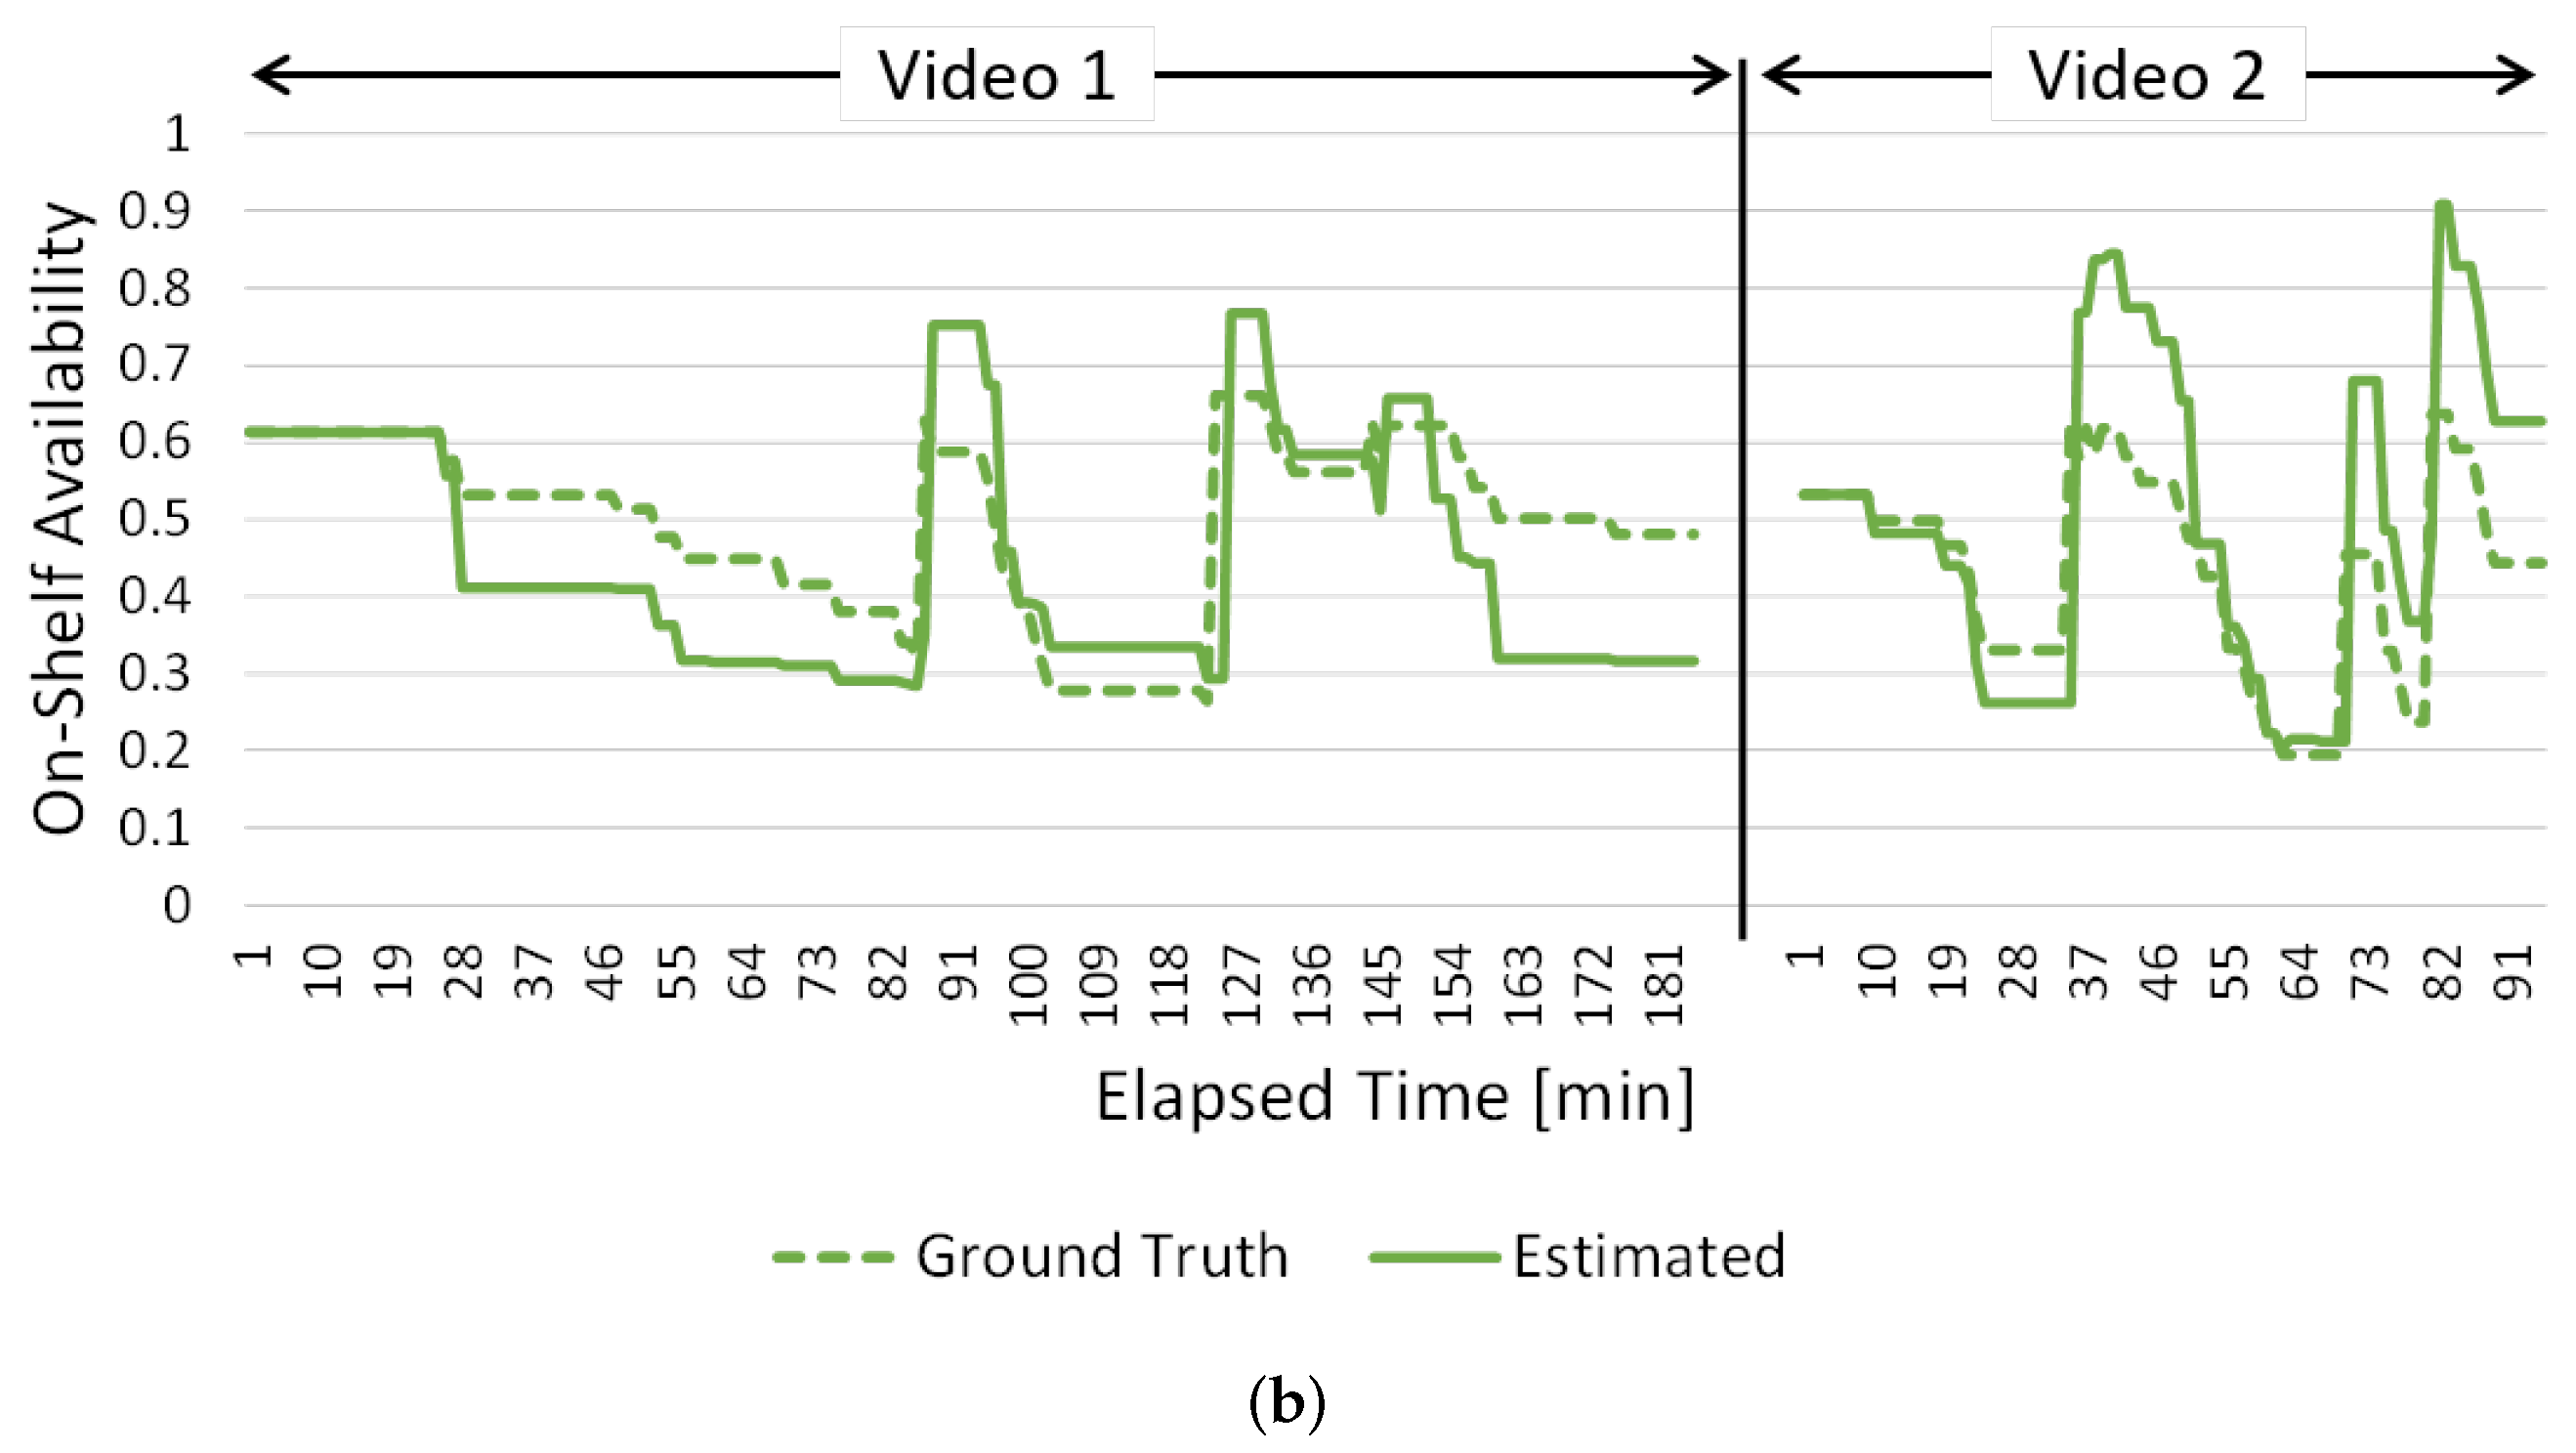
4.4. Experiment 3: Comparison of Proposed and Conventional Methods
4.5. Discussion
5. Conclusions
Author Contributions
Funding
Conflicts of Interest
References
- Mitchell, A. Improving on-Shelf Availability; White Paper; SymphonyIRIGroup: Chicago, IL, USA, 2011. [Google Scholar]
- Moorthy, R.; Behera, S.; Verma, S. On-shelf availability in retailing. Int. J. Comput. Appl. 2015, 116, 47–51. [Google Scholar] [CrossRef]
- Kejriwal, N.; Garg, S.; Kumar, S. Product counting using images with application to robot-based retail stock assessment. In Proceedings of the 7th Annual IEEE International Conference on Technologies for Practical Robot Applications, Woburn, MA, USA, 11–12 May 2015; pp. 1–6. [Google Scholar]
- Rosado, L.; Gonçalves, J.; Costa, J.; Ribeiro, D.; Soares, F. Supervised learning for out-of-stock detection in panoramas of retail shelves. In Proceedings of the IEEE International Conference on Imaging Systems and Techniques, Chania, Greece, 4–6 October 2016; pp. 406–411. [Google Scholar]
- Bay, H.; Ess, A.; Tuytelaars, T.; Gool, L.V. Speeded-up robust features (SURF). Comput. Vis. Image Underst. 2008, 110, 346–359. [Google Scholar] [CrossRef]
- Rosten, E.; Poter, R.; Drummond, T. Faster and better: A machine learning approach to corner detection. IEEE Trans. Pattern Anal. Mach. Intell. 2010, 32, 105–119. [Google Scholar] [CrossRef] [PubMed]
- Higa, K.; Iwamoto, K. Robust estimation of product amount on store shelves from a surveillance camera for improving on-shelf availability. In Proceedings of the IEEE International Conference on Imaging Systems and Techniques, Kraków, Poland, 16–18 October 2018; pp. 164–169. [Google Scholar]
- Liu, S.; Tian, H. Planogram compliance checking using recurring patterns. In Proceedings of the IEEE International Symposium on Multimedia, Miami, FL, USA, 14–16 December 2015; pp. 27–32. [Google Scholar]
- Liu, S.; Li, W.; Davis, S.; Ritz, C.; Tian, H. Planogram compliance checking based on detection of recurring patterns. IEEE Multimed. 2016, 23, 54–63. [Google Scholar] [CrossRef]
- Saran, A.; Hassa, E.; Maurya, A.K. Robust visual analysis for planogram compliance problem. In Proceedings of the 14th IAPR International Conference on Machine Vision Applications, Tokyo, Japan, 18–22 May 2015; pp. 576–579. [Google Scholar]
- Calì, M.; Ambu, R. Advanced 3D photogrammetric surface reconstruction of extensive objects by UAV camera image acquisition. Sensors 2018, 18, 2815. [Google Scholar] [CrossRef] [PubMed]
- Moorthy, R.; Behera, S.; Verma, S.; Bhargave, S.; Ramanathan, P. Applying image processing for detecting on-shelf availability and product positioning in retail stores. In Proceedings of the 3rd International Symposium on Women in Computing and Informatics, Kochi, India, 10–13 August 2015; pp. 451–457. [Google Scholar]
- Satapathy, R.; Prahlad, S.; Kaulgud, V. Smart shelfie—Internet of shelves: For higher on-shelf availability. In Proceedings of the IEEE Region 10 Symposium, Ahmedabad, India, 13–15 May 2015; pp. 70–73. [Google Scholar]
- Bao, R.; Higa, K.; Iwamoto, K. Local descriptor based multiple object instance identification using scale and rotation invariant implicit shape model. In Proceedings of the International Workshop on Robust Local Descriptors for Computer Vision, Singapore, 1–5 November 2014; pp. w6–w7. [Google Scholar]
- Iwamoto, K.; Mase, R.; Nomura, T. BRIGHT: A scalable and compact binary descriptor for low-latency and high accuracy object identification. In Proceedings of the 20th IEEE International Conference on Image Processing, Melbourne, Australia, 15–18 September 2013; pp. 2915–2919. [Google Scholar]
- Zhang, Q.; Qu, D.; Xu, F.; Jia, K.; Sun, X. Dual-Layer Density Estimation for Multiple Object Instance Detection. J. Sens. 2016, 2016, 1–12. [Google Scholar] [CrossRef]
- Lowe, D.G. Distinctive image features from scale-invariant keypoints. Int. J. Comput. Vis. 2004, 60, 91–110. [Google Scholar] [CrossRef]
- Scovanner, P.; Ali, S.; Shah, M. A 3-dimensional sift descriptor and its application to action recognition. In Proceedings of the 15th ACM International Conference on Multimedia, Augsburg, Germany, 25–29 September 2007; pp. 357–360. [Google Scholar]
- Zivkovic, Z. Improved adaptive Gaussian mixture model for background subtraction. In Proceedings of the 17th International Conference on Pattern Recognition, Cambridge, UK, 23–26 August 2004; Volume 2, pp. 28–31. [Google Scholar]
- KaewTraKulPong, P.; Bowden, R. An improved adaptive background mixture model for real-time tracking with shadow detection. In Video-Based Surveillance Systems; Remagnino, P., Jones, G.A., Paragios, N., Regazzoni, C.S., Eds.; Springer: Boston, MA, USA, 2002; pp. 135–144. [Google Scholar]
- Godbehere, A.B.; Matsukawa, A.; Goldberg, K. Visual tracking of human visitors under variable-lighting conditions for a responsive audio art installation. In Proceedings of the American Control Conference, Montréal, QC, Canada, 27–29 June 2012; pp. 4305–4312. [Google Scholar]
- LeCun, Y.; Boser, B.; Denker, J.S.; Henderson, D.; Howard, R.E.; Hubbard, W.; Jackel, L.D. Backpropagation applied to handwritten zip code recognition. Neural Comput. 1989, 1, 541–551. [Google Scholar] [CrossRef]
- Munkres, J. Algorithms for the assignment and transportation problems. J. Soc. Ind. Appl. Math. 1957, 5, 32–38. [Google Scholar] [CrossRef]
- Zhao, J.; Gong, M.; Liu, J.; Jiao, L. Deep learning to classify difference image for image change detection. In Proceedings of the International Joint Conference on Neural Networks, Beijing, China, 6–11 July 2014; pp. 411–417. [Google Scholar]


| Class | Description | Product Amount |
|---|---|---|
| 1 | A product was taken. | decrease |
| 2 | A product was replenished by store clerks or returned by shoppers. | increase |
| 3 | A position or direction of a product slightly changed since a shopper touched it. | no change |
| 4 | It was a false positive unrelated to human movement, such as an illumination change. | no change |
| Video Length | Video 1 | 185 min |
|---|---|---|
| Video 2 | 95 min | |
| Resolution | 480 × 270 pixels (1/16 of Full HD) | |
| Frame Rate | 1 fps | |
| in Section 3.2 | 10 pixels |
| in Section 3.2 | 30 s |
| in Equation (1) | 1.0 |
| Kin Equation (3) | 32 |
| win Equation (6) | 1.0 |
| Class | Training Samples | Class | Training Samples |
|---|---|---|---|
| 1 | 16,038 | 3 | 1448 |
| 2 | 16,038 | 4 | 3486 |
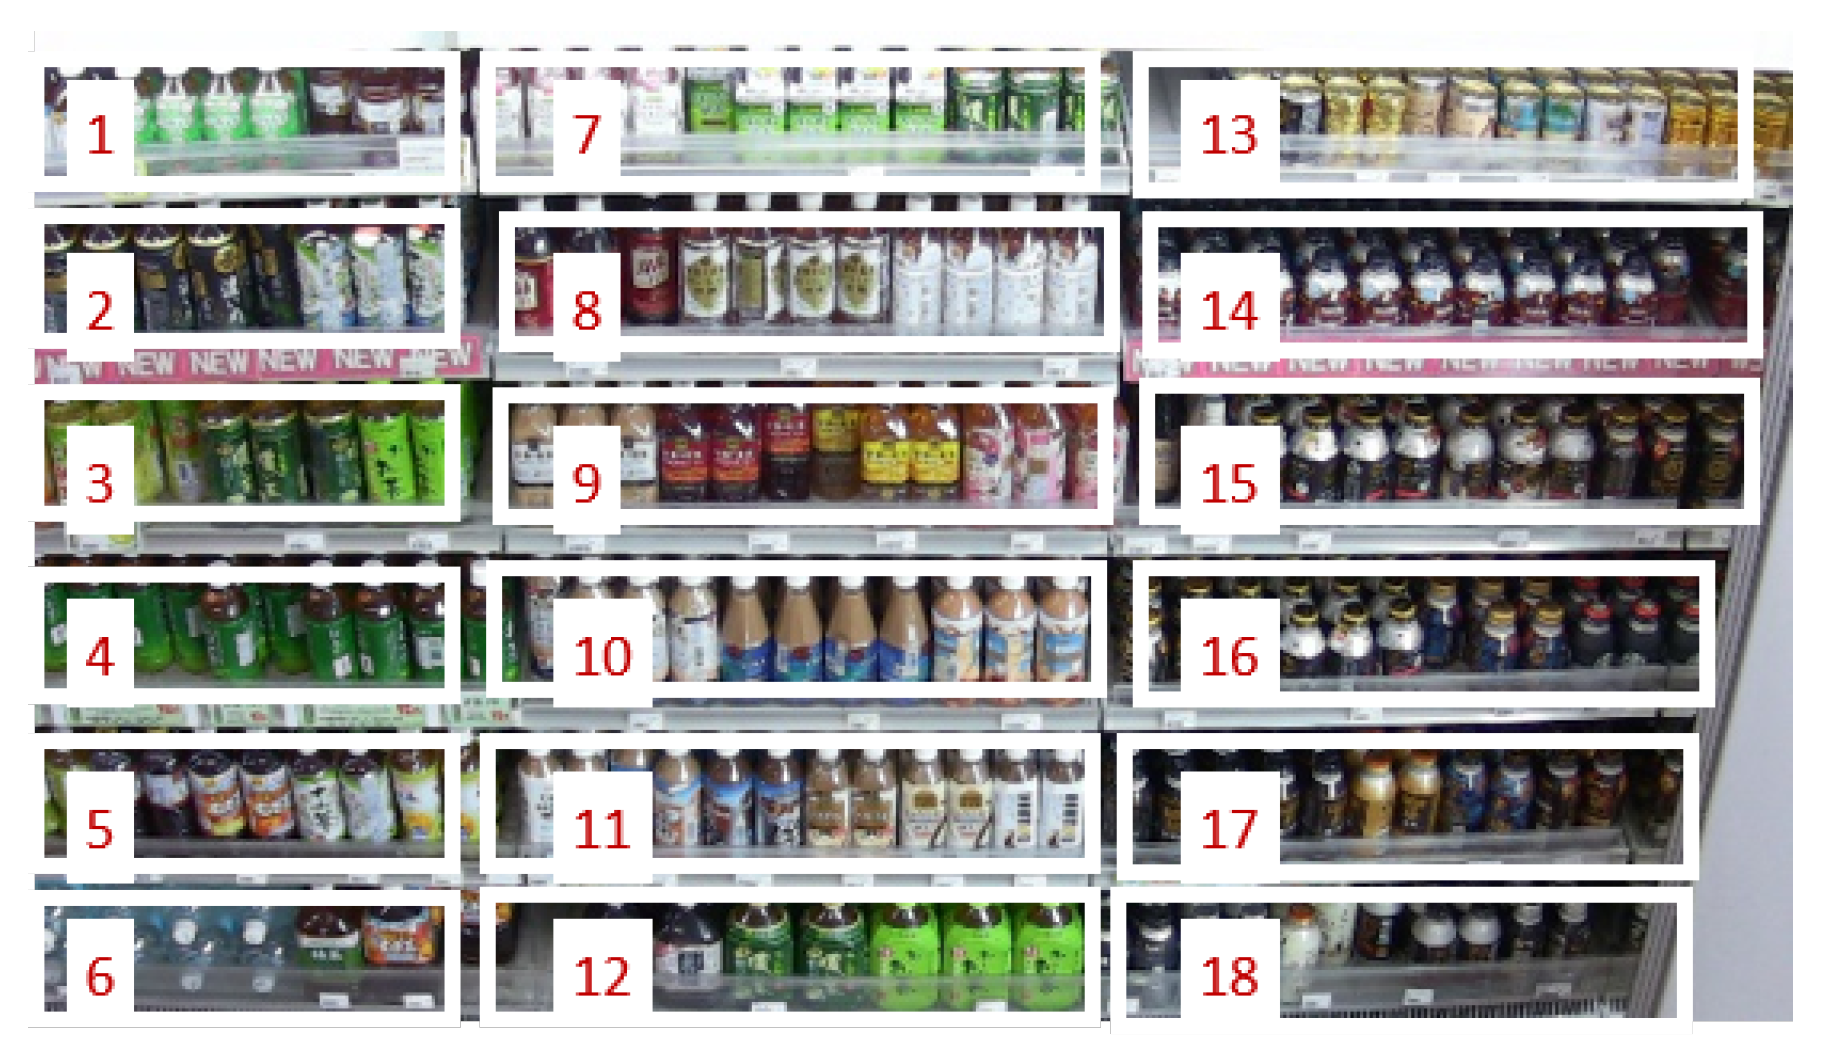
| Shelf Number | Success Rate | Shelf Number | Success Rate | Shelf Number | Success Rate |
|---|---|---|---|---|---|
| 1 | 77.7% | 7 | 100% | 13 | 99.3% |
| 2 | 80.6% | 8 | 83.3% | 14 | 100% |
| 3 | 99.6% | 9 | 97.1% | 15 | 51.4% |
| 4 | 87.4% | 10 | 98.2% | 16 | 90.3% |
| 5 | 80.6% | 11 | 88.8% | 17 | 96.0% |
| 6 | 99.6% | 12 | 99.3% | 18 | 83.5% |
© 2019 by the authors. Licensee MDPI, Basel, Switzerland. This article is an open access article distributed under the terms and conditions of the Creative Commons Attribution (CC BY) license (http://creativecommons.org/licenses/by/4.0/).
Share and Cite
Higa, K.; Iwamoto, K. Robust Shelf Monitoring Using Supervised Learning for Improving On-Shelf Availability in Retail Stores. Sensors 2019, 19, 2722. https://doi.org/10.3390/s19122722
Higa K, Iwamoto K. Robust Shelf Monitoring Using Supervised Learning for Improving On-Shelf Availability in Retail Stores. Sensors. 2019; 19(12):2722. https://doi.org/10.3390/s19122722
Chicago/Turabian StyleHiga, Kyota, and Kota Iwamoto. 2019. "Robust Shelf Monitoring Using Supervised Learning for Improving On-Shelf Availability in Retail Stores" Sensors 19, no. 12: 2722. https://doi.org/10.3390/s19122722
APA StyleHiga, K., & Iwamoto, K. (2019). Robust Shelf Monitoring Using Supervised Learning for Improving On-Shelf Availability in Retail Stores. Sensors, 19(12), 2722. https://doi.org/10.3390/s19122722