Machine Learning Techniques for Undertaking Roundabouts in Autonomous Driving


 ,
,  ,
, 
Abstract
1. Introduction
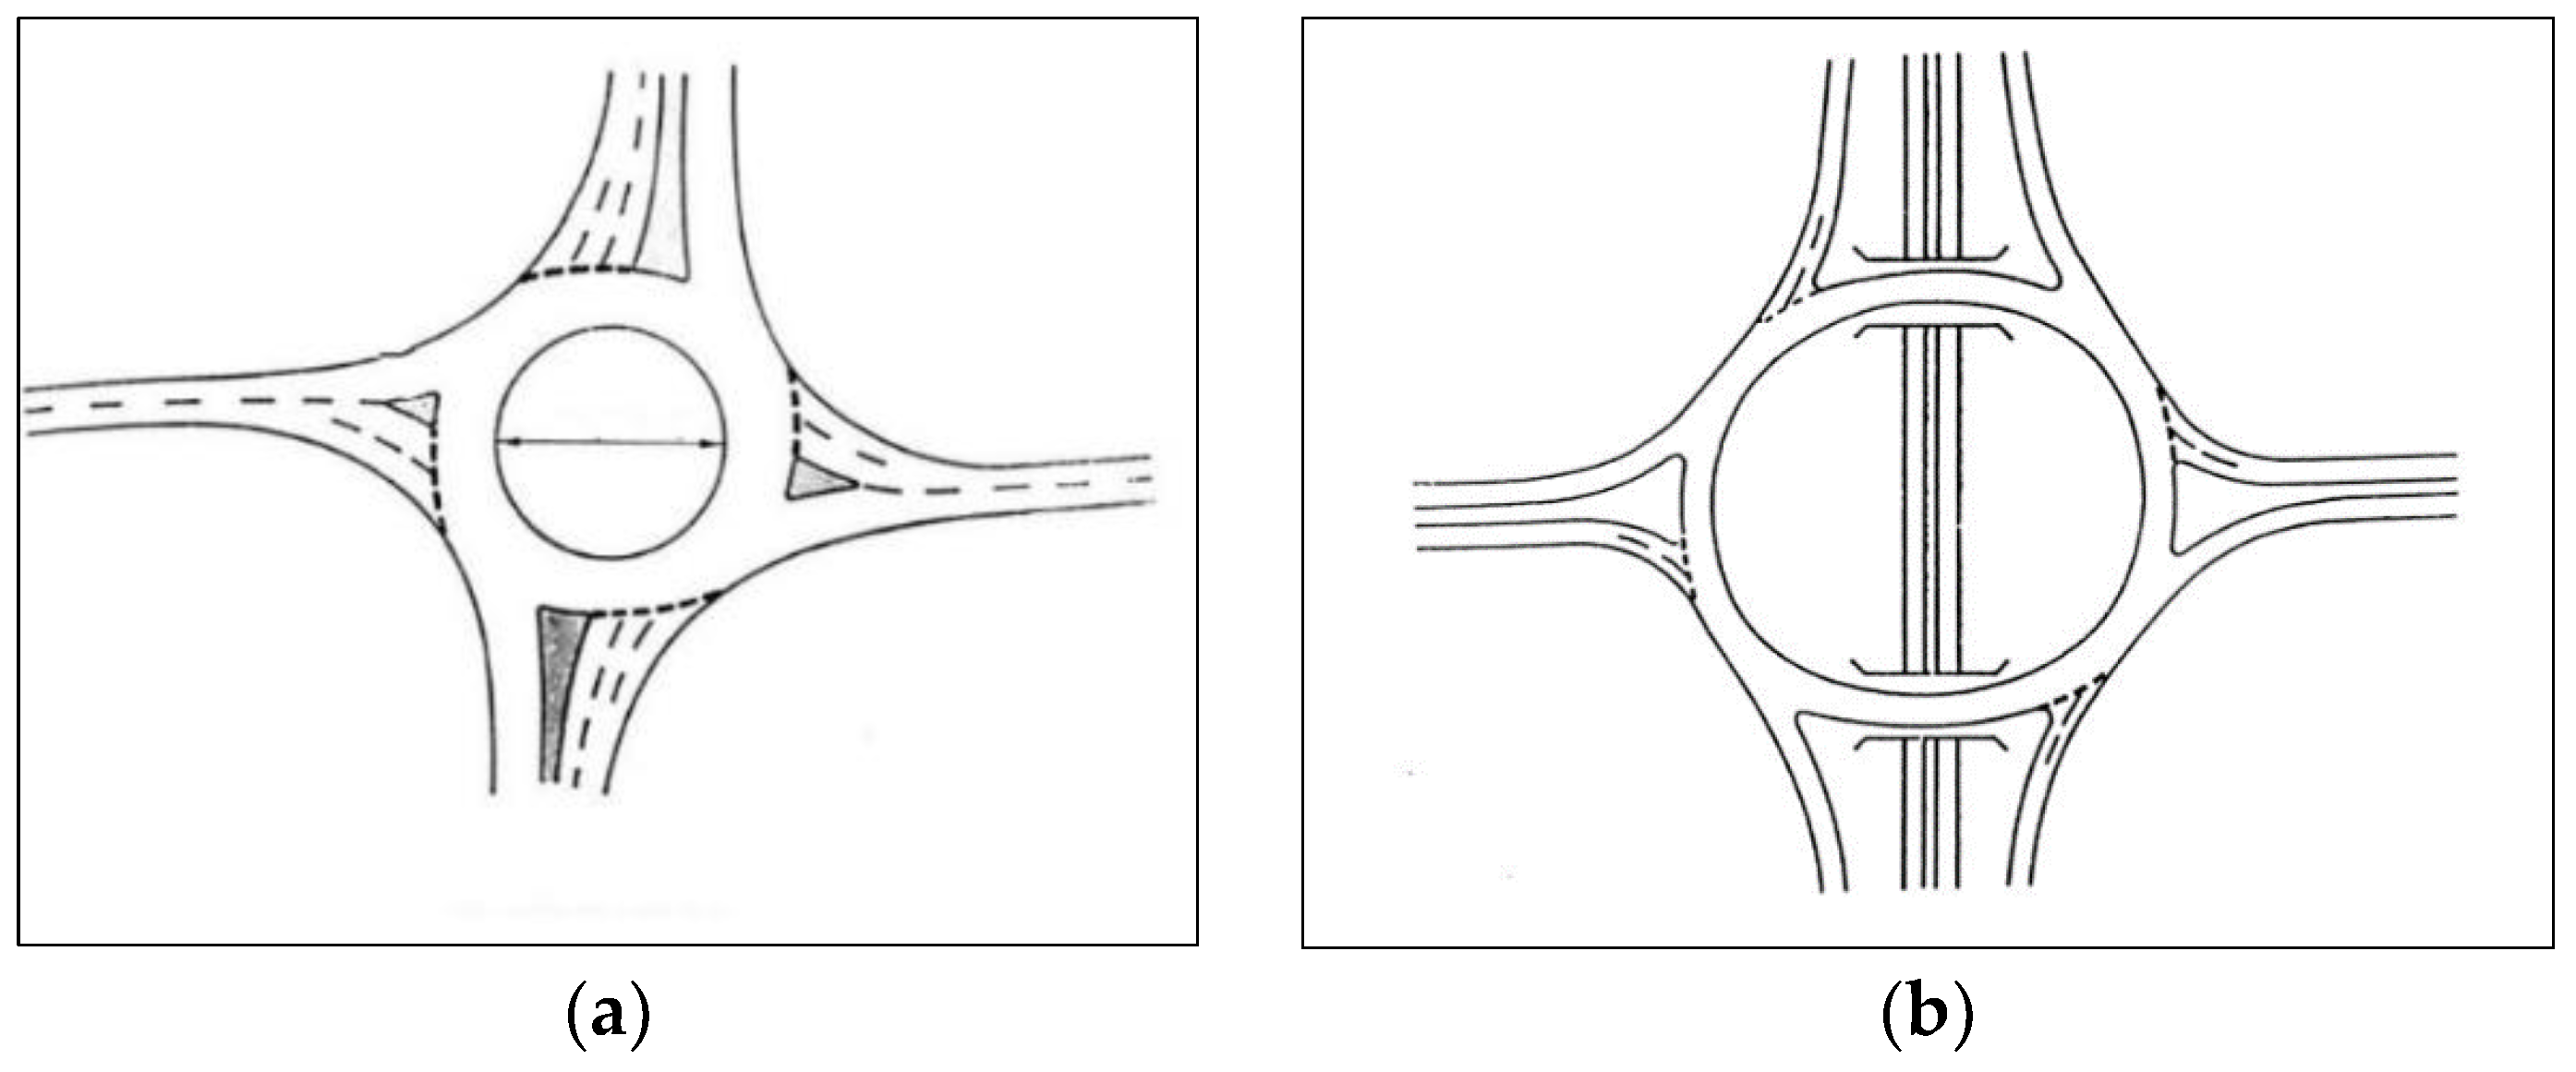
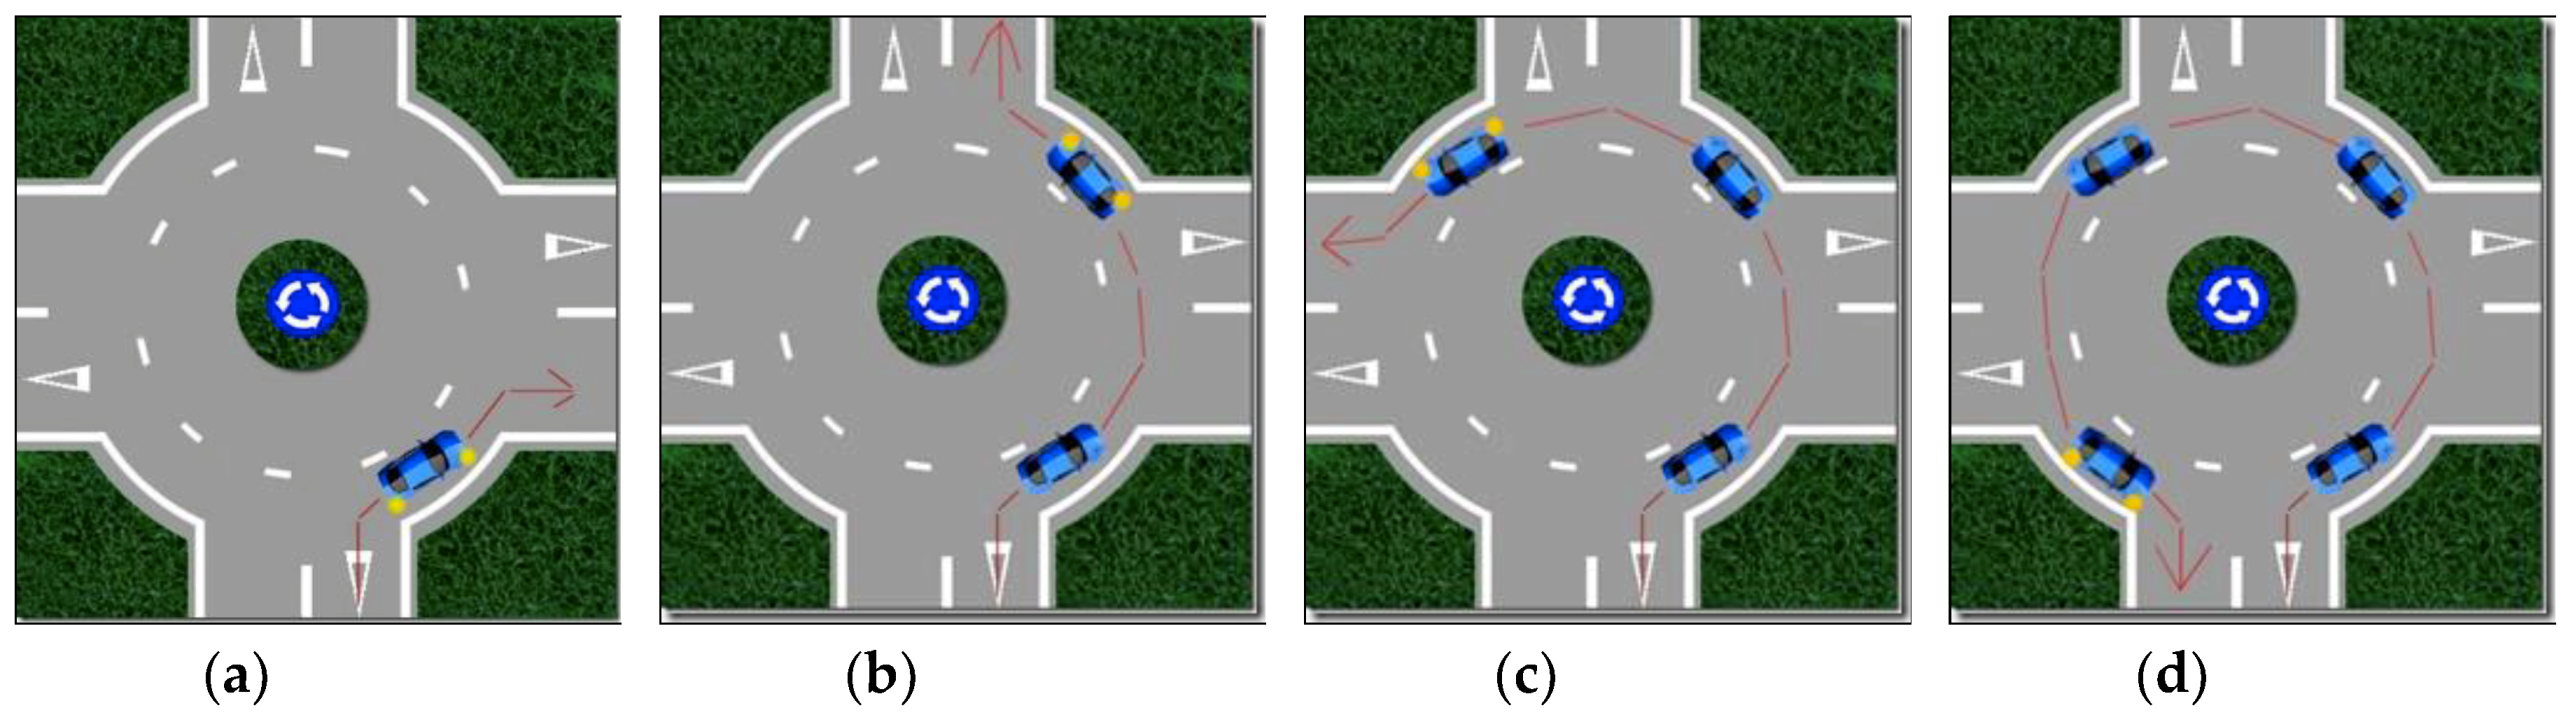
2. Roundabout Driving Rules in Spain
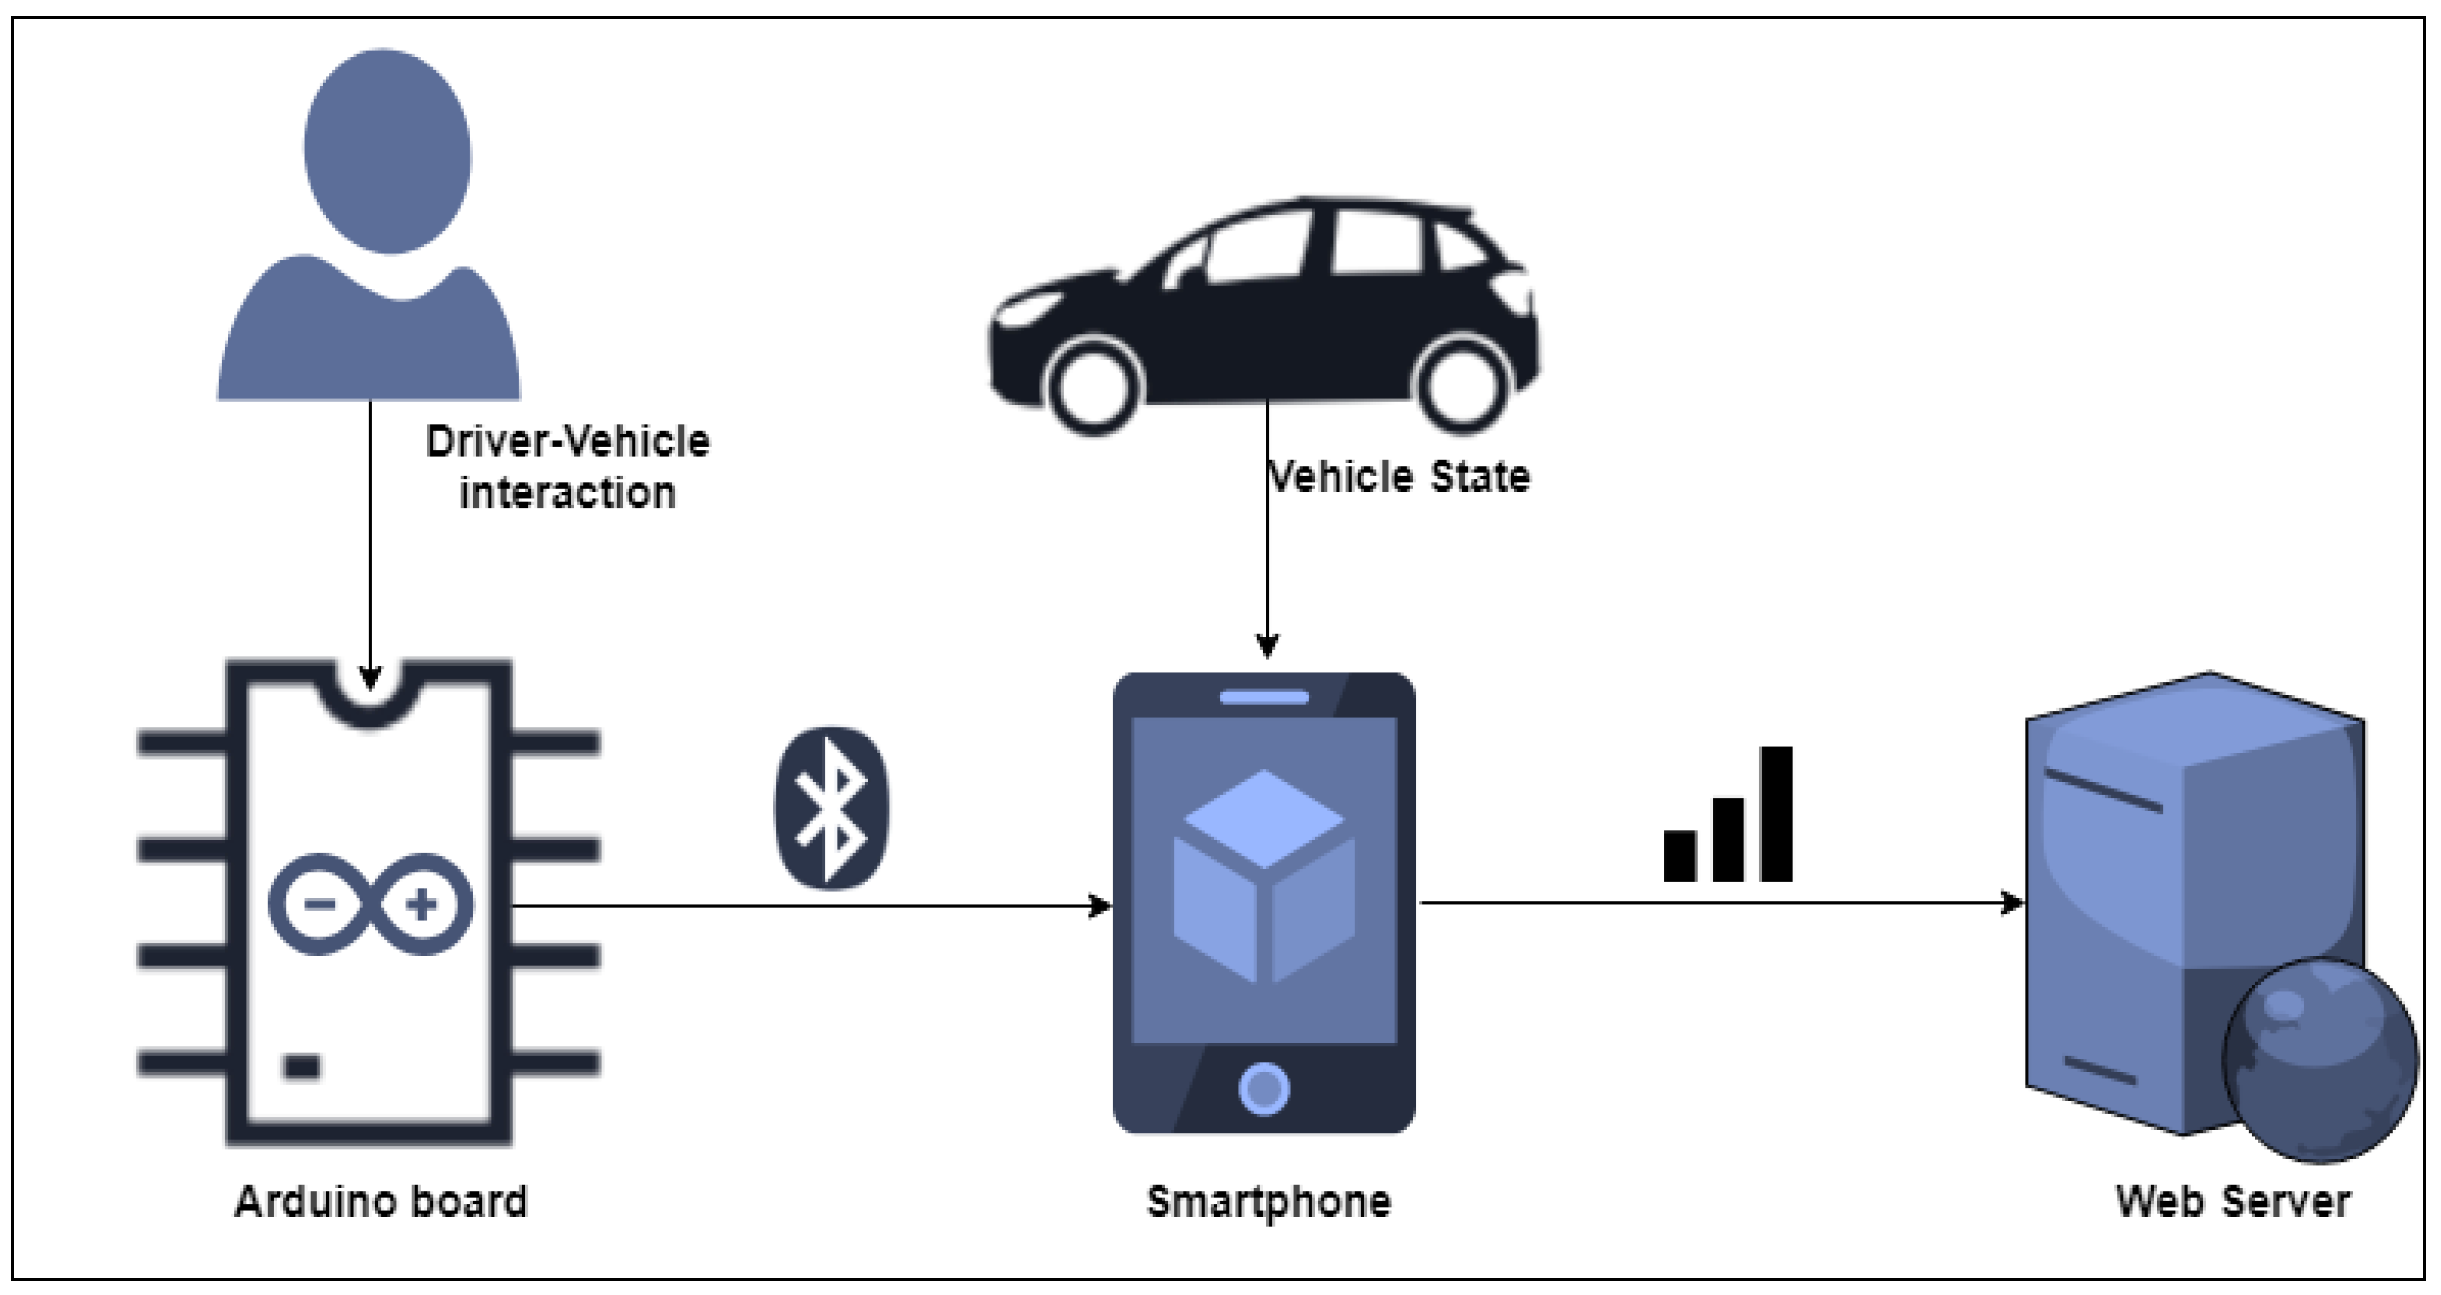
3. Hardware Setup for Data Collection
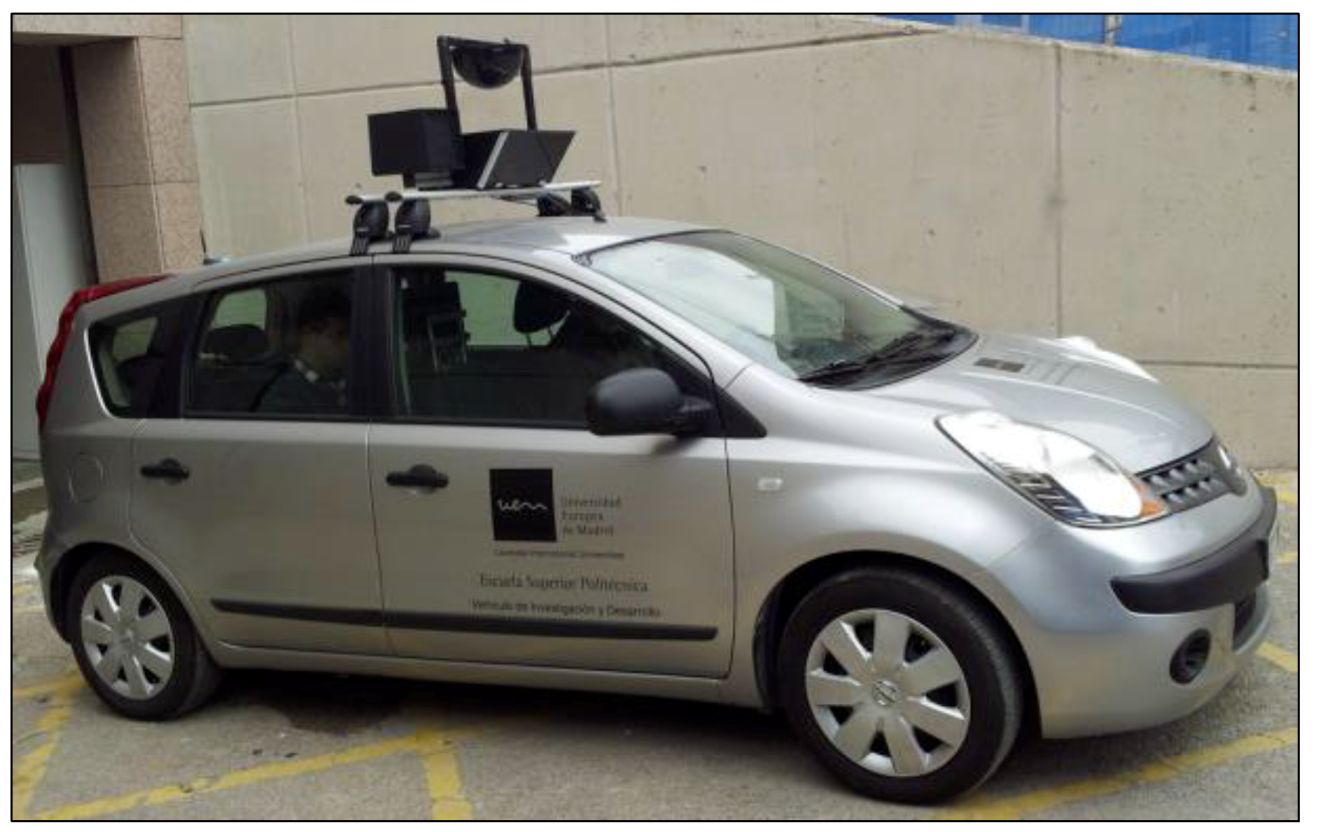
3.1. Vehicle Sensors
- Accelerator—measured in two states: the accelerator pedal is pressed or not.
- Brake—measured in two states: the brake pedal is pressed or not.
- Clutch—measured in two states: the clutch pedal is pressed or not.
- Direction rotation—measured in decimal values of the direction spin. In the vehicle used, the angles of the wheels with respect to the longitudinal axis of the vehicle were –40 to 40. An encoder with 128 states (EAW-Absolute contacting encoder), which offers a resolution of 0.625 with respect to the orientation of the guiding wheels, was used.
- Left blinker—measured in two states: the left blinker is active or not.
- Right-flashing—measured in two states: the right blinker is active or not.
- Emergency lights—measured in two states: emergency lights are active or not.
- Auxiliary pushbuttons 1 and 2—measures in two states: the button is active or not. They can be used for many purposes and are located on the dashboard in a very accessible position for the driver and co-driver.
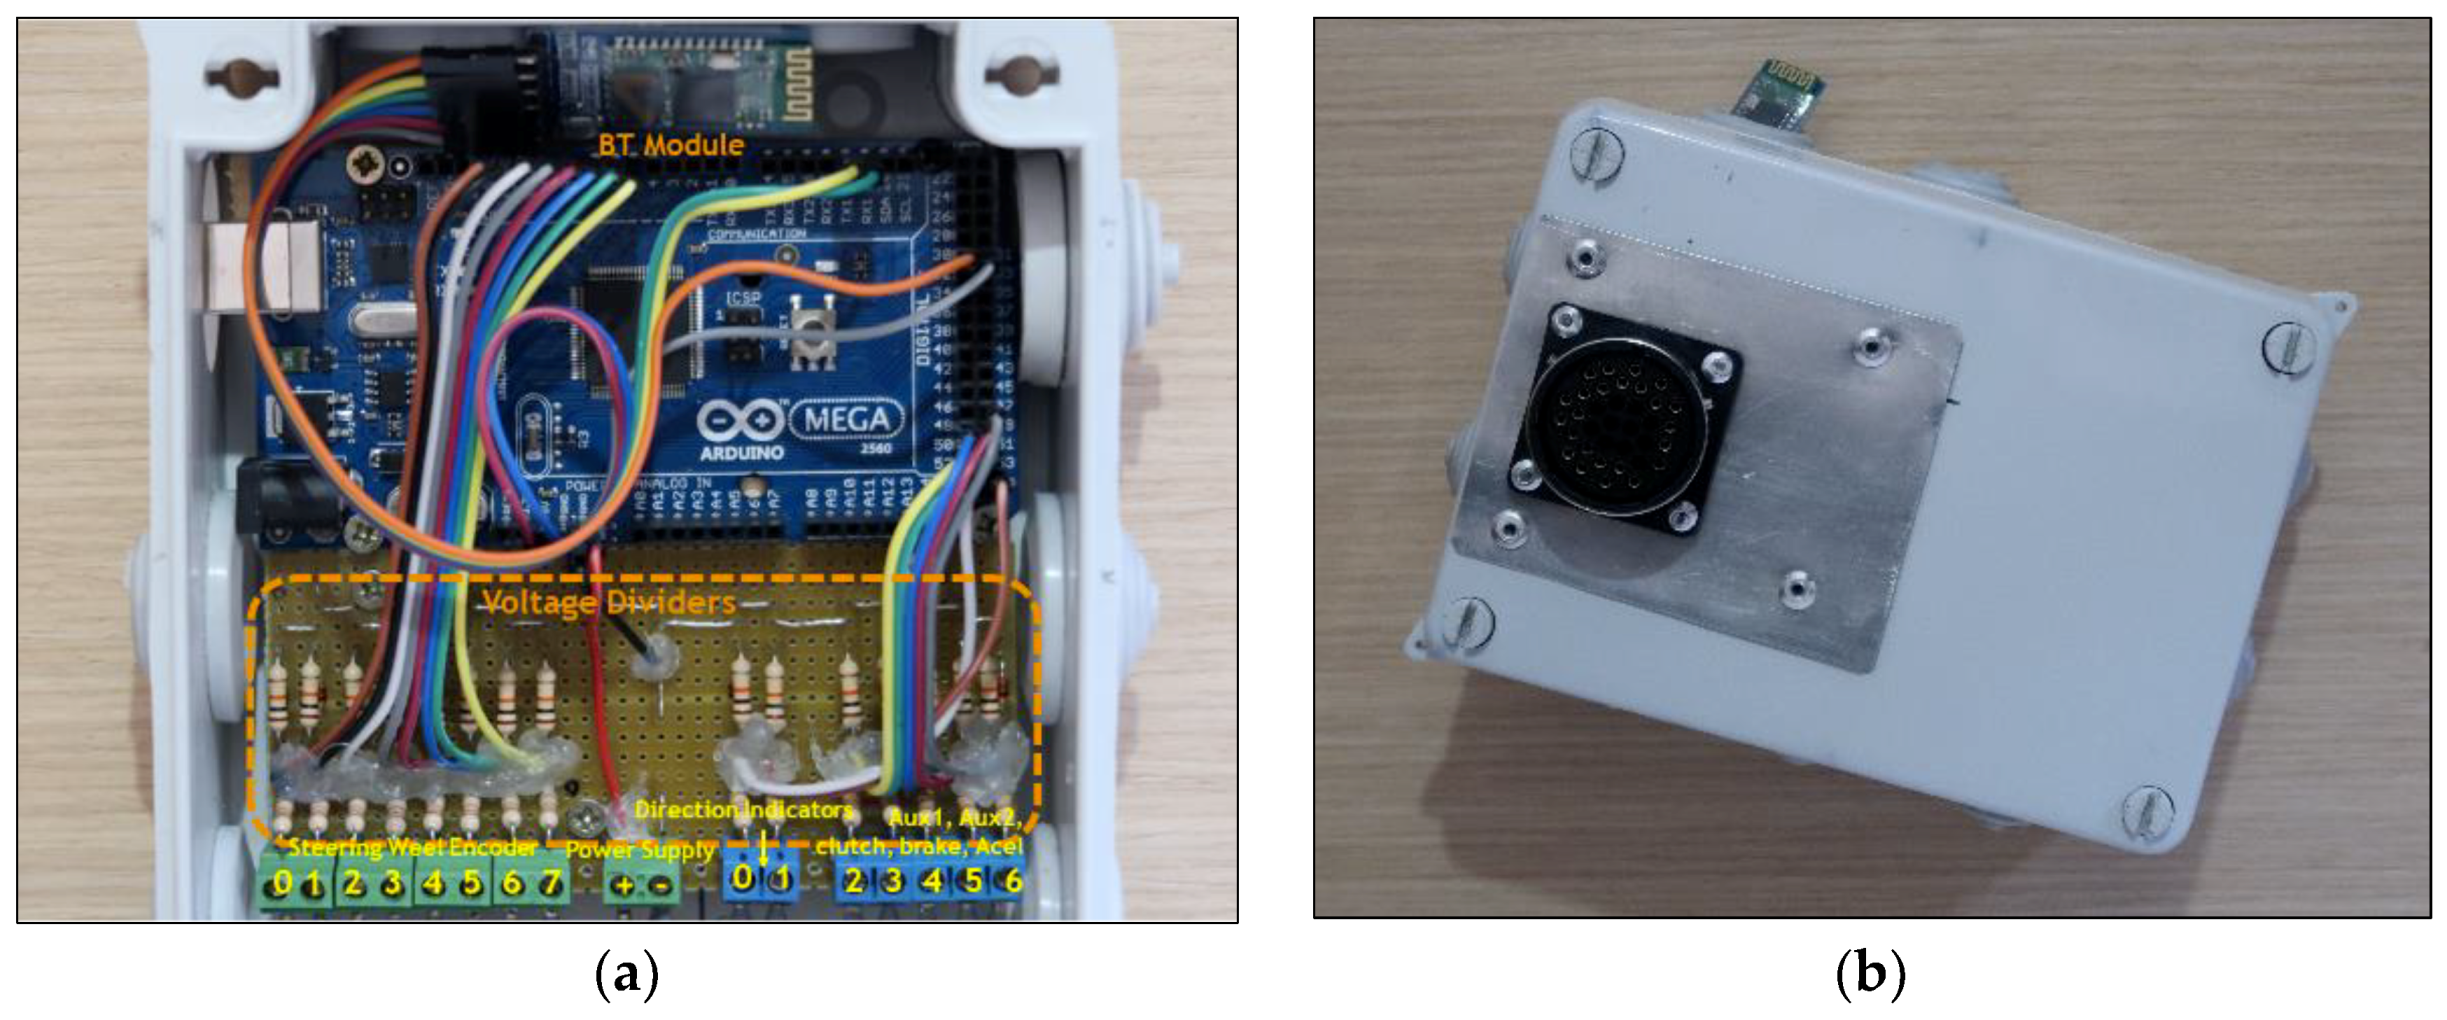
3.2. Arduino Board
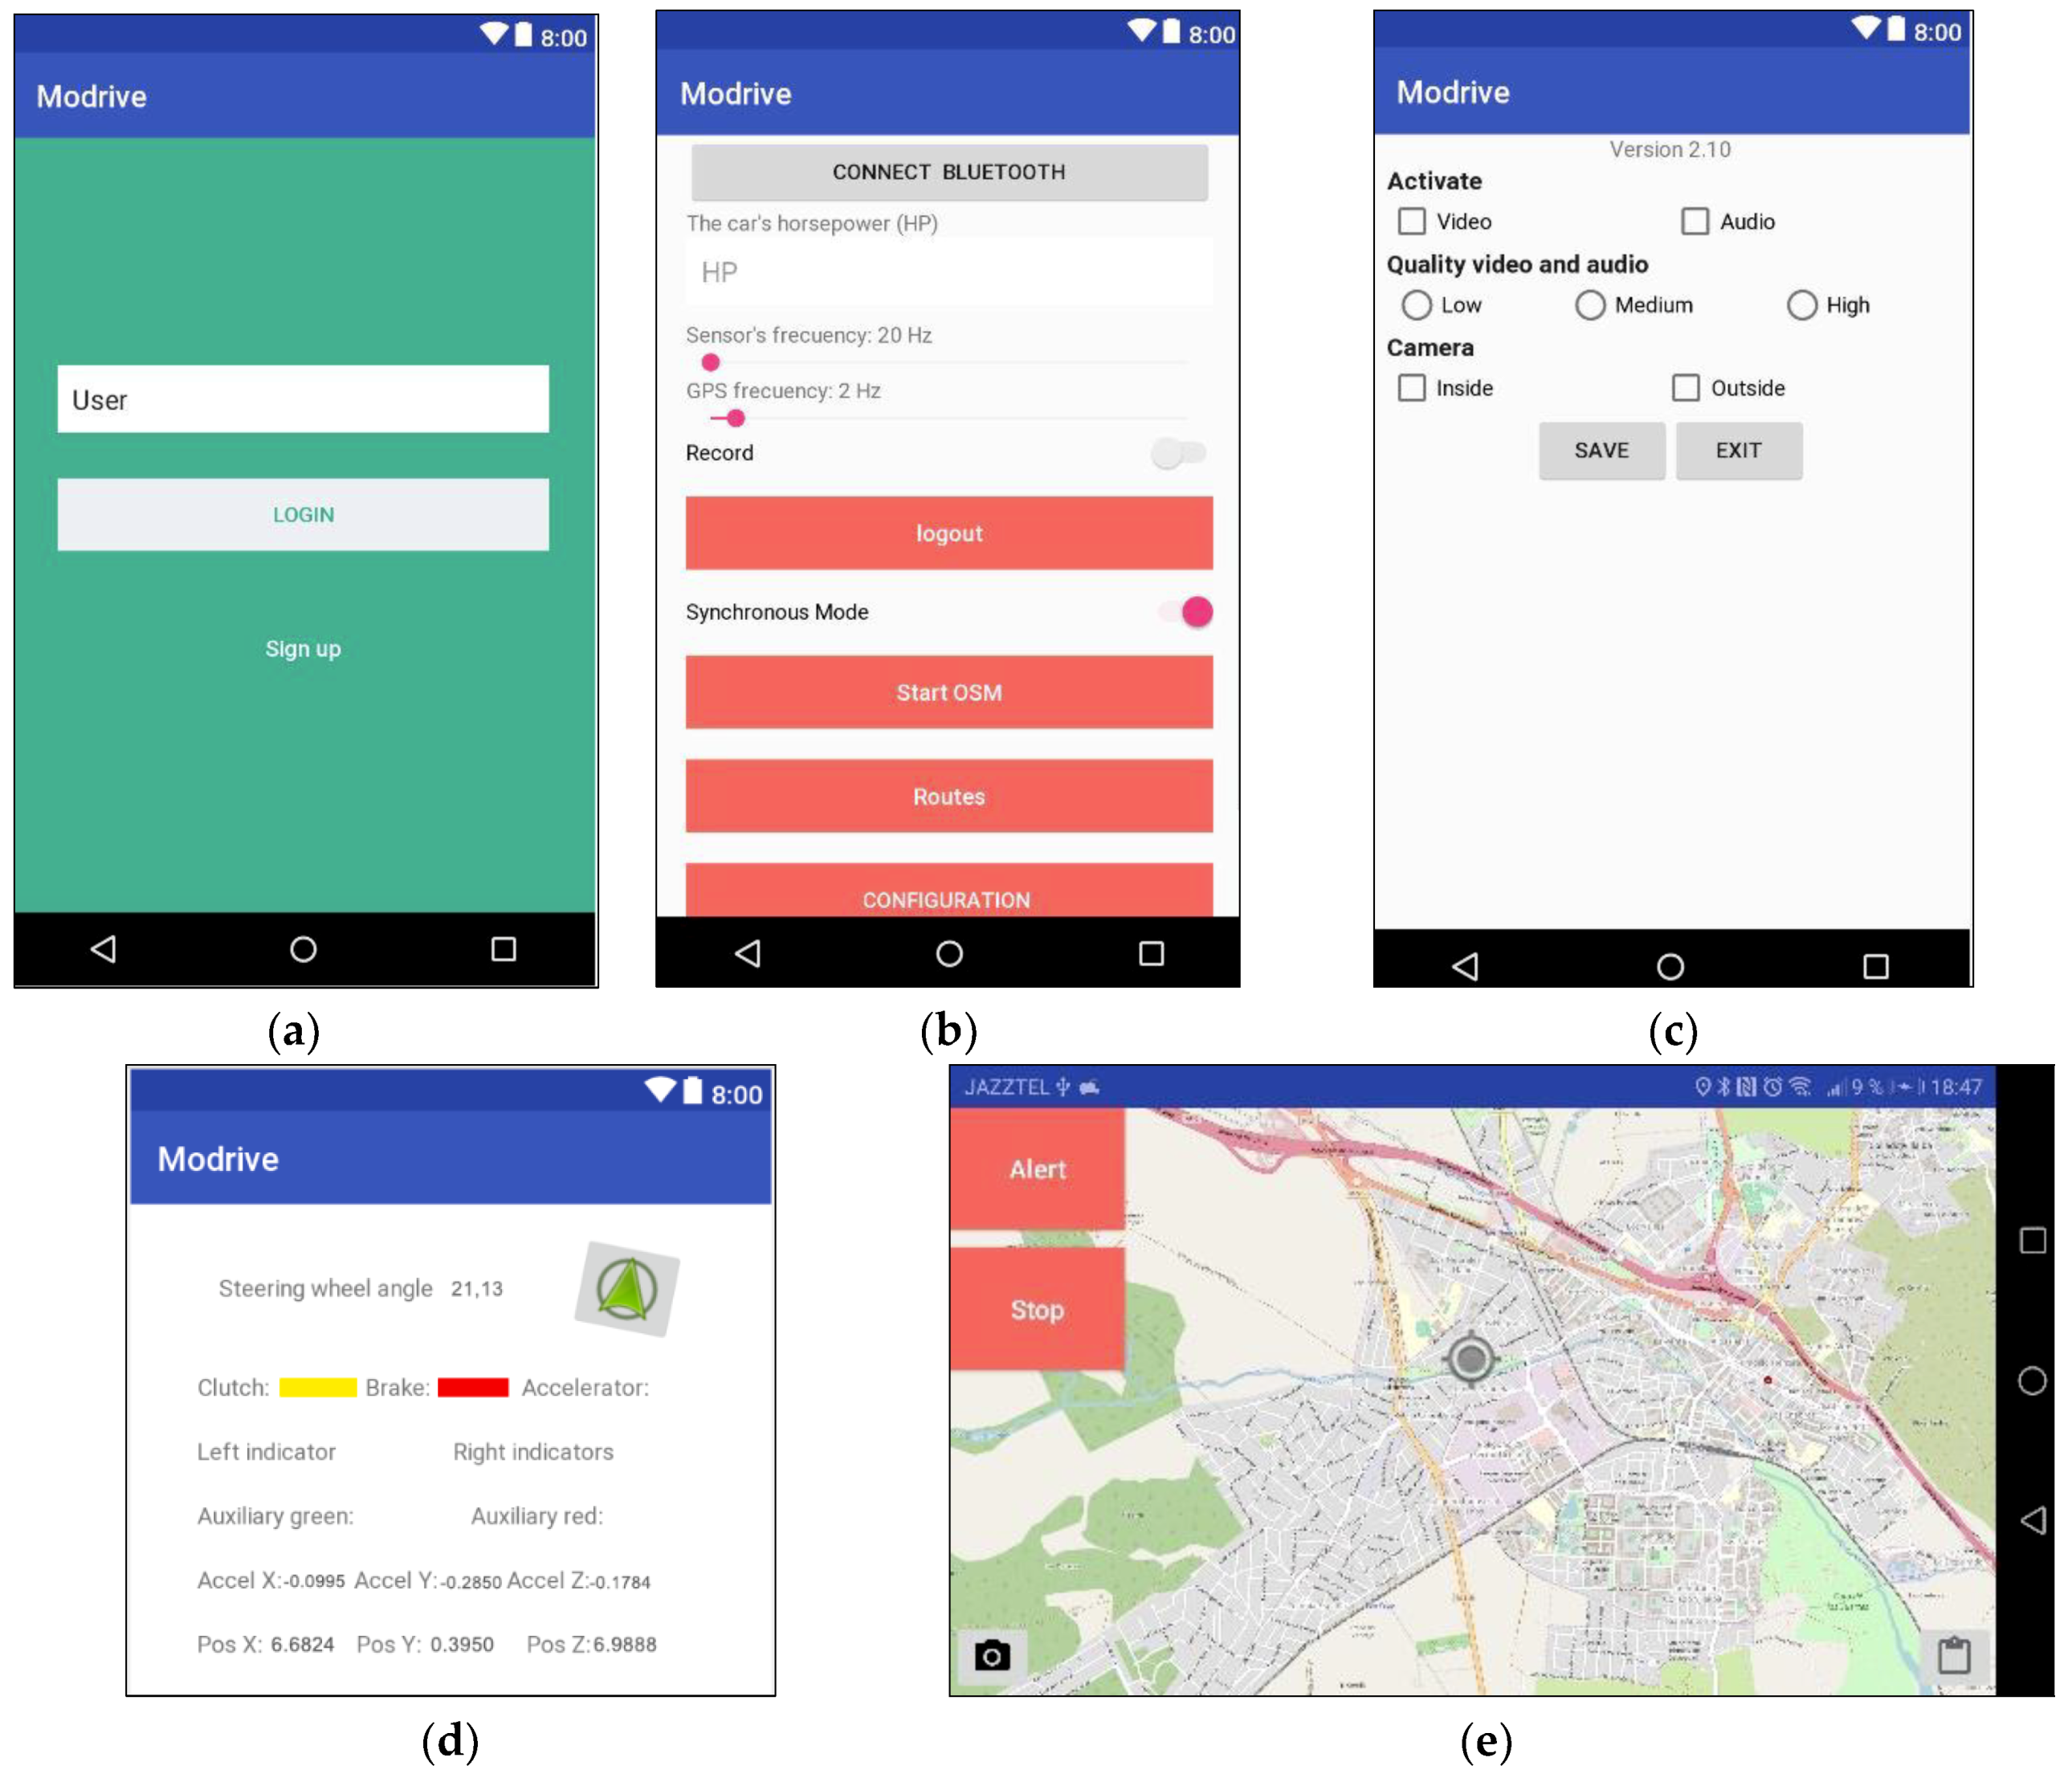
3.3. Smartphone
- GPS location—the position of the vehicle was collected by using an integrated GPS receiver on the smartphone. The parameters collected were latitude, longitude (geographic coordinates format, in degrees and fractions), and altitude (above sea level).
- Accelerometer—the data from the vehicle’s accelerometer were collected, which allowed the accelerations as well as their inclination to be determined. In particular, the measures collected were the usual ones from this type of component: acceleration along the X, Y, and Z axes without any bias compensation and acceleration along the X, Y, and Z axes with estimated bias compensation. In both cases the units were m/s2.
- Video—video signals were collected from the vehicle’s dashboard.
3.4. Web Server
4. Dataset Preparation
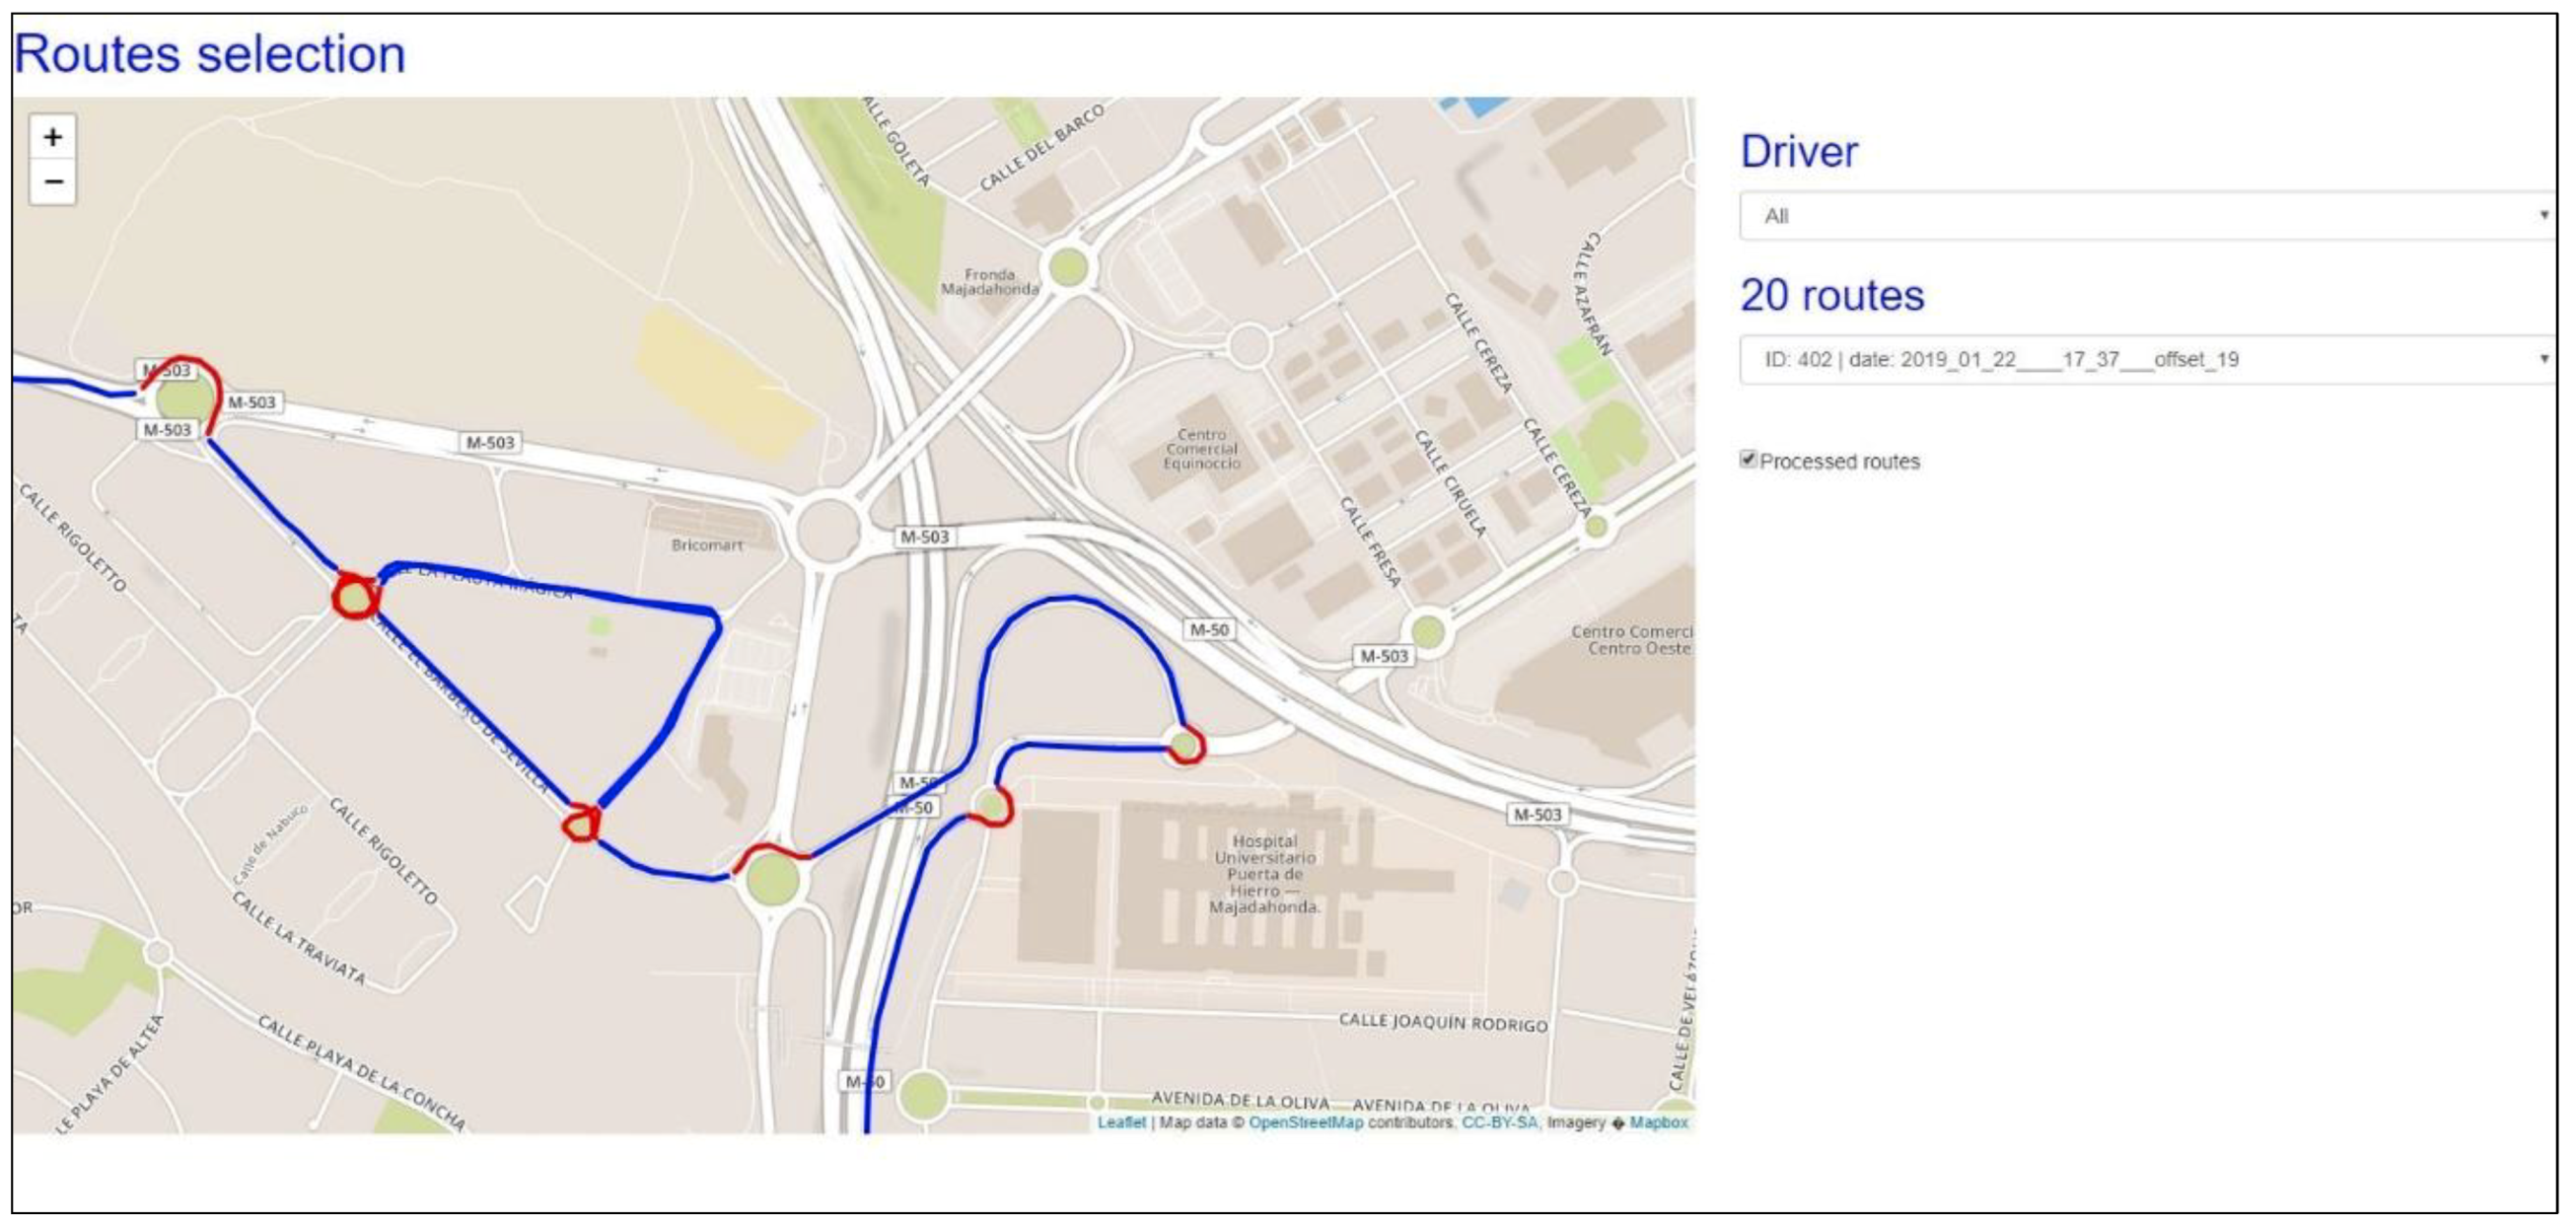
4.1. Data Acquisition Process
- Roundabout diameter—calculated in meters using the Open Street Maps API.
- Number of lanes within roundabouts—calculated using the Open Street Maps API.
- Vehicle speed—calculated using two consecutive GPS locations and the lasted time.
- Rain—discrete parameter to indicate a sunny (0) or rainy (1) route, obtained by off-line video post-processing.
- Night—discrete parameter to indicate daytime (0) or nighttime (1) route, obtained by off-line video post-processing.
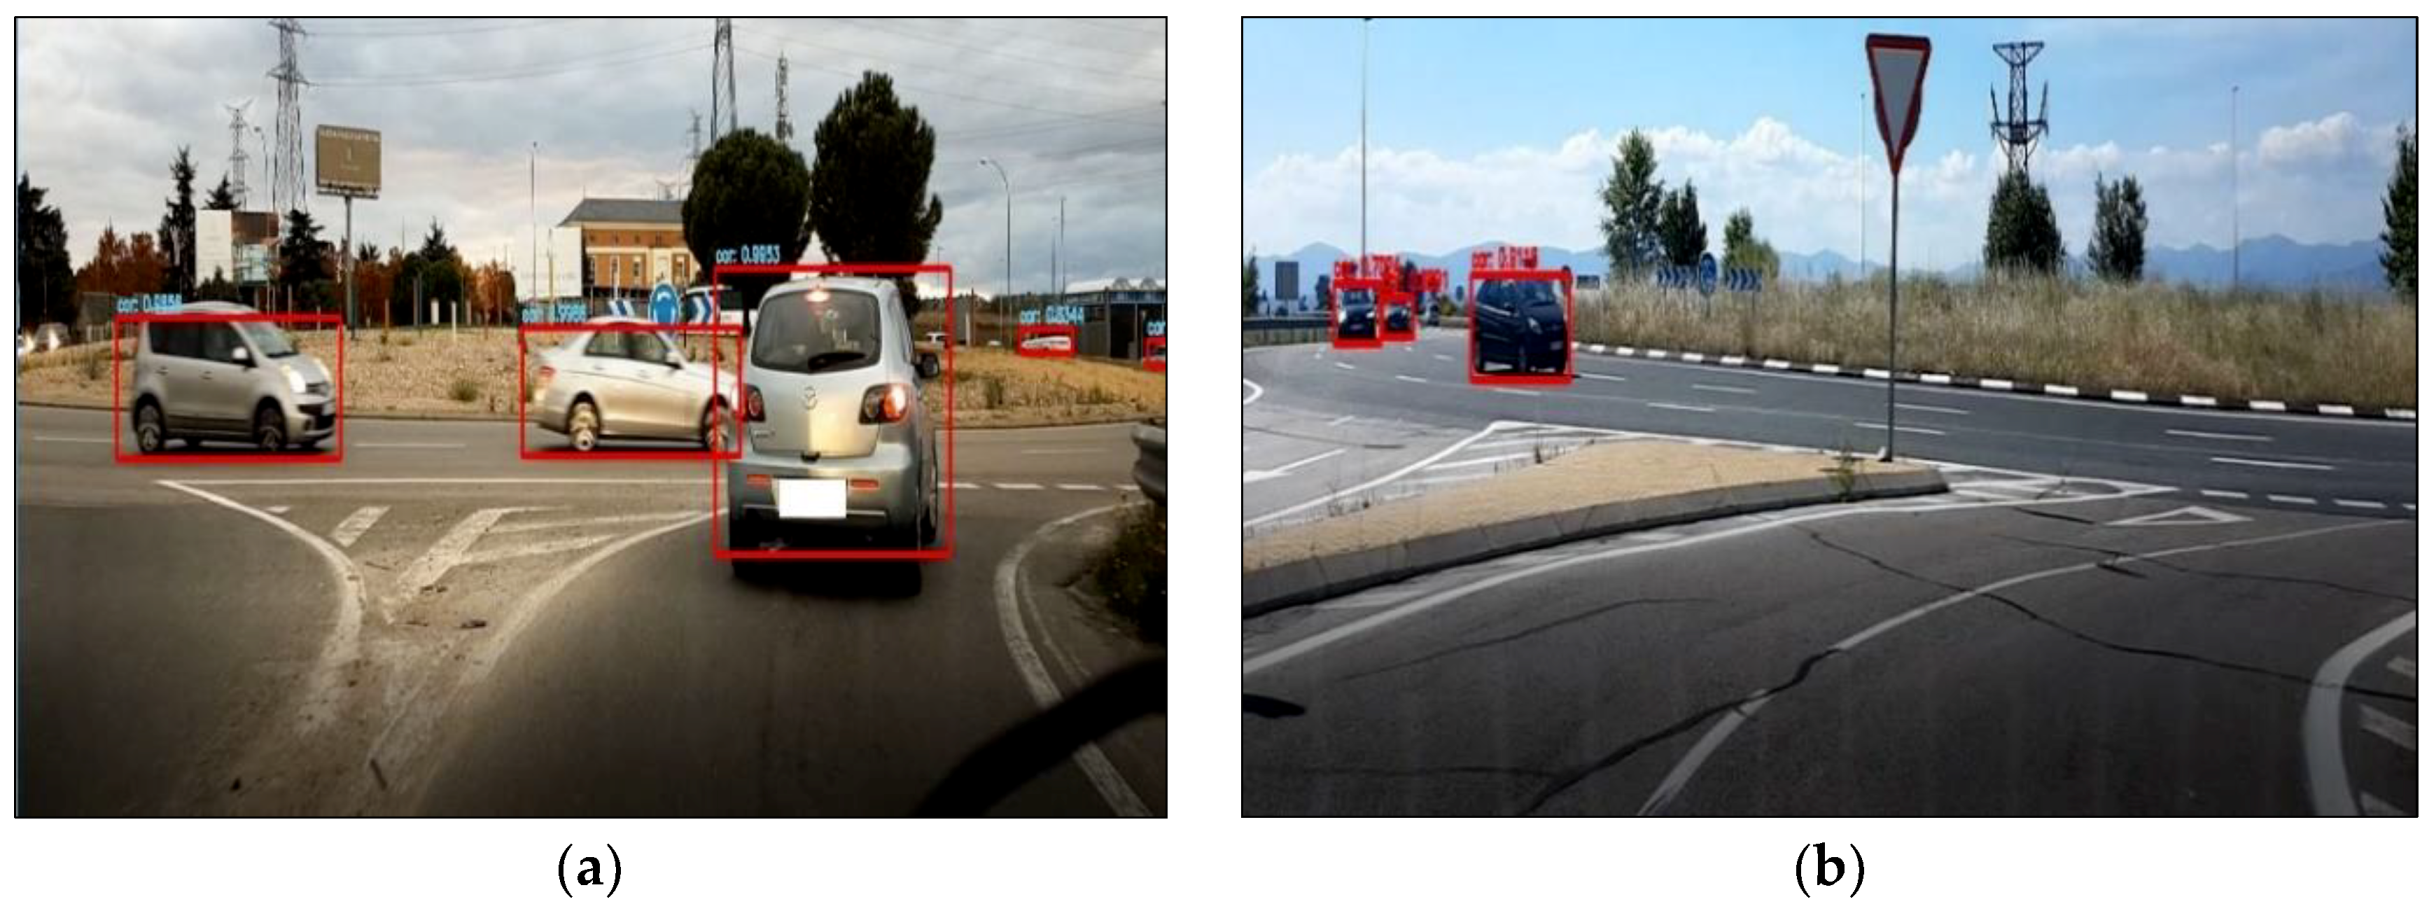
- Traffic—discrete parameter to indicate traffic conditions: no traffic (0), car present in front (1), on the left side (2), or on the right side (3), obtained by off-line video post-processing.
- Visibility—discrete parameter to specify the visibility conditions or the degree of clearness before entering a roundabout: no visibility (0), low visibility (1), good visibility (2), or outside roundabout (3).
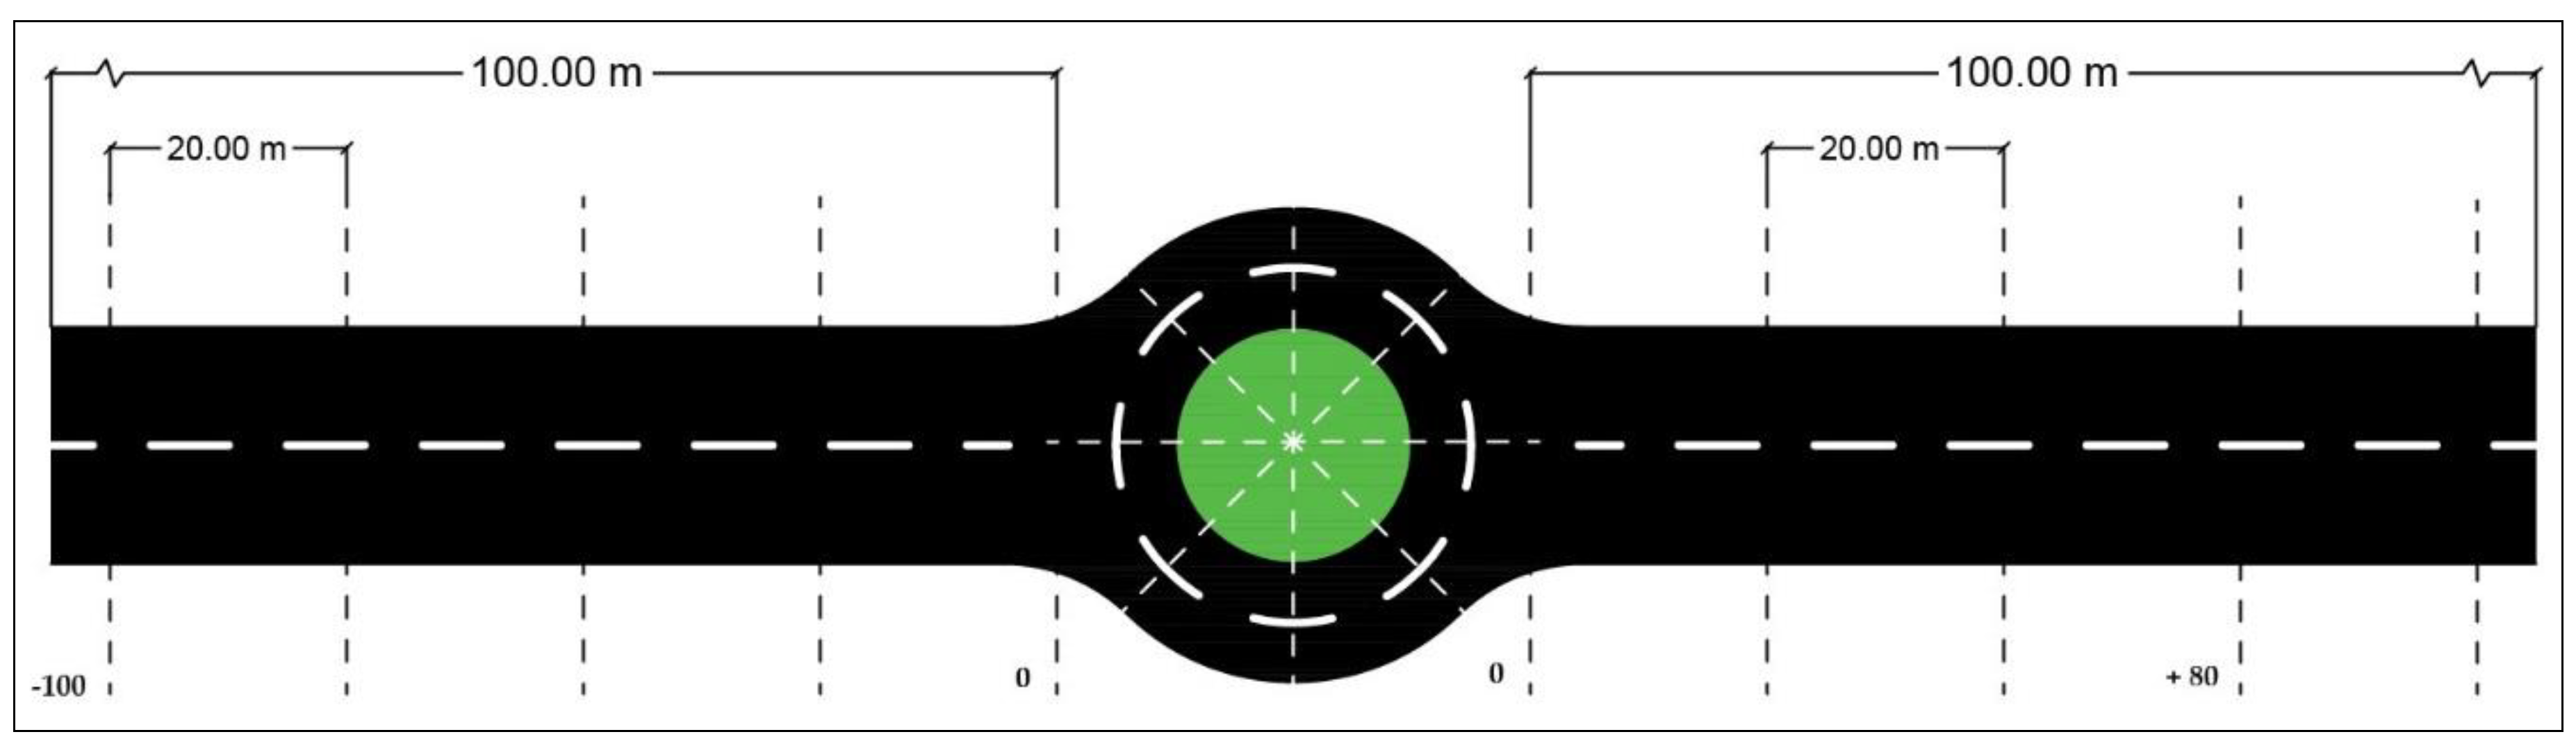
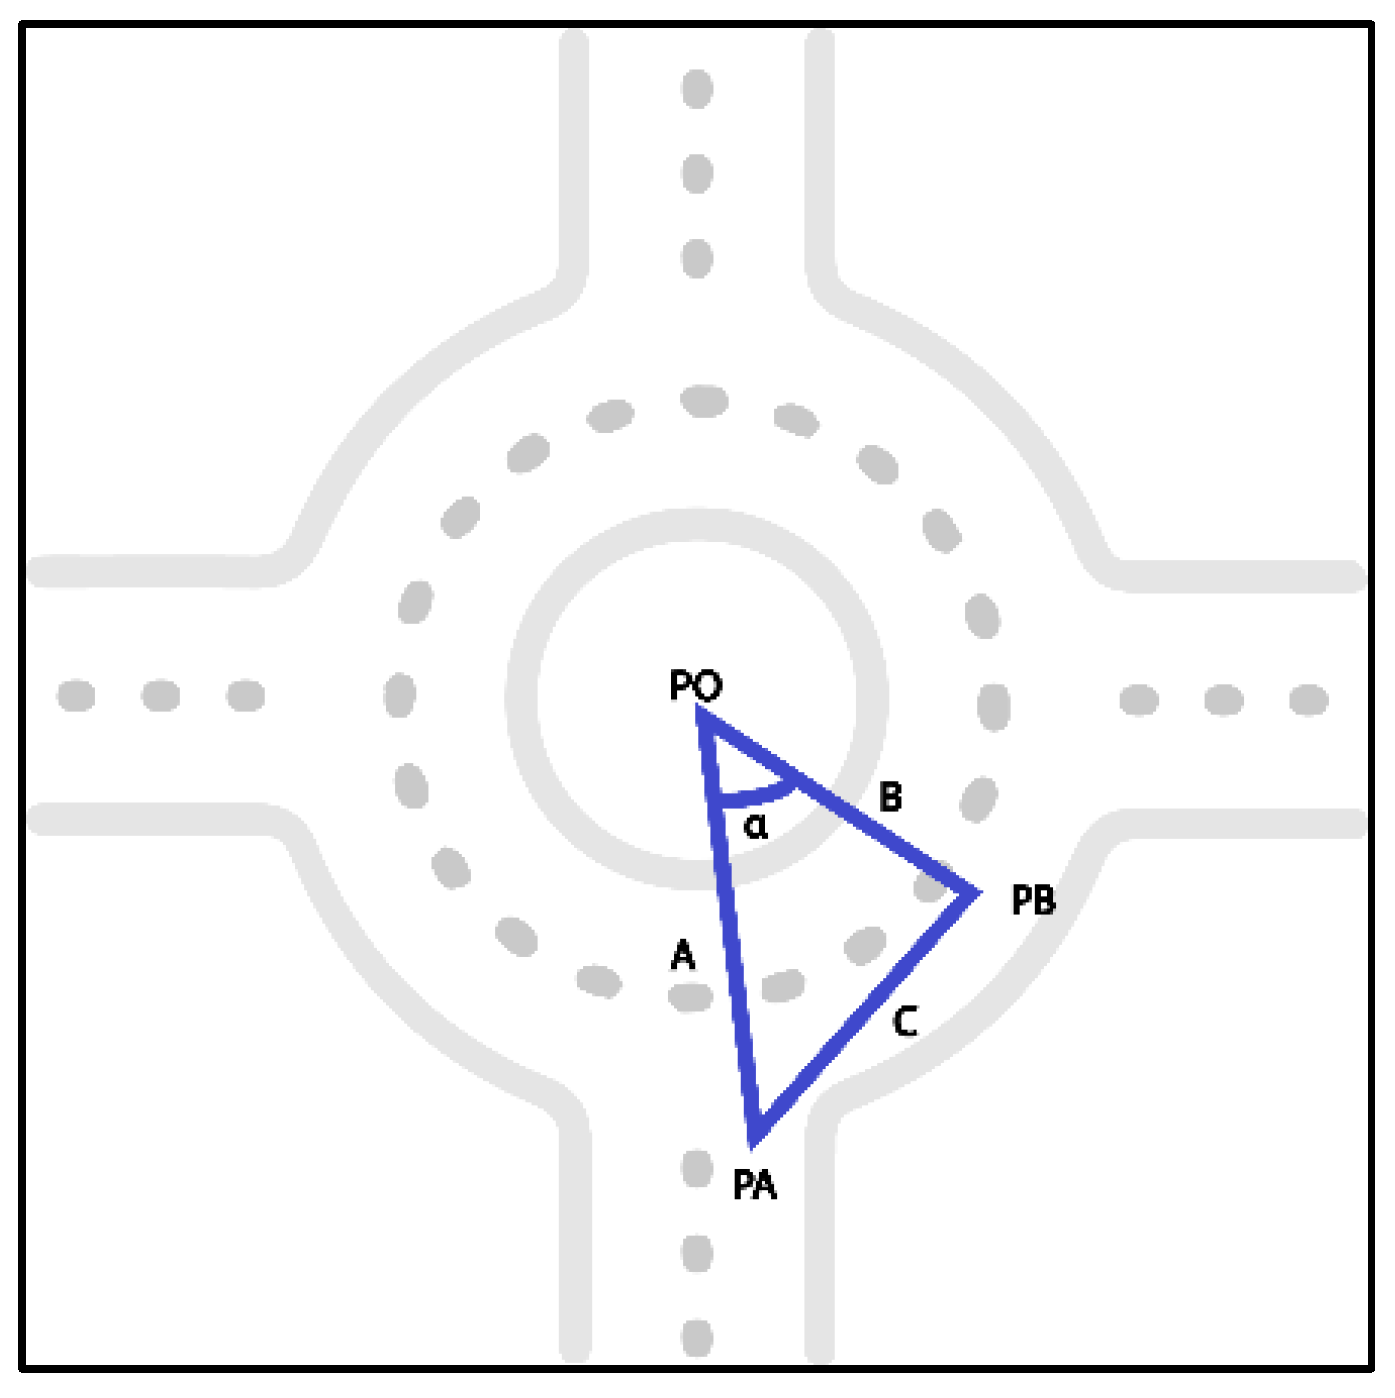
4.2. Data Segmentation
- Vehicle speed—the distribution of the vehicle speed variable, showing a speed between 0 and 69 km/h with an average speed of 36.77 km/h. The most repeated value was 31 km/h (see Figure 11a).
- Roundabout diameter—the distribution of roundabout diameters showing a small diameter of 13 m and a large diameter of 103 m, with an average value of 47.65 m. The most frequently repeated diameter was about 50 m (Figure 11b).
- Number of roundabout lanes—the distribution of the number of lanes clearly showed the number of lanes within roundabouts present in the dataset. The most used roundabouts had two lanes, as shown in Figure 11c.
- Steering angle—the distribution of steering angle showed angles ranging from –7.8 to +40, with an average of 15.7 (see Figure 11d).
5. Machine Learning Model
5.1. Linear Regression
5.2. Support Vector Machines
5.3. Deep Learning Model
5.4. Model Evaluation
5.5. Generation of Rules and Validation
| Algorithm1. Rule for Speed Adjustment. |
| traffic: enumerate {no-traffic, front of, left side, right side}; |
| visibility: enumerate {no-visibility, low, good, outside}; |
| rain, night: boolean; |
| speed, steering, r_diameter, r_lanes: float; |
| currentValues ← getSensorData() |
| predSpeed ← predictSpeed (speedModel, currentValues) |
| if (currentValues.speed > predSpeed) |
| α ← currentValues.speed - predSpeed |
| activateBrake (α) |
| else |
| α ← predSpeed - currentValues.speed |
| activateAccelerator(α) |
| end rule |
| Algorithm 2. Rule for Steering Angle Adjustment. |
| traffic: enumerate {no-traffic, front of, left side, right side}; |
| visibility: enumerate {no-visibility, low, good, outside}; |
| rain, night: boolean; |
| speed, steering, r_diameter, r_lanes: float; |
| currentValues ← getSensorData() |
| predAngle ← predictSteeringAngle (steeringModel, currentValues) |
| α ← currentValues.steering - predictSteeringAngle |
| activateSteeringSystem (α) |
| end rule |
5.6. Discussion and Results
6. Conclusions
Author Contributions
Acknowledgments
Conflicts of Interest
References
- Dirección General de Tráfico. Available online: http://www.dgt.es/es/ (accessed on 19 January 2019).
- SAE—Automotive Engineers Society. Available online: https://www.sae.org (accessed on 19 January 2019).
- U.S. Department of Transportation. Available online: https://www.transportation.gov/ (accessed on 19 January 2019).
- Goodrich, M.A.; Boer, E.R. Designing Human-Centered Automation: Tradeoffs in Collision Avoidance System Design. IEEE Trans. Intell. Transp. Syst. 2000, 1, 40–54. [Google Scholar] [CrossRef]
- Lefèvre, S.; Carvalho, A.; Gao, Y.; Tseng, H.E.; Borrelli, F. Driver models for personalised driving assistance. Veh. Syst. Dyn. Int. J. Veh. Mech. Mobil. 2015, 53, 1705–1720. [Google Scholar]
- Chen, R.; Kusano, K.D.; Gabler, H.C. Driver Behavior During Overtaking Maneuvers from the 100-Car Naturalistic Driving Study. Traffic Inj. Prev. 2015, 16, S176–S181. [Google Scholar] [CrossRef]
- Jamson, A.H.; Lai, F.C.H.; Carsten, O.M.J. Potential benefits of an adaptive forward collision warning system. Transp. Res. Part C Emerg. Technol. 2008, 16, 471–484. [Google Scholar] [CrossRef]
- Eichelberger, A.H.; McCartt, A.T. Volvo drivers’ experiences with advanced crash avoidance and related technologies. Traffic Inj. Prev. 2014, 15, 187–195. [Google Scholar] [CrossRef]
- Naranjo, J.E.; Sotelo, M.A.; Gonzalez, C.; García, R.; de Pedro, T. Using Fuzzy Logic in Automated Vehicle Control. IEEE Intell. Syst. 2007, 22, 36–45. [Google Scholar] [CrossRef]
- Gordon, T.; Srinivasan, K. Modeling human lane keeping control in highway driving with validation by naturalistic data. In Proceedings of the 2014 IEEE International Conference on Systems, Man, and Cybernetics (SMC), San Diego, CA, USA, 5–8 October 2014. [Google Scholar] [CrossRef]
- Rodrigues, M.; Gest, G.; McGordon, A.; Marco, J. Adaptive behaviour selection for autonomous vehicle through naturalistic speed planning. In Proceedings of the 2017 IEEE 20th International Conference on Intelligent Transportation Systems (ITSC), Yokohama, Japan, 16–19 October 2017. [Google Scholar] [CrossRef]
- Manage, S.; Nakamura, H.; Suzuki, K. Performance an of roundabouts as an alternative for intersection control in japan. J. East. Asia Soc. Transp. Stud. 2003, 5, 871–883. [Google Scholar]
- Abaza, O.A.; Hussein, Z.S. Comparative analysis of multilane roundabout capacity çase study. In Proceedings of the 2009 IEEE 70th Vehicular Technology Conference Fall, Anchorage, AK, USA, 20–23 September 2009; pp. 1–5. [Google Scholar]
- Akcelik, R.; Chung, E.; Besley, M. Performance of Roundabouts under Heavy Demand Conditions. Road Transp. Res. 1996, 5, 36–57. [Google Scholar]
- Dirección General de Tráfico-Seguridad Vial. Available online: http://www.dgt.es/es/seguridad-vial/investigacion/estudios-informes/ (accessed on 14 February 2019).
- Evolución de la Siniestralidad vial en España. Fundación Mutua Madrileña. Available online: https://www.fundacionmutua.es/Estudios-de-Seguridad-Vial.html (accessed on 3 February 2019).
- Asociación de automovilistas. Available online: https://aeaclub.org/estudios-aea/ (accessed on 2 February 2019).
- Yang, X.; Li, X.; Xue, K. A New Traffic-Signal Control for Modern Roundabouts: Method and Application. IEEE Trans. Intell. Transp. Syst. 2004, 5, 282–287. [Google Scholar] [CrossRef]
- Yang, S.; Jiang, Y.; Wang, G.; Deng, W.; Wang, J. Driving Behavior Prediction at Roundabouts Based on Integrated Simulation Platform. SAE Technical Paper 2018. [Google Scholar] [CrossRef]
- Guo, C.; Meguro, J.; Kojima, Y.; Naito, T. A Multimodal ADAS System for Unmarked Urban Scenarios Based on Road Context Understanding. IEEE Trans. Intell. Transp. Syst. 2015, 16, 1690–1704. [Google Scholar] [CrossRef]
- Bernhard, W.; Portmann, P. Traffic simulation of roundabouts in Switzerland. In Proceedings of the 2000 Winter Simulation Conference (Cat. No.00CH37165), Orlando, FL, USA, 10–13 December 2000. [Google Scholar] [CrossRef]
- Artesea, G. Detecting and Tracking Vehicles in a Roundabout. Available online: https://pdfs.semanticscholar.org/a269/45eeeddaff654548520850d9dcdfe28ef7f4.pdf (accessed on 22 May 2019).
- Grejner-Brzezinska, D.A.; Toth, C.K.; Paska, E. Airborne remote sensing supporting traffic flow estimation. In Advances in Mobile Mapping Technology; Tao, C.V., Li, J., Eds.; Taylor & Francis: London, UK, 2007; pp. 51–60. [Google Scholar]
- Zhao, M.; Kathner, D.; Jipp, M.; Soffker, D.; Lemmer, K. Modeling driver behavior at roundabouts: Results from a field study. In Proceedings of the 2017 IEEE Intelligent Vehicles Symposium (IV), Los Angeles, CA, USA, 11–14 June 2017. [Google Scholar] [CrossRef]
- Pedersini, F.; Sarti, A.; Tubaro, S. Multi-camera parameter tracking. IEE Proc. Vision, Image Sign. Proces. 2001, 148, 70–77. [Google Scholar] [CrossRef][Green Version]
- Reulke, R.; Kroen, A.; Kahl, T.; Dalaff, C.; Schischmanow, A.; Schlotzhauer, G. A Traffic Object Detection System for Road Traffic Measurement and Management. Available online: https://www.academia.edu/25487824/A_Traffic_Object_Detection_System_for_Road_Traffic_Measurement_and_Management (accessed on 23 May 2019).
- Zhu, Z.; Liang, D.; Zhang, S.; Huang, X.; Li, B.; Hu, S. Traffic-Sign Detection and Classification in the Wild. In Proceedings of the 2016 IEEE Conference on Computer Vision and Pattern Recognition (CVPR), Las Vegas, NV, USA, 26 June–1 July 2016. [Google Scholar] [CrossRef]
- Chen, X.; Ma, H.; Wan, J.; Li, B.; Xia, T. Multi-view 3D Object Detection Network for Autonomous Driving. In Proceedings of the 2017 IEEE Conference on Computer Vision and Pattern Recognition (CVPR), Honolulu, HI, USA, 21–26 July 2017. [Google Scholar] [CrossRef]
- Yu, Y.; Li, J.; Wen, C.; Guan, H.; Luo, H.; Wang, C. Bag-of-visual-phrases and hierarchical deep models for traffic sign detection and recognition in mobile laser scanning data. ISPRS J. Photogramm. Remote Sens. 2016, 113, 106–123. [Google Scholar] [CrossRef]
- Geiger, M.; Lauer, C.; Wojek, C.; Stiller, C.; Urtasun, R. 3D traffic scene understanding from movable platforms. IEEE Trans. Pattern Anal. Mach. Intell. 2014, 36, 1012–1025. [Google Scholar] [CrossRef] [PubMed]
- Minaee, S.; Wang, Y. Text extraction from texture images using masked signal decomposition. In Proceedings of the 2017 IEEE Global Conference on Signal and Information Processing (GlobalSIP), Montreal, QC, Canada, 14–16 November 2017. [Google Scholar] [CrossRef]
- Elqursh, A.; Elgammal, A. Online Moving Camera Background Subtraction. Eur. Conf. Comput. Vision 2012. [Google Scholar] [CrossRef]
- Minaee, S.; Wang, Y. An ADMM Approach to Masked Signal Decomposition Using Subspace Representation. IEEE Trans. Image Process. 2019, 28, 3192–3204. [Google Scholar] [CrossRef] [PubMed]
- Hane, C.; Sattler, T.; Pollefeys, M. Obstacle detection for self-driving cars using only monocular cameras and wheel odometry. In Proceedings of the 2015 IEEE/RSJ International Conference on Intelligent Robots and Systems (IROS), Hamburg, Germany, 28 September–2 October 2015. [Google Scholar] [CrossRef]
- Aoude, G.S.; Desaraju, V.R.; Stephens, L.H.; How, J.P. Behaviour classification algorithms at intersections and validation using naturalistic data. In Proceedings of the 2011 IEEE Intelligent Vehicles Symposium (IV), Baden-Baden, Germany, 5–9 June 2011; pp. 601–606. [Google Scholar]
- Clara Fang, F.; Castaneda, H. Computer Simulation Modeling of Driver Behavior at Roundabouts. Int. J. Intell. Transp. Syst. Res. 2018, 16, 66–77. [Google Scholar] [CrossRef]
- Deluka Tibljaš, A.; Giuffre, T.; Surdonja, S.; Trubia, S. Introduction of Autonomous Vehicles: Roundabouts Design and Safety Performance Evaluation. Sustainability 2018, 10, 1060. [Google Scholar] [CrossRef]
- Zhao, M.; Käthner, D.; Söffker, D.; Jipp, M.; Lemmer, K. Modeling Driving Behavior at Roundabouts: Impact of Roundabout Layout and Surrounding Traffic on Driving Behavior. Available online: https://core.ac.uk/download/pdf/84275712.pdf (accessed on 19 May 2019).
- Código de Tráfico y Seguridad Vial. Available online: http://www.dgt.es/images/BOE-020_Codigo_de_Trafico_y_Seguridad_Vial.pdf (accessed on 2 February 2019).
- Molina, M.; Sanchez-Soriano, J.; Corcho, O. Using Open Geographic Data to Generate Natural Language Descriptions for Hydrological Sensor Networks. Sensors 2015, 15, 16009–16026. [Google Scholar] [CrossRef]
- Redmon, J.; Divvala, S.K.; Girshick, R.B.; Farhadi, A. You Only Look Once: Unified, Real-Time Object Detection. Available online: https://grail.cs.washington.edu/wp-content/uploads/2016/09/redmon2016yol.pdf (accessed on 23 May 2019).
- Cortes, C.; Vapnik, V. Support-vector networks. Mach. Learn. 1995, 20, 273–297. [Google Scholar] [CrossRef]
- Harrell, F. Regression Modeling Strategies: With Applications to Linear Models, Logistic and Ordinal Regression, and Survival Analysis; Springer: New York, NY, USA, 2001. [Google Scholar]
- Bengio, Y.; Courville, A.; Vincent, P. Representation Learning: A Review and New Perspectives. IEEE Trans. Pattern Anal. Mach. Intell. 2013, 35, 1798–1828. [Google Scholar] [CrossRef]
- Lightning Fast Data Science Platform for Teams. Available online: https://rapidminer.com/ (accessed on 6 March 2019).
- Cherkassky, V.; Ma, Y. Practical selection of SVM parameters and noise estimation for SVM regression. Neural Netw. 2004, 17, 113–126. [Google Scholar] [CrossRef]
- Dosovitskiy, A.; Ros, G.; Codevilla, F.; López, A.; Koltun, V. CARLA: An Open Urban Driving Simulator. Available online: http://vladlen.info/papers/carla.pdf (accessed on 23 May 2019).


| Data | Source | Data | Source |
|---|---|---|---|
| Timestamp | Smartphone | Roundabout diameter | Aggregated |
| Longitude | Smartphone | Number of lanes | Aggregated |
| Latitude | Smartphone | Vehicle speed | Aggregated |
| Steering angle | Vehicle | Visibility | Aggregated |
| Video | Smartphone | Traffic | Aggregated |
| Rain | Aggregated | ||
| Nighttime | Aggregated |
| Before Segment | |||
| Sections | Linear Regression | Support Vector Machines (SVM) | Deep Learning |
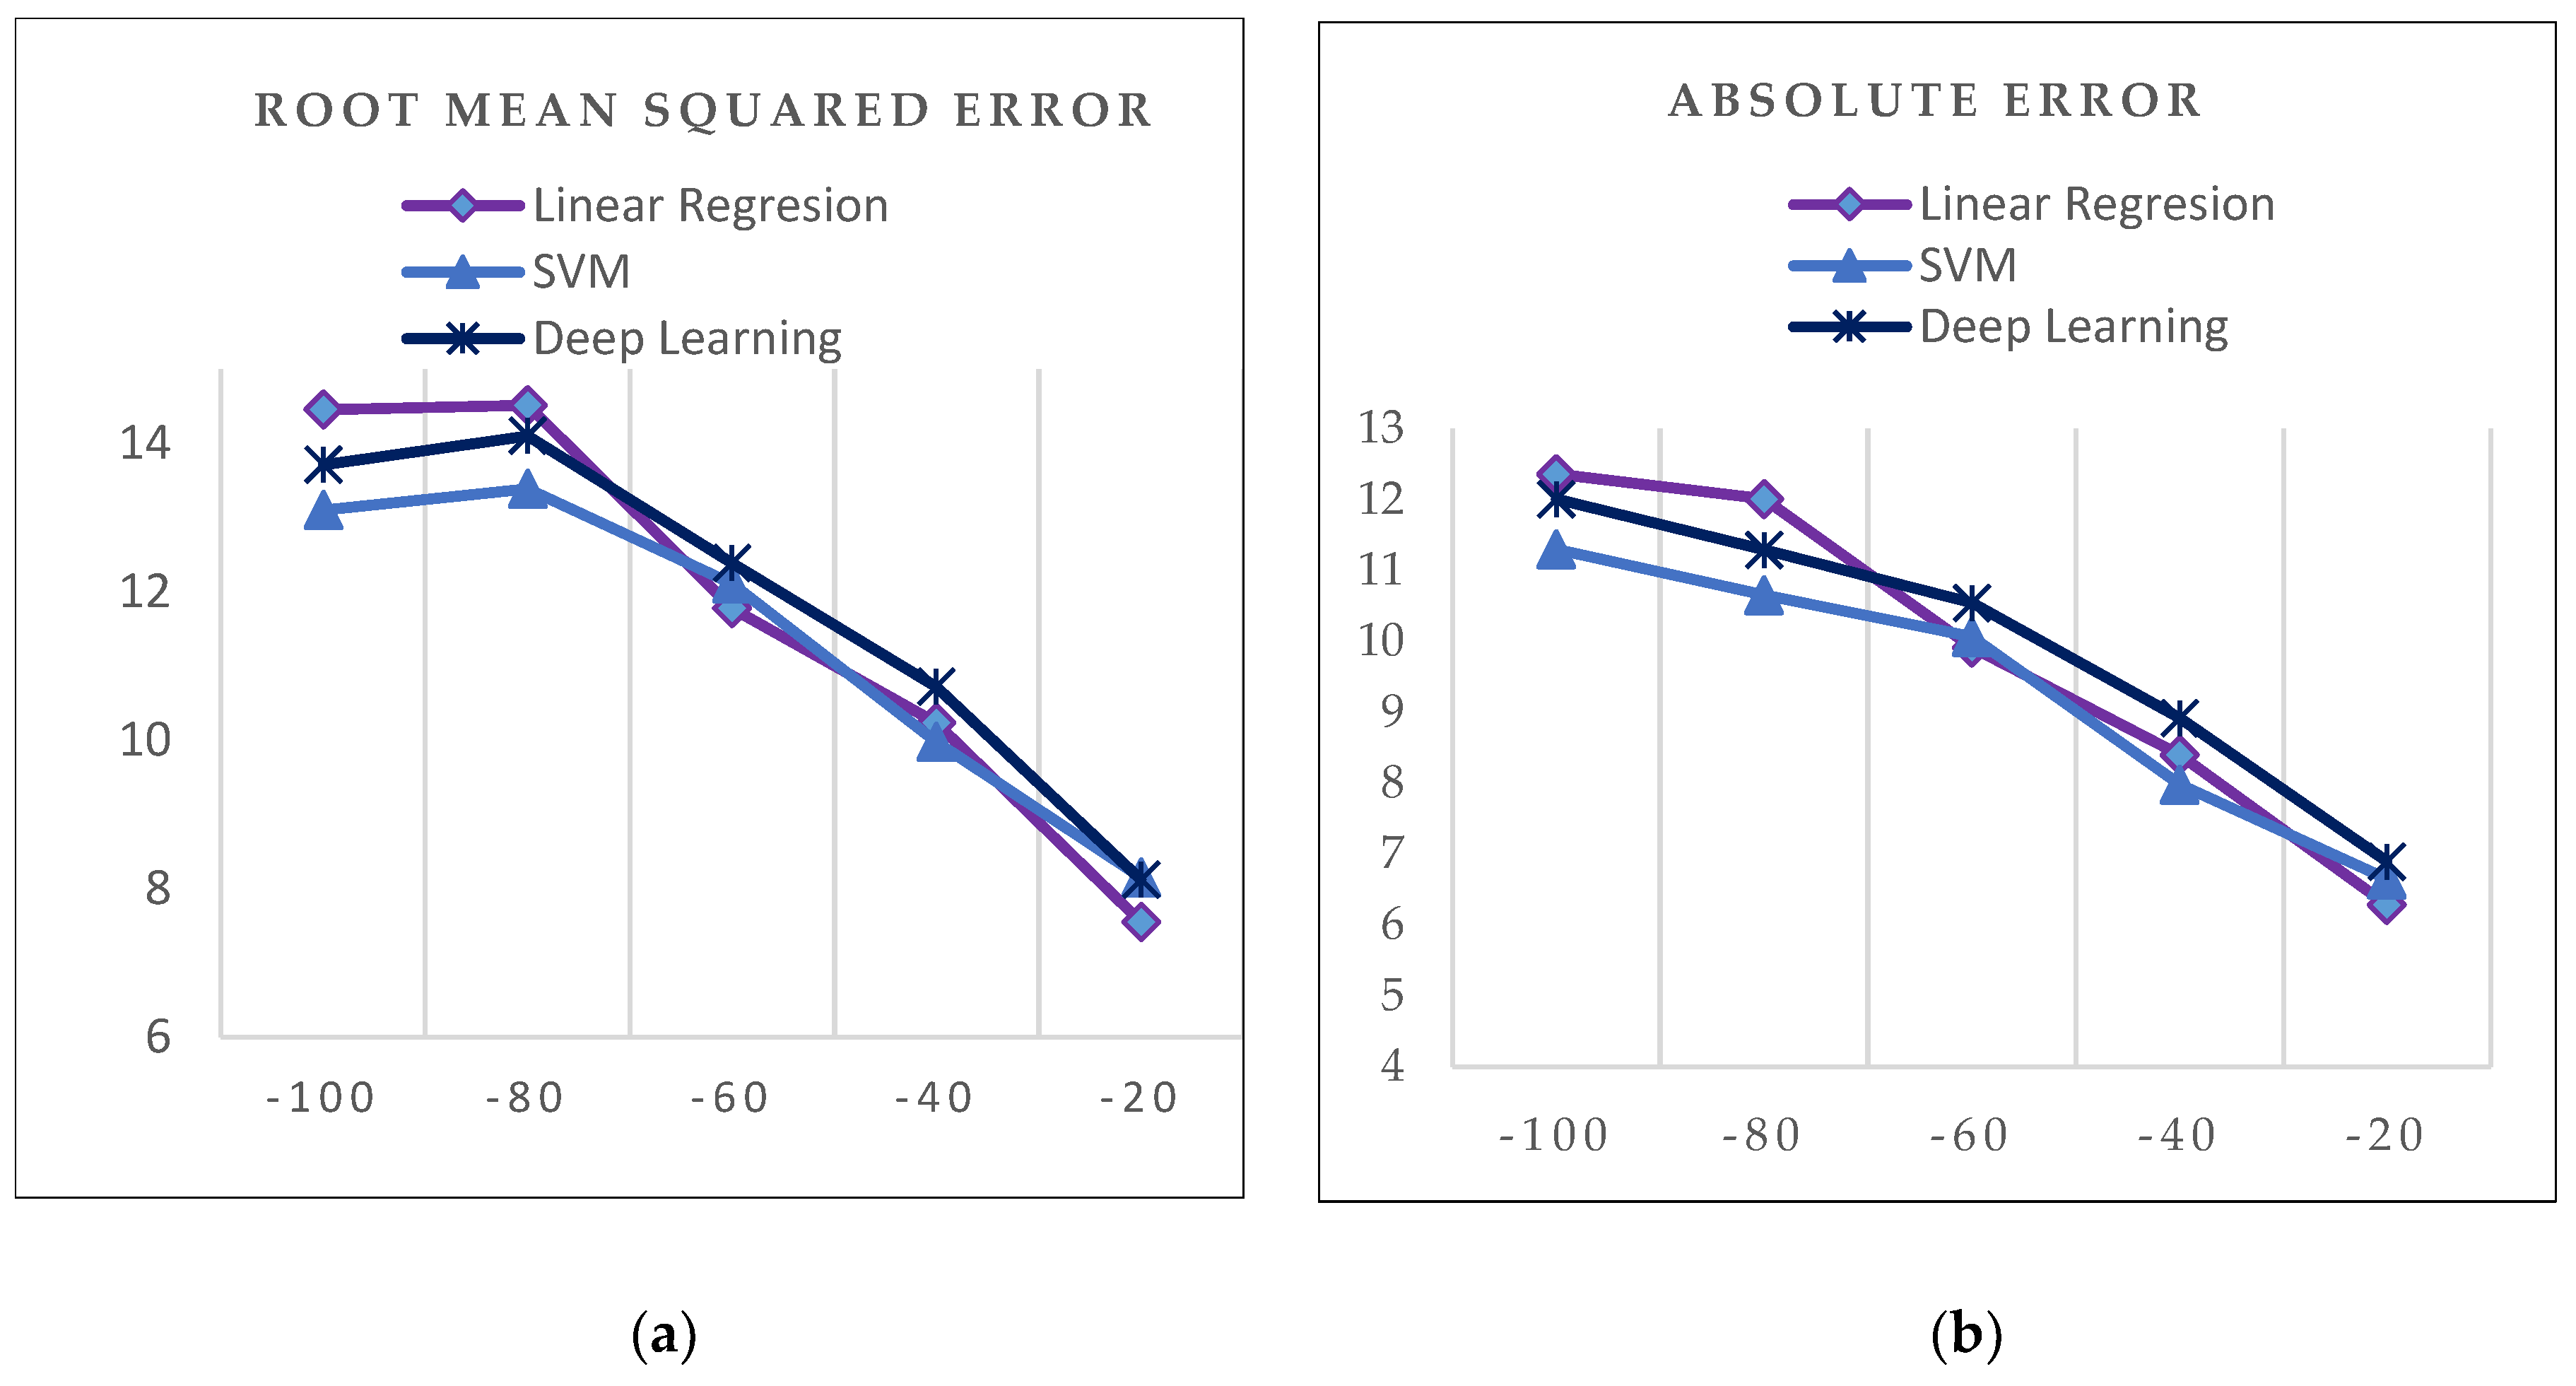
| –100 | 14,458; [12,361] | 13,106; [11,298] | 13,709; [12,007] |
| –80 | 14,517; [12,008] | 13,390; [10,655] | 14,102; [11,296] |
| –60 | 11,777; [9,919] | 12,115; [10,062] | 12,385; [10,543] |
| –40 | 10,232; [8,402] | 9,980; [7,986] | 10,720; [8,922] |
| –20 | 7,549; [6,283] | 8,150; [6,648] | 8,117; [6,895] |
| After-Segment | |||
| Sections | Linear Regression | SVM | Deep Learning |
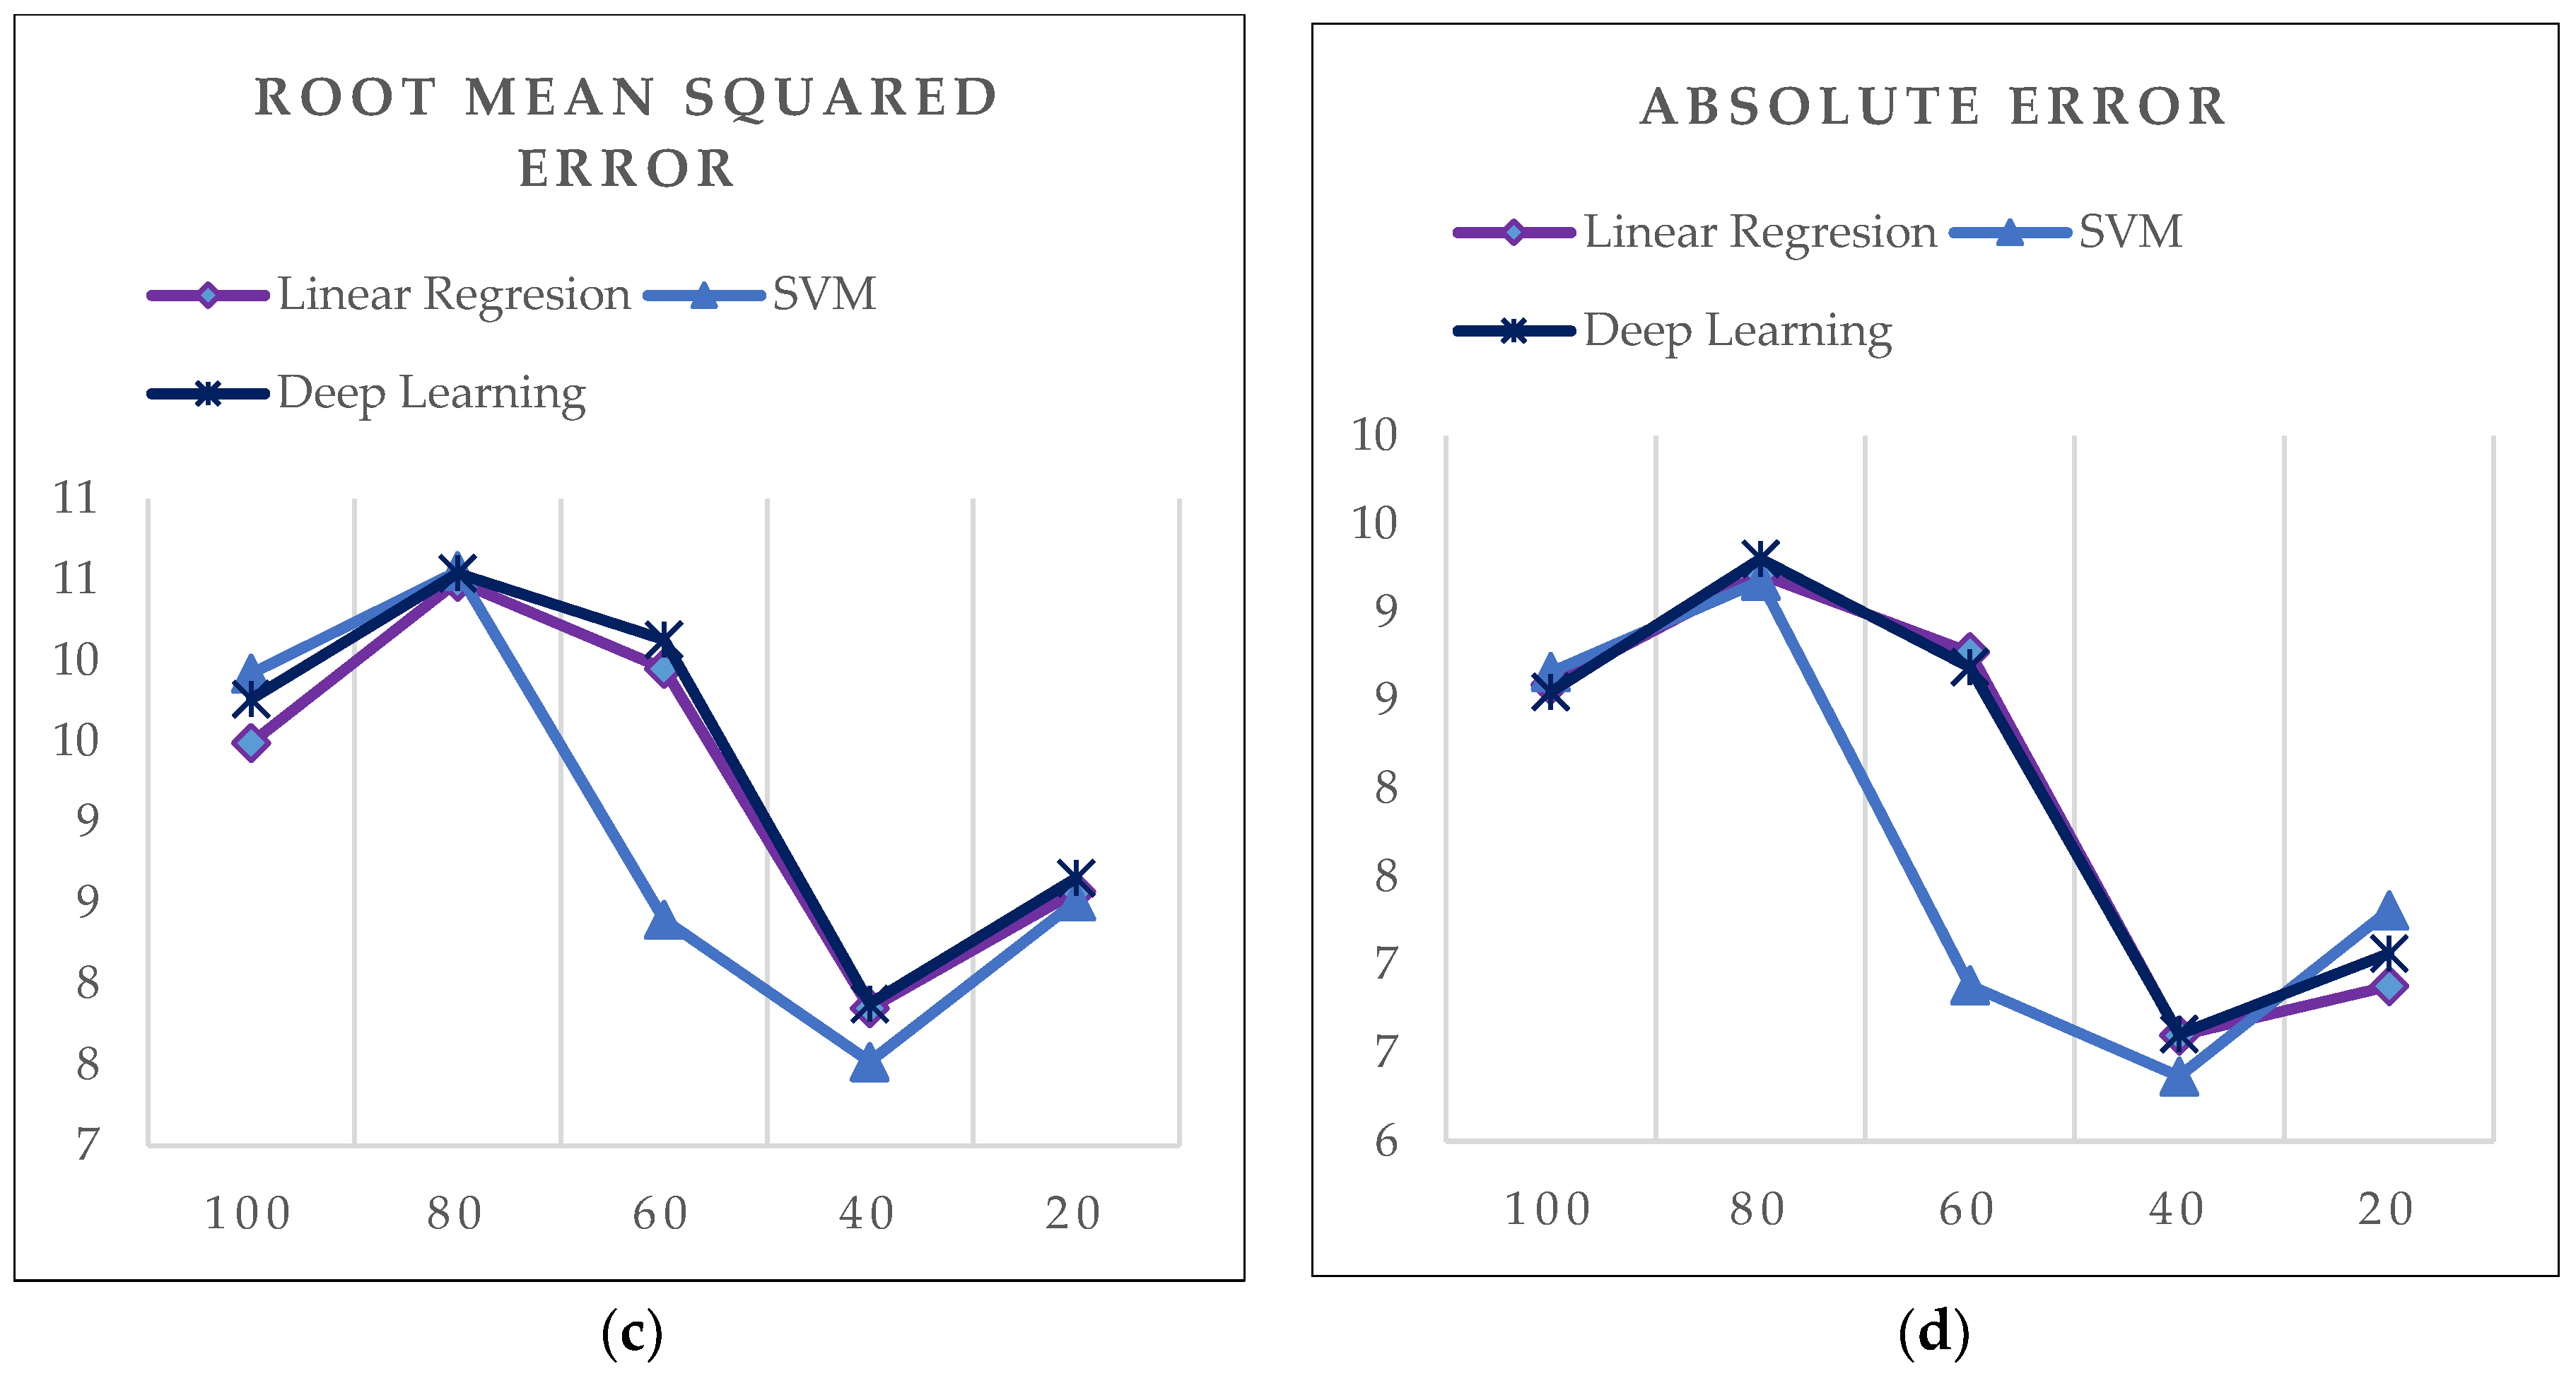
| +100 | 9,491; [8,588]] | 9,922; [8,662] | 9,762; [8,551] |
| +80 | 10,490; [9,216] | 10,552; [9,178] | 10,540; [9,304] |
| +60 | 9,952; [8,773] | 8,397; [6,883] | 10,128; [8,689] |
| +40 | 7,849; [6,599] | 7,520; [6,368] | 7,879; [6,607] |
| +20 | 8,574; [6,879] | 8,511; [7,308] | 8,657; [7,063] |
| Inner Segment | |||
|---|---|---|---|
| Linear Regression | Support Vector Machines (SVM) | Deep Learning | |
| Speed | 6,987; [5,135] | 6,929; [5,000] | 7,074; [5,121] |
| The Steering Angle | 9,235; [8,216] | 8,956; [7,673] | 9,120; [7,804] |
| Before Segment | ||
| Sections | Speed | Support Vector Machines (SVM) Prediction |
| –100 | 53 | 45,8 |
| –80 | 49 | 39,7 |
| –60 | 41 | 35,9 |
| –40 | 40 | 32,4 |
| –20 | 25 | 23,9 |
| After Segment | ||
| Sections | Speed | SVM prediction |
| +100 | 46 | 48,9 |
| +80 | 39 | 44,1 |
| +60 | 33 | 37,9 |
| +40 | 31 | 36,6 |
| +20 | 23 | 27,3 |
| Inner | Support Vector Machines (SVM) Prediction | |
|---|---|---|
| Speed | 22 | 20,8 |
| The steering angle | 0,590 (45) | 16,057 (45) |
© 2019 by the authors. Licensee MDPI, Basel, Switzerland. This article is an open access article distributed under the terms and conditions of the Creative Commons Attribution (CC BY) license (http://creativecommons.org/licenses/by/4.0/).
Share and Cite
García Cuenca, L.; Sanchez-Soriano, J.; Puertas, E.; Fernandez Andrés, J.; Aliane, N. Machine Learning Techniques for Undertaking Roundabouts in Autonomous Driving. Sensors 2019, 19, 2386. https://doi.org/10.3390/s19102386
García Cuenca L, Sanchez-Soriano J, Puertas E, Fernandez Andrés J, Aliane N. Machine Learning Techniques for Undertaking Roundabouts in Autonomous Driving. Sensors. 2019; 19(10):2386. https://doi.org/10.3390/s19102386
Chicago/Turabian StyleGarcía Cuenca, Laura, Javier Sanchez-Soriano, Enrique Puertas, Javier Fernandez Andrés, and Nourdine Aliane. 2019. "Machine Learning Techniques for Undertaking Roundabouts in Autonomous Driving" Sensors 19, no. 10: 2386. https://doi.org/10.3390/s19102386
APA StyleGarcía Cuenca, L., Sanchez-Soriano, J., Puertas, E., Fernandez Andrés, J., & Aliane, N. (2019). Machine Learning Techniques for Undertaking Roundabouts in Autonomous Driving. Sensors, 19(10), 2386. https://doi.org/10.3390/s19102386