Design of Enhanced Rotation Locked Loop for Roll Angle Estimation of Rotating Vehicle in a Weak GPS Signal Environment


Abstract
:1. Introduction
2. Enhanced RLL Algorithm for a Weak GPS Signal Environment
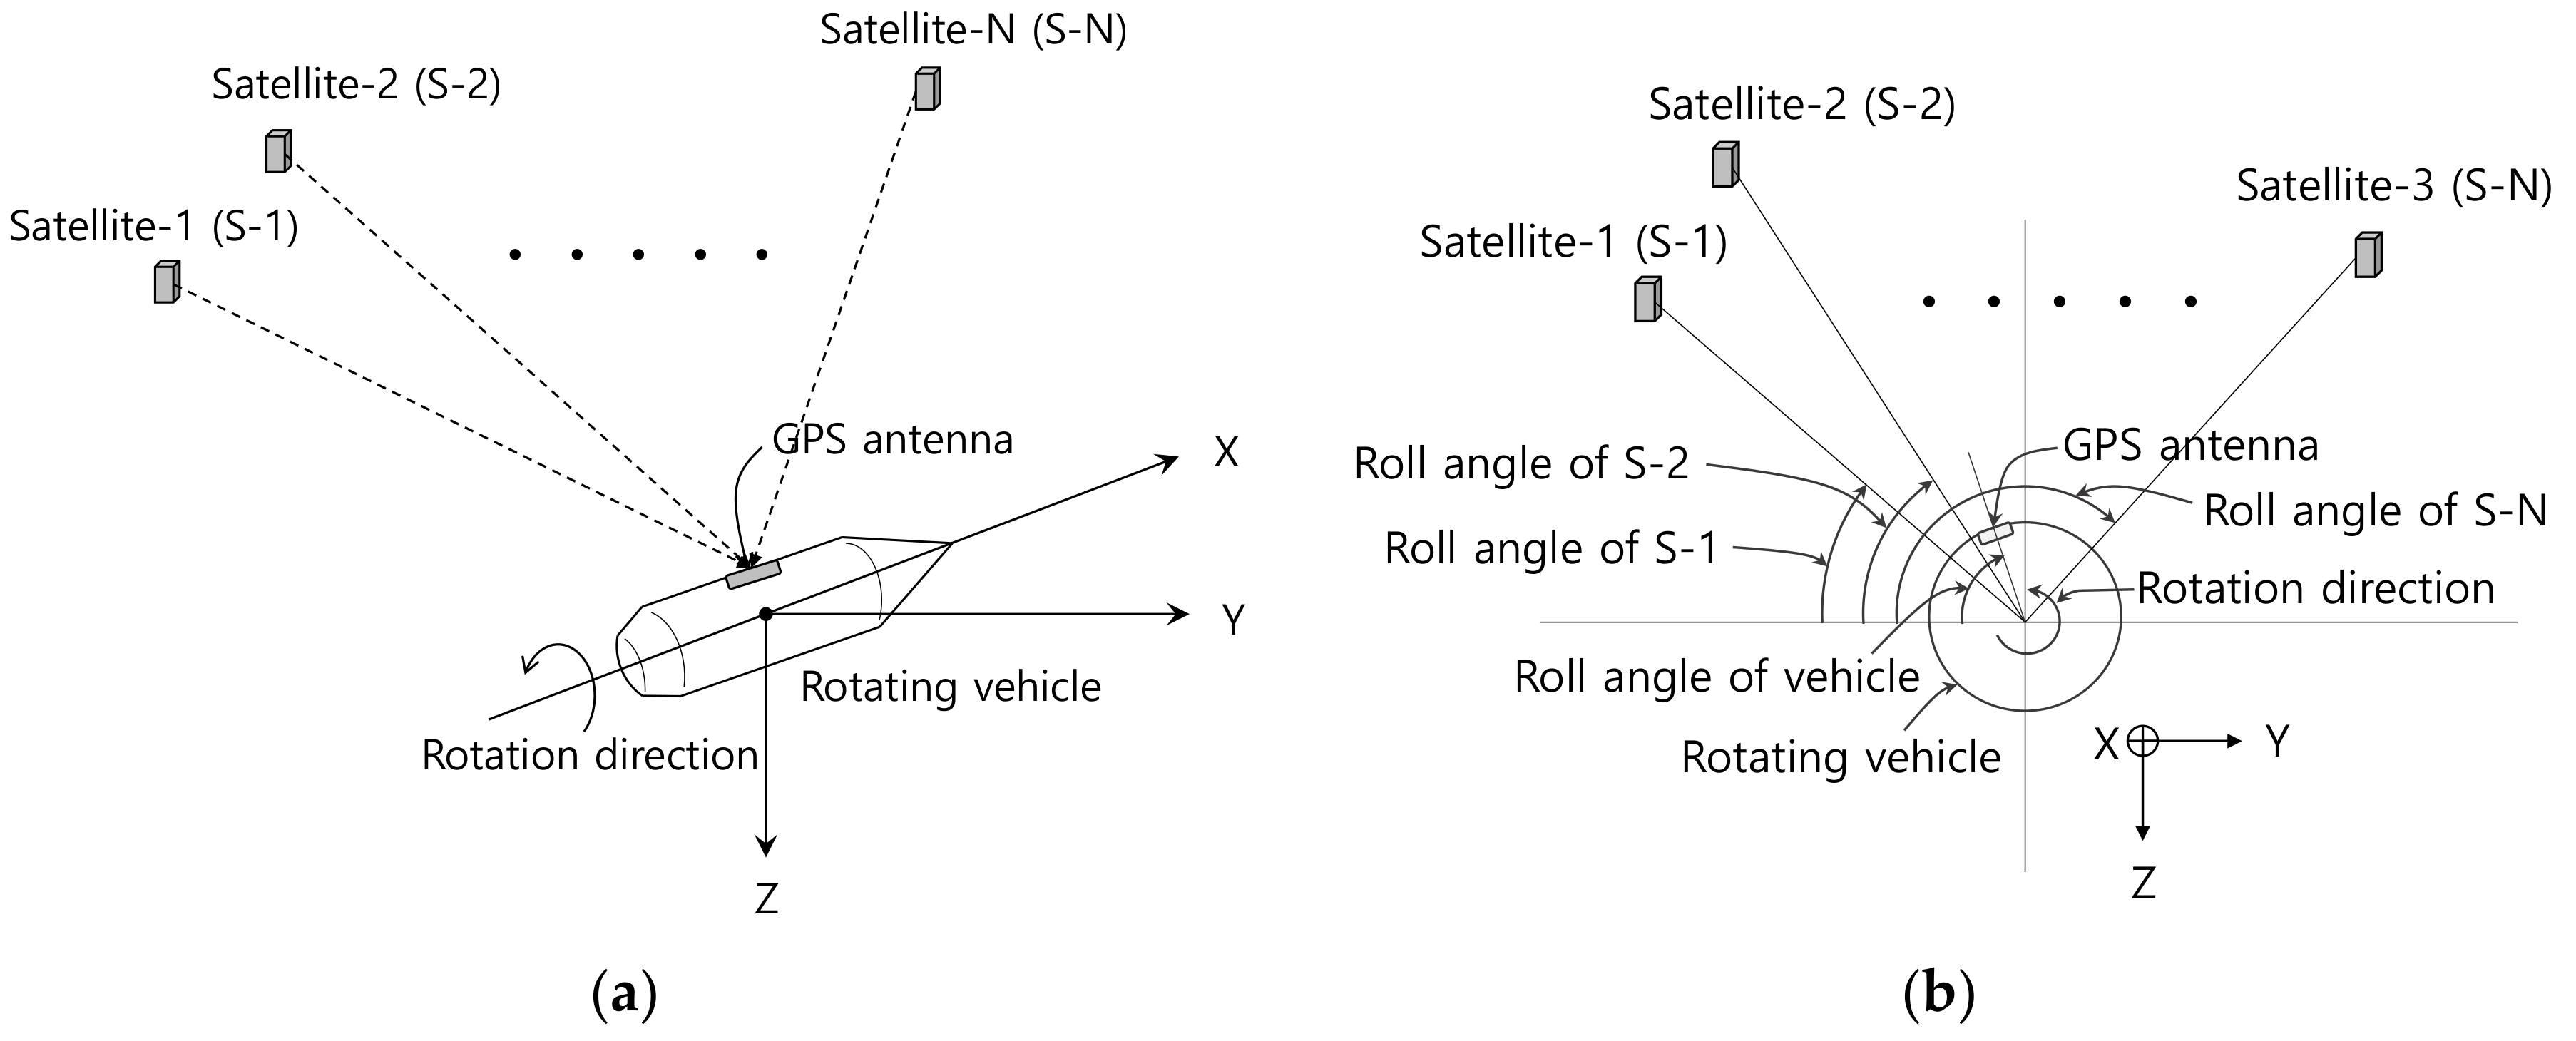
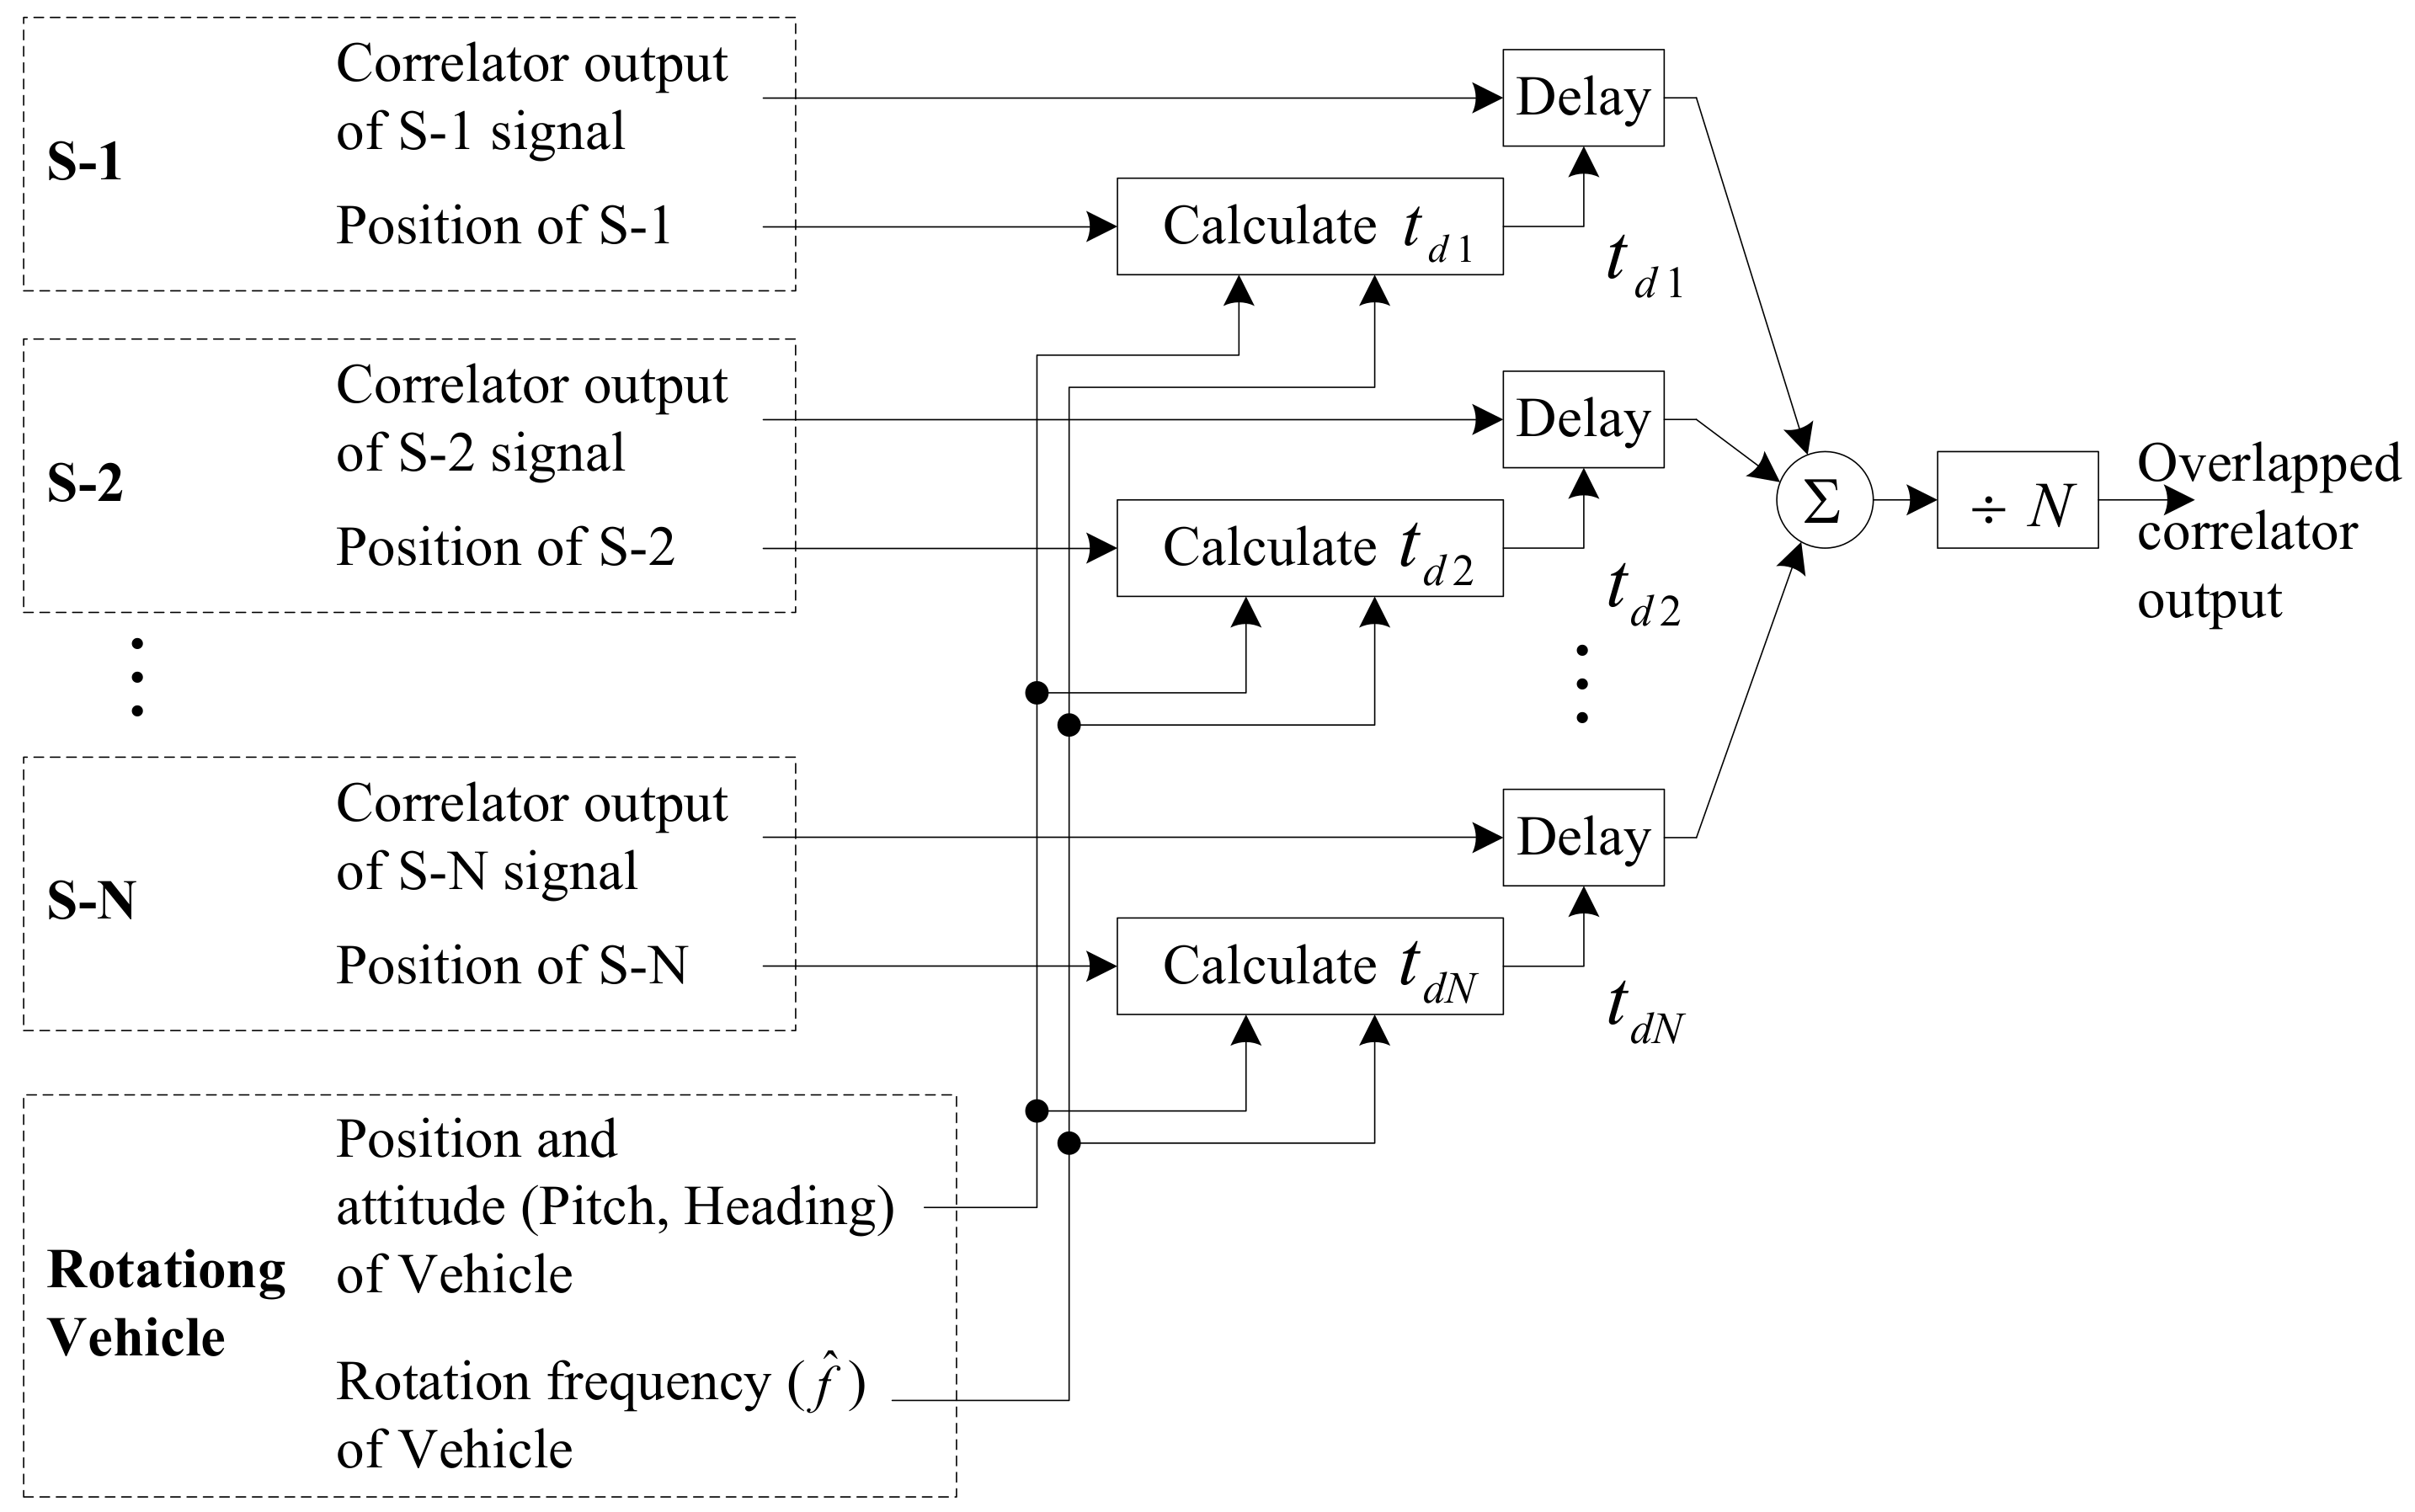
2.1. Signal Overlapping Algorithm
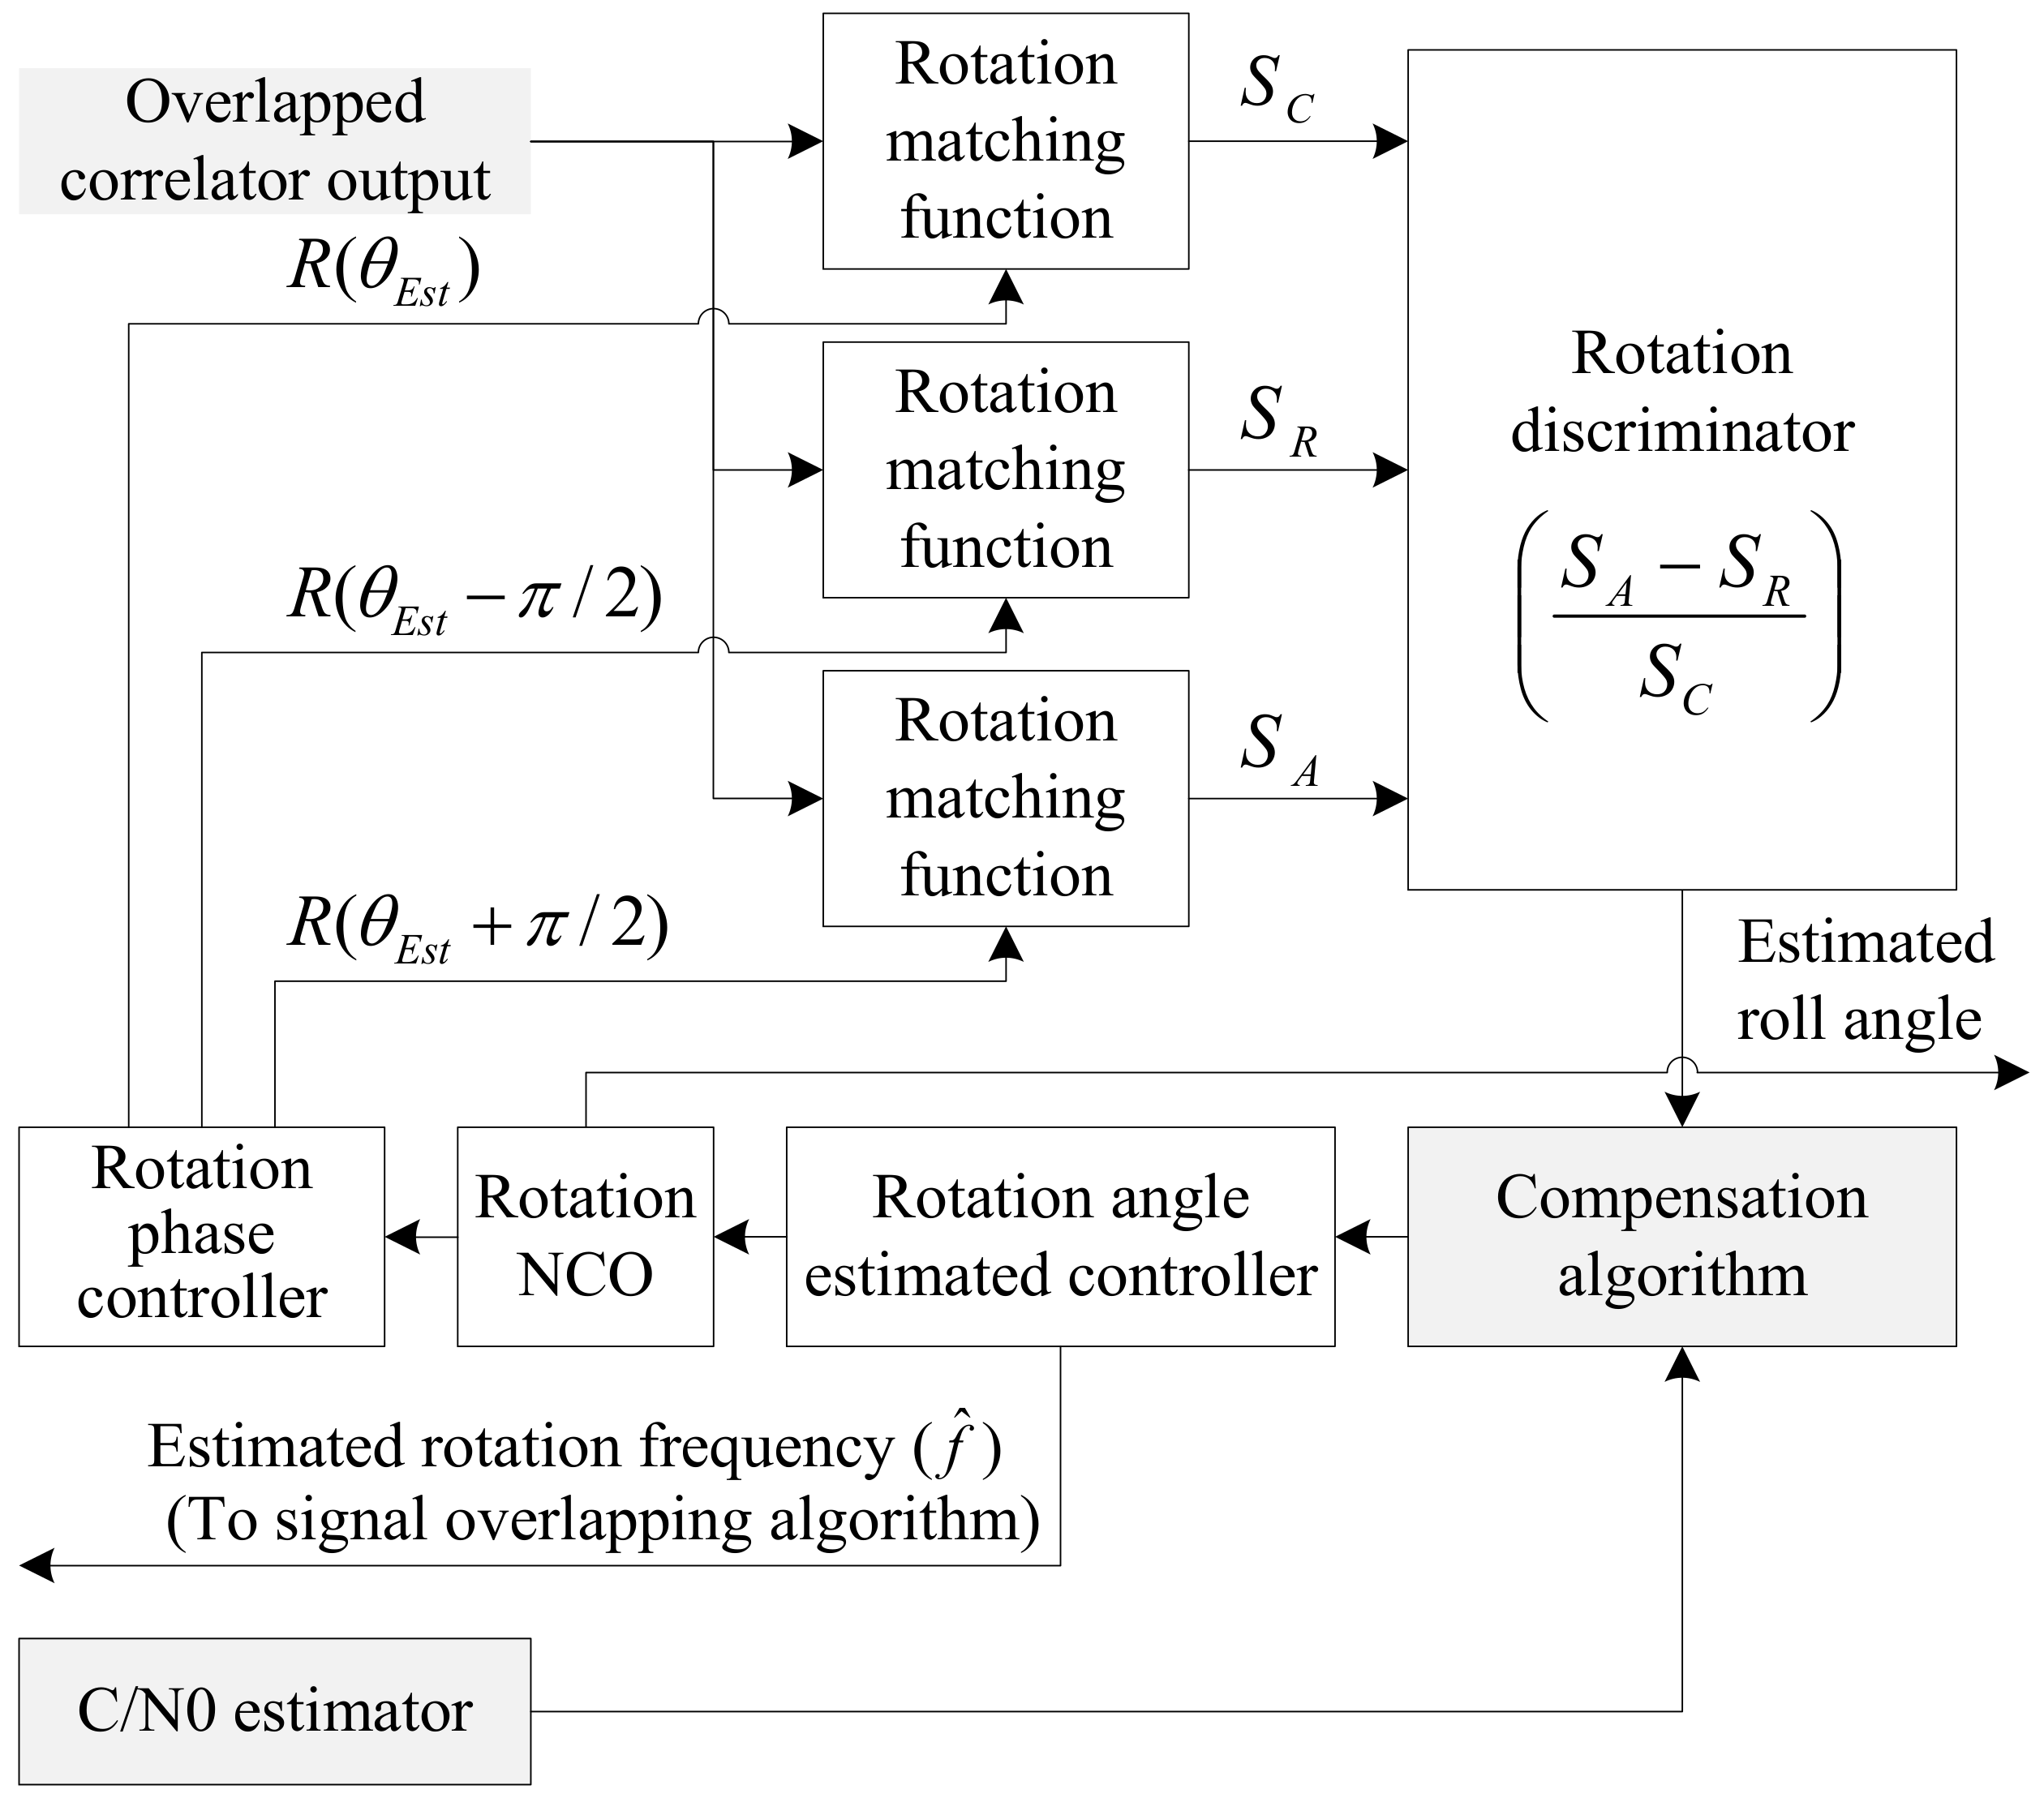
2.2. Compensation Algorithm
3. Simulation and Results
3.1. Verifying the Signal Overlapping Algorithm
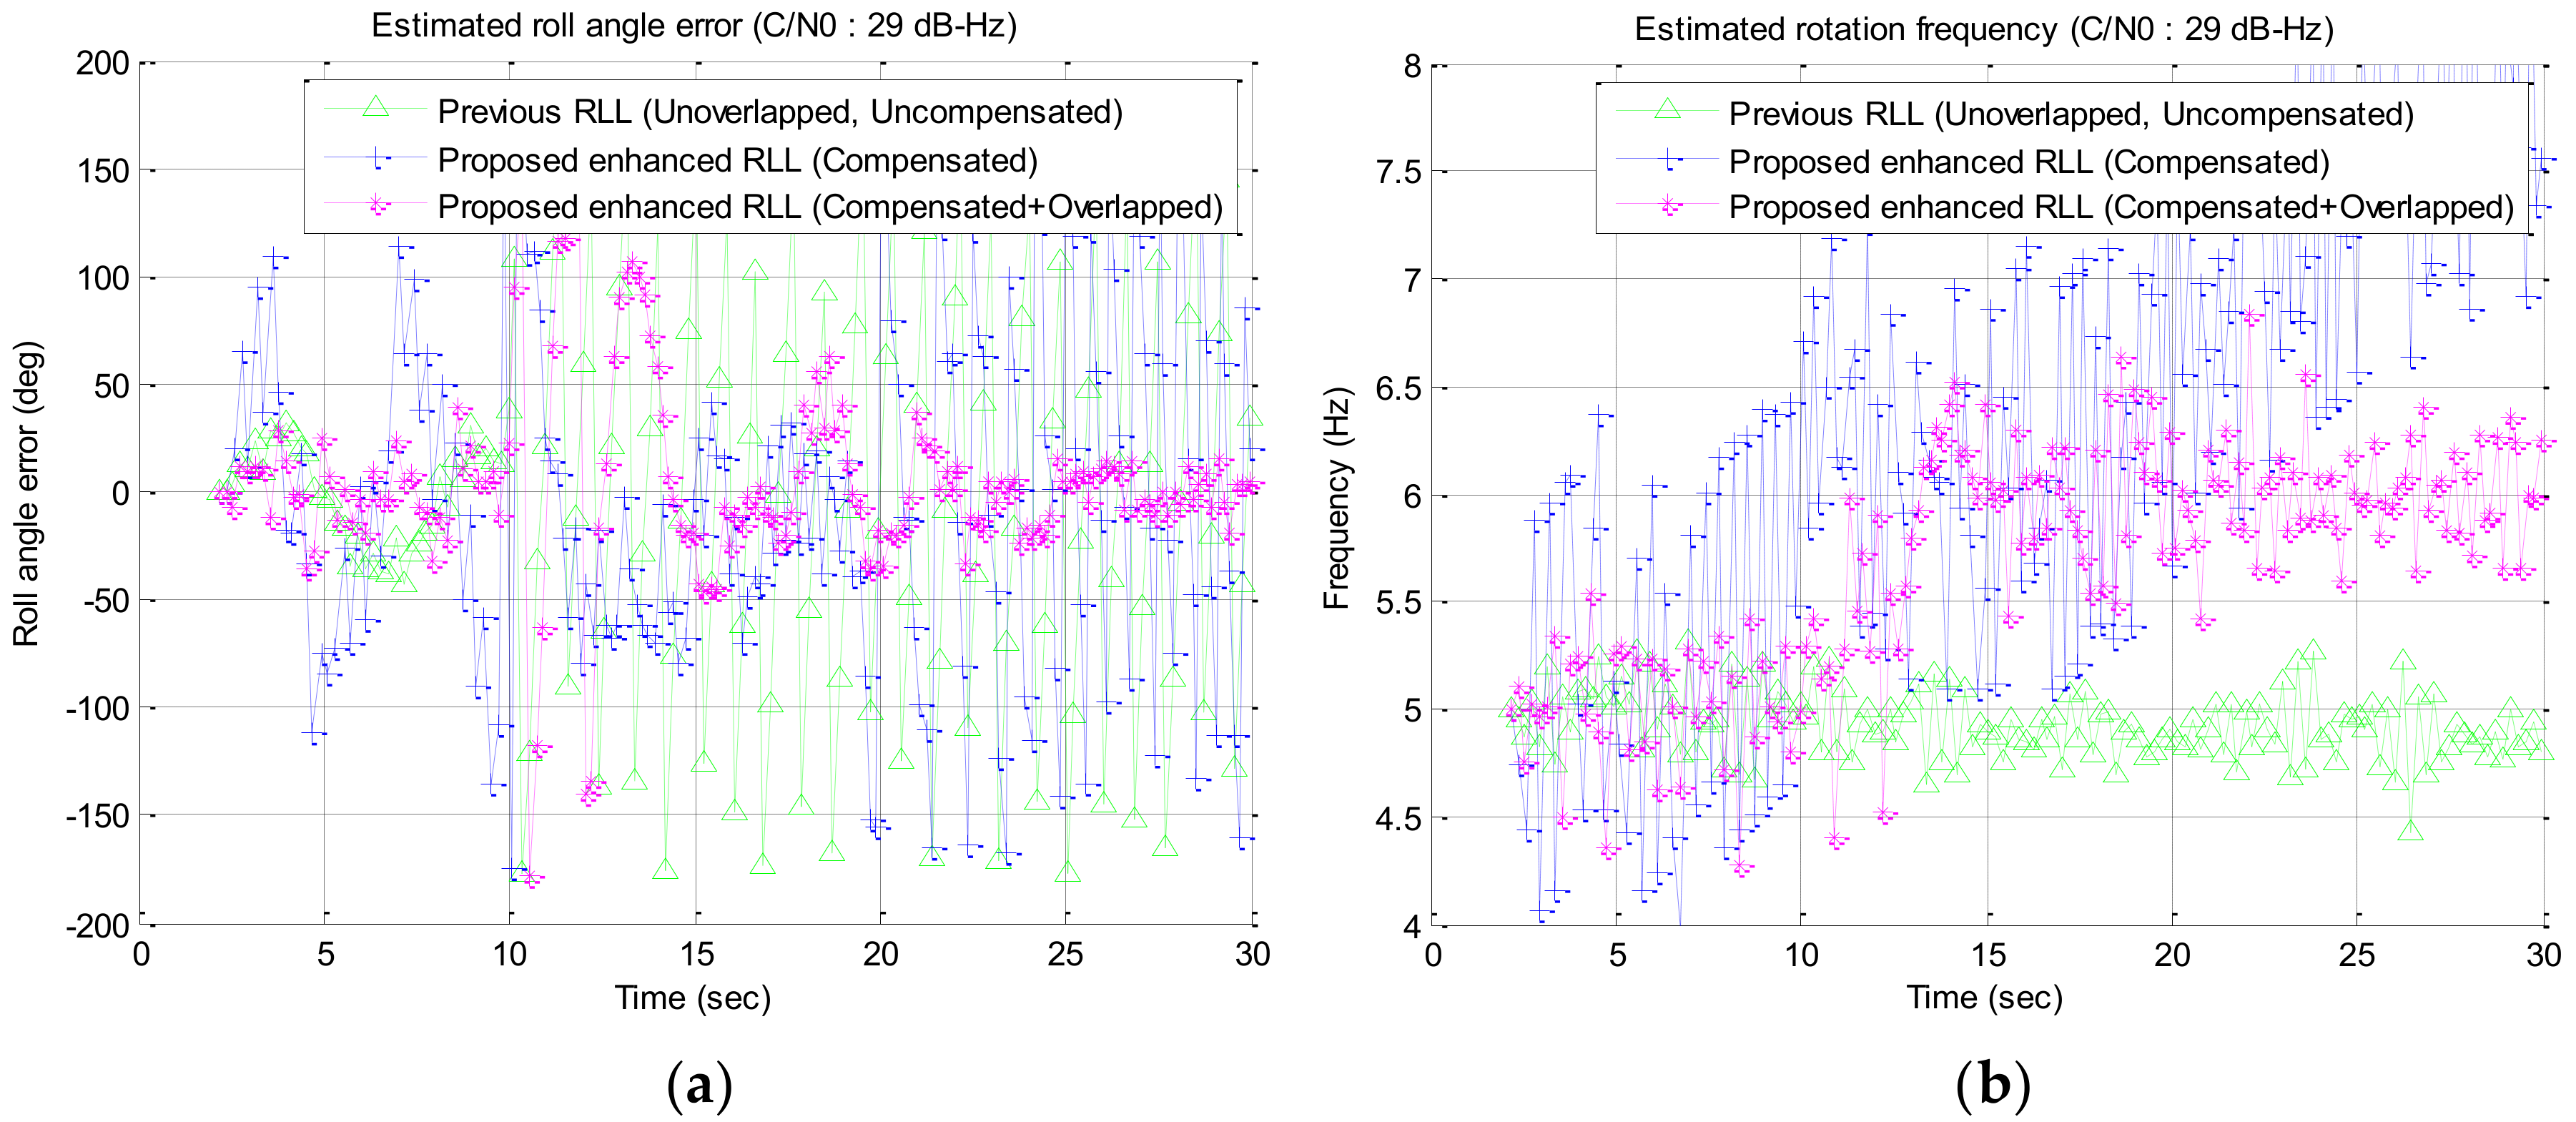
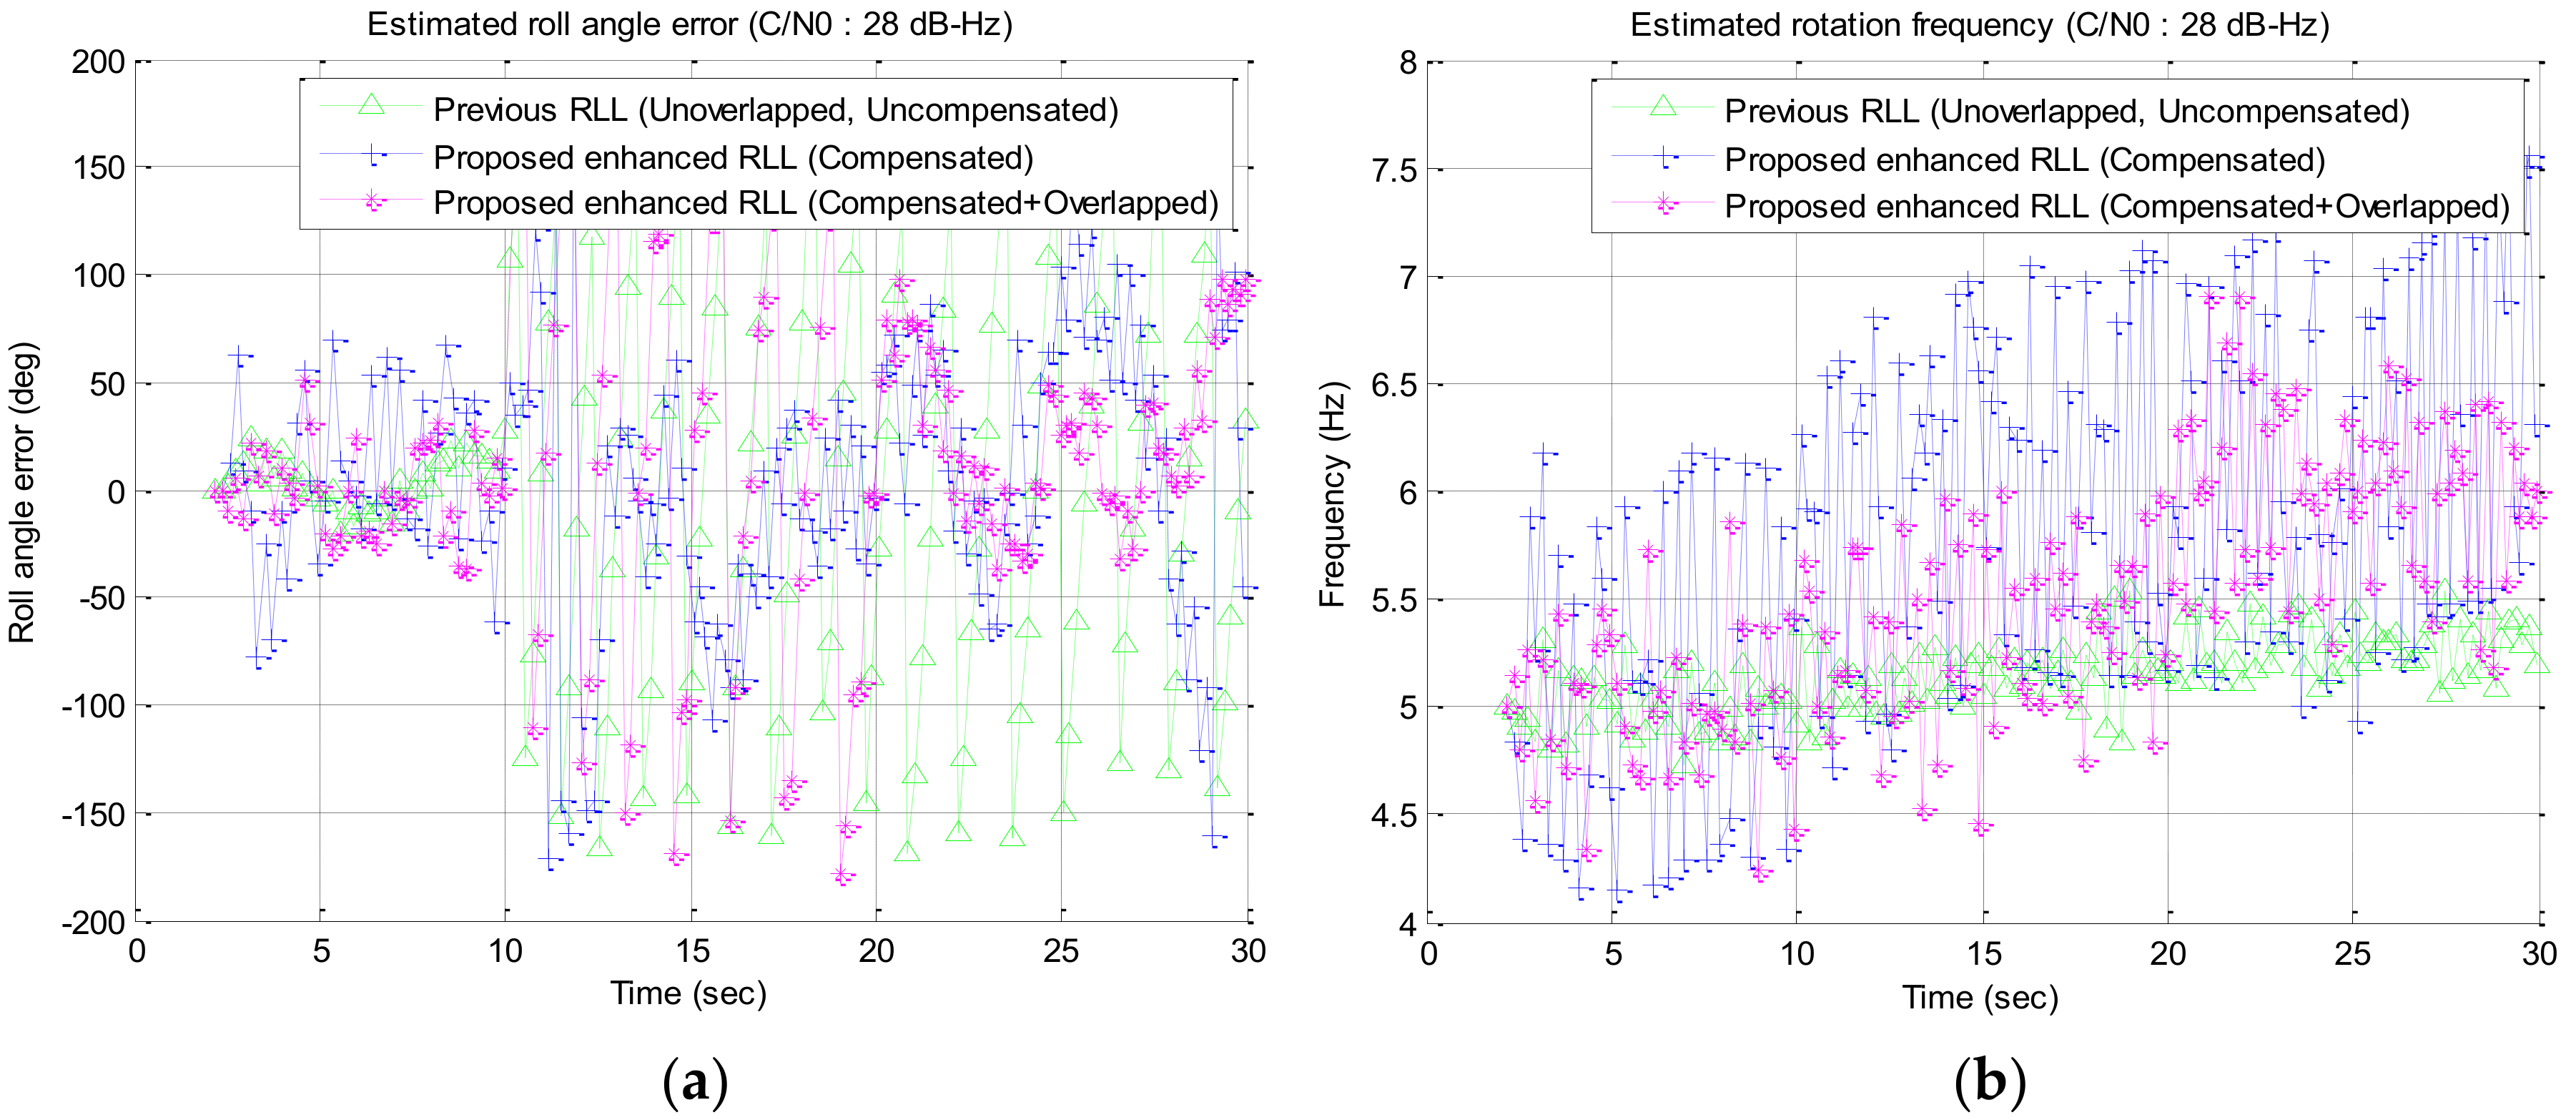
3.2. Proposed Enhanced RLL Algorithm
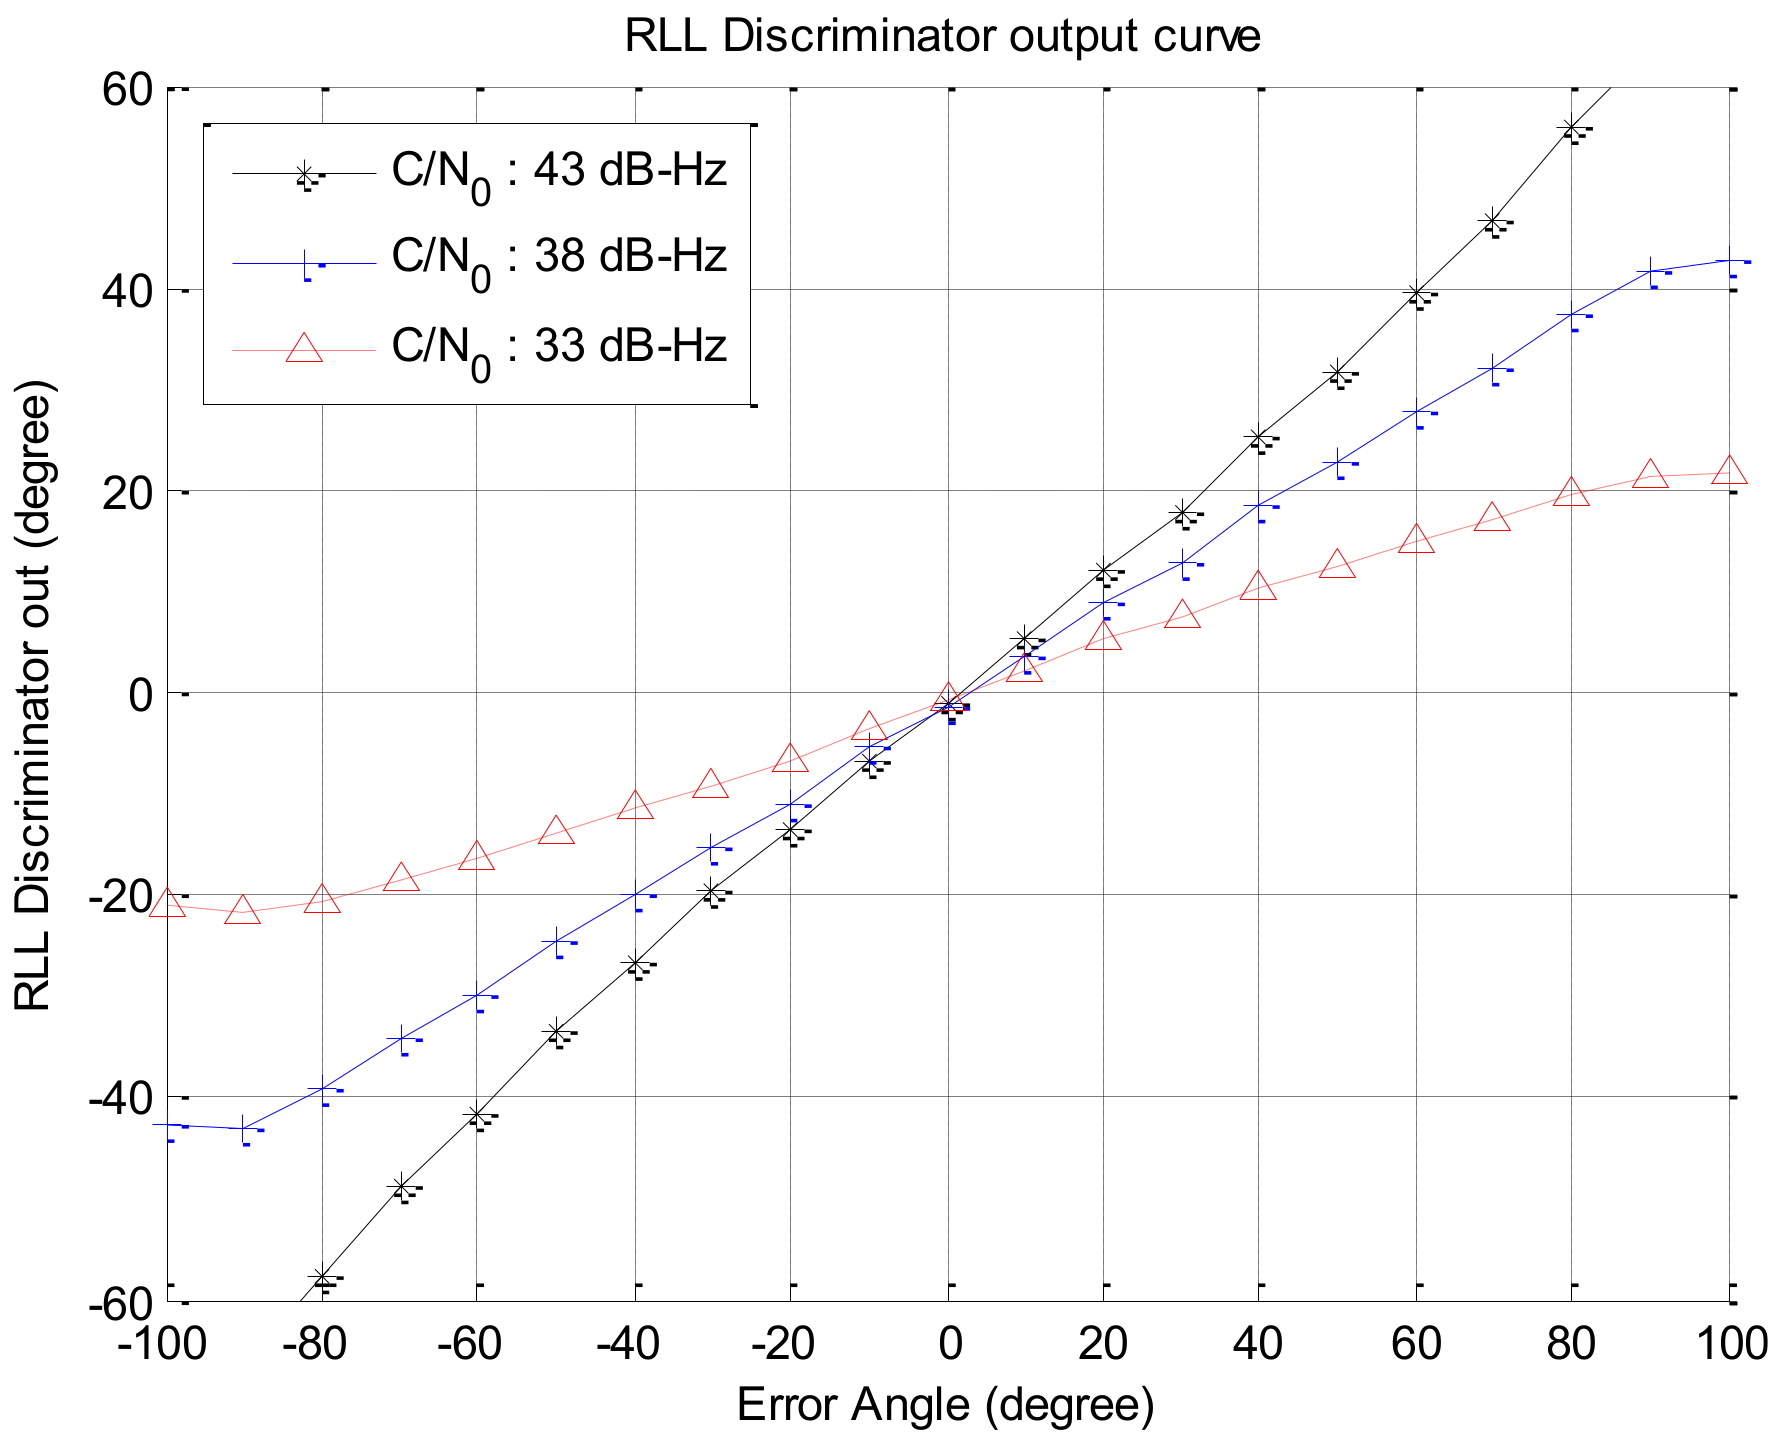
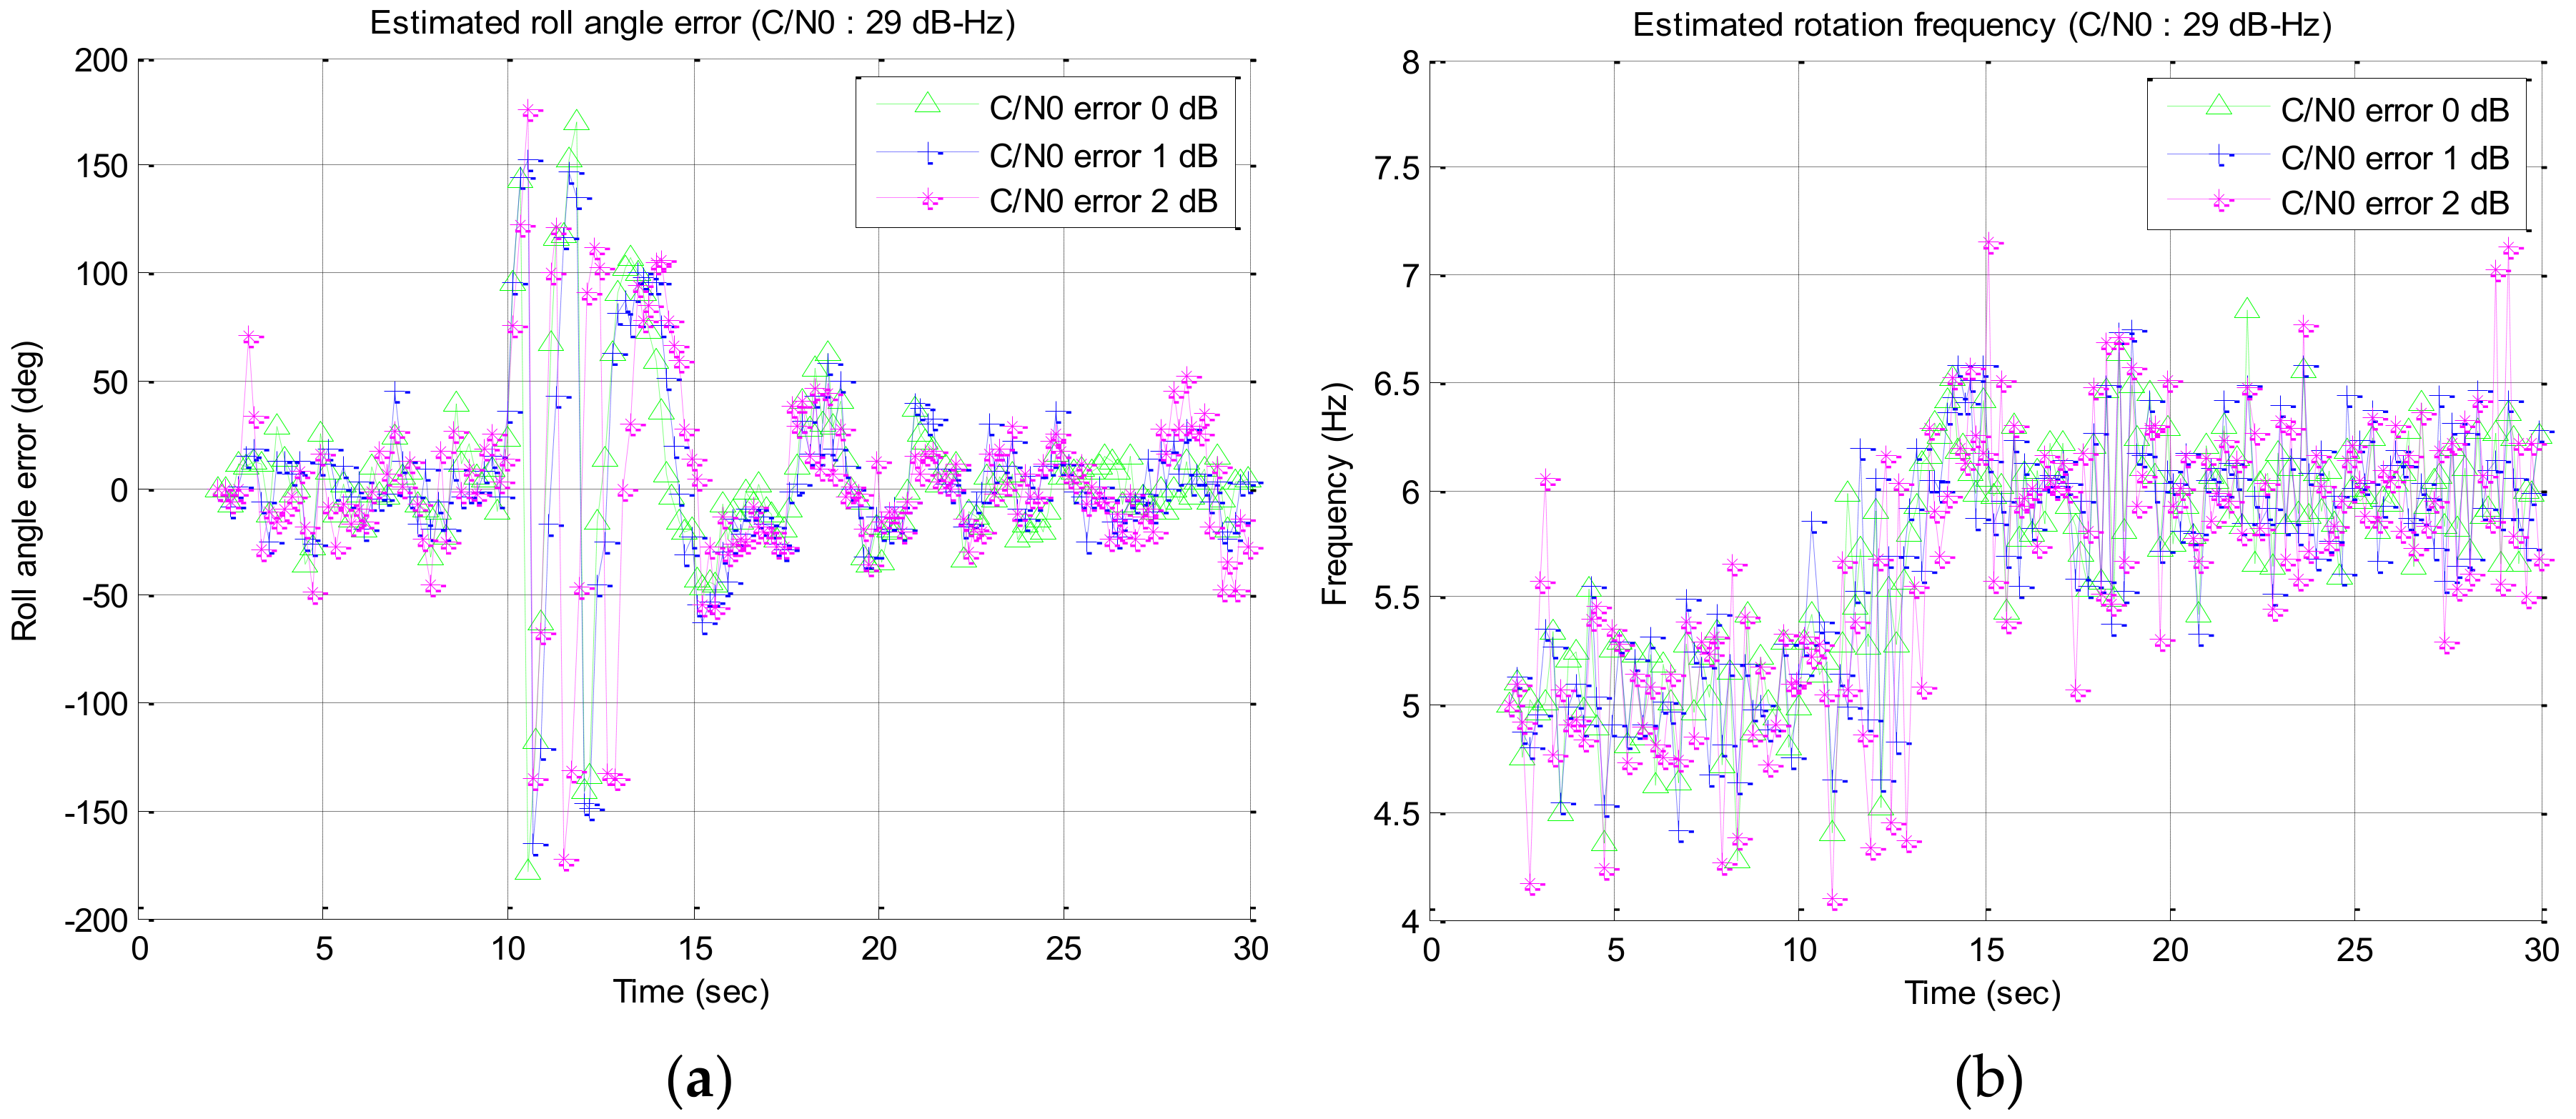
3.3. Effect of the C/N0 Estimation Error
4. Conclusions
Author Contributions
Funding
Conflicts of Interest
References
- Kaplan, E.D.; Hegarty, C.J. Understanding GPS Principles and Applications, 2nd ed.; Artech House, Inc.: Norwood, MA, USA, 2006; pp. 1–20. ISBN 1-58053-894-0. [Google Scholar]
- Doty, J.H. Advanced Spinning-Vehicle Navigation—A New Technique in Navigation on Munitions. In Proceedings of the ION 57th Annual Meeting, Albuquerque, NM, USA, 11–13 June 2001; pp. 745–754. [Google Scholar]
- Doty, J.H.; McGraw, G.A. Spinning Vehicle Navigation Using Apparent Modulation of Navigation Signals. U.S. Patent 6520448 B1, February 2003. [Google Scholar]
- Doty, J.H.; Anderson, D.A.; Bybee, T.B. A Demonstration of Advanced Spinning-Vehicle Navigation. In Proceedings of the ION NTM 2004, San Diego, CA, USA, 26–28 January 2004; pp. 573–584. [Google Scholar]
- Park, H.Y.; Kim, K.J.; Lee, J.G.; Park, C.G. Roll Angle Estimation for Smart Munitions. Proc. IFAC 2007, 40, 49–54. [Google Scholar] [CrossRef]
- Kim, J.W.; Kang, H.W.; Hwang, D.H.; Lee, S.J. Signal Tracking Method of GNSS Receivers for Spinning Vehicles. IJCAS 2012, 10, 529–535. [Google Scholar] [CrossRef]
- Choi, H.H. Roll Angle Estimation Technique Based RLL Using Satellite Navigation Signal. Ph.D. Thesis, Chungnam National University, Daejeon, Korea, 2015. [Google Scholar]
- Im, H.C.; Choi, Y.S.; Lee, S.J. Spin Effects of GPS Signals on a Multi-Antenna Mounted Vehicle. In Proceedings of the 2016 IEEE/ION Position, Location and Navigation Symposium (PLANS), Savannah, GA, USA, 11–14 April 2016; pp. 313–319. [Google Scholar]
- Im, H.C.; Lee, S.J. GPS Signal Tracking on a Multi-antenna Mounted Spinning Vehicle by Compensating for the Spin Effect. IJCAS 2018, 16, 867–874. [Google Scholar] [CrossRef]
- Misra, P.; Enge, P. Global Positioning System: Signals, Measurements, and Performance, 2nd ed.; Ganga-Jamuna Press: Lincoln, MA, USA, 2011; p. 485. ISBN 0-9709544-1-7. [Google Scholar]
- Pini, M.; Falletti, E.; Fantino, M. Performance Evaluation of C/N0 Estimators Using a Real Time GNSS Software Receiver. In Proceedings of the 2008 IEEE 10th International Symposium on Spread Spectrum Techniques and Applications, Bologna, Italy, 25–28 August 2008; pp. 28–31. [Google Scholar]


| C_eg = [ −sin(lat) × cos(lon); −sin(lat) × sin(lon); cos(lat); | // transformation matrix | |
| −sin(lon); cos(lon); 0; | // lat: latitude of a vehicle | |
| −cos(lat) × cos(lon); −cos(lat) × sin(lon); −sin(lat) ]; | // lon: longitude of a vehicle | |
| R = S − P; | // S, P: satellite’s and vehicle’s position in ECEF | |
| u_e = R/norm(R); | // unit vector to the direction of the satellite | |
| u_g = C_eg × u_e; | // u_e represented by NED | |
| Az = atan(u_g(2)/u_g(1)); | // Azimuth of the satellite | |
| El = atan(u_g(3)/norm(u_g(1), u_g(2)); | // Elevation of the satellite | |
| if (sin(Az − phi_p) > 0) | // phi_p: heading of the vehicle | |
| phi_s = (pi − El) × sin(Az − phi_p); | // roll angle of the satellite | |
| else | // pitch angle is assumed to be zero | |
| phi_s = El × sin(Az − phi_p); | // roll angle of the satellite | |
| end if | ||
| t_d = phi_s/(2 × pi × f); | // t_d: time delay to synchronize the signals | |
| Simulation Conditions | Simulation Results | |||||
|---|---|---|---|---|---|---|
| Signal Strength (C/N0) | Algorithm | Estimated Roll Angle Error (Degree) | Estimated Rotation Frequency (Hz) | Converged Region | ||
| Mean | STD | Mean | STD | |||
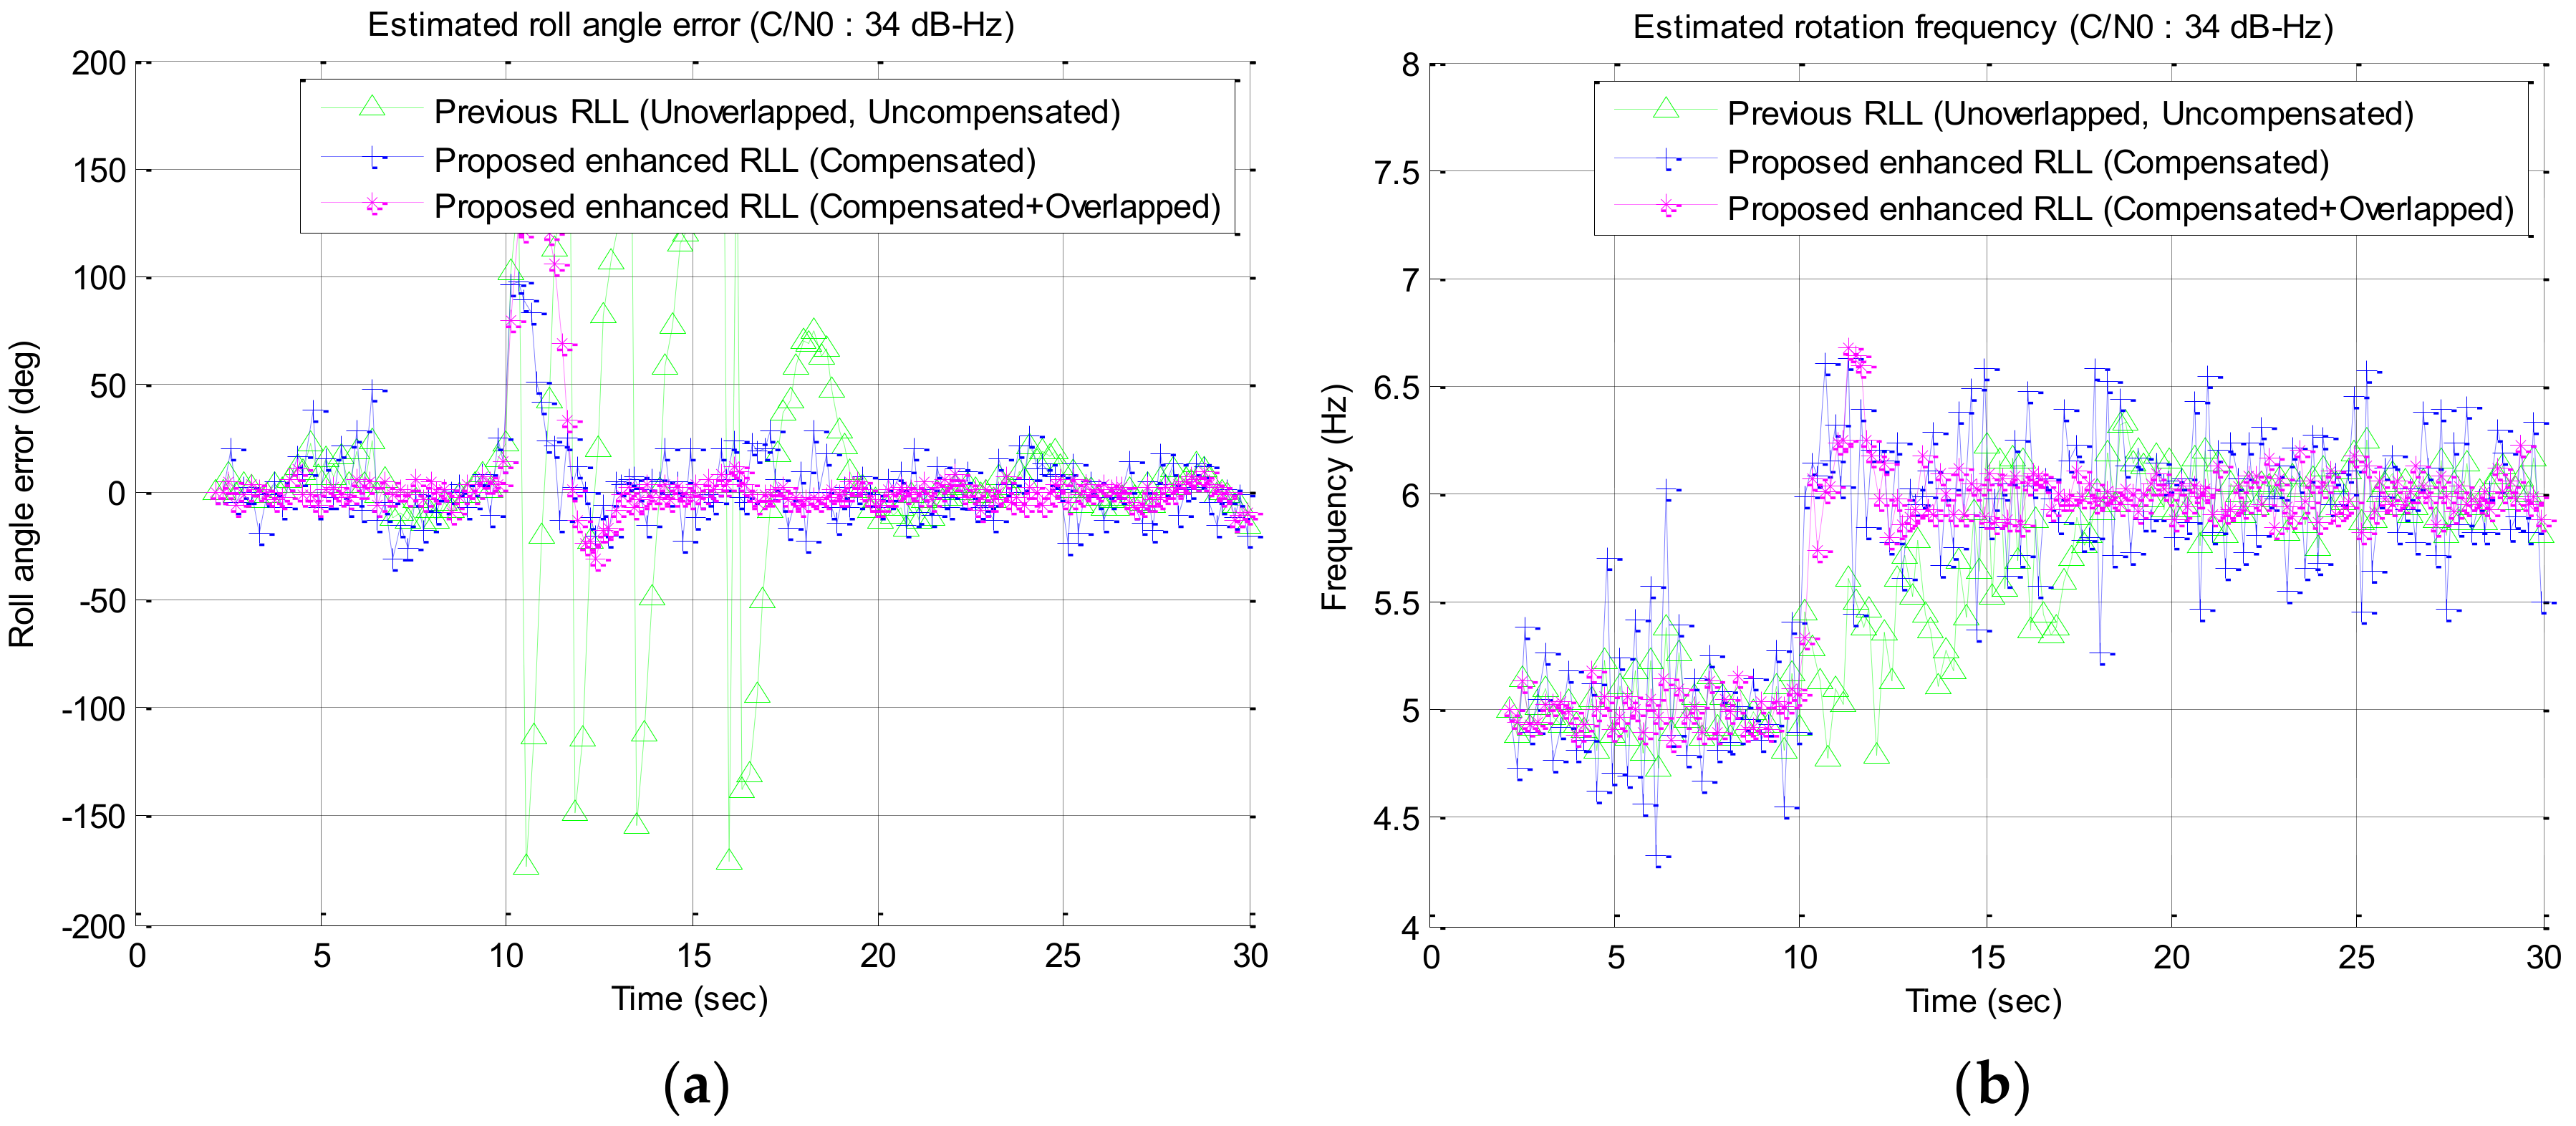
| 34 dB–Hz | Previous RLL | 0.9 | 8.3 | 6.00 | 0.12 | 20–30 s |
| Proposed RLL-C | 1.7 | 12.0 | 6.01 | 0.29 | 12–30 s | |
| Proposed RLL-C/O | 0.0 | 4.5 | 6.00 | 0.08 | 13–30 s | |
| 33 dB–Hz | Previous RLL | 2.16 | 8.2 | 6.01 | 0.15 | 25–30 s |
| Proposed RLL-C | −5.25 | 20.5 | 6.05 | 0.53 | 14–30 s | |
| Proposed RLL-C/O | −0.59 | 5.1 | 6.00 | 0.10 | 14–30 s | |
| 32 dB–Hz | Previous RLL | 20.0 | 18.1 | 5.98 | 0.14 | 27–30 s |
| Proposed RLL-C | −4.05 | 21.9 | 6.06 | 0.59 | 13–30 s | |
| Proposed RLL-C/O | −0.36 | 10.4 | 6.00 | 0.12 | 13–30 s | |
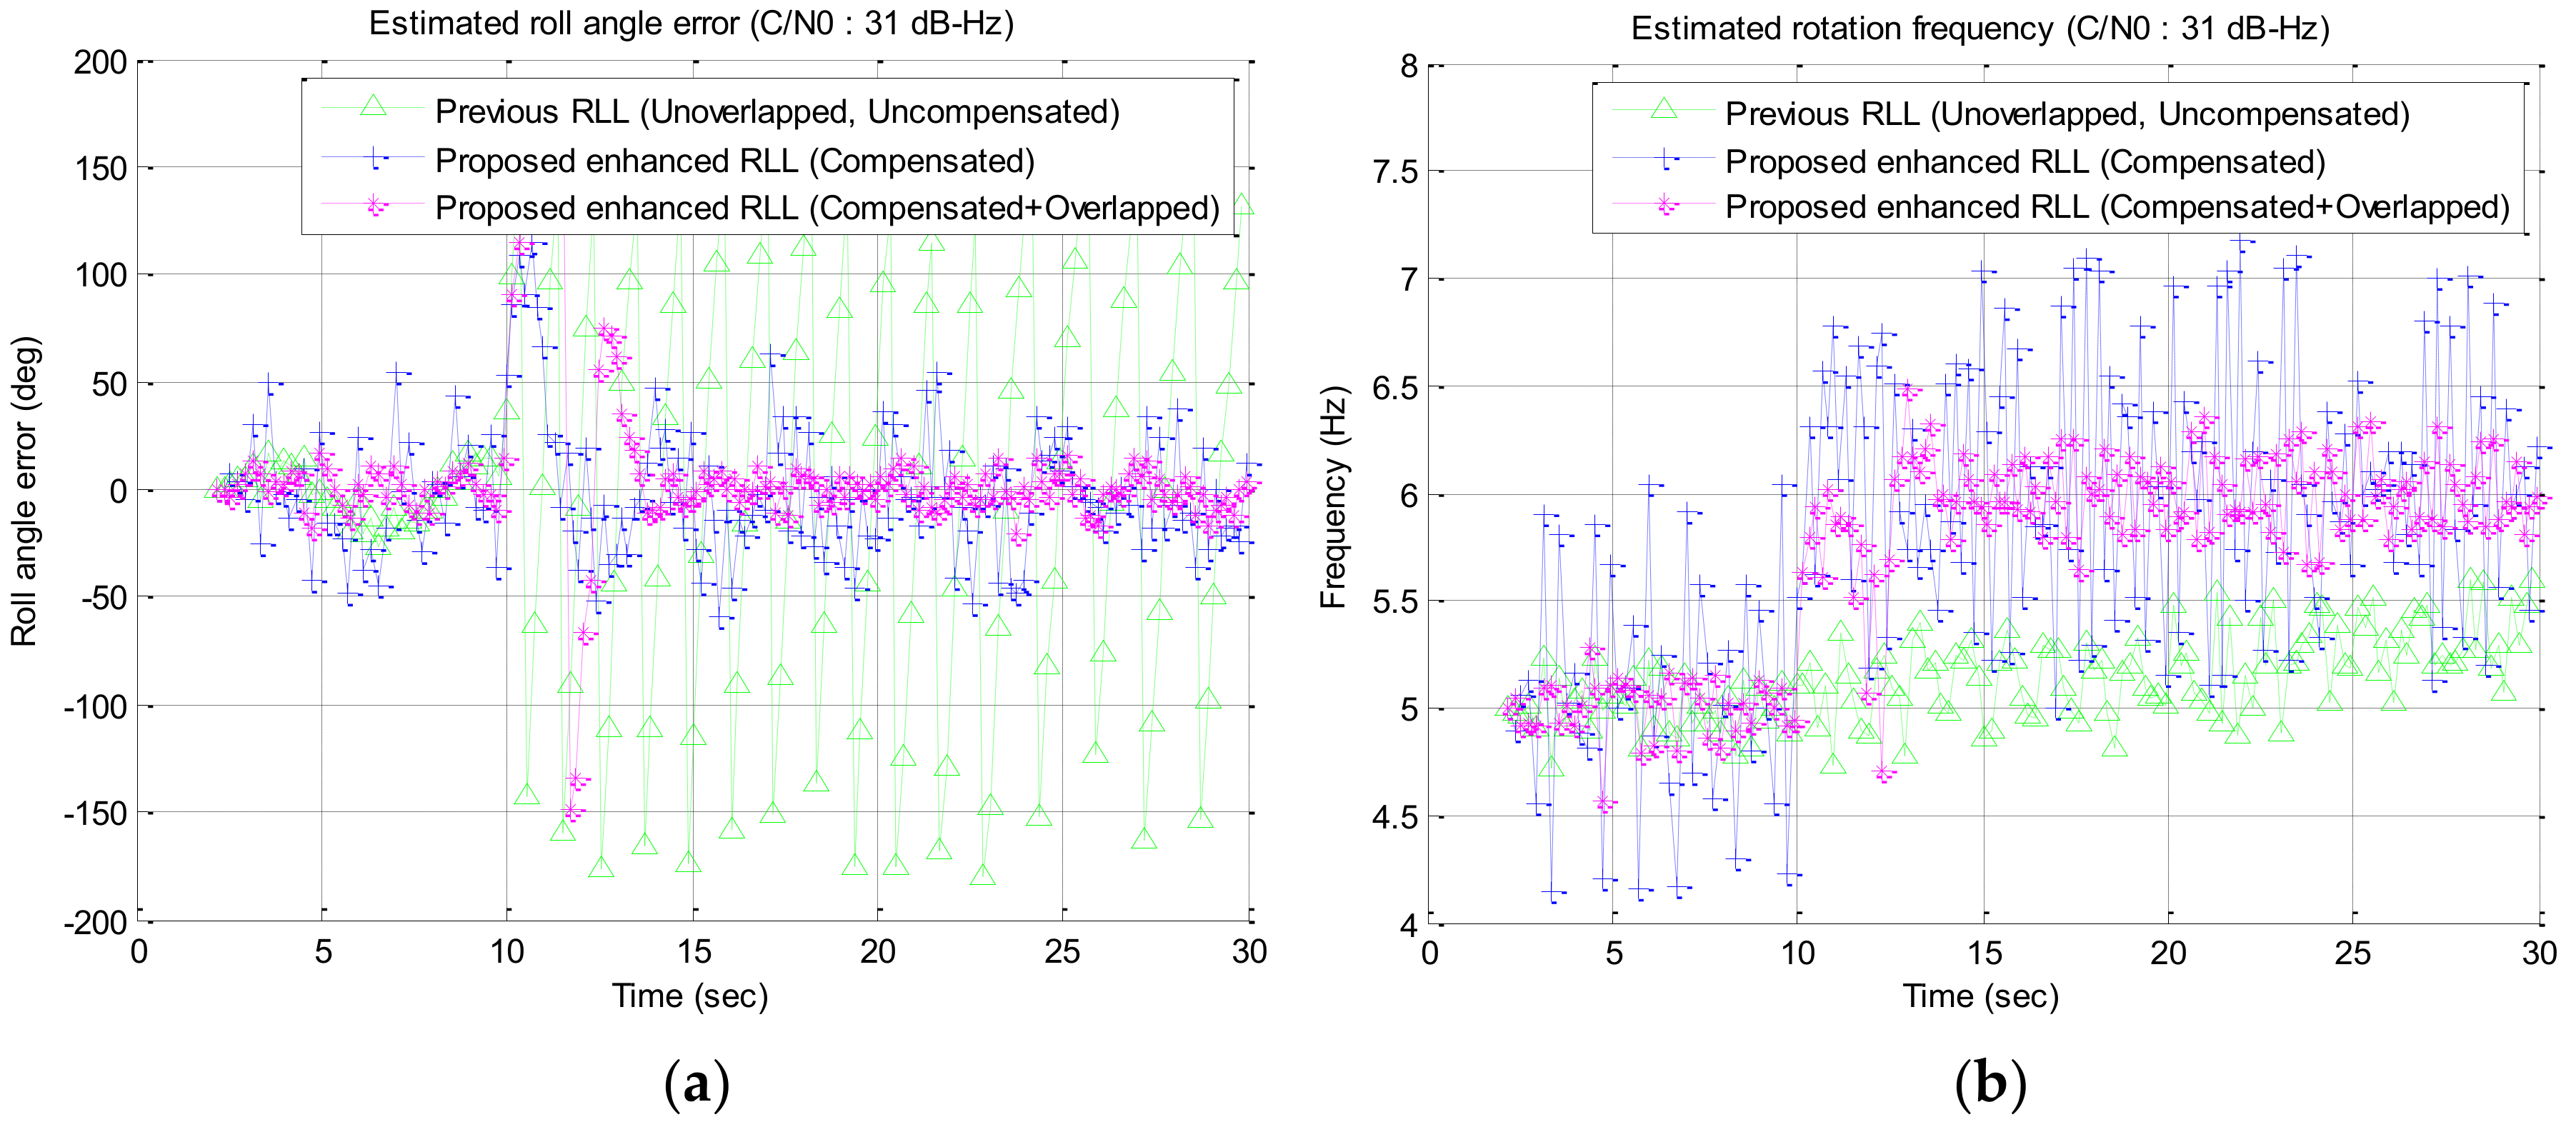
| 31 dB–Hz | Previous RLL | - | (Fail) | |||
| Proposed RLL-C | −4.6 | 25.0 | 6.06 | 0.60 | 14–30 s | |
| Proposed RLL-C/O | −0.1 | 7.6 | 6.00 | 0.16 | 14–30 s | |
| 30 dB–Hz | Previous RLL | (Fail) | ||||
| Proposed RLL-C | (Fail) | |||||
| Proposed RLL-C/O | −5.4 | 12.9 | 6.00 | 0.21 | 15–30 s | |
| 29 dB–Hz | Previous RLL | (Fail) | ||||
| Proposed RLL-C | (Fail) | |||||
| Proposed RLL-C/O | −2.0 | 20.4 | 6.01 | 0.27 | 15–30 s | |
| 28 dB–Hz | Previous RLL | (Fail) | ||||
| Proposed RLL-C | (Fail) | |||||
| Proposed RLL-C/O | 28.2 | 38.5 | 6.01 | 0.40 | 20–30 s | |
| Bolded lines denote the marginal points where RLL stably track the roll angle. – Previous RLL (algorithm is not applied): 33 dB–Hz – Proposed RLL-C (compensation algorithm is applied): 31 dB–Hz – Proposed RLL-C/O (compensation and overlapping algorithms are applied): 29 dB–Hz | ||||||
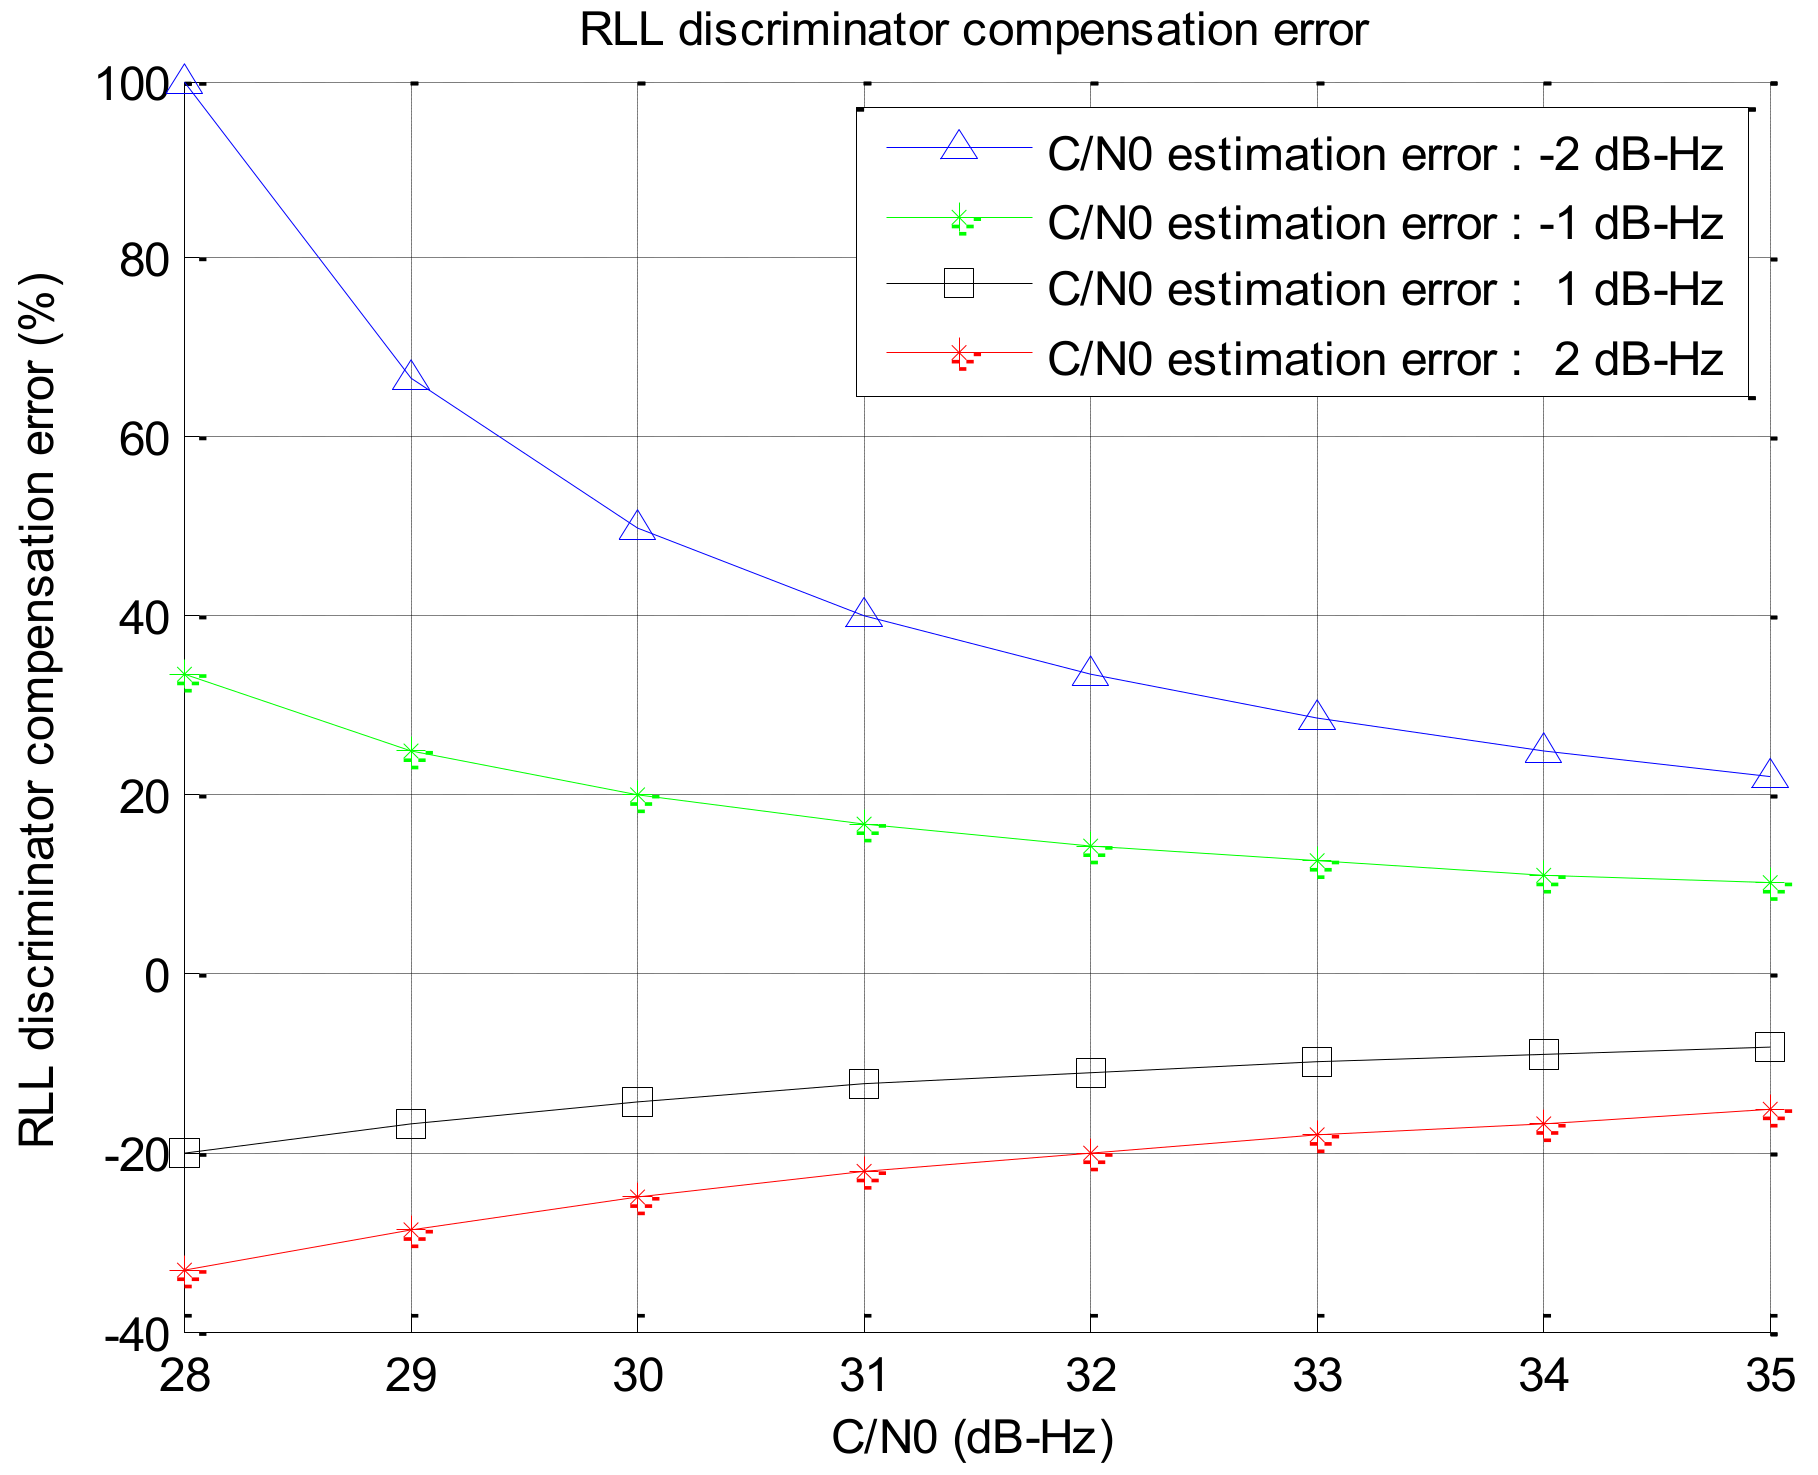
| Test Case | C/N0 Error | Simulation Results | ||||||
|---|---|---|---|---|---|---|---|---|
| Estimated Roll Angle Error (Degree) | Estimated Rotation Frequency (Hz) | Converged Region | ||||||
| Mean | STD | Increment | Mean | STD | Increment | |||
| Case 1 | None | −2.0 | 20.4 | - | 6.01 | 0.27 | - | 15–30 s |
| Case 2 | 1 dB–Hz | −2.0 | 20.8 | 2.0 % | 6.01 | 0.33 | 22.2 % | 15–30 s |
| Case 3 | 2 dB–Hz | −2.0 | 21.8 | 6.9 % | 6.02 | 0.38 | 40.7 % | 15–30 s |
© 2018 by the authors. Licensee MDPI, Basel, Switzerland. This article is an open access article distributed under the terms and conditions of the Creative Commons Attribution (CC BY) license (http://creativecommons.org/licenses/by/4.0/).
Share and Cite
Im, H.C.; Lim, D.W.; Lee, S.J. Design of Enhanced Rotation Locked Loop for Roll Angle Estimation of Rotating Vehicle in a Weak GPS Signal Environment. Sensors 2019, 19, 80. https://doi.org/10.3390/s19010080
Im HC, Lim DW, Lee SJ. Design of Enhanced Rotation Locked Loop for Roll Angle Estimation of Rotating Vehicle in a Weak GPS Signal Environment. Sensors. 2019; 19(1):80. https://doi.org/10.3390/s19010080
Chicago/Turabian StyleIm, Hun Cheol, Deok Won Lim, and Sang Jeong Lee. 2019. "Design of Enhanced Rotation Locked Loop for Roll Angle Estimation of Rotating Vehicle in a Weak GPS Signal Environment" Sensors 19, no. 1: 80. https://doi.org/10.3390/s19010080
APA StyleIm, H. C., Lim, D. W., & Lee, S. J. (2019). Design of Enhanced Rotation Locked Loop for Roll Angle Estimation of Rotating Vehicle in a Weak GPS Signal Environment. Sensors, 19(1), 80. https://doi.org/10.3390/s19010080