Automatic Emotion Perception Using Eye Movement Information for E-Healthcare Systems


Abstract
1. Introduction
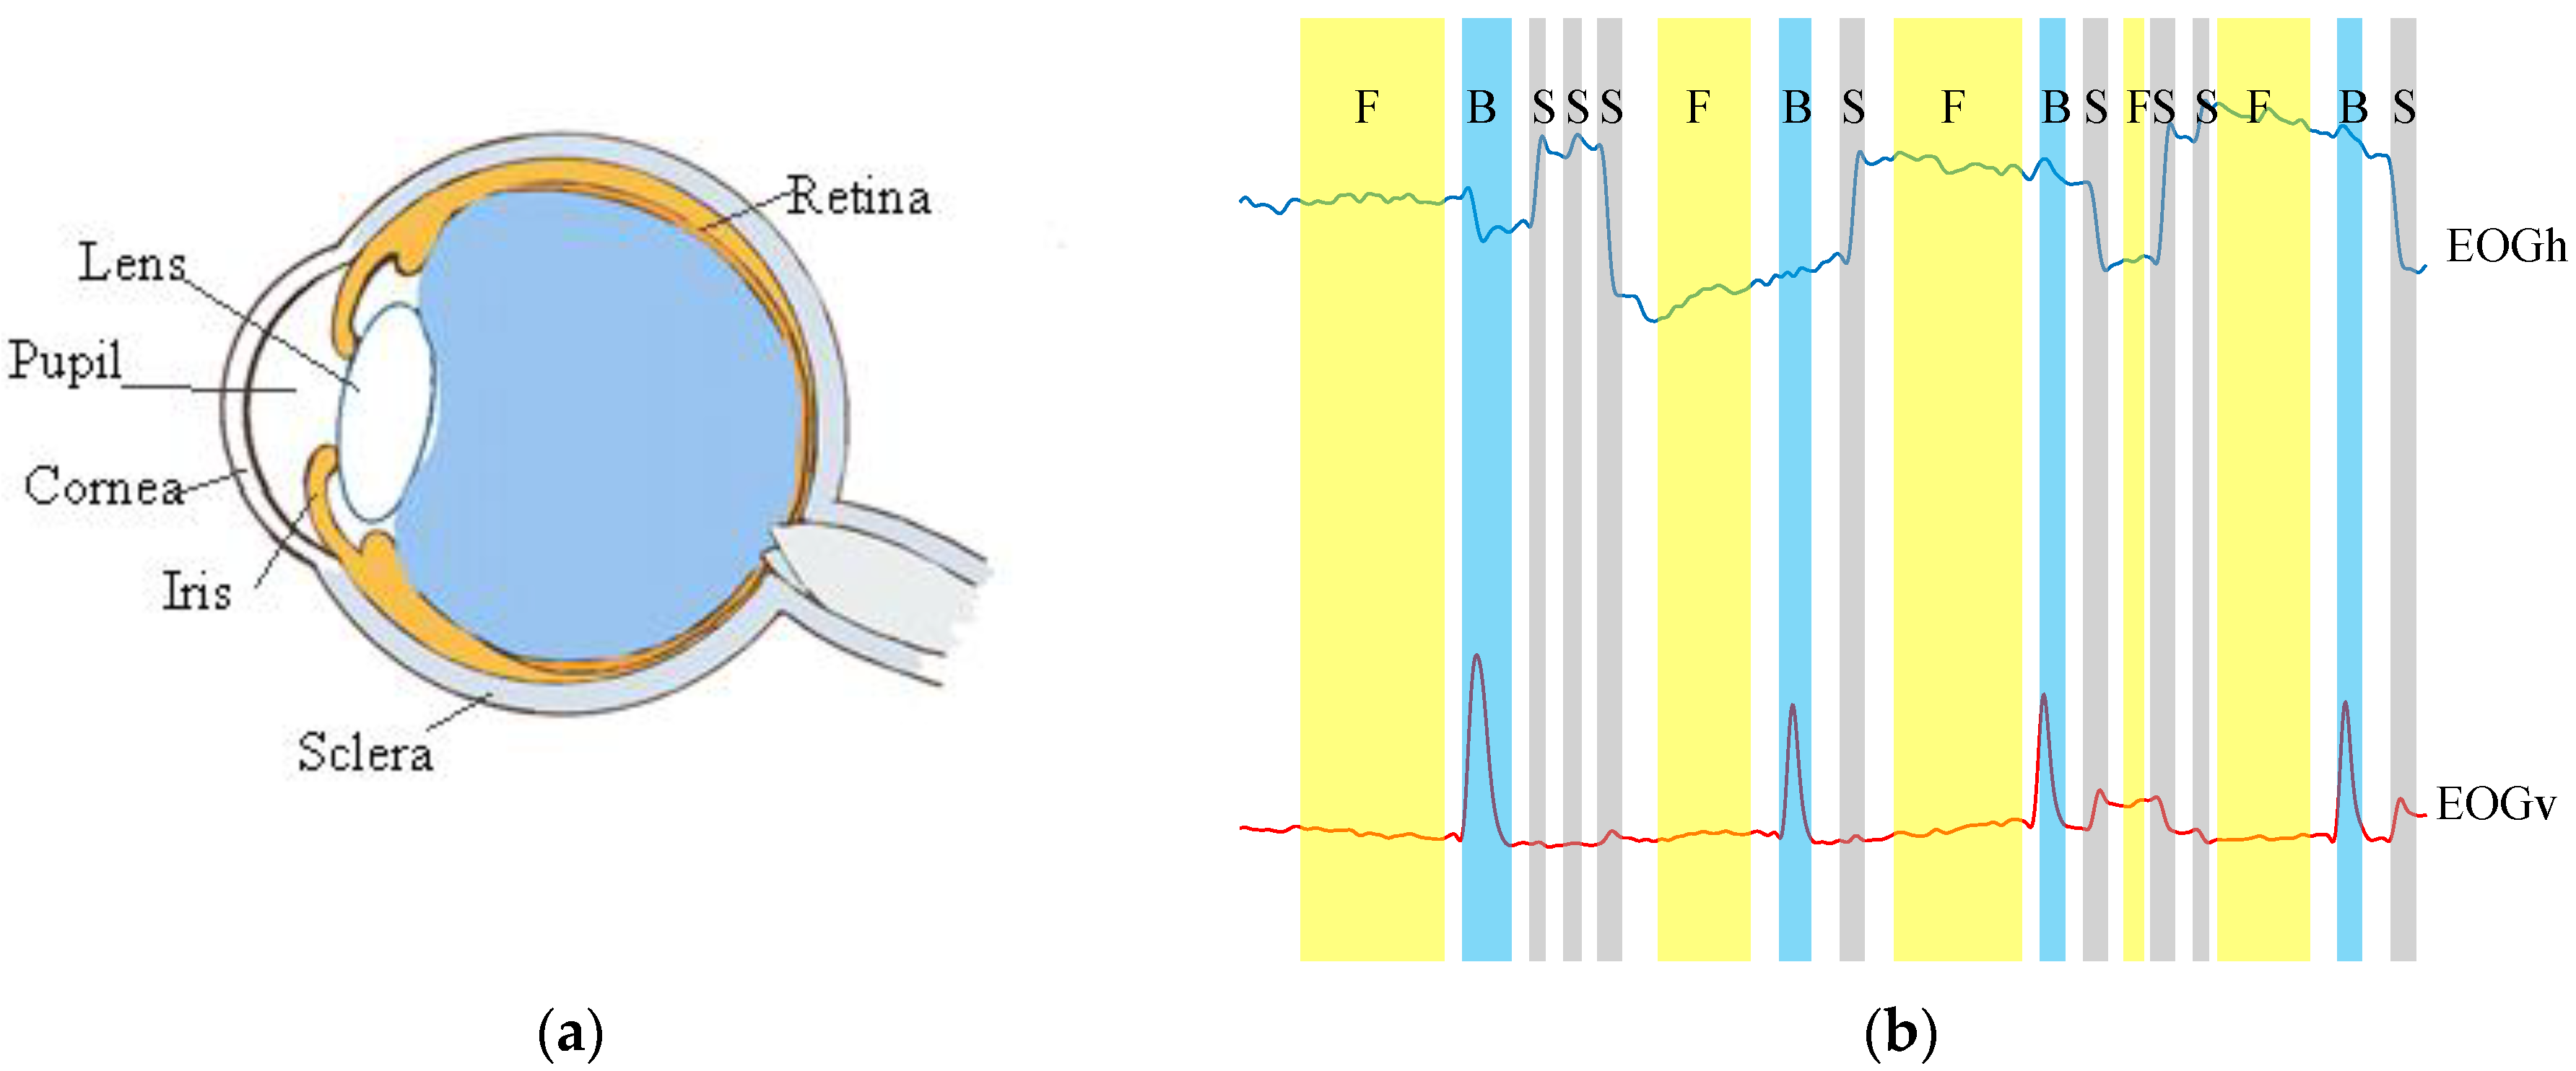
2. Preliminaries
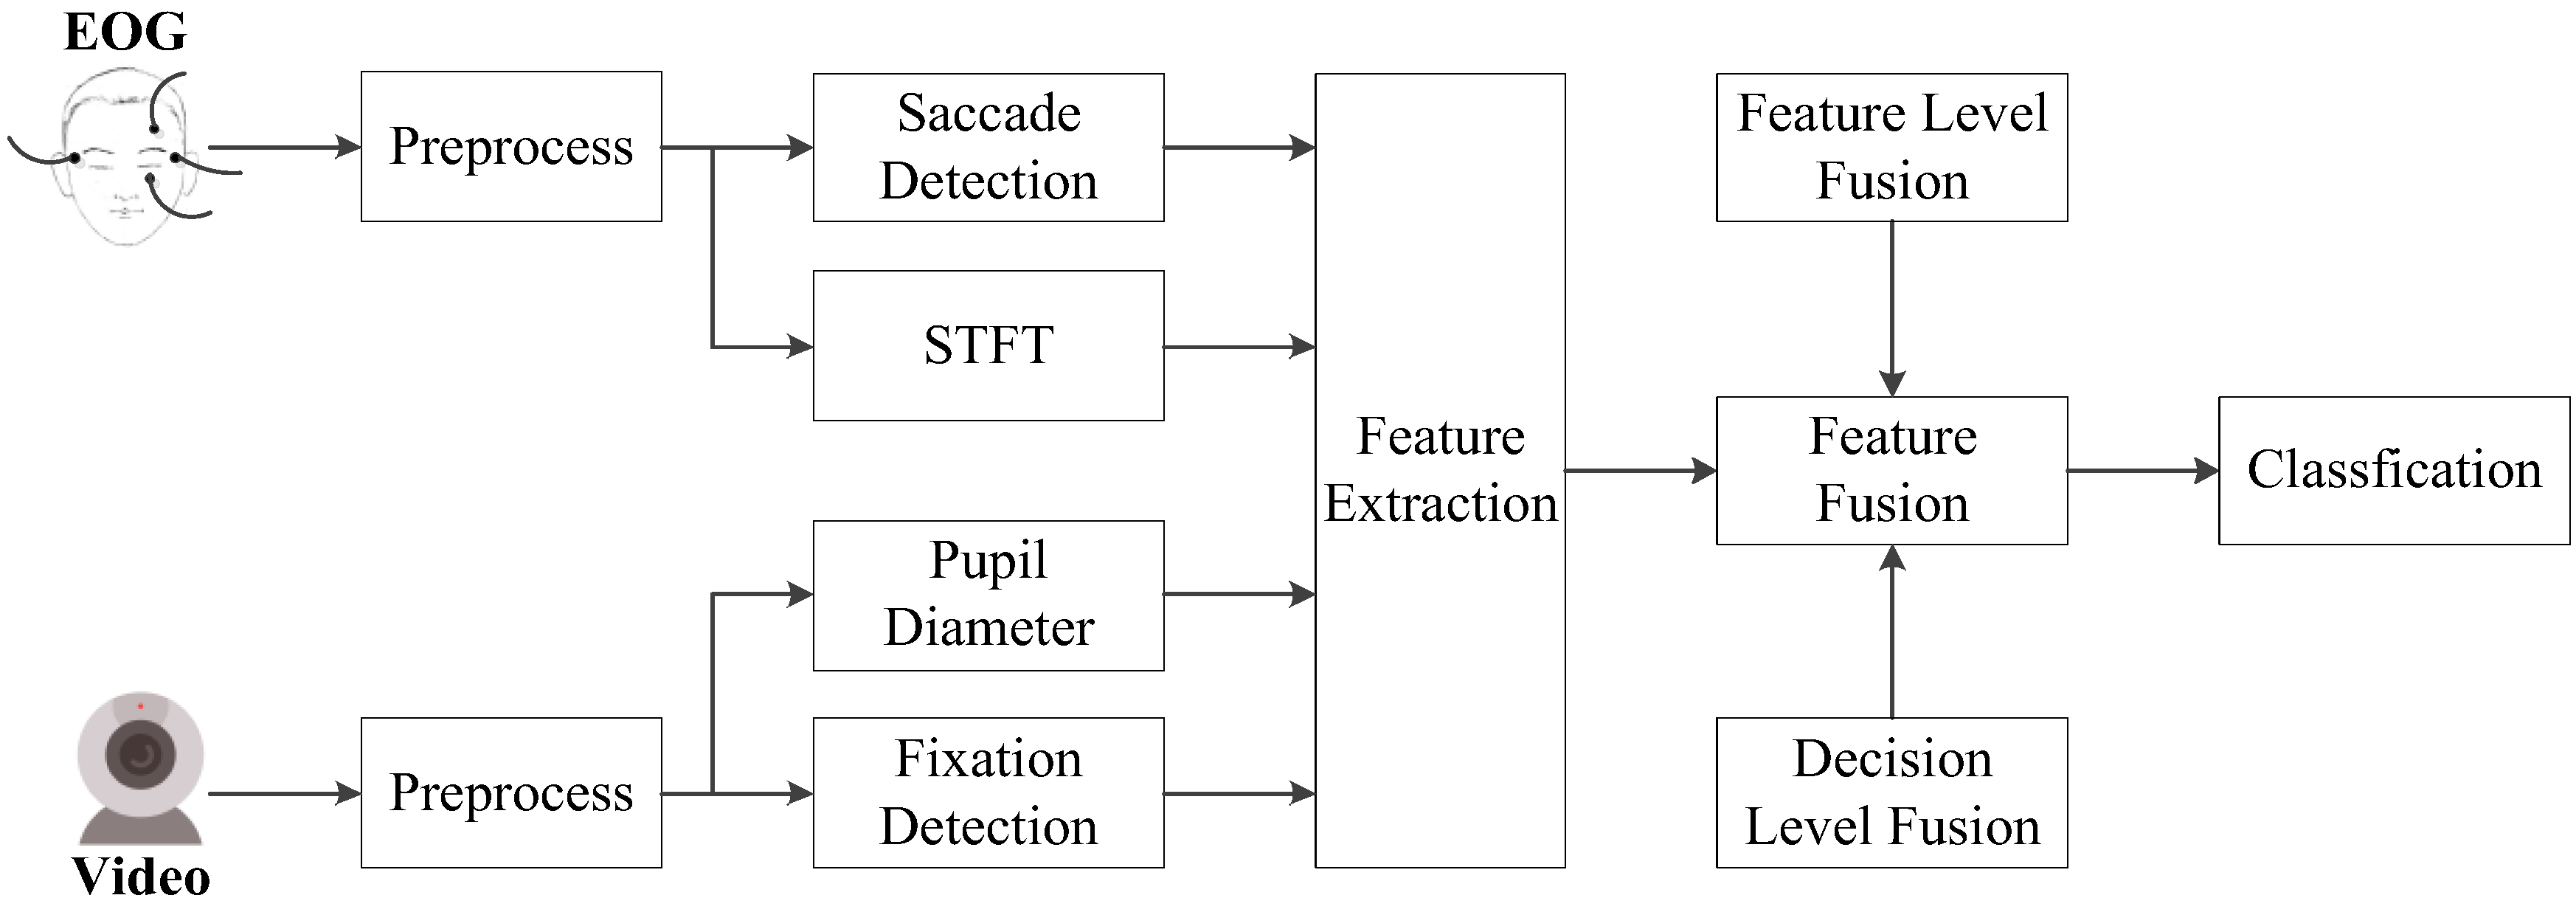
3. Methods
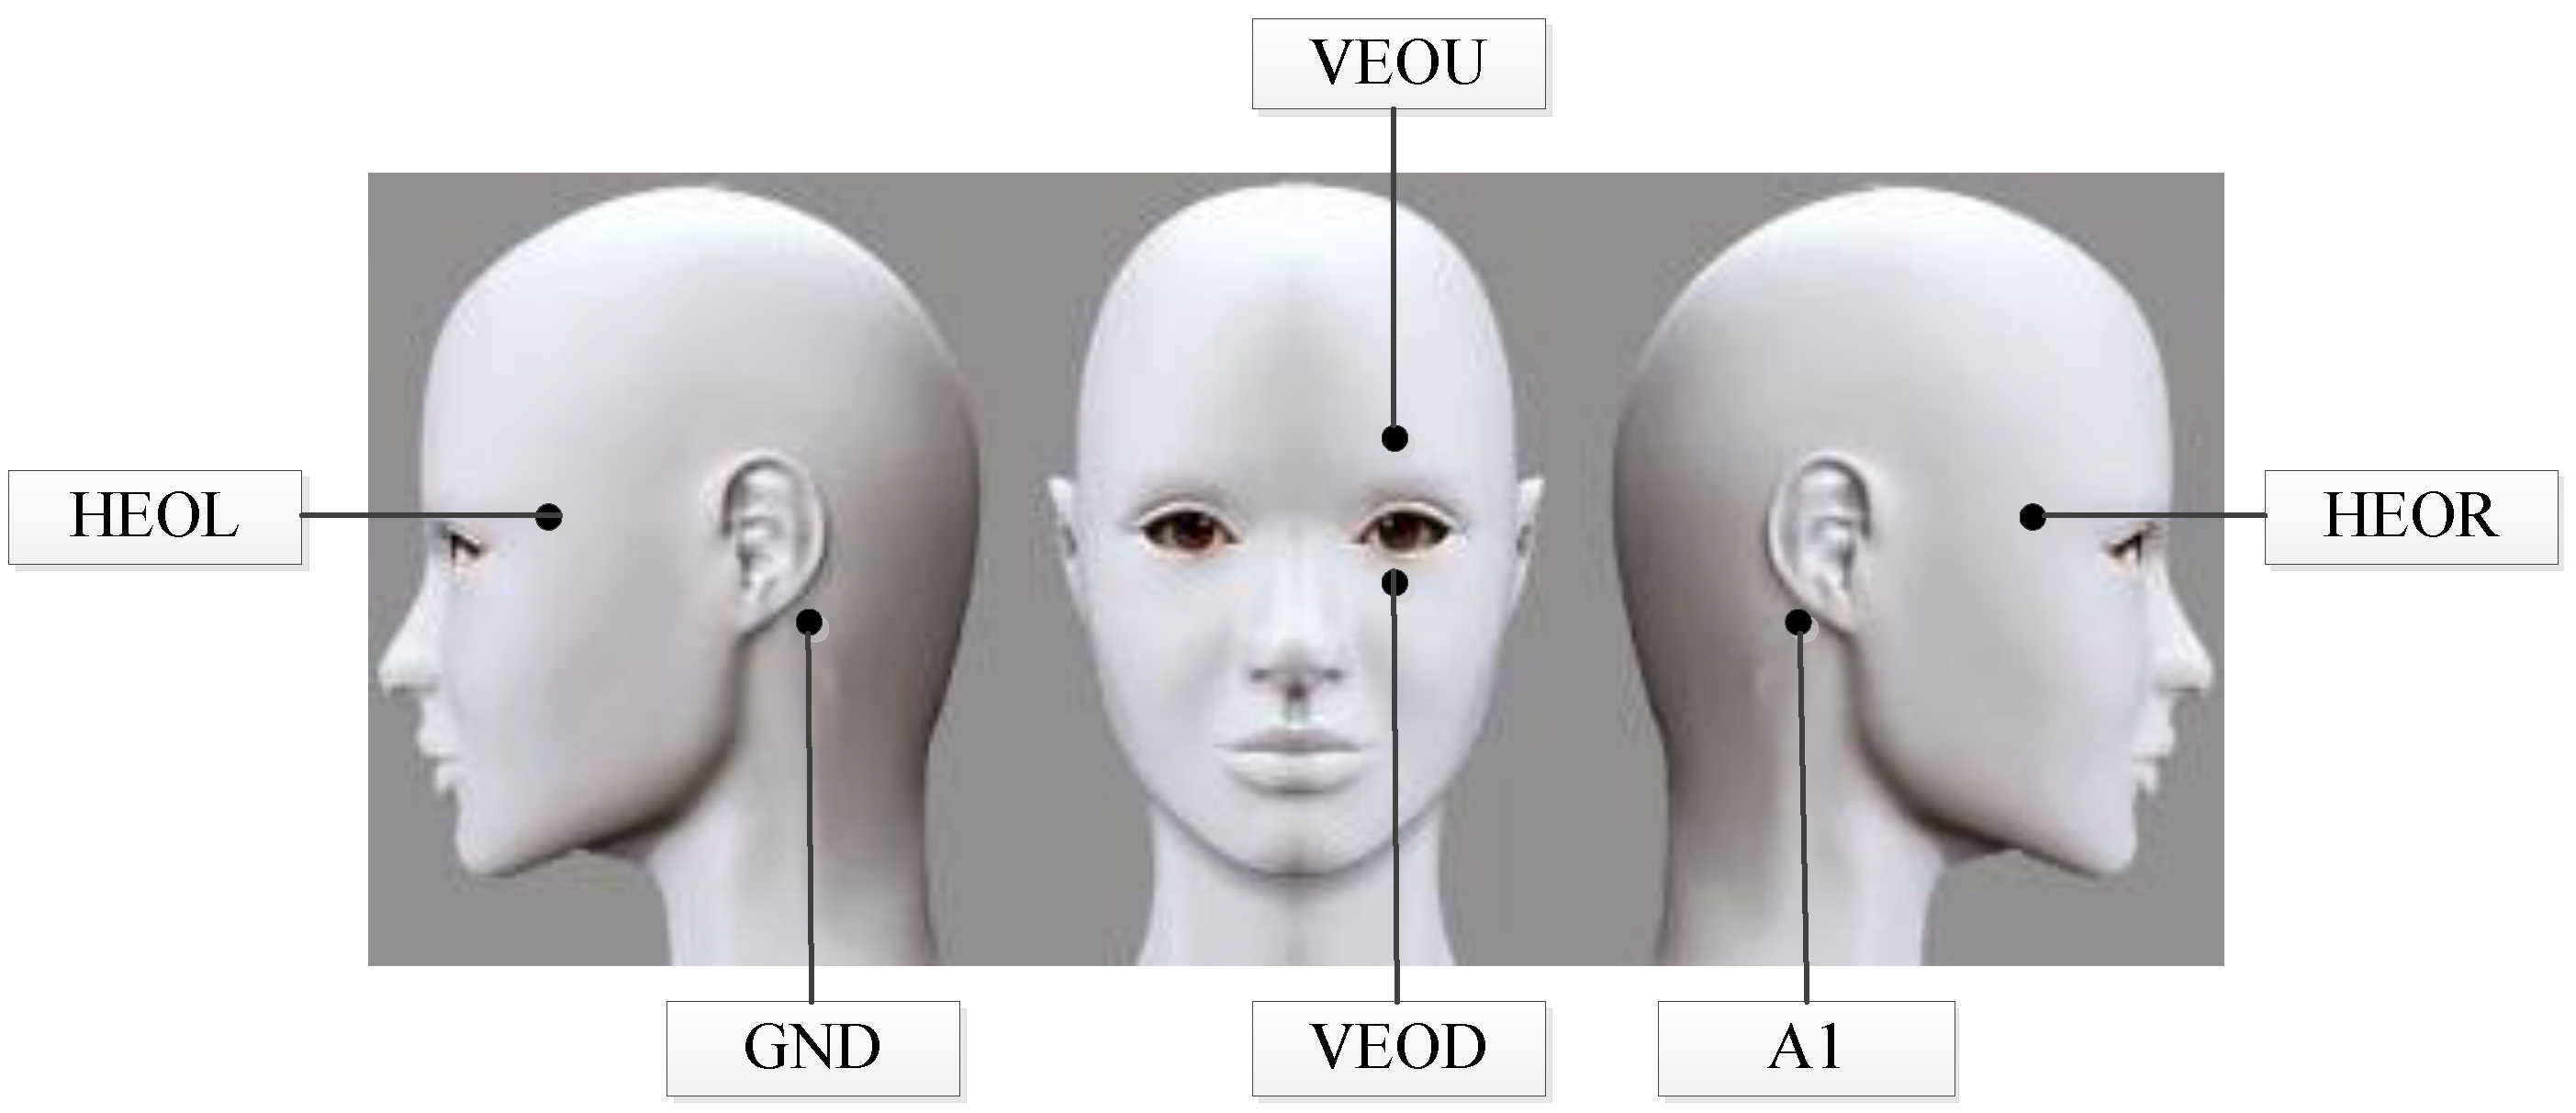
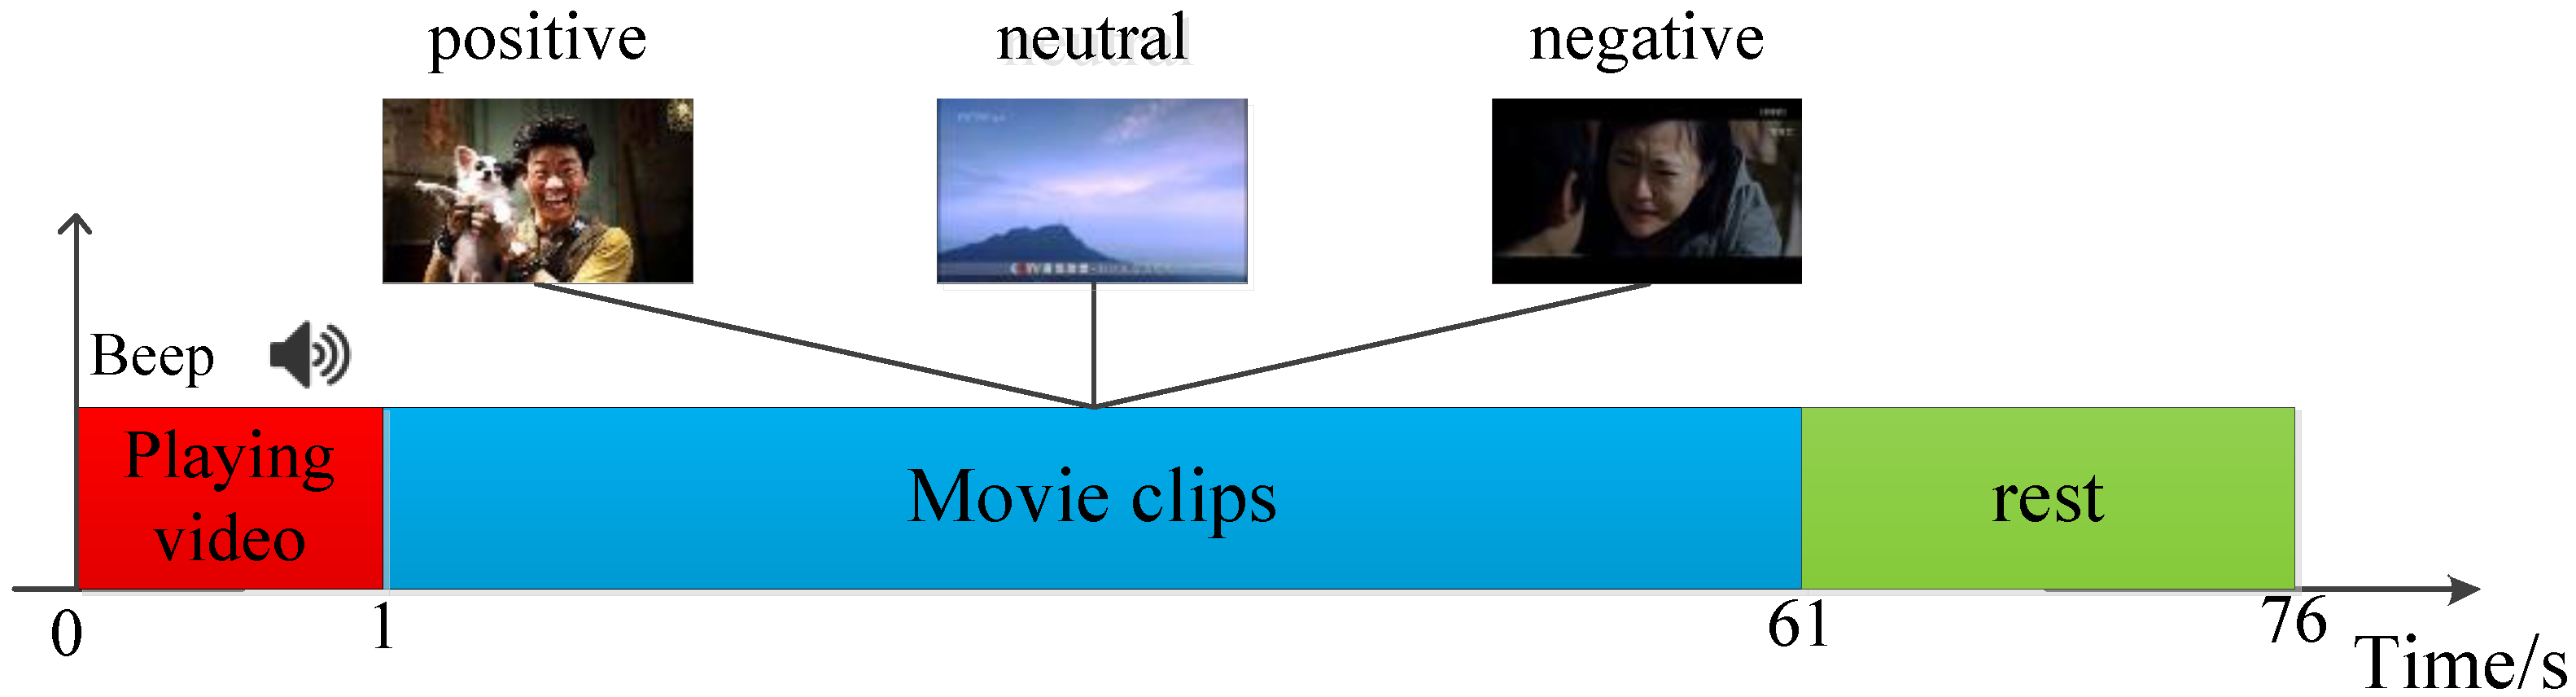
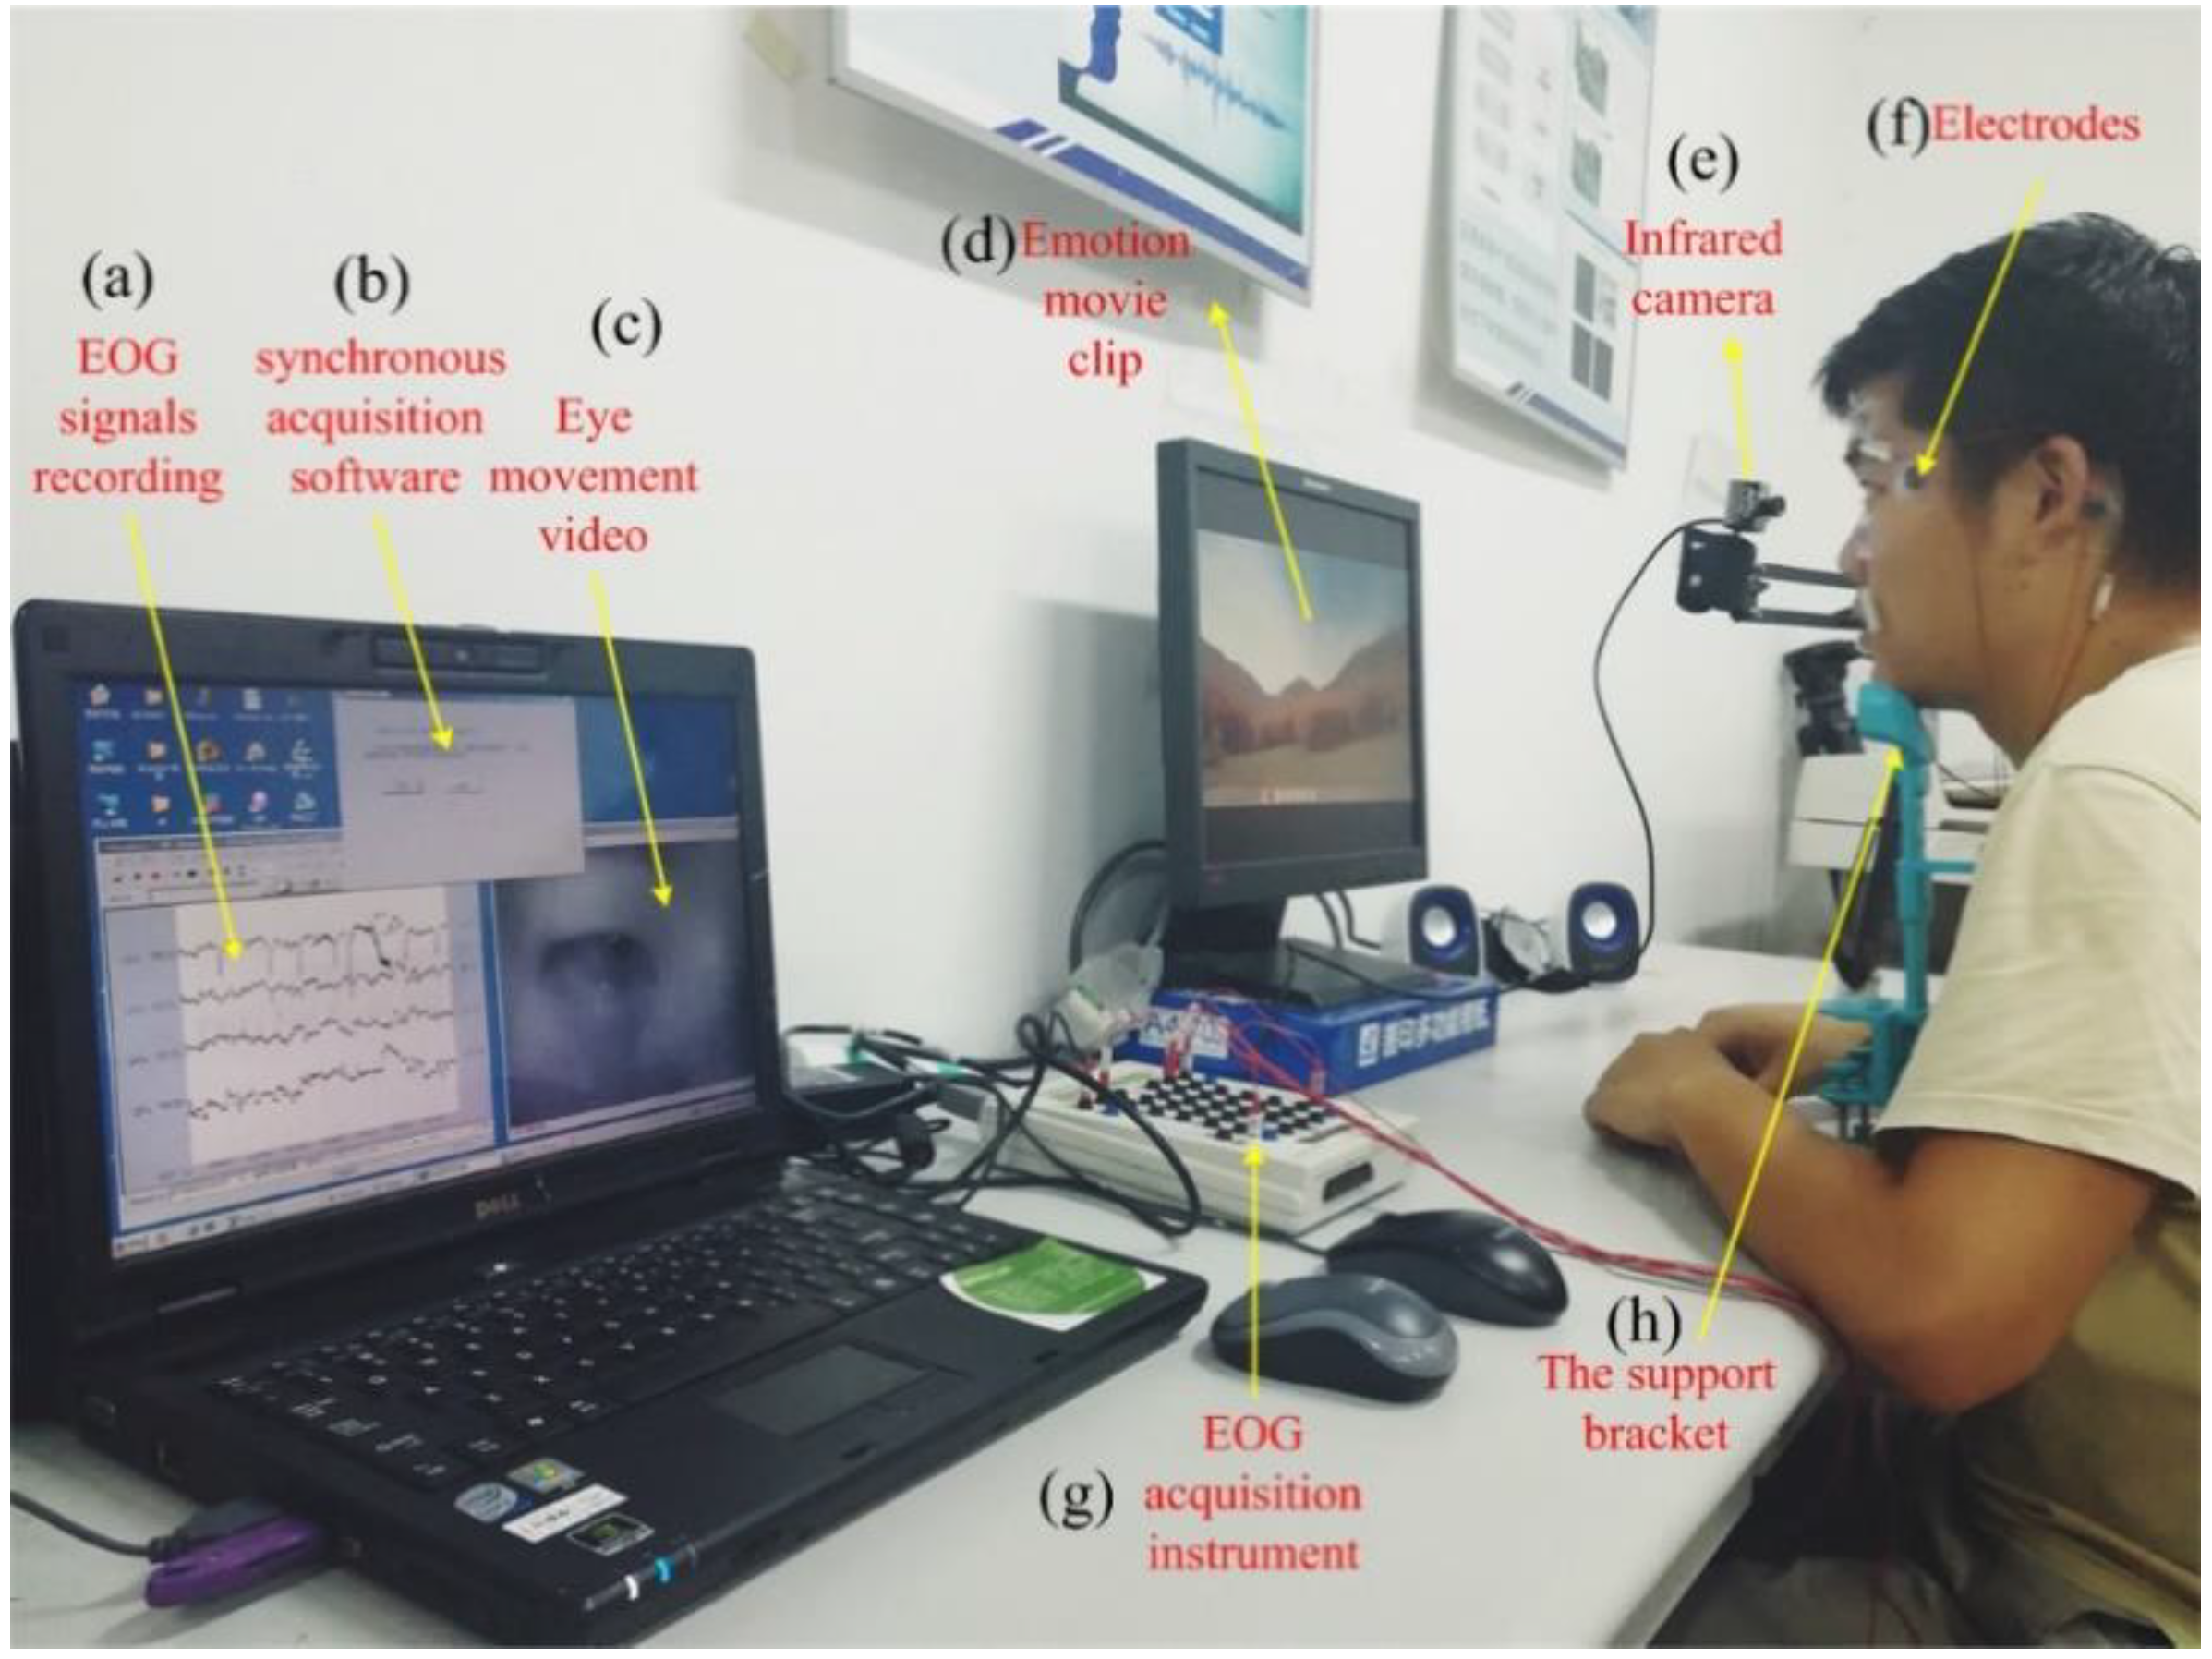
3.1. Data Acquisition
3.2. Data Preprocessing
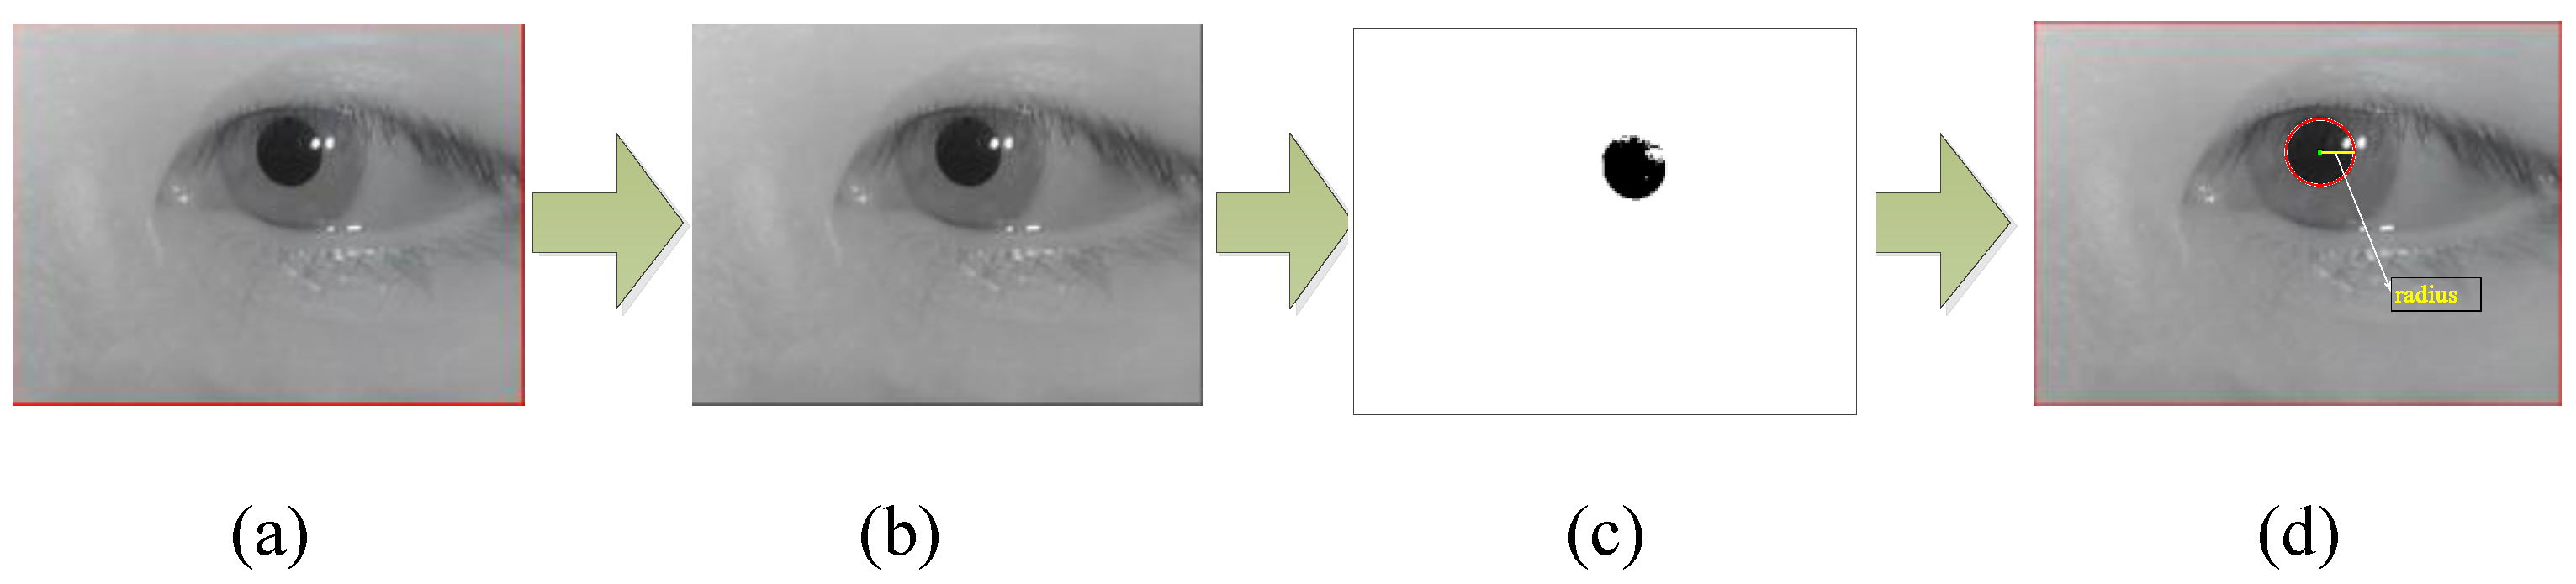
3.3. Features Extraction
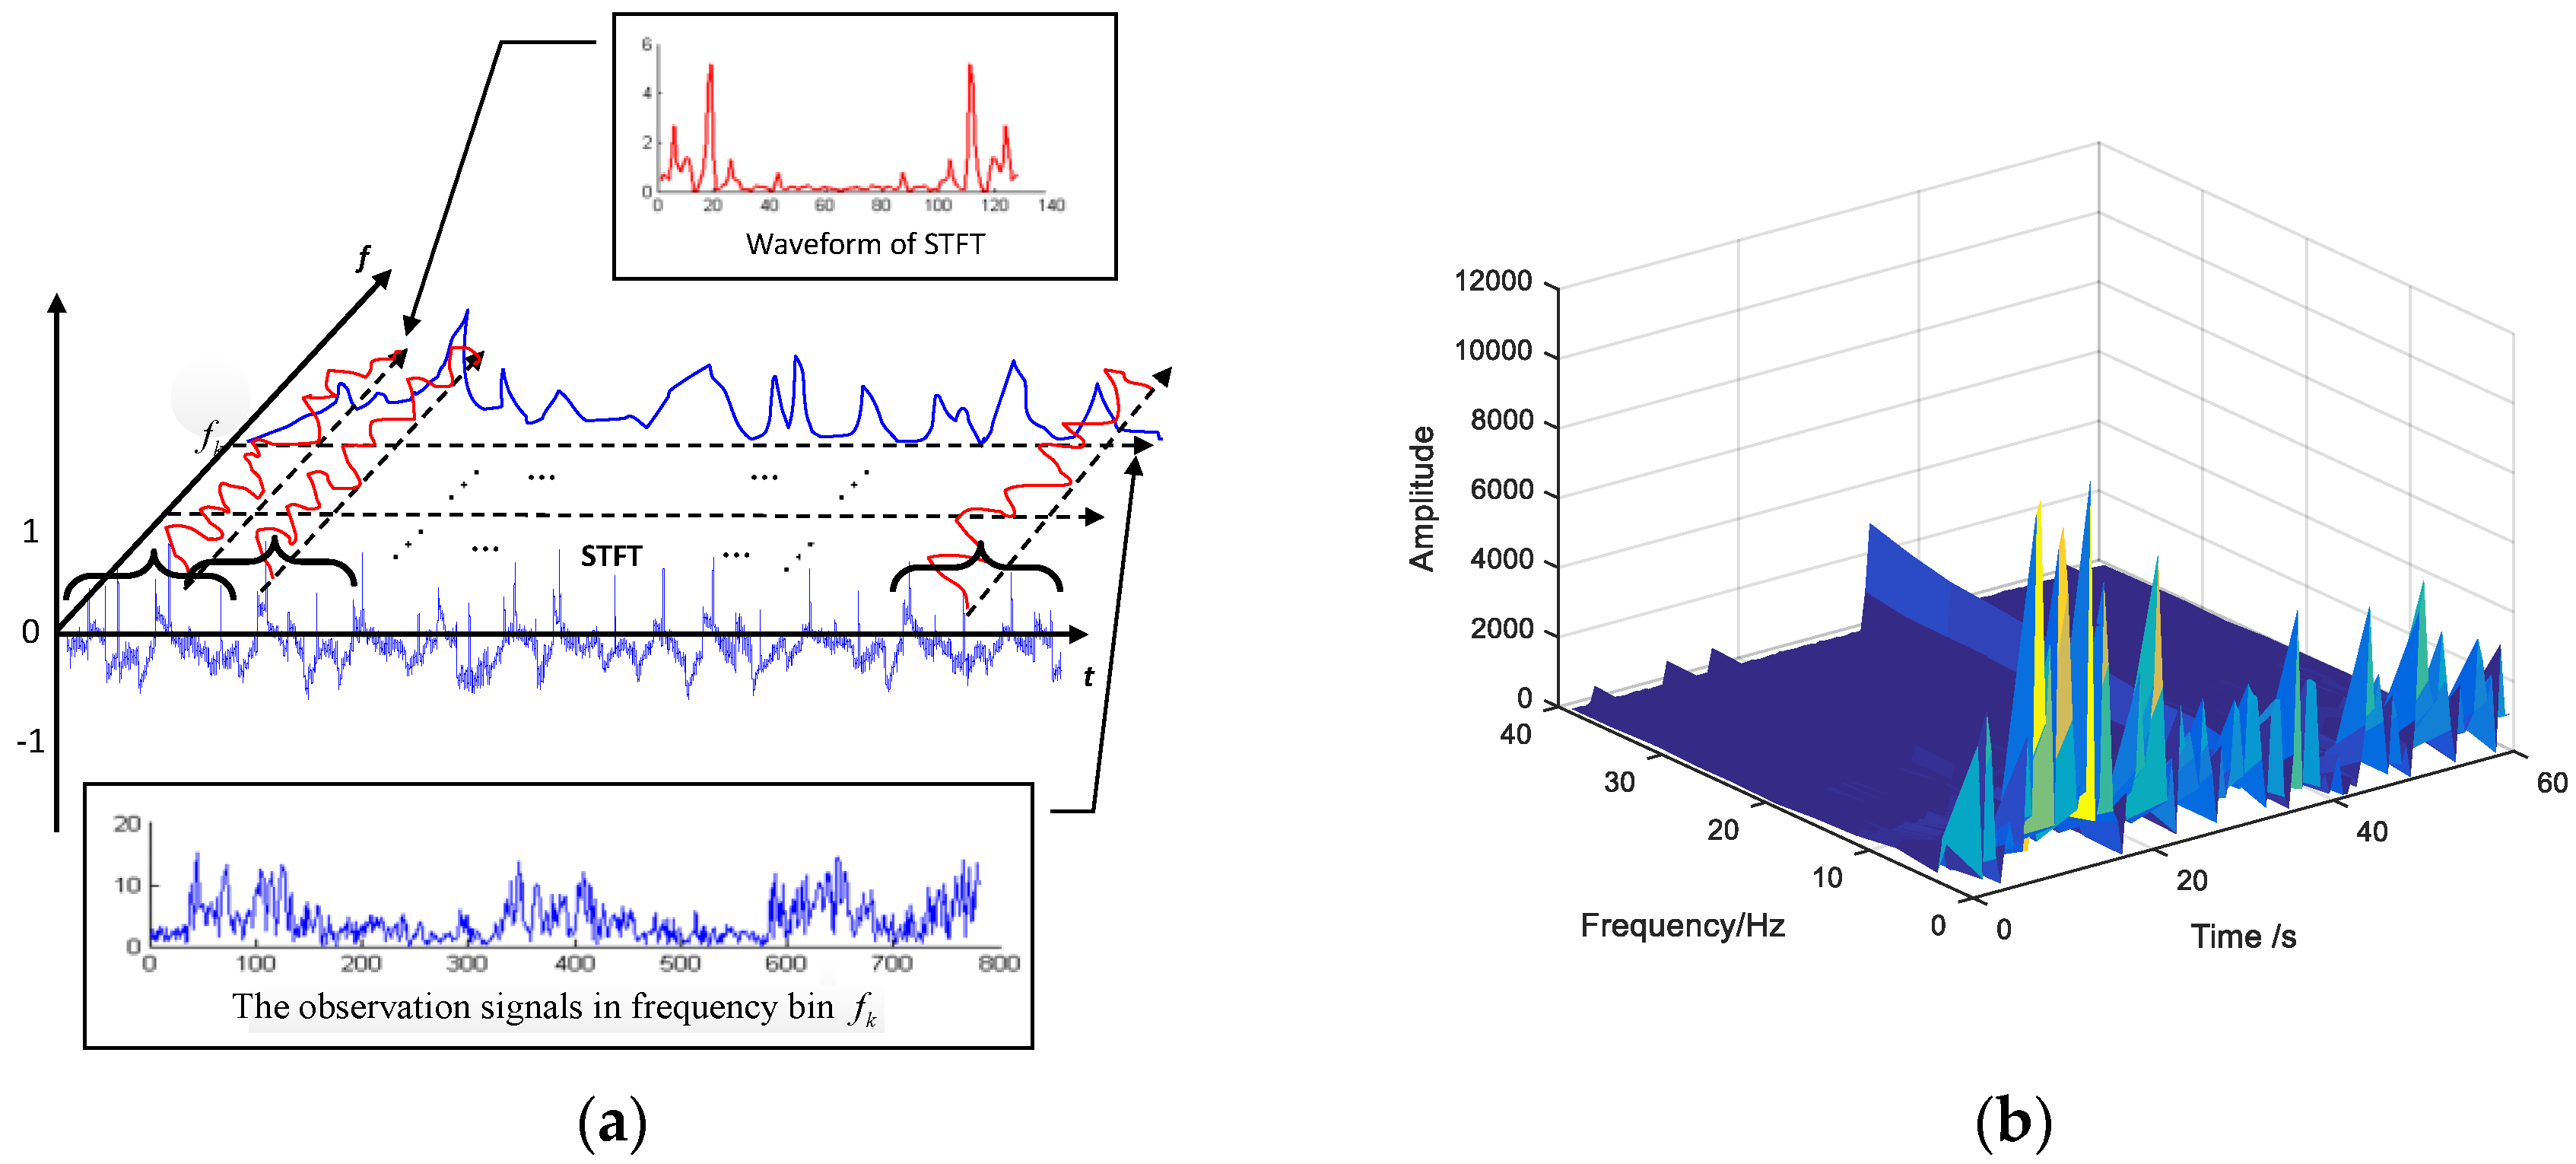
3.3.1. Time-Frequency Domain Features Extraction
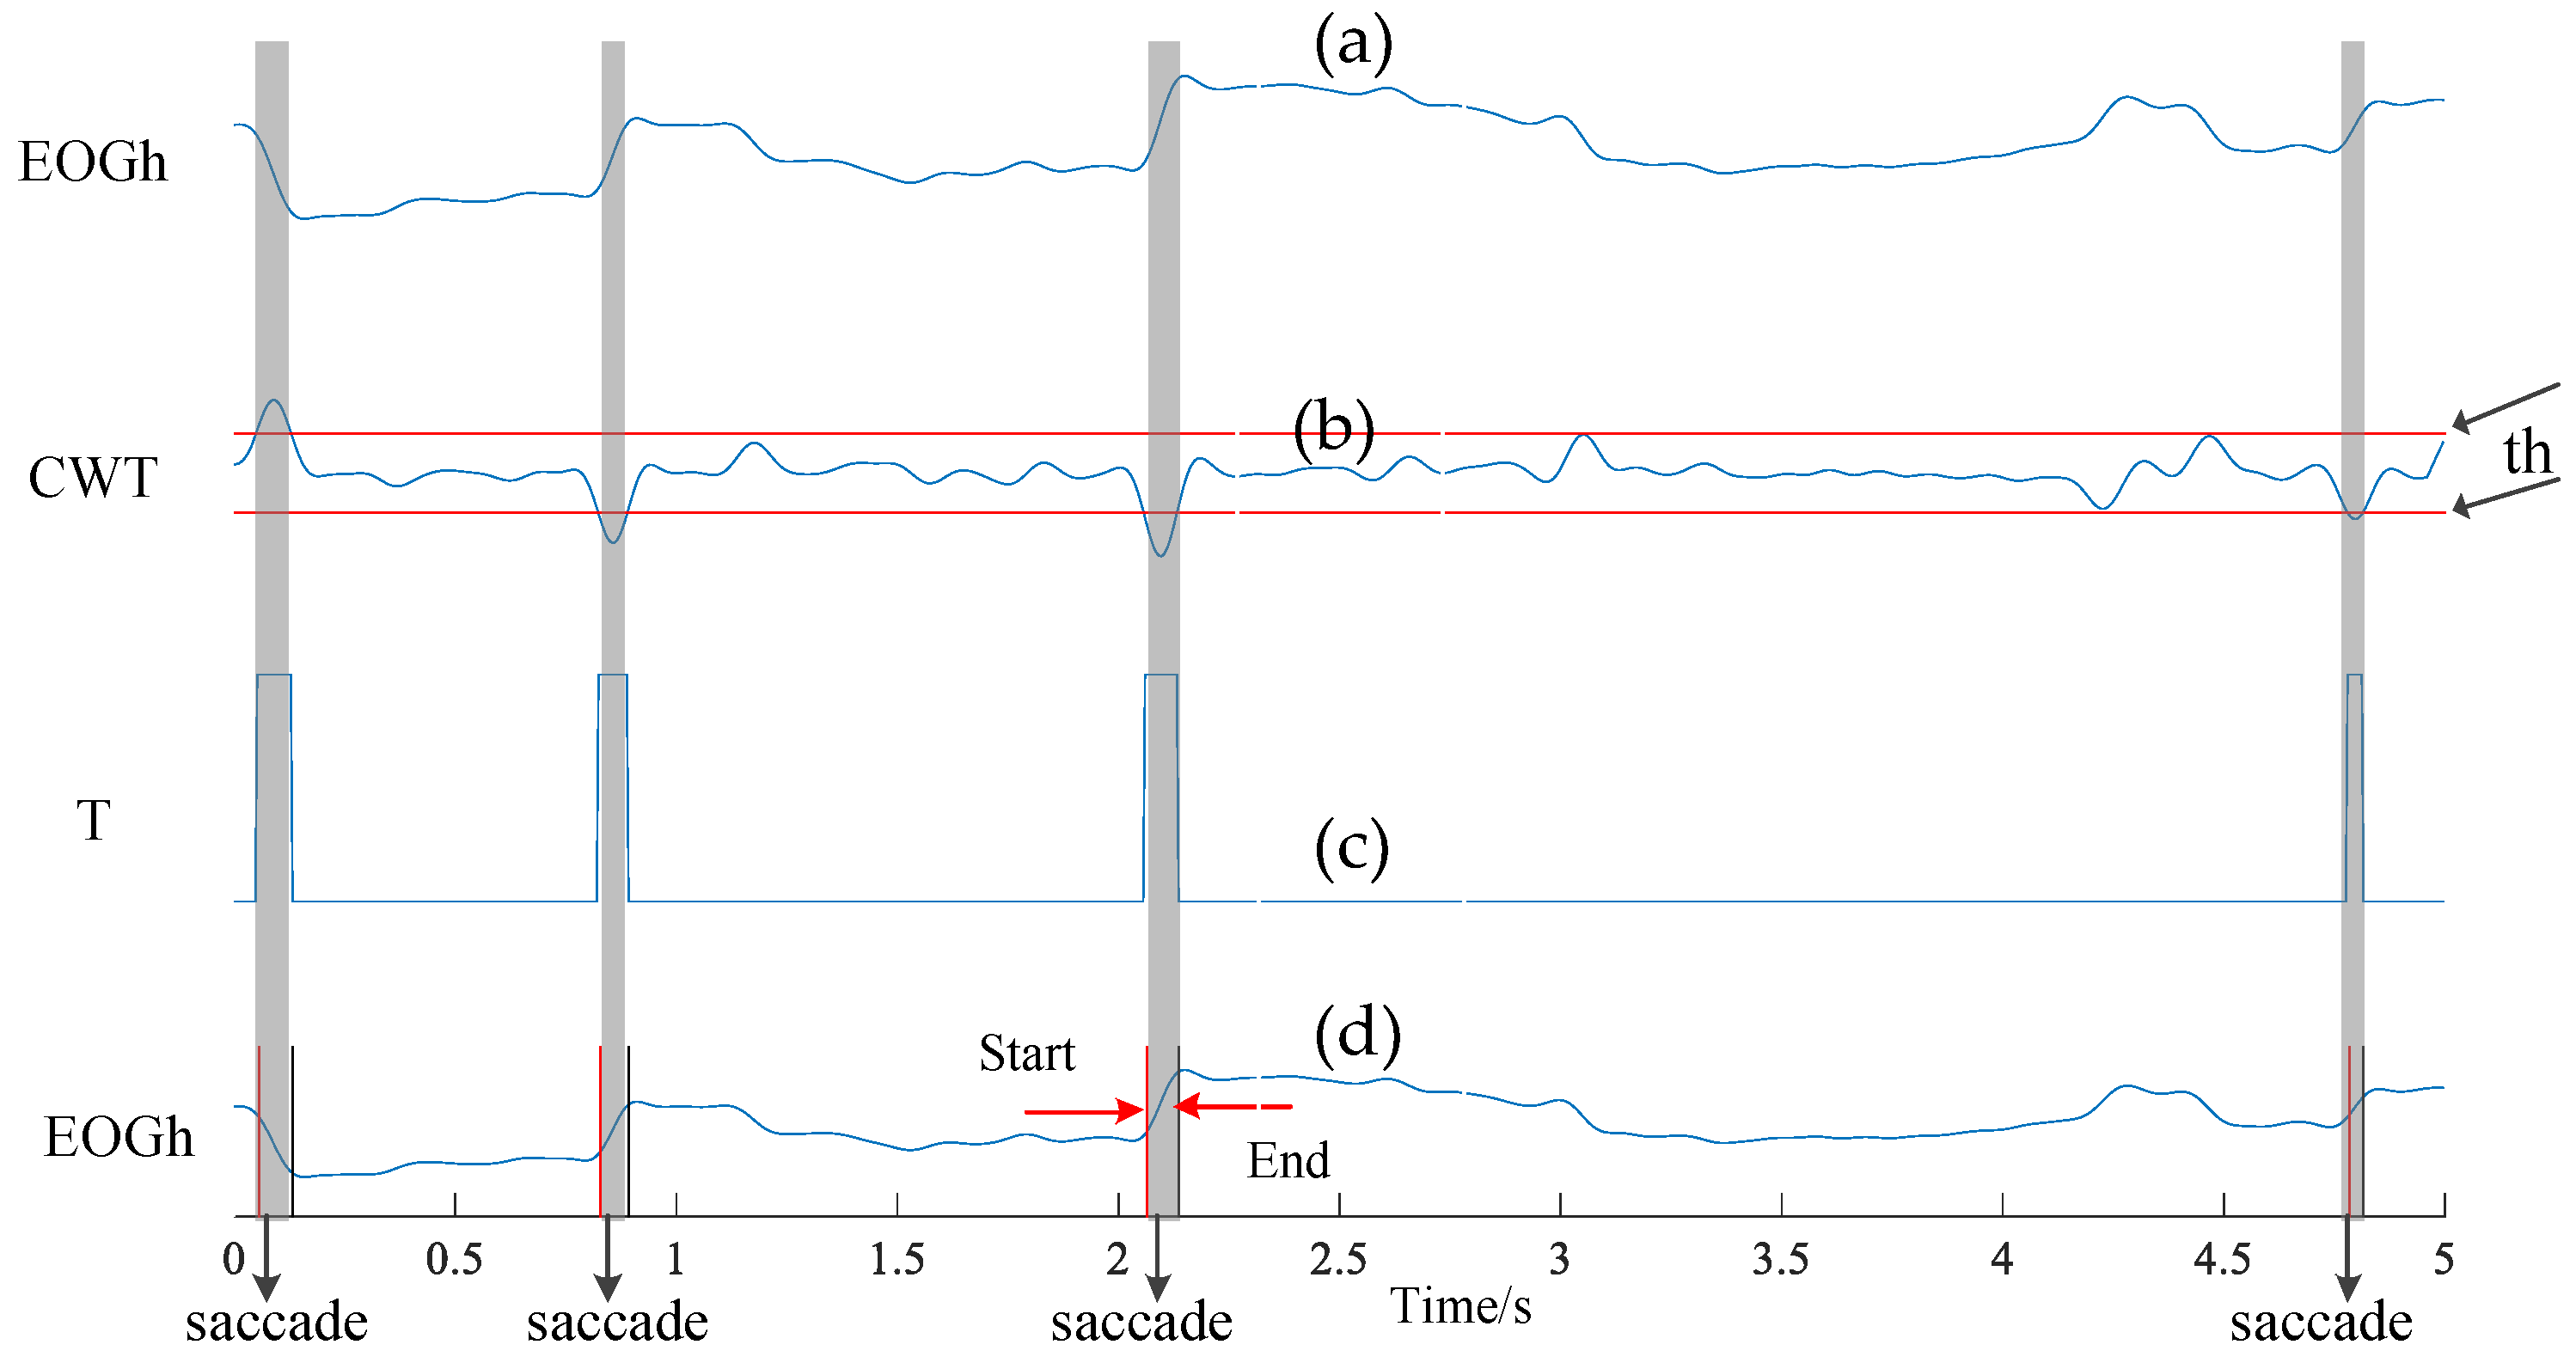
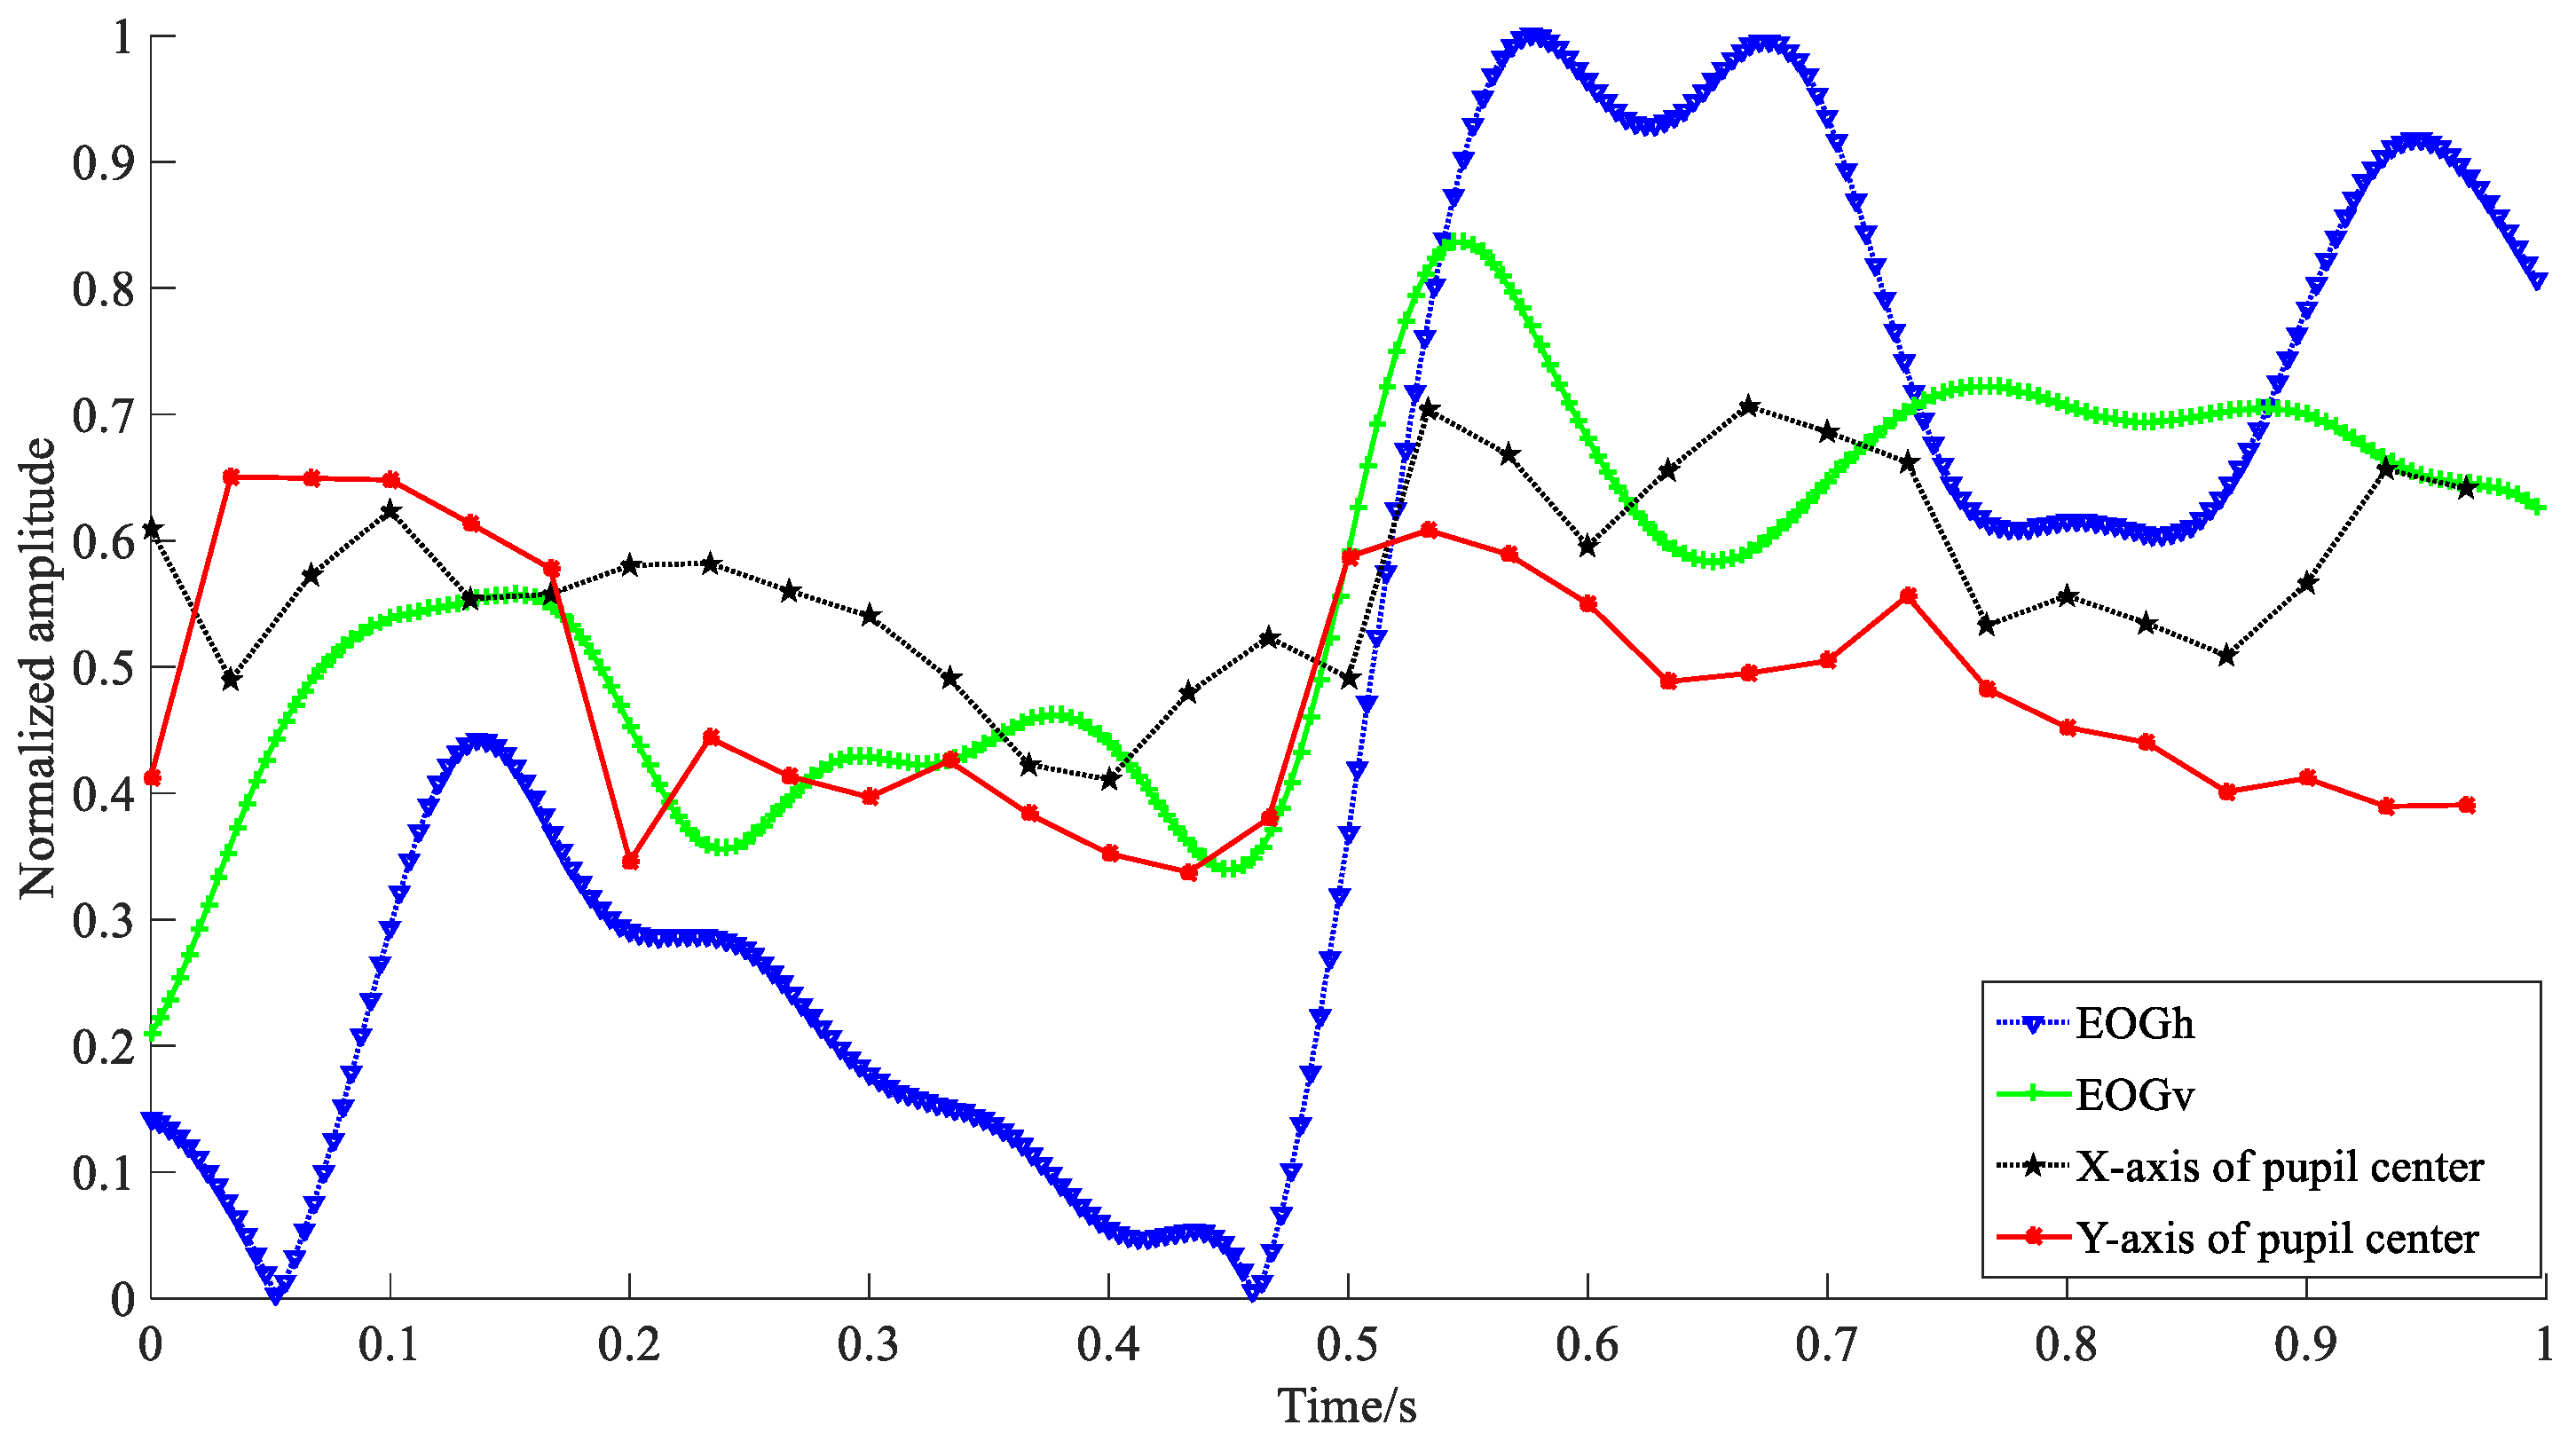
3.3.2. Time Domain Features Extraction
3.4. Features Fusion for Emotion Recognition
4. Experiments and Results Analysis
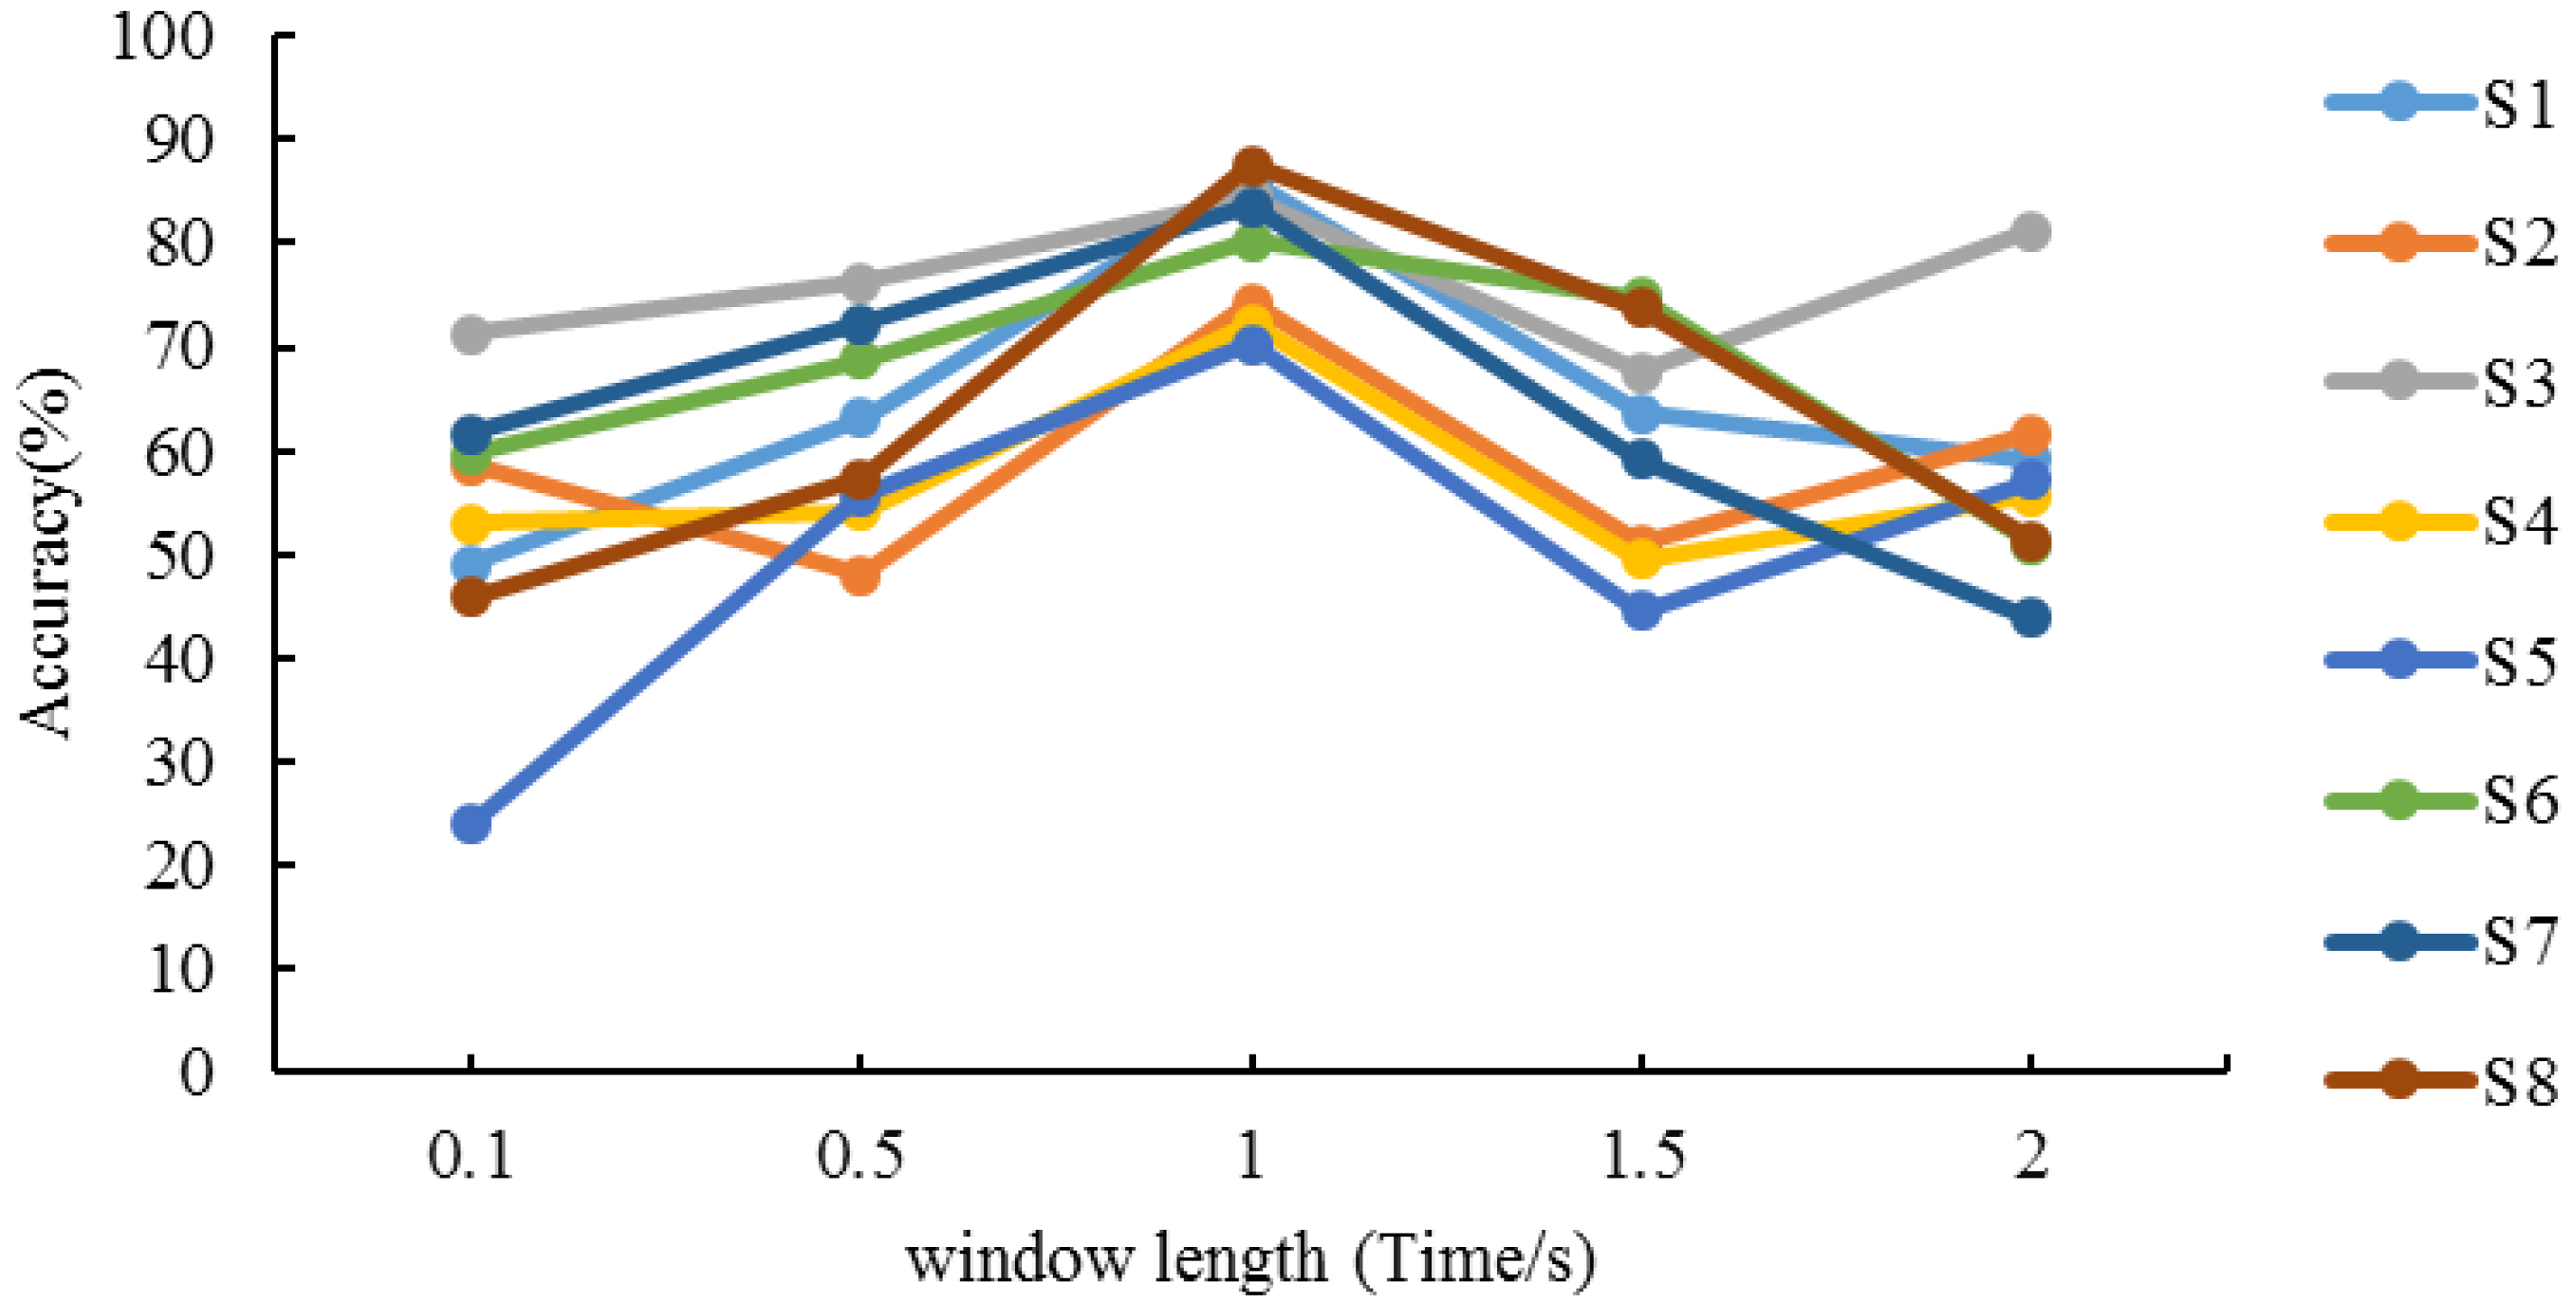
4.1. Determination of Sliding Window Length
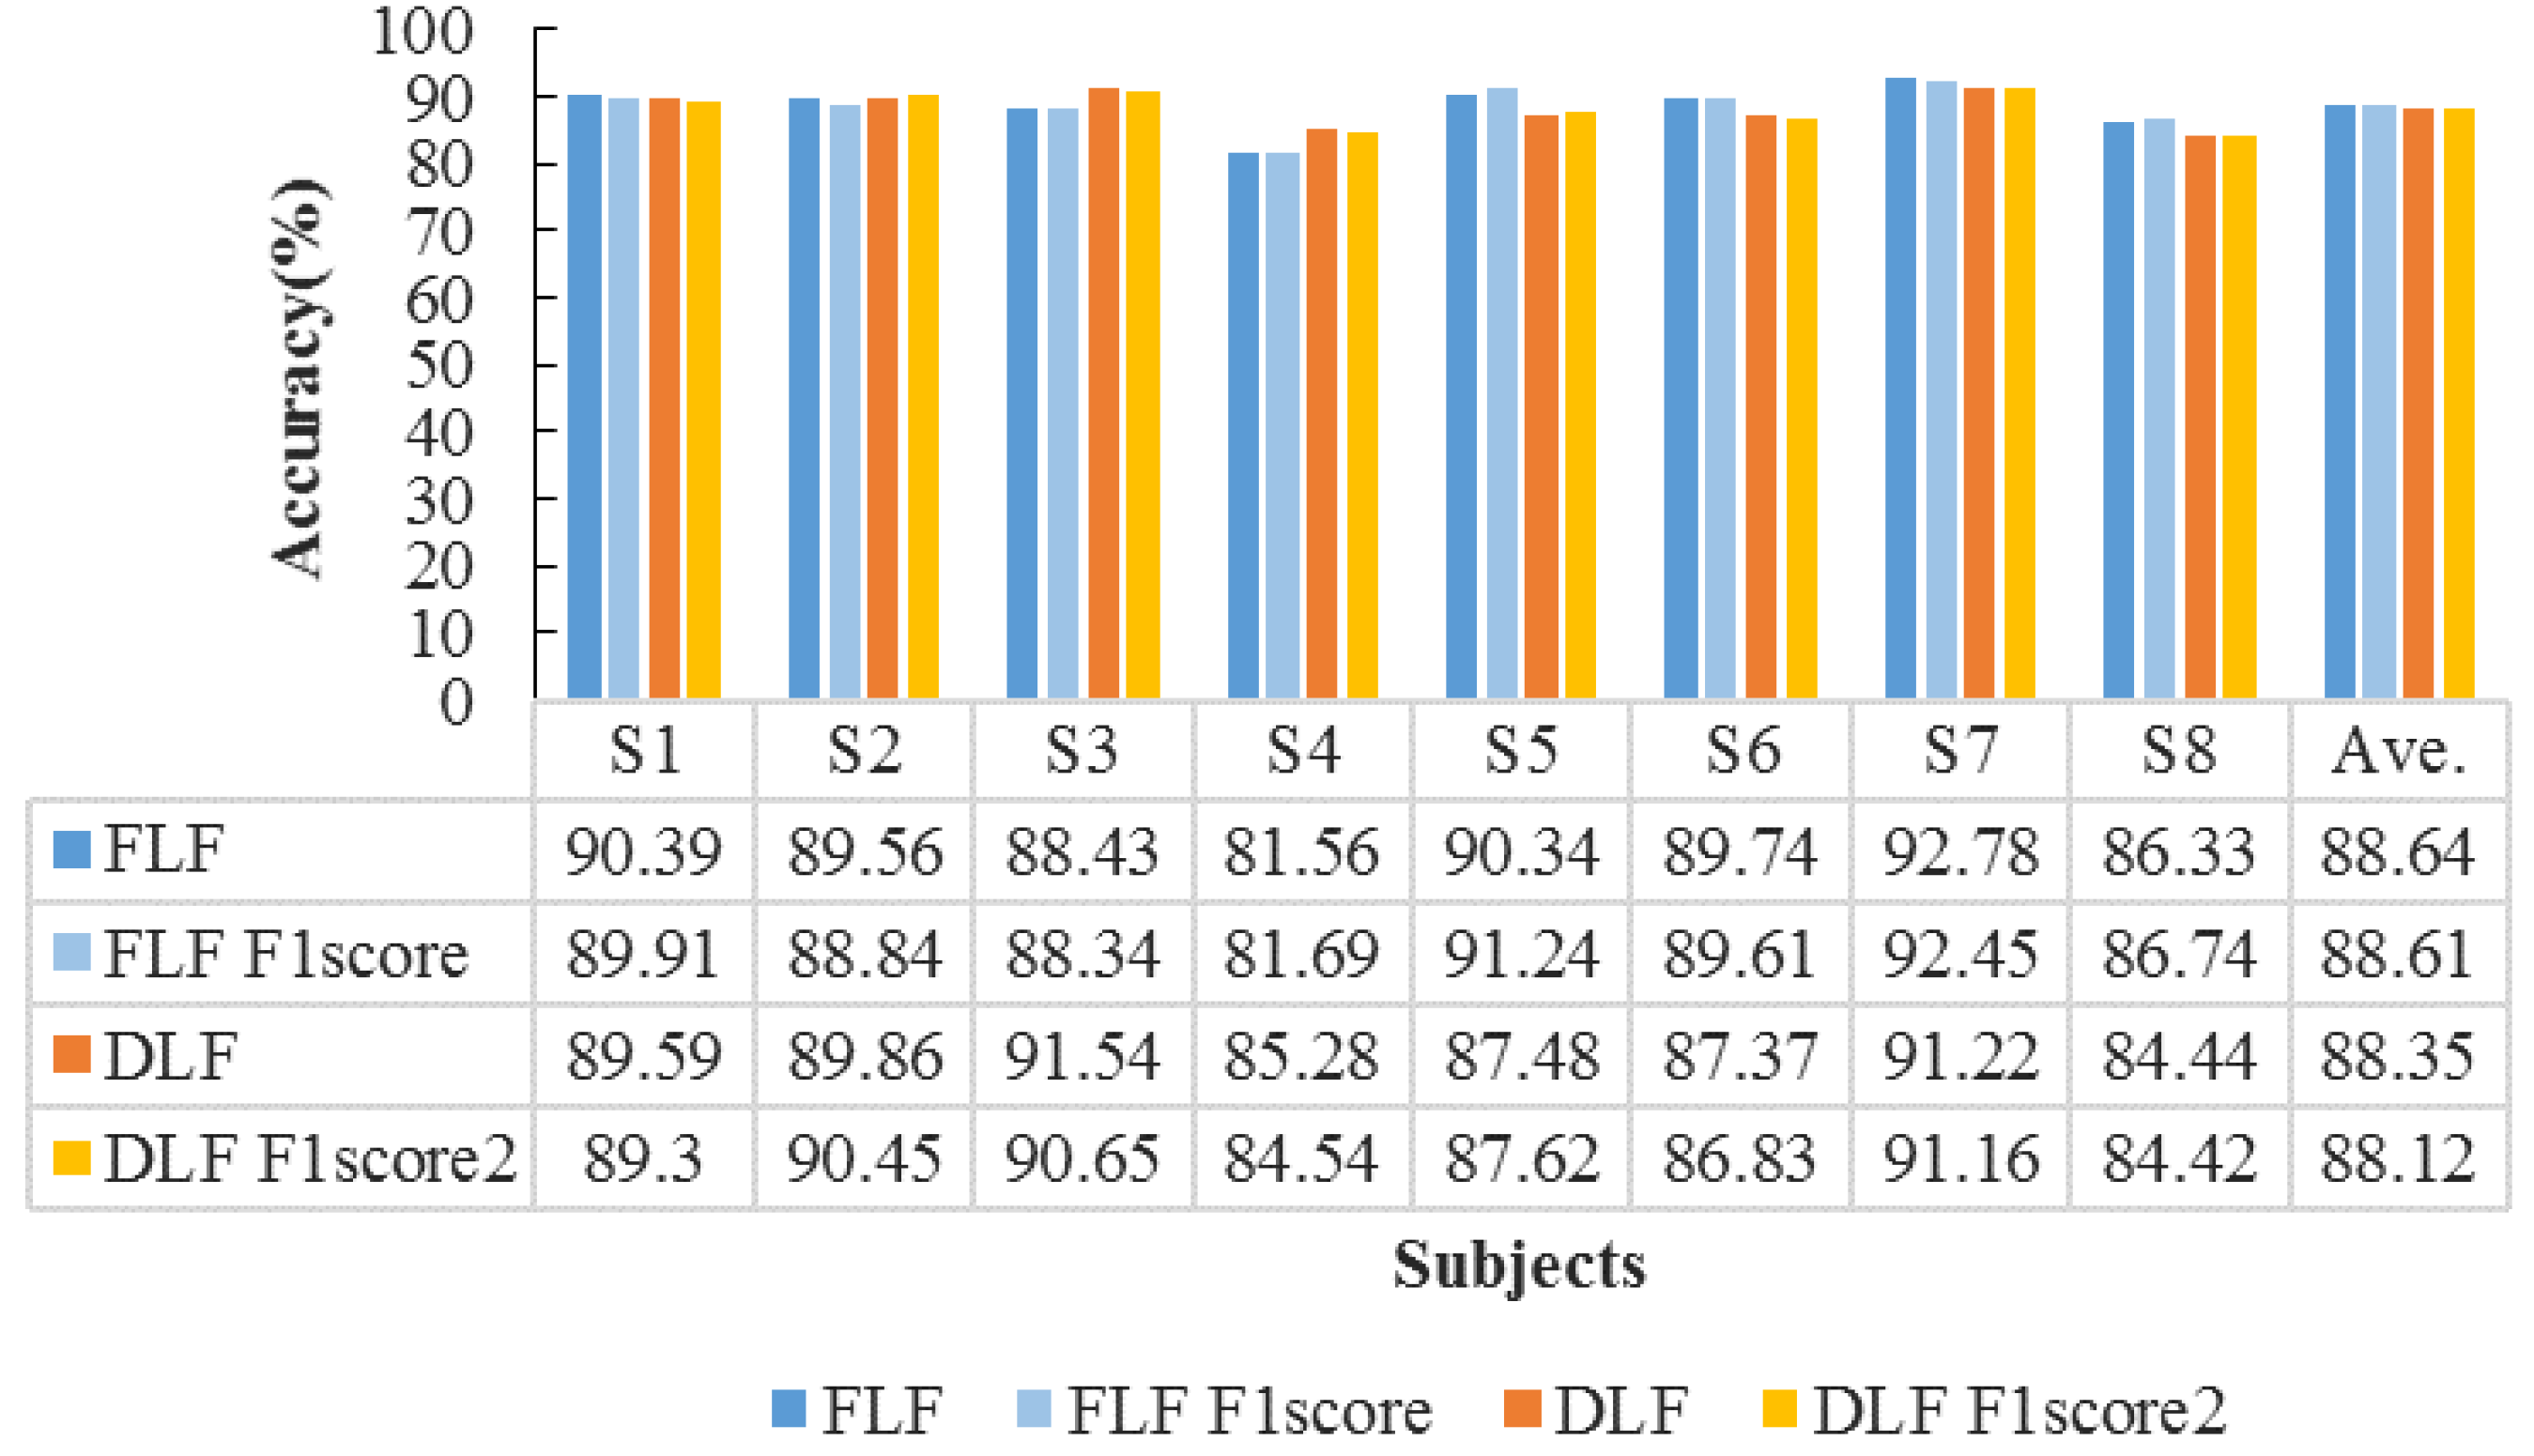
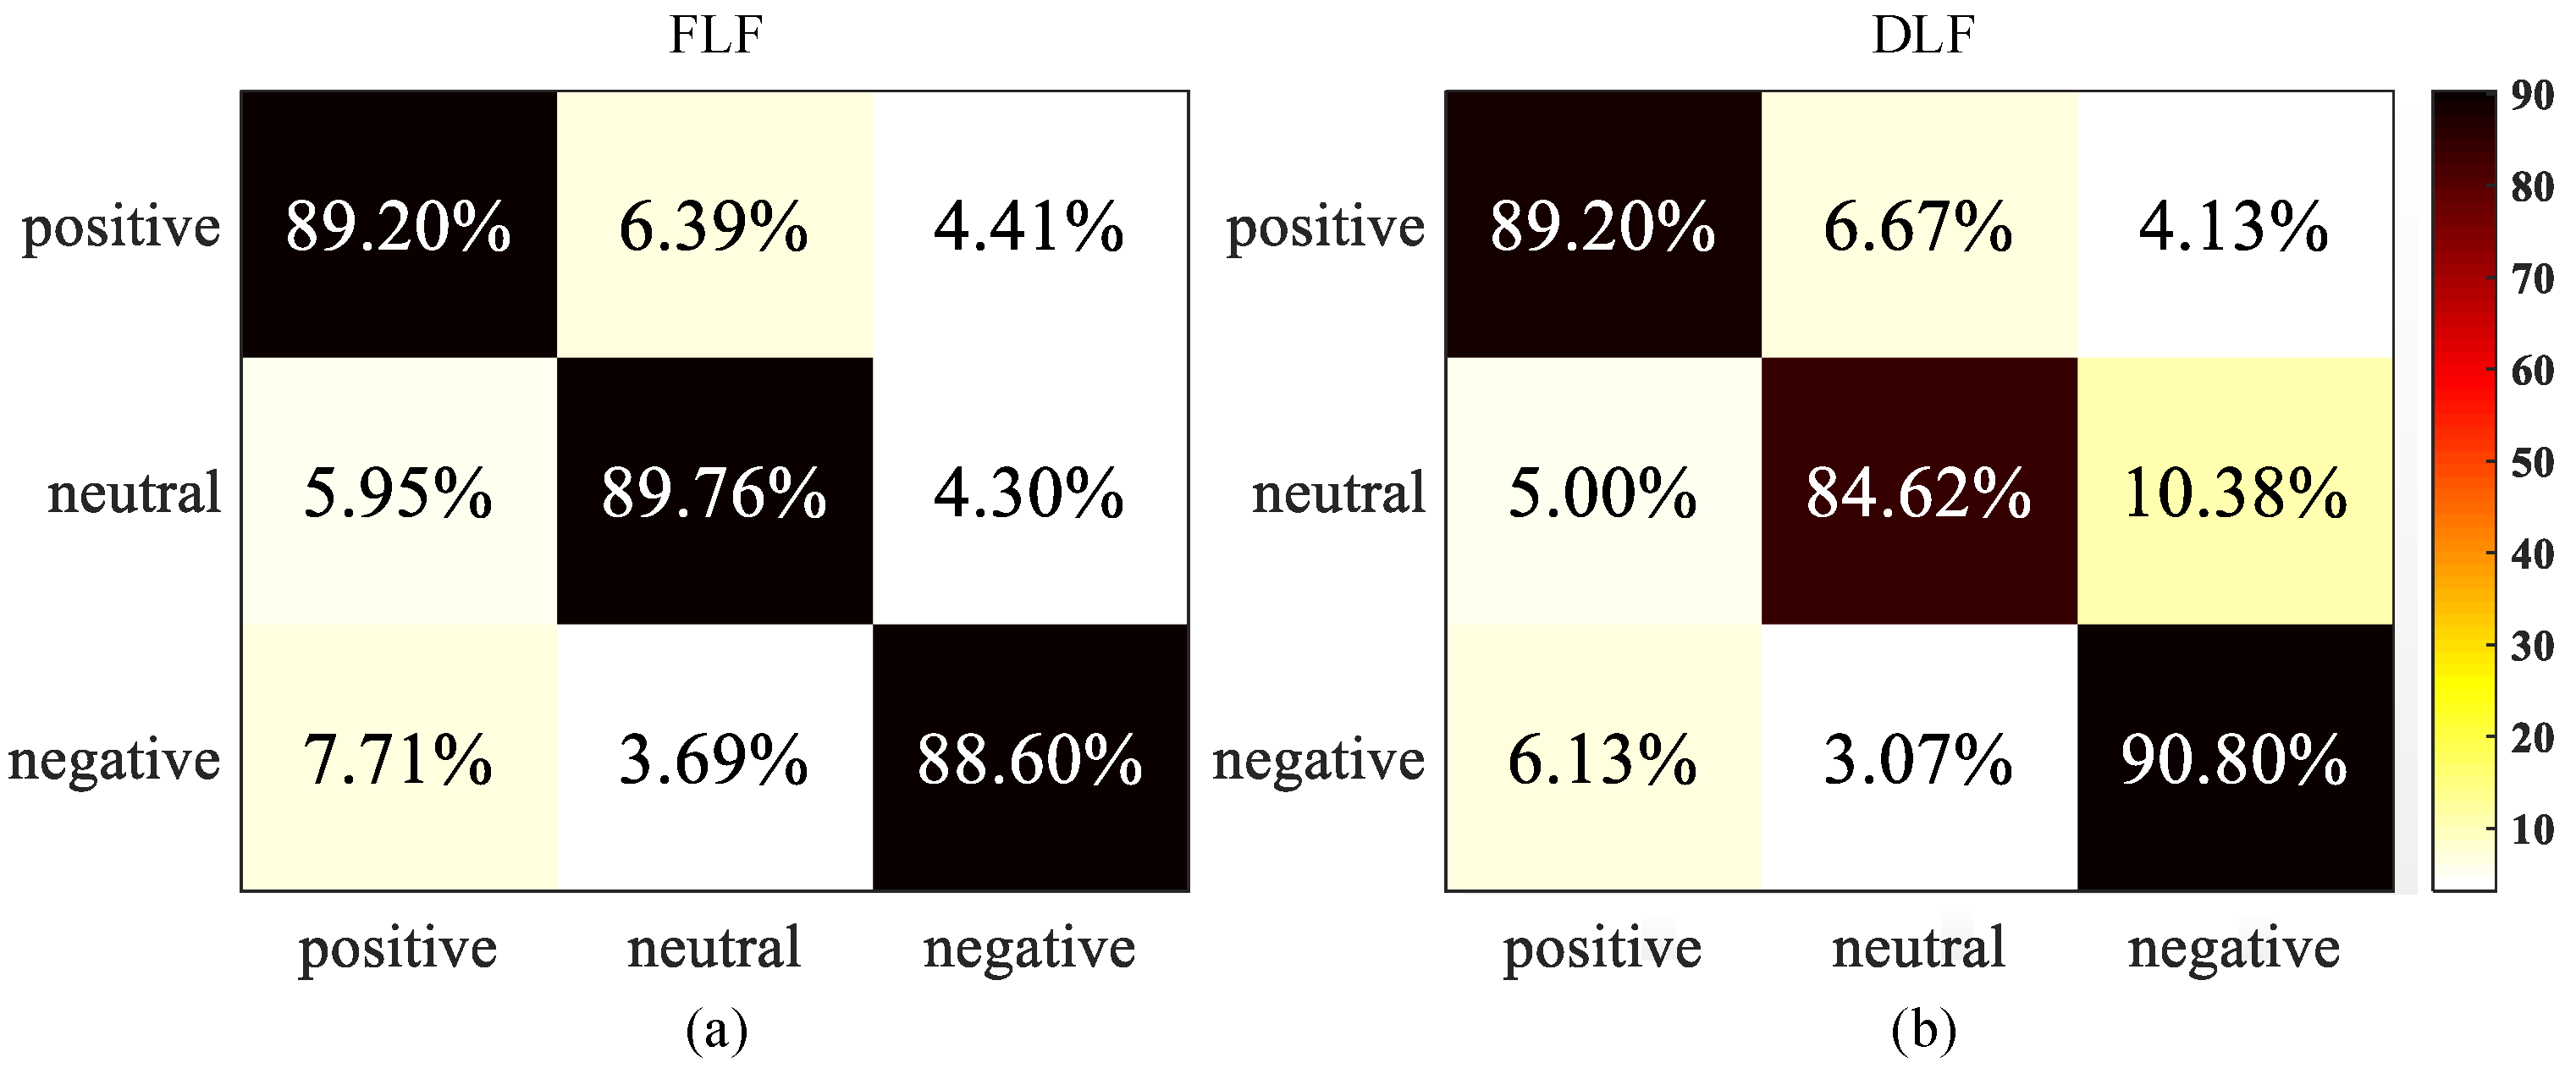
4.2. Performance Evaluation of Emotion Recognition
5. Conclusions
Author Contributions
Funding
Acknowledgments
Conflicts of Interest
References
- Wong, B.; Ho, G.T.; Tsui, E. Development of an intelligent e-healthcare system for the domestic care industry. Ind. Manag. Data Syst. 2017, 117, 1426–1445. [Google Scholar] [CrossRef]
- Sodhro, A.H.; Sangaiah, A.K.; Sodhro, G.H.; Lohano, S.; Pirbhulal, S. An Energy-Efficient Algorithm for Wearable Electrocardiogram Signal Processing in Ubiquitous Healthcare Applications. Sensors 2018, 18, 923. [Google Scholar] [CrossRef] [PubMed]
- Begum, S.; Barua, S.; Ahmed, M.U. Physiological sensor signals classification for healthcare using sensor data fusion and case-based reasoning. Sensors 2014, 14, 11770–11785. [Google Scholar] [CrossRef] [PubMed]
- Kart, F.; Miao, G.; Moser, L.E.; Melliar-Smith, P.M. A distributed e-healthcare system based on the service oriented architecture. In Proceedings of the 2007 IEEE International Conference on Services Computing, Salt Lake City, UT, USA, 9–13 July 2007; pp. 652–659. [Google Scholar]
- Alhussein, M. Automatic facial emotion recognition using weber local descriptor for e-Healthcare system. Cluster Comput. 2016, 19, 99–108. [Google Scholar] [CrossRef]
- Banos, O.; Villalonga, C.; Bang, J.; Hur, T.; Kang, D.; Park, S.; Hong, C.S. Human behavior analysis by means of multimodal context mining. Sensors 2016, 16, 1264. [Google Scholar] [CrossRef] [PubMed]
- Muhammad, G.; Alsulaiman, M.; Amin, S.U.; Ghoneim, A.; Alhamid, M.F. A facial-expression monitoring system for improved healthcare in smart cities. IEEE Access 2017, 5, 10871–10881. [Google Scholar] [CrossRef]
- Liu, Y.H.; Wu, C.T.; Cheng, W.T.; Hsiao, Y.T.; Chen, P.M.; Teng, J.T. Emotion recognition from single-trial EEG based on kernel Fisher’s emotion pattern and imbalanced quasiconformal kernel support vector machine. Sensors 2014, 18, 13361–13388. [Google Scholar] [CrossRef] [PubMed]
- Alonso-Martín, F.; Malfaz, M.; Sequeira, J.; Gorostiza, J.F.; Salichs, M.A. A multimodal emotion detection system during human–robot interaction. Sensors 2013, 13, 15549–15581. [Google Scholar] [CrossRef] [PubMed]
- Peng, Y.; Lu, B.L. Discriminative extreme learning machine with supervised sparsity preserving for image classification. Neurocomputing 2017, 261, 242–252. [Google Scholar] [CrossRef]
- Wu, Y.; Yan, C.; Liu, L.; Ding, Z.; Jiang, C. An adaptive multilevel indexing method for disaster service discovery. IEEE Trans. Comput. 2015, 64, 2447–2459. [Google Scholar] [CrossRef]
- Zhang, Q.; Lee, M. Analysis of positive and negative emotions in natural scene using brain activity and GIST. Neurocomputing 2009, 72, 1302–1306. [Google Scholar] [CrossRef]
- Kwon, Y.H.; Shin, S.B.; Kim, S.D. Electroencephalography Based Fusion Two-Dimensional(2D)-Convolution Neural Networks (CNN) Model for Emotion Recognition System. Sensors 2018, 18, 1383. [Google Scholar] [CrossRef] [PubMed]
- Lin, Y.P.; Wang, C.H.; Jung, T.P.; Wu, T.L.; Jeng, S.K.; Duann, J.R.; Chen, J.H. EEG-based emotion recognition in music listening. IEEE Trans. Biomed. Eng. 2010, 57, 1798–1806. [Google Scholar] [PubMed]
- Santella, A.; DeCarlo, D. Robust clustering of eye movement recordings for quantification of visual interest. In Proceedings of the 2004 Symposium on Eye Tracking Research & Applications, San Antonio, TX, USA, 22–24 March 2004; ACM: New York, NY, USA, 2004; pp. 27–34. [Google Scholar]
- Young, L.R.; Sheena, D. Survey of eye movement recording methods. Behav. Res. Methods 1975, 7, 397–429. [Google Scholar] [CrossRef]
- Schäfer, J.Ö.; Naumann, E.; Holmes, E.A.; Tuschen-Caffier, B.; Samson, A.C. Emotion regulation strategies in depressive and anxiety symptoms in youth: A meta-analytic review. J. Youth Adolesc. 2017, 46, 261–276. [Google Scholar] [CrossRef] [PubMed]
- Lee, F.S.; Heimer, H.; Giedd, N.; Lein, E.S.; Šestan, N.; Weinberger, D.R.; Casey, B.J. Adolescent mental healthopportunity and obligation. Science 2014, 346, 547–549. [Google Scholar] [CrossRef] [PubMed]
- Casey, B.J.; Jones, R.M.; Hare, T.A. The adolescent brain. Ann. N. Y. Acad. Sci. 2008, 1124, 111–126. [Google Scholar] [CrossRef] [PubMed]
- Paus, T.; Keshavan, M.; Giedd, J.N. Why do many psychiatric disorders emerge during adolescence? Nat. Rev. Neurosci. 2008, 9, 947–957. [Google Scholar] [CrossRef] [PubMed]
- Spear, L.P. The adolescent brain and age-related behavioral manifestations. Neurosci. Biobehav. Res. 2000, 24, 417–463. [Google Scholar] [CrossRef]
- Partala, T.; Surakka, V. Pupil size variation as an indication of affective processing. Int. J. Hum. Comput. Stud. 2003, 59, 185–198. [Google Scholar] [CrossRef]
- Bradley, M.M.; Miccoli, L.; Escrig, M.A.; Lang, P.J. The pupil as a measure of emotional arousal and autonomic activation. Psychophysiology 2008, 45, 602–607. [Google Scholar] [CrossRef] [PubMed]
- Yuval-Greenberg, S.; Tomer, O.; Keren, A.S.; Nelken, I.; Deouell, L.Y. Transient induced gamma-band response in EEG as a manifestation of miniature saccades. Neuron 2008, 58, 429–441. [Google Scholar] [CrossRef] [PubMed]
- Xue, J.; Li, C.; Quan, C.; Lu, Y.; Yue, J.; Zhang, C. Uncovering the cognitive processes underlying mental rotation: An eye-movement study. Sci. Rep. 2017, 7, 10076. [Google Scholar] [CrossRef] [PubMed]
- Bulling, A.; Ward, J.A.; Gellersen, H.; Troster, G. Eye movement analysis for activity recognition using electrooculography. IEEE Trans. Pattern Anal. Mach. Intell. 2011, 33, 741–753. [Google Scholar] [CrossRef] [PubMed]
- Duchowski, A.T. Eye Tracking Methodology, 2nd ed.; Springer: Berlin, Germany, 2007; p. 328. ISBN 978-3-319-57883-5. [Google Scholar]
- Manor, B.R.; Gordon, E. Defining the temporal threshold for ocular fixation in free-viewing visuocognitive tasks. J. Neurosci. Methods 2003, 128, 85–93. [Google Scholar] [CrossRef]
- Almeida, L.B. The fractional Fourier transform and time-frequency representations. IEEE Trans. Signal Process. 1994, 42, 3084–3091. [Google Scholar] [CrossRef]
- Lu, Y.; Zheng, W.L.; Li, B.; Lu, B.L. Combining Eye Movements and EEG to Enhance Emotion Recognition. In Proceedings of the Twenty-Fourth International Joint Conference on Artificial Intelligence, Buenos Aires, Argentina, 25–31 July 2015; pp. 1170–1176. [Google Scholar]
- Guo, Y.; Liu, L.; Wu, Y.; Hardy, J. Interest-aware content discovery in peer-to-peer social networks. ACM Trans. Internet Technol. 2017, 18, 39. [Google Scholar] [CrossRef]
- Liu, L.; Antonopoulos, N.; Zheng, M.; Zhan, Y.; Ding, Z. A socioecological model for advanced service discovery in machine-to-machine communication networks. ACM Trans. Embed. Comput. Syst. 2016, 15, 38. [Google Scholar] [CrossRef]
- Boukadoum, A.M.; Ktonas, P.Y. EOG-Based Recording and Automated Detection of Sleep Rapid Eye Movements: A Critical Review, and Some Recommendations. Psychophysiology 1986, 23, 598–611. [Google Scholar] [CrossRef] [PubMed]
- Ding, X.; Lv, Z.; Zhang, C.; Gao, X.; Zhou, B. A Robust Online Saccadic Eye Movement Recognition Method Combining Electrooculography and Video. IEEE Access 2017, 5, 17997–18003. [Google Scholar] [CrossRef]
- Yuen, H.K.; Princen, J.; Illingworth, J.; Kittler, J. Comparative study of Hough transform methods for circle finding. Image Vis. Comput. 1990, 8, 71–77. [Google Scholar] [CrossRef]
- Hall, D.L.; Llinas, J. An introduction to multisensor data fusion. Proc. IEEE 1997, 85, 6–23. [Google Scholar] [CrossRef]


| Parameters | Time-Domain Features |
|---|---|
| Saccade | the maximum, mean, standard deviation of saccade duration, and saccade frequency |
| Fixation | the maximum, mean, standard deviation of fixation duration, and fixation frequency |
| Pupil diameter | the maximum, mean, standard deviation |
| Subjects | Time-Frequency | Saccades | Fixations | Pupil Diameters | Ave. | |||||
|---|---|---|---|---|---|---|---|---|---|---|
| Accuracy | F1 Score | Accuracy | F1 Score | Accuracy | F1 Score | Accuracy | F1 Score | Accuracy | F1 Score | |
| S1 (f) 1 | 87.69 | 88.78 | 52.64 | 51.83 | 55.94 | 56.23 | 42.7 | 43.45 | 59.74 | 60.07 |
| S2 (f) | 87.6 | 87.1 | 60.4 | 58.93 | 49.82 | 47.56 | 51.94 | 52.17 | 62.39 | 61.44 |
| S3 (m) | 89.51 | 89.6 | 53.12 | 52.63 | 44.07 | 44.78 | 55.21 | 54.73 | 60.48 | 60.44 |
| S4 (f) | 79.81 | 81.21 | 54.89 | 55.54 | 49.43 | 48.79 | 39.44 | 40.05 | 55.89 | 56.4 |
| S5 (f) | 82.22 | 83.67 | 54.72 | 54.89 | 48.27 | 47.8 | 49 | 48.78 | 58.55 | 58.79 |
| S6 (f) | 83.61 | 83.5 | 58.89 | 60.13 | 49.63 | 48.59 | 45.17 | 46.89 | 59.32 | 59.78 |
| S7 (m) | 88.28 | 88.1 | 50.27 | 48.36 | 60.94 | 62.87 | 45.39 | 43.1 | 61.22 | 60.61 |
| S8 (m) | 83.27 | 83.22 | 57.89 | 55.46 | 46.22 | 45.14 | 49.11 | 43.42 | 58.62 | 56.81 |
| Ave. | 85.37 | 85.65 | 55.35 | 54.72 | 50.52 | 50.22 | 47.25 | 46.57 | 59.53 | 59.62 |
© 2018 by the authors. Licensee MDPI, Basel, Switzerland. This article is an open access article distributed under the terms and conditions of the Creative Commons Attribution (CC BY) license (http://creativecommons.org/licenses/by/4.0/).
Share and Cite
Wang, Y.; Lv, Z.; Zheng, Y. Automatic Emotion Perception Using Eye Movement Information for E-Healthcare Systems. Sensors 2018, 18, 2826. https://doi.org/10.3390/s18092826
Wang Y, Lv Z, Zheng Y. Automatic Emotion Perception Using Eye Movement Information for E-Healthcare Systems. Sensors. 2018; 18(9):2826. https://doi.org/10.3390/s18092826
Chicago/Turabian StyleWang, Yang, Zhao Lv, and Yongjun Zheng. 2018. "Automatic Emotion Perception Using Eye Movement Information for E-Healthcare Systems" Sensors 18, no. 9: 2826. https://doi.org/10.3390/s18092826
APA StyleWang, Y., Lv, Z., & Zheng, Y. (2018). Automatic Emotion Perception Using Eye Movement Information for E-Healthcare Systems. Sensors, 18(9), 2826. https://doi.org/10.3390/s18092826