Surface-Plasmon-Resonance-Based Optical Fiber Curvature Sensor with Temperature Compensation by Means of Dual Modulation Method

 and
and
Abstract
1. Introduction
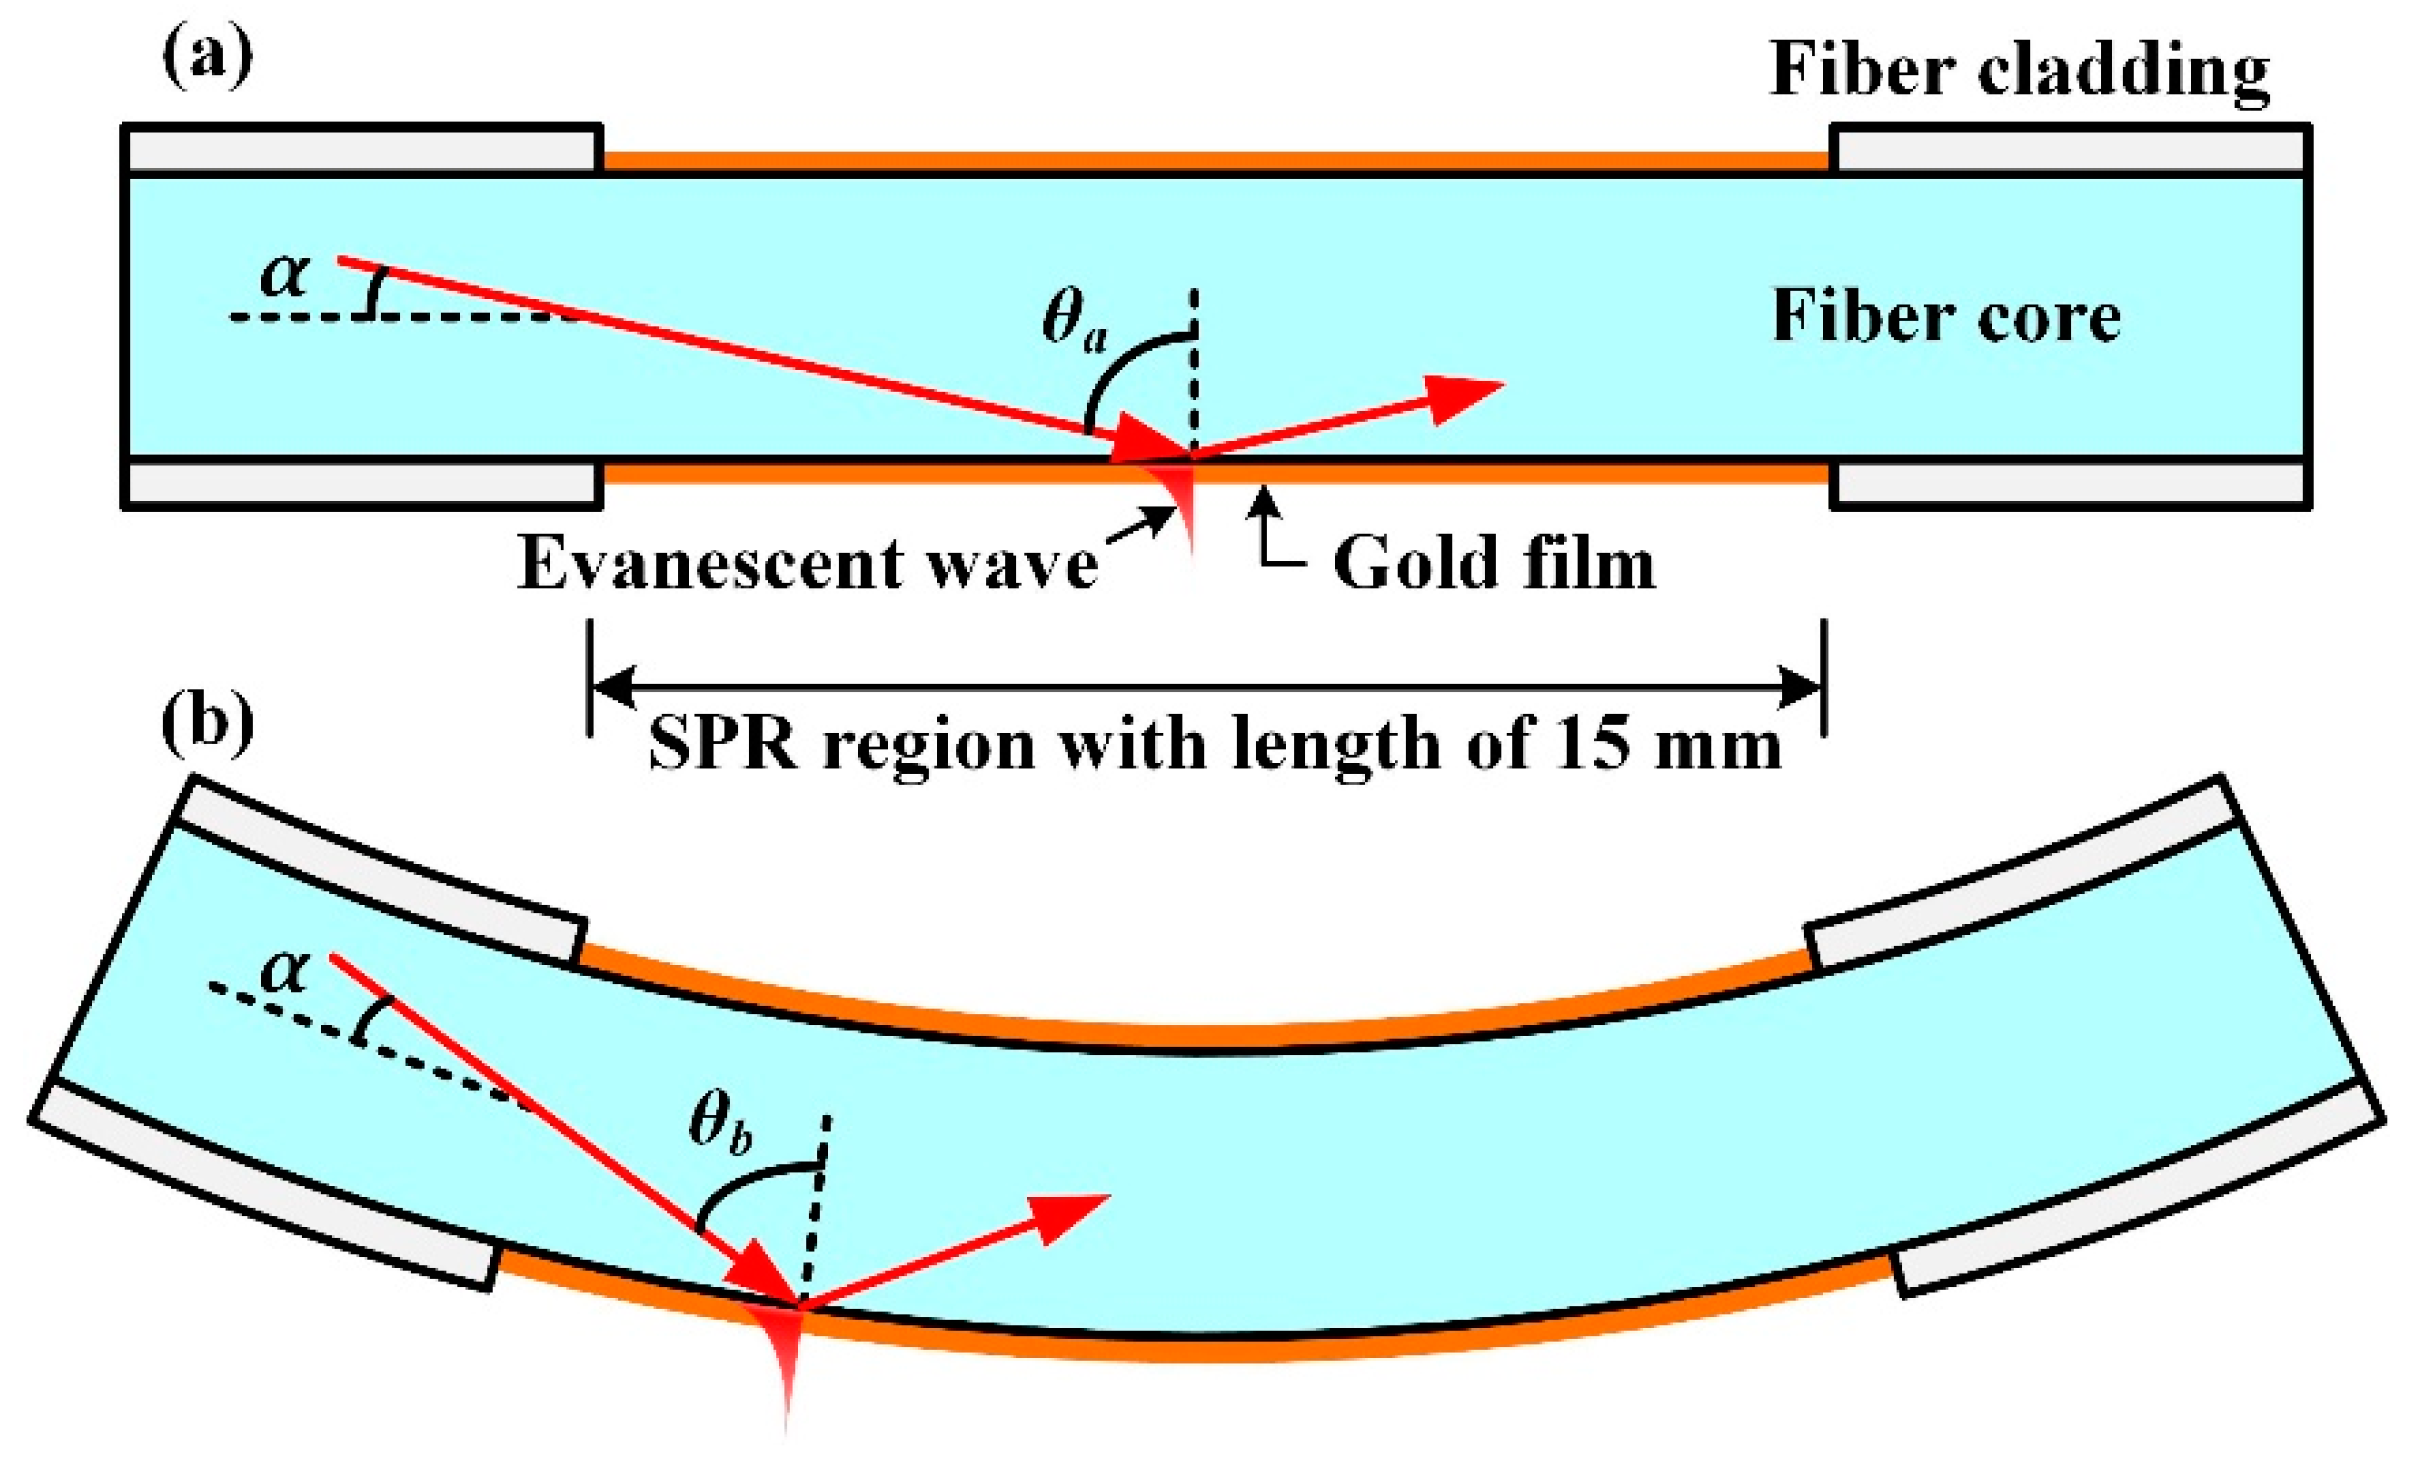
2. Sensor Structure
3. Experimental Preparation
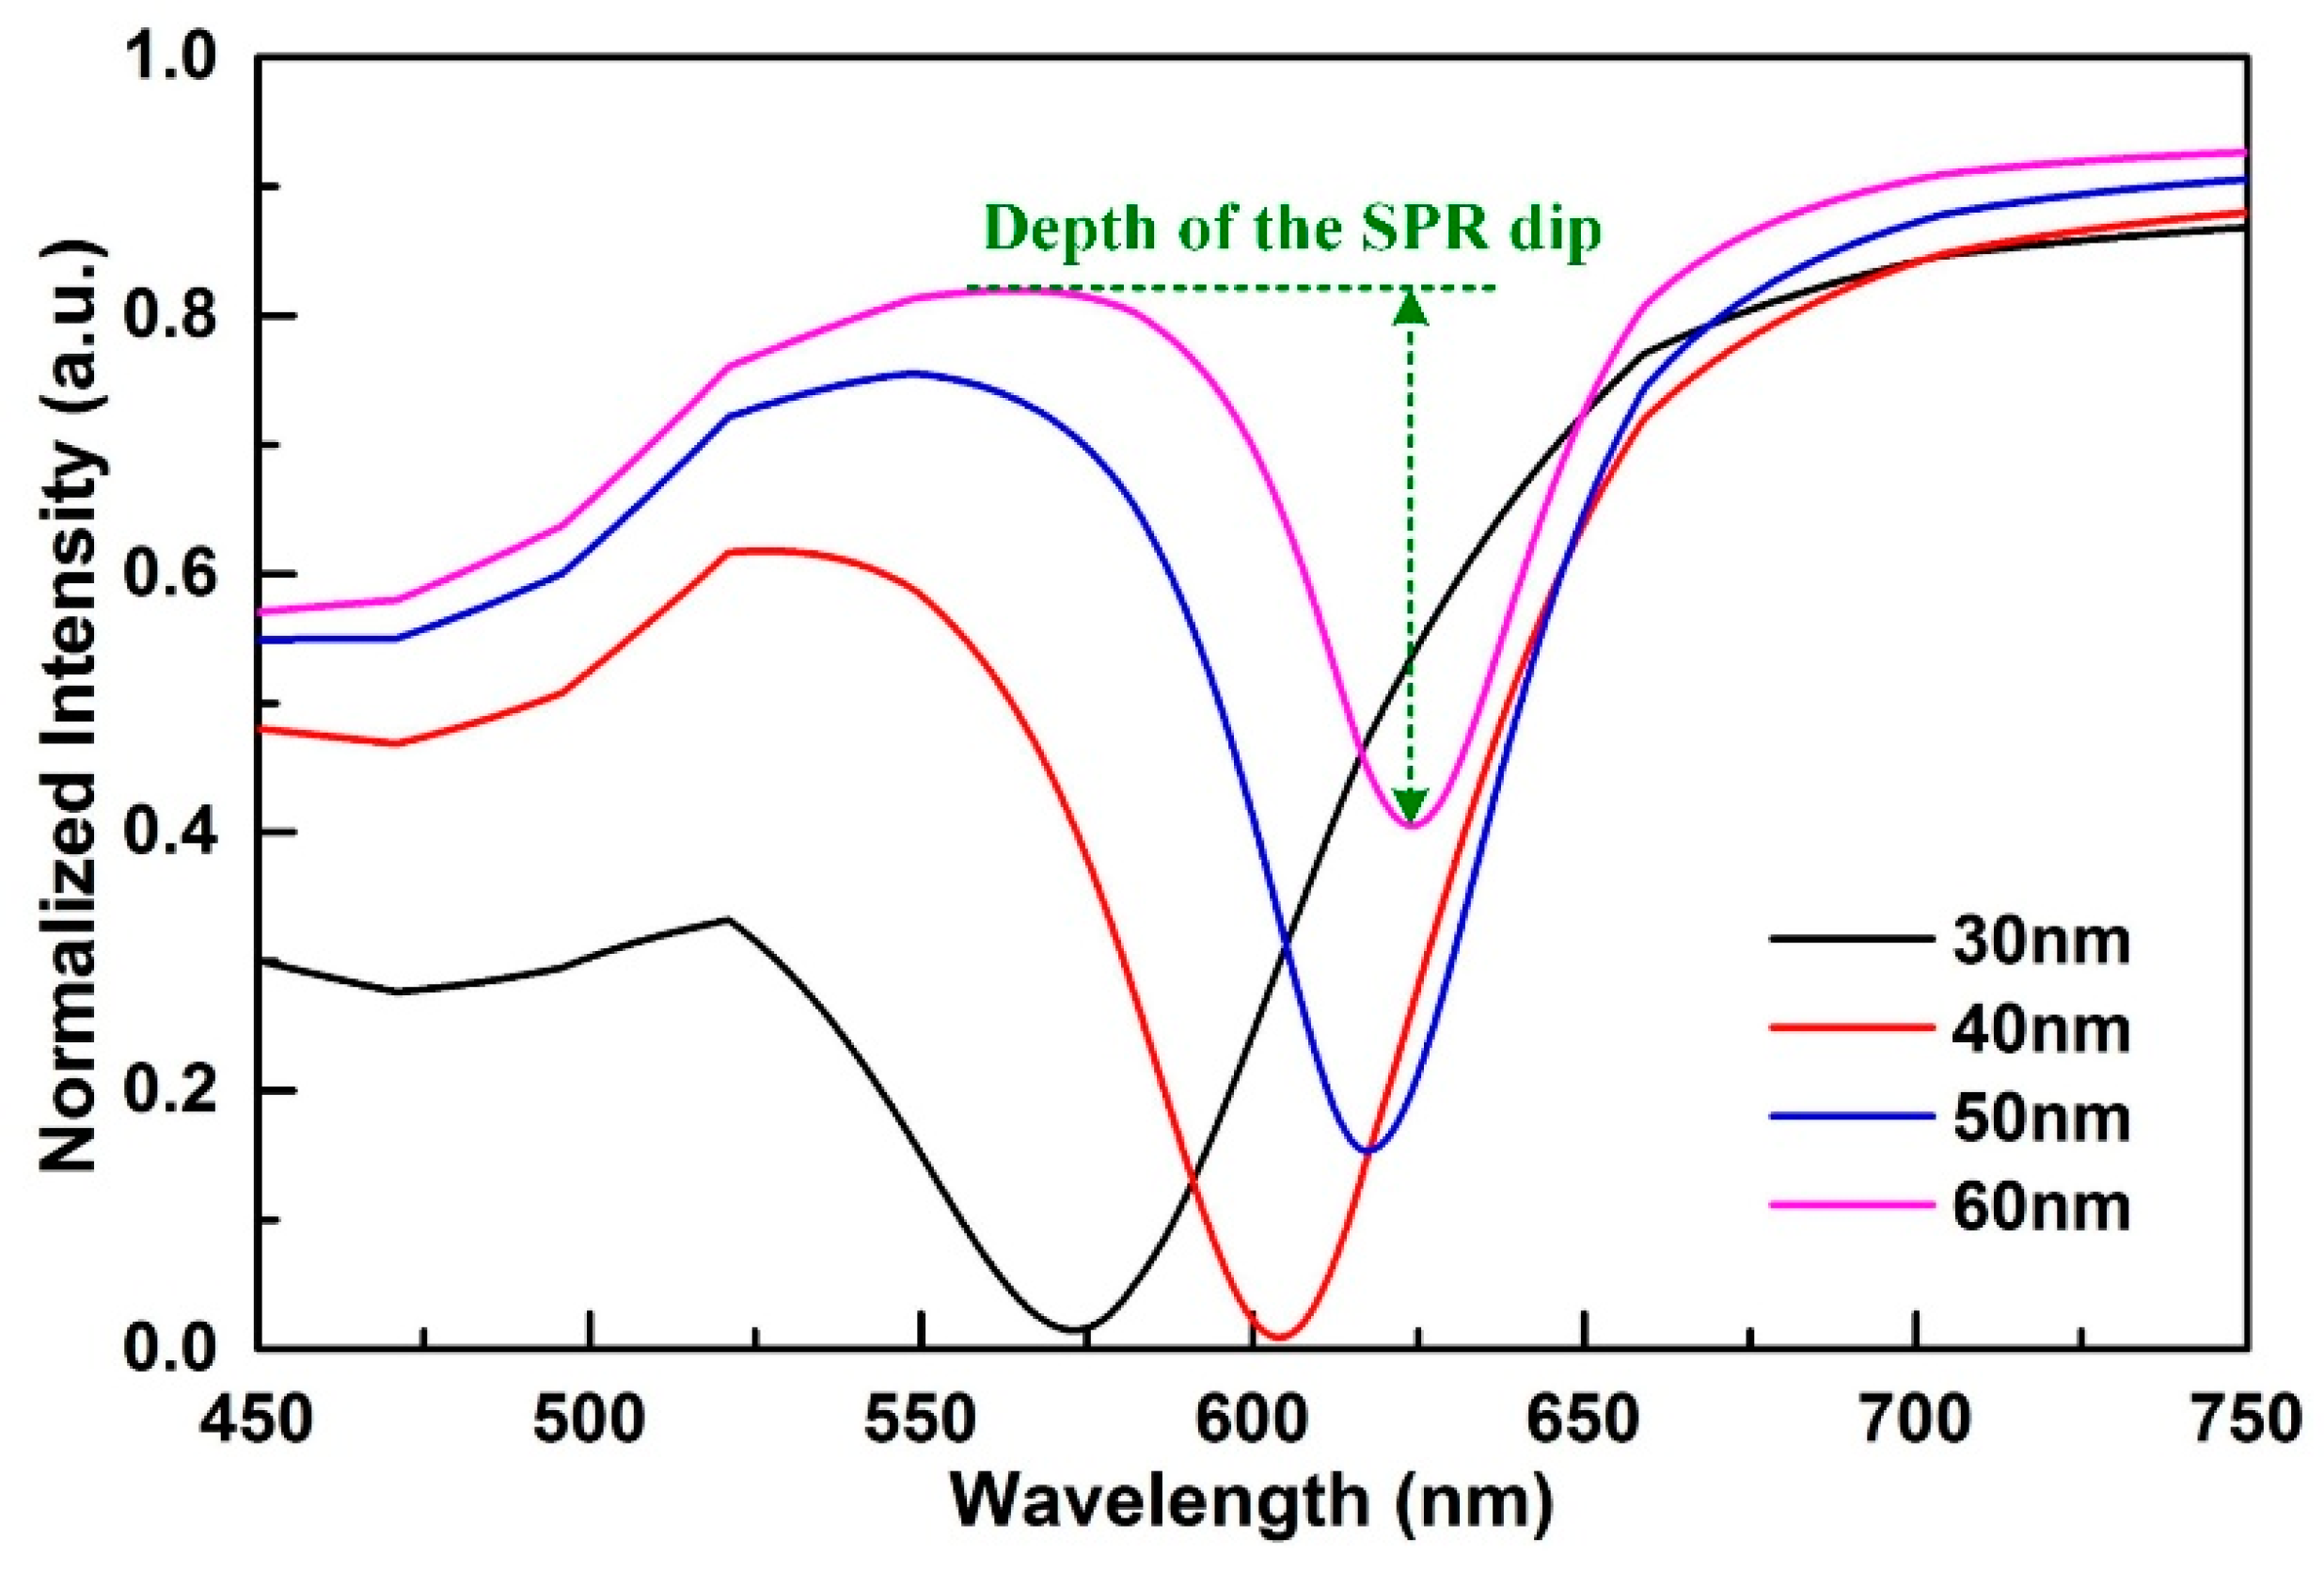
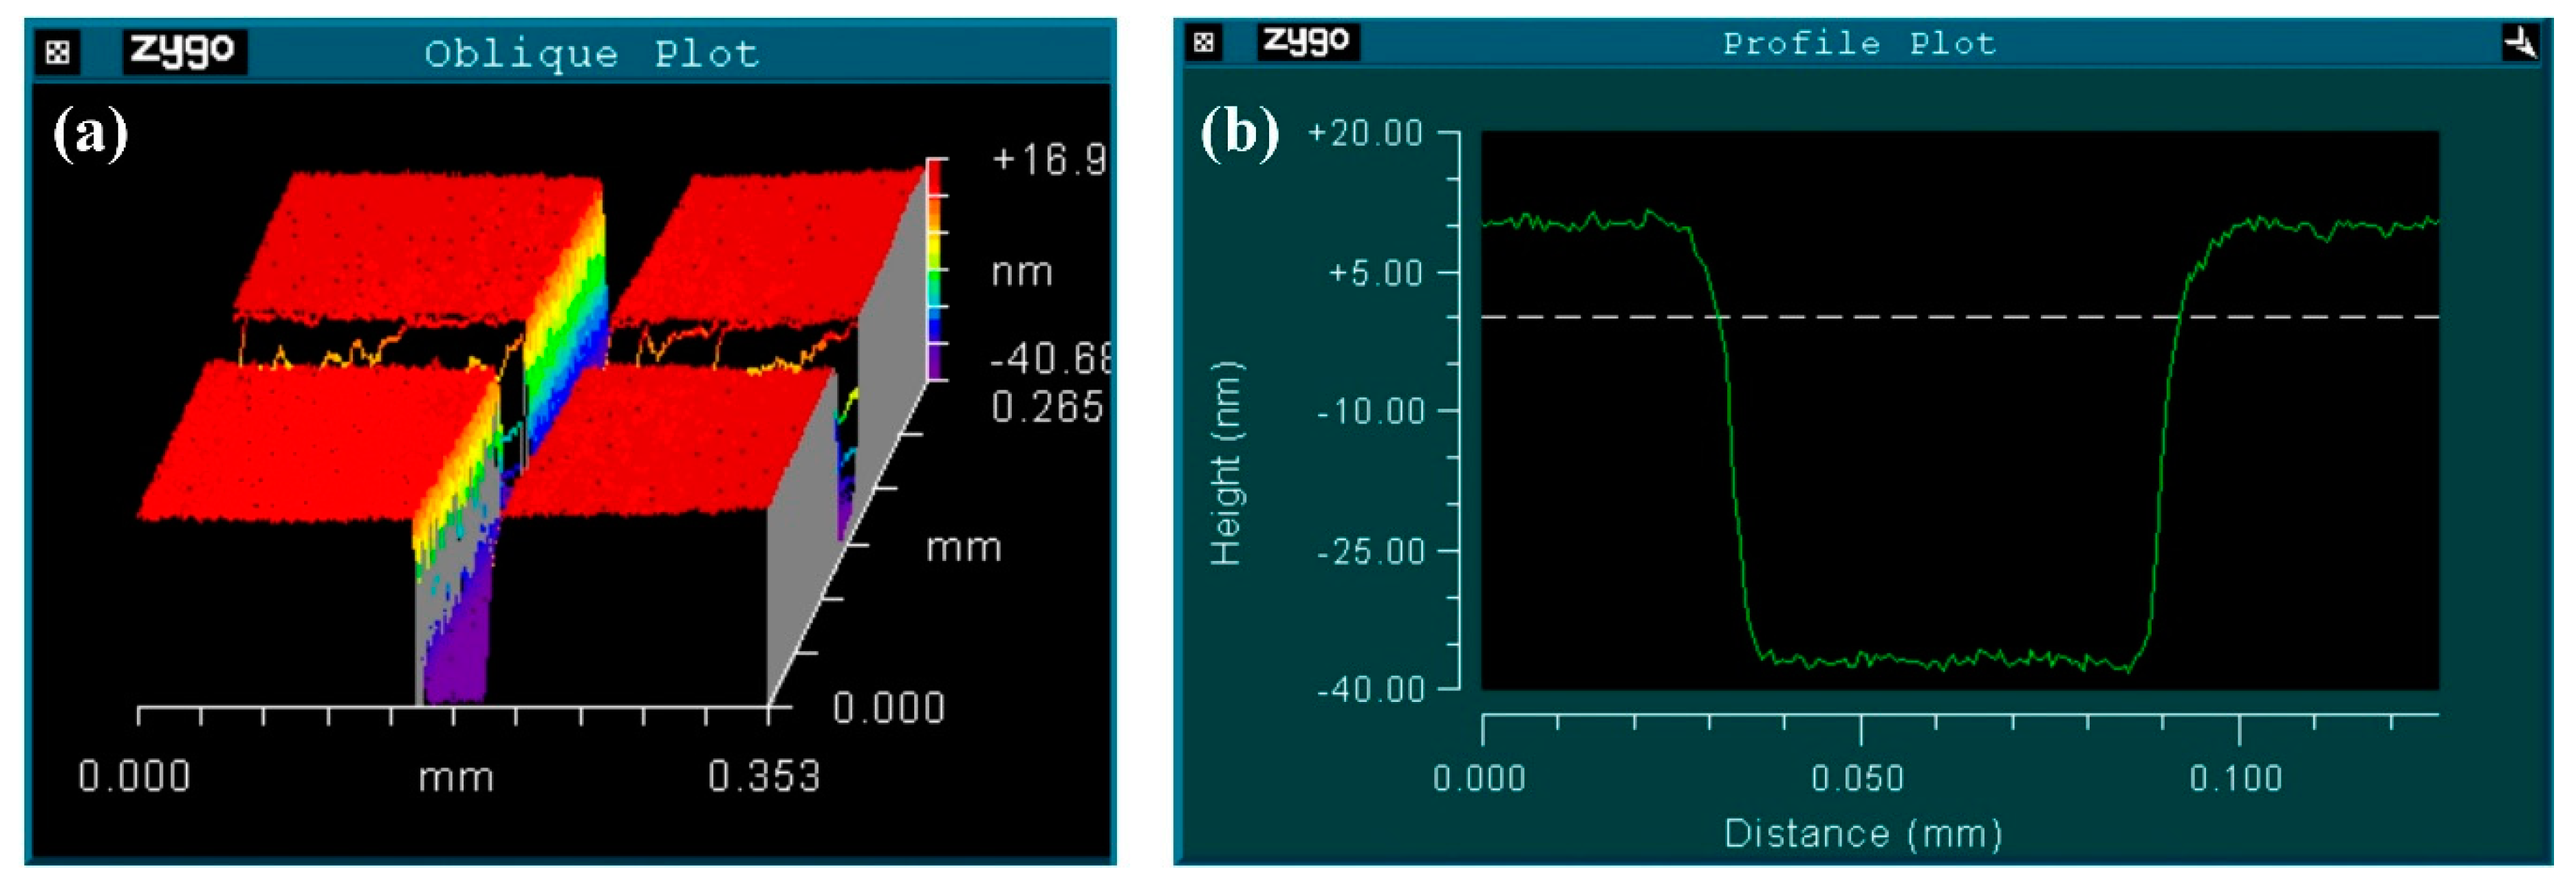
3.1. Fabrication of the Bending Sensor
3.2. Experimental Setup
4. Results and Discussion
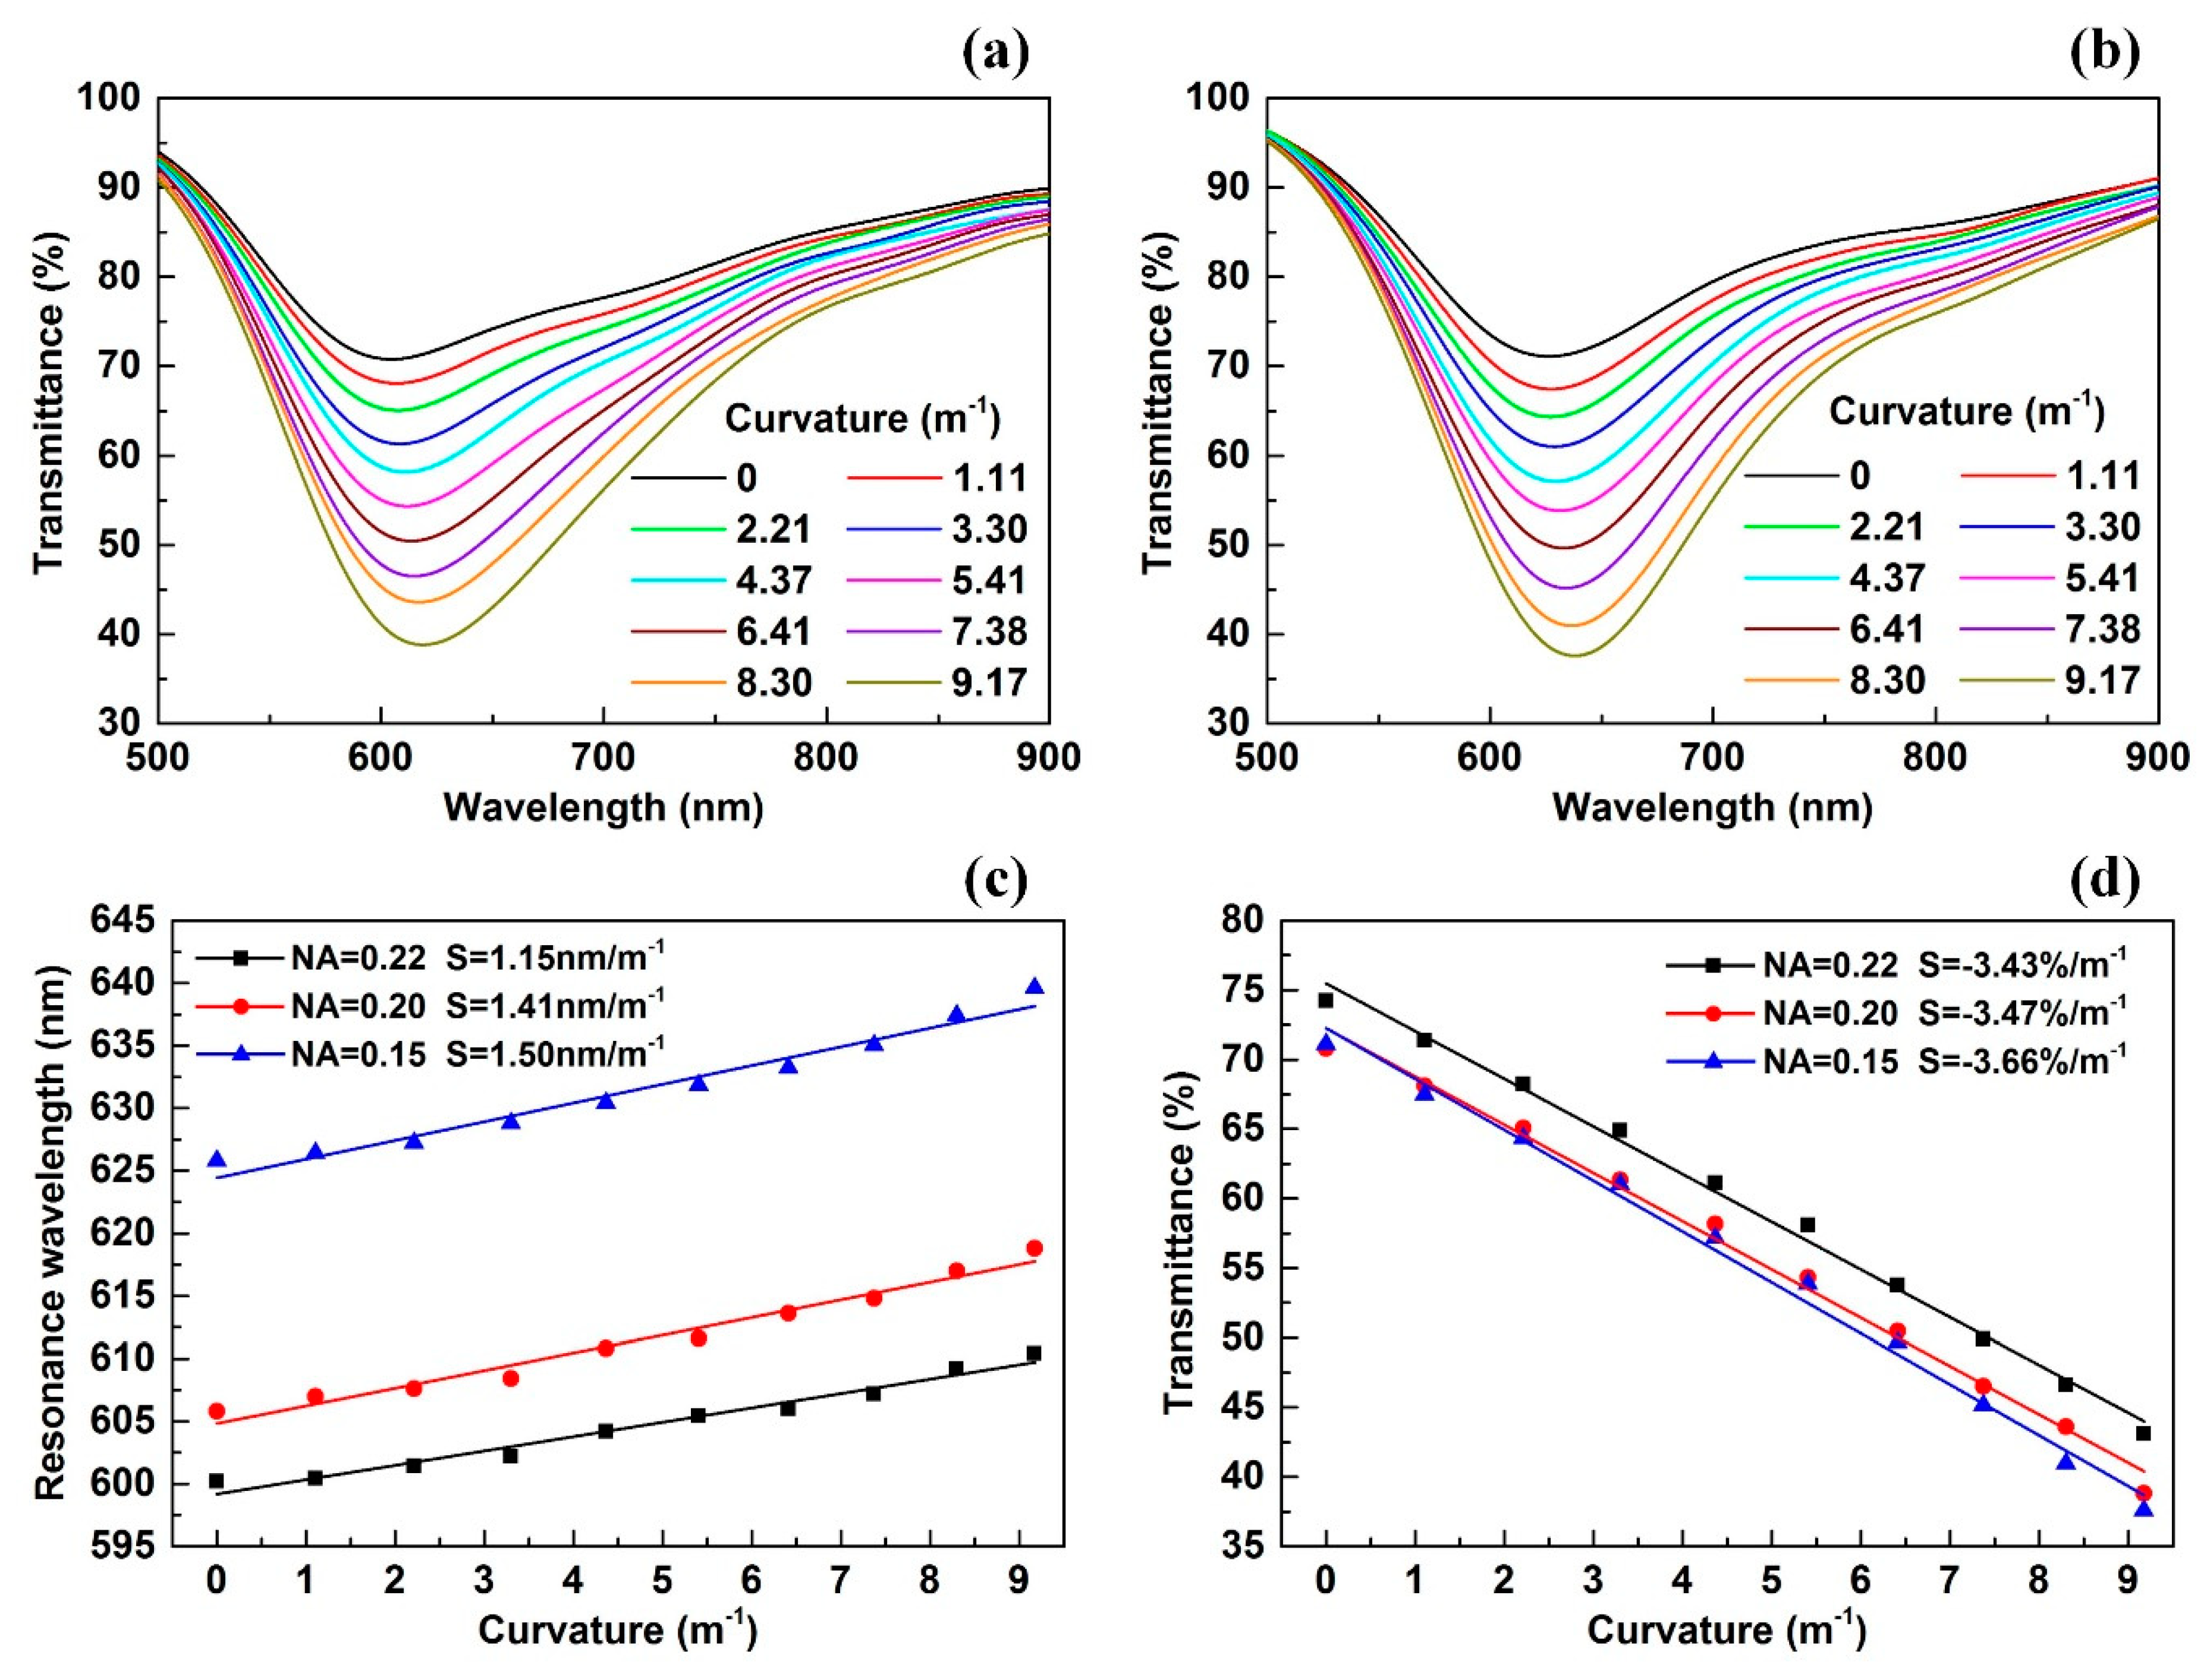
4.1. Bending Test
4.2. Effect of the Optical Fiber NA on Sensitivity
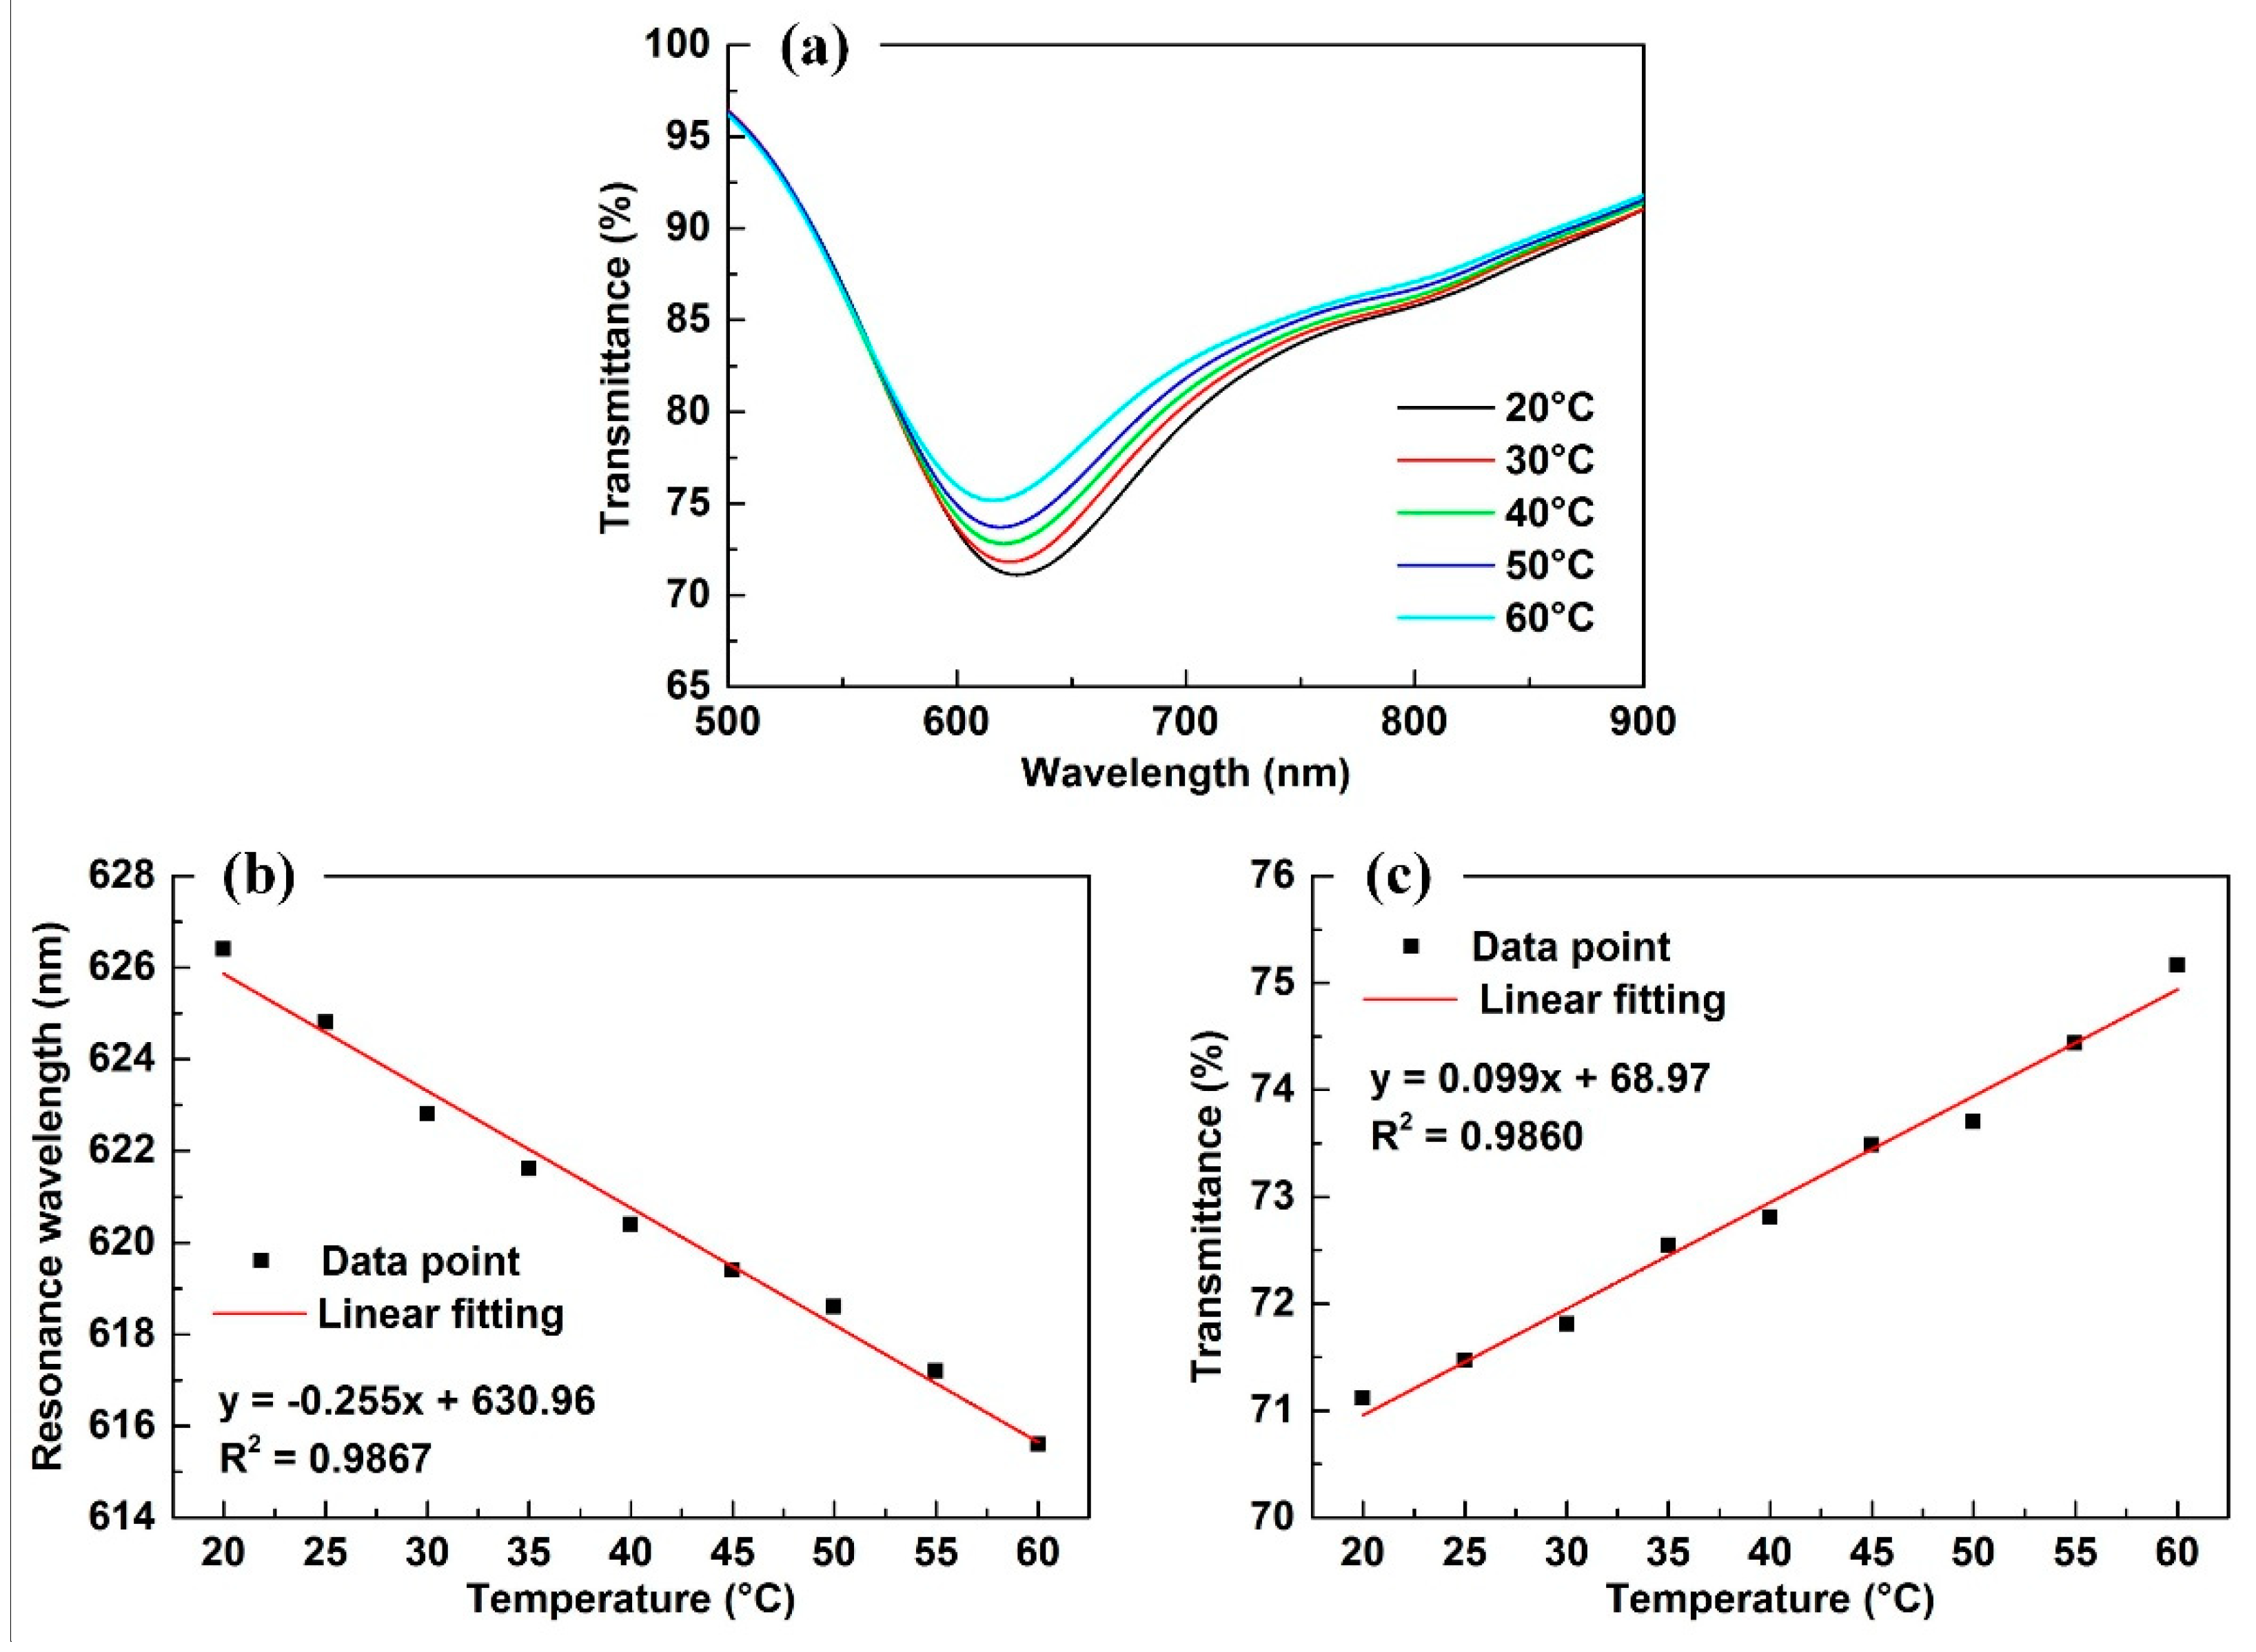
4.3. Effect of the Temperature on Sensing Results
4.4. Temperature Compensation of the Curvature Sensor
5. Conclusions
Author Contributions
Funding
Conflicts of Interest
References
- Hu, H.F.; Sun, S.J.; Lv, R.Q.; Zhao, Y. Design and experiment of an optical fiber micro bend sensor for respiration monitoring. Sens. Actuator A Phys. 2016, 251, 126–133. [Google Scholar] [CrossRef]
- Markovic, M.Z.; Bajic, J.S.; Vrtunski, M.; Ninkov, T.; Vasic, D.D.; Zivanov, M.B. Application of fiber-optic curvature sensor in deformation measurement process. Measurement 2016, 92, 50–57. [Google Scholar] [CrossRef]
- Zheng, S.J. Long-period fiber grating moisture sensor with nano-structured coatings for structural health monitoring. Struct. Health Monit. 2015, 14, 148–157. [Google Scholar] [CrossRef]
- Ge, J.; James, A.E.; Xu, L.; Chen, Y.; Kwok, K.W.; Fok, M.P. Bidirectional Soft Silicone Curvature Sensor Based on Off-Centered Embedded Fiber Bragg Grating. IEEE Photonic Technol. Lett. 2016, 28, 2237–2240. [Google Scholar] [CrossRef]
- Zhang, H.L.; Wu, Z.F.; Shum, P.P.; Wang, R.X.; Dinh, X.Q.; Fu, S.N.; Tong, W.J.; Tang, M. Fiber Bragg gratings in heterogeneous multicore fiber for directional bending sensing. J. Opt. UK 2016, 18. [Google Scholar] [CrossRef]
- Wada, D.; Igawa, H.; Murayama, H. Simultaneous distributed measurement of the strain and temperature for a four-point bending test using polarization-maintaining fiber Bragg grating interrogated by optical frequency domain reflectometry. Measurement 2016, 94, 745–752. [Google Scholar] [CrossRef]
- Ren, K.L.; Ren, L.Y.; Liang, J.; Kong, X.D.; Ju, H.J.; Wu, Z.X. Highly Strain and Bending Sensitive Microtapered Long-Period Fiber Gratings. IEEE Photonic Technol. Lett. 2017, 29, 1085–1088. [Google Scholar] [CrossRef]
- Zhang, Y.S.; Zhang, W.G.; Chen, L.; Zhang, Y.X.; Wang, S.; Yu, L.; Li, Y.P.; Geng, P.C.; Yan, T.Y.; Li, X.Y.; et al. Concave-lens-like long-period fiber grating bidirectional high-sensitivity bending sensor. Opt. Lett. 2017, 42, 3892–3895. [Google Scholar] [CrossRef] [PubMed]
- Ouyang, Y.; Guo, H.Y.; Ouyang, X.W.; Xu, X.F.; Zhou, C.M.; Zhou, A. Highly Sensitive Two-Axis Bending Sensor Based on Arc-Induced Long Period Fiber Grating in Dual Side-Hole Fiber. IEEE Photonics J. 2018, 10. [Google Scholar] [CrossRef]
- Pallares-Aldeiturriaga, D.; Rodriguez-Cobo, L.; Quintela, A.; Lopez-Higuera, J.M. Curvature Sensor Based on In-Fiber Mach-Zehnder Interferometer Inscribed with Femtosecond Laser. J. Lightw. Technol. 2017, 35, 4624–4628. [Google Scholar] [CrossRef]
- Tian, Y.; Chai, Q.; Tan, T.; Mu, B.X.; Liu, Q.; Liu, Y.L.; Ren, J.; Zhang, J.Z.; Oh, K.; Lewis, E.; et al. Directional Bending Sensor Based on a Dual Side-Hole Fiber Mach-Zehnder Interferometer. IEEE Photonic Technol. Lett. 2018, 30, 375–378. [Google Scholar] [CrossRef]
- Zhao, Y.; Cai, L.; Li, X.G. Temperature-Insensitive Optical Fiber Curvature Sensor Based on SMF-MMF-TCSMF-MMF-SMF Structure. IEEE Trans. Instrum. Meas. 2017, 66, 141–147. [Google Scholar] [CrossRef]
- Yang, B.Y.; Niu, Y.X.; Yang, B.W.; Hu, Y.H.; Dai, L.L.; Yin, Y.H.; Ding, M. High Sensitivity Curvature Sensor with Intensity Demodulation Based on Single-Mode-Tapered Multimode-Single-Mode Fiber. IEEE Sens. J. 2018, 18, 1094–1099. [Google Scholar] [CrossRef]
- Miranda-Castro, R.; de-los-Santos-Alvarez, N.; Miranda-Ordieres, A.J.; Lobo-Castanon, M.J. Harnessing Aptamers to Overcome Challenges in Gluten Detection. Biosensors 2016, 6. [Google Scholar] [CrossRef] [PubMed]
- Liu, Y.; Liu, Q.; Chen, S.M.; Cheng, F.; Wang, H.Q.; Peng, W. Surface Plasmon Resonance Biosensor Based on Smart Phone Platforms. Sci. Rep. 2015, 5, 12864. [Google Scholar] [CrossRef] [PubMed]
- Homola, J. Surface plasmon resonance sensors for detection of chemical and biological species. Chem. Rev. 2008, 108, 462–493. [Google Scholar] [CrossRef] [PubMed]
- Klantsataya, E.; Jia, P.; Ebendorff-Heidepriem, H.; Monro, T.M.; François, A. Plasmonic fiber optic refractometric sensors: From conventional architectures to recent design trends. Sensors 2017, 17, 12. [Google Scholar] [CrossRef] [PubMed]
- Wei, Y.; Su, Y.D.; Liu, C.L.; Zhang, Y.H.; Nie, X.F.; Liu, Z.H.; Zhang, Y.; Peng, F. Segmented detection SPR sensor based on seven-core fiber. Opt. Express 2017, 25, 21841–21850. [Google Scholar] [CrossRef] [PubMed]
- Kulchin, Y.N.; Vitrik, O.B.; Dyshlyuk, A.V. Analysis of surface plasmon resonance in bent single-mode waveguides with metal-coated cladding by eigenmode expansion method. Opt. Express 2014, 22, 22196–22201. [Google Scholar] [CrossRef] [PubMed]
- Bharadwaj, R.; Mukherji, S. Gold nanoparticle coated U-bend fibre optic probe for localized surface plasmon resonance based detection of explosive vapours. Sens. Actuator B Chem. 2014, 192, 804–811. [Google Scholar] [CrossRef]
- Verma, R.K.; Gupta, B.D. Theoretical modelling of a bi-dimensional U-shaped surface plasmon resonance based fibre optic sensor for sensitivity enhancement. J. Phys. D Appl. Phys. 2008, 41. [Google Scholar] [CrossRef]
- Arcas, A.D.; Dutra, F.D.; Allil, R.C.S.B.; Werneck, M.M. Surface Plasmon Resonance and Bending Loss-Based U-Shaped Plastic Optical Fiber Biosensors. Sensors 2018, 18. [Google Scholar] [CrossRef] [PubMed]
- Takagi, K.; Sasaki, H.; Seki, A.; Watanabe, K. Surface plasmon resonances of a curved hetero-core optical fiber sensor. Sens. Actuator A Phys. 2010, 161, 1–5. [Google Scholar] [CrossRef]
- Napiorkowski, M.; Urbanczyk, W. Effect of bending on surface plasmon resonance spectrum in microstructured optical fibers. Opt. Express 2013, 21, 22762–22772. [Google Scholar] [CrossRef] [PubMed]
- Dash, J.N.; Jha, R. Highly Sensitive Side-Polished Birefringent PCF-Based SPR Sensor in near IR. Plasmonics 2016, 11, 1505–1509. [Google Scholar] [CrossRef]
- Gasior, K.; Martynkien, T.; Wojcik, G.; Mergo, P.; Urbanczyk, W. D-shape polymer optical fibres for surface plasmon resonance sensing. Opto-Electron. Rev. 2016, 24, 209–215. [Google Scholar] [CrossRef]
- Iga, M.; Seki, A.; Watanabe, K. Hetero-core structured fiber optic surface plasmon resonance sensor with silver film. Sens. Actuator B Chem. 2004, 101, 368–372. [Google Scholar] [CrossRef]
- Klantsataya, E.; François, A.; Ebendorff-Heidepriem, H.; Hoffmann, P.; Monro, T.M. Surface plasmon scattering in exposed core optical fiber for enhanced resolution refractive index sensing. Sensors 2015. [Google Scholar] [CrossRef] [PubMed]
- Bashkatov, A.N.; Genina, E.A. Water refractive index in dependence on temperature and wavelength: A simple approximation. In Proceedings of the SPIE 5068, Saratov Fall Meeting 2002 Optical Technologies in Biophysics and Medicine IV, Saratov, Russian, 14 October 2003. [Google Scholar] [CrossRef]
- Liu, Z.H.; Zhu, Z.D.; Liu, L.; Zhang, Y.; Wei, Y.; Wang, Y.S.; Zhang, Y.X.; Zhao, E.M.; Yang, X.H.; Yang, J.; et al. Dual-truncated-cone structure for quasi-distributed multichannel fiber surface plasmon resonance sensor. Opt. Lett. 2016, 41, 4320–4323. [Google Scholar] [CrossRef] [PubMed]
- Velázquez-González, J.S.; Monzón-Hernández, D.; Moreno-Hernández, D.; Martínez-Pinón, F.; Hernández-Romano, I. Simultaneous measurement of refractive index and temperature using a SPR-based fiber optic sensor. Sens. Actuators B Chem. 2017. [Google Scholar] [CrossRef]


| Parameters | Sensor 1 | Sensor 2 | Sensor 3 |
|---|---|---|---|
| NA of fiber | 0.22 | 0.20 | 0.15 |
| Sensitivity, nm/m−1 | 1.15 | 1.41 | 1.50 |
| FWHM, nm | 165 | 193 | 184 |
| FOM, /m−1 | 6.97 × 10⁻³ | 7.31 × 10⁻³ | 8.35 × 10⁻³ |
| DL, m−1 | 0.17 | 0.14 | 0.13 |
© 2018 by the authors. Licensee MDPI, Basel, Switzerland. This article is an open access article distributed under the terms and conditions of the Creative Commons Attribution (CC BY) license (http://creativecommons.org/licenses/by/4.0/).
Share and Cite
Su, Y.; Wei, Y.; Zhang, Y.; Liu, C.; Nie, X.; Zhu, Z.; Liu, L. Surface-Plasmon-Resonance-Based Optical Fiber Curvature Sensor with Temperature Compensation by Means of Dual Modulation Method. Sensors 2018, 18, 2608. https://doi.org/10.3390/s18082608
Su Y, Wei Y, Zhang Y, Liu C, Nie X, Zhu Z, Liu L. Surface-Plasmon-Resonance-Based Optical Fiber Curvature Sensor with Temperature Compensation by Means of Dual Modulation Method. Sensors. 2018; 18(8):2608. https://doi.org/10.3390/s18082608
Chicago/Turabian StyleSu, Yudong, Yong Wei, Yonghui Zhang, Chunlan Liu, Xiangfei Nie, Zongda Zhu, and Lu Liu. 2018. "Surface-Plasmon-Resonance-Based Optical Fiber Curvature Sensor with Temperature Compensation by Means of Dual Modulation Method" Sensors 18, no. 8: 2608. https://doi.org/10.3390/s18082608
APA StyleSu, Y., Wei, Y., Zhang, Y., Liu, C., Nie, X., Zhu, Z., & Liu, L. (2018). Surface-Plasmon-Resonance-Based Optical Fiber Curvature Sensor with Temperature Compensation by Means of Dual Modulation Method. Sensors, 18(8), 2608. https://doi.org/10.3390/s18082608