Automatic Annotation of Unlabeled Data from Smartphone-Based Motion and Location Sensors


Abstract
1. Introduction
- Annotate unlabeled multivariate sensor data as: ‘non-sensitive’ (does not contain GPS data) or ‘sensitive’ (contains GPS data).
- Propose a multiple pair frequency cluster validation index (MPFCVI) for evaluating generated cluster labels.
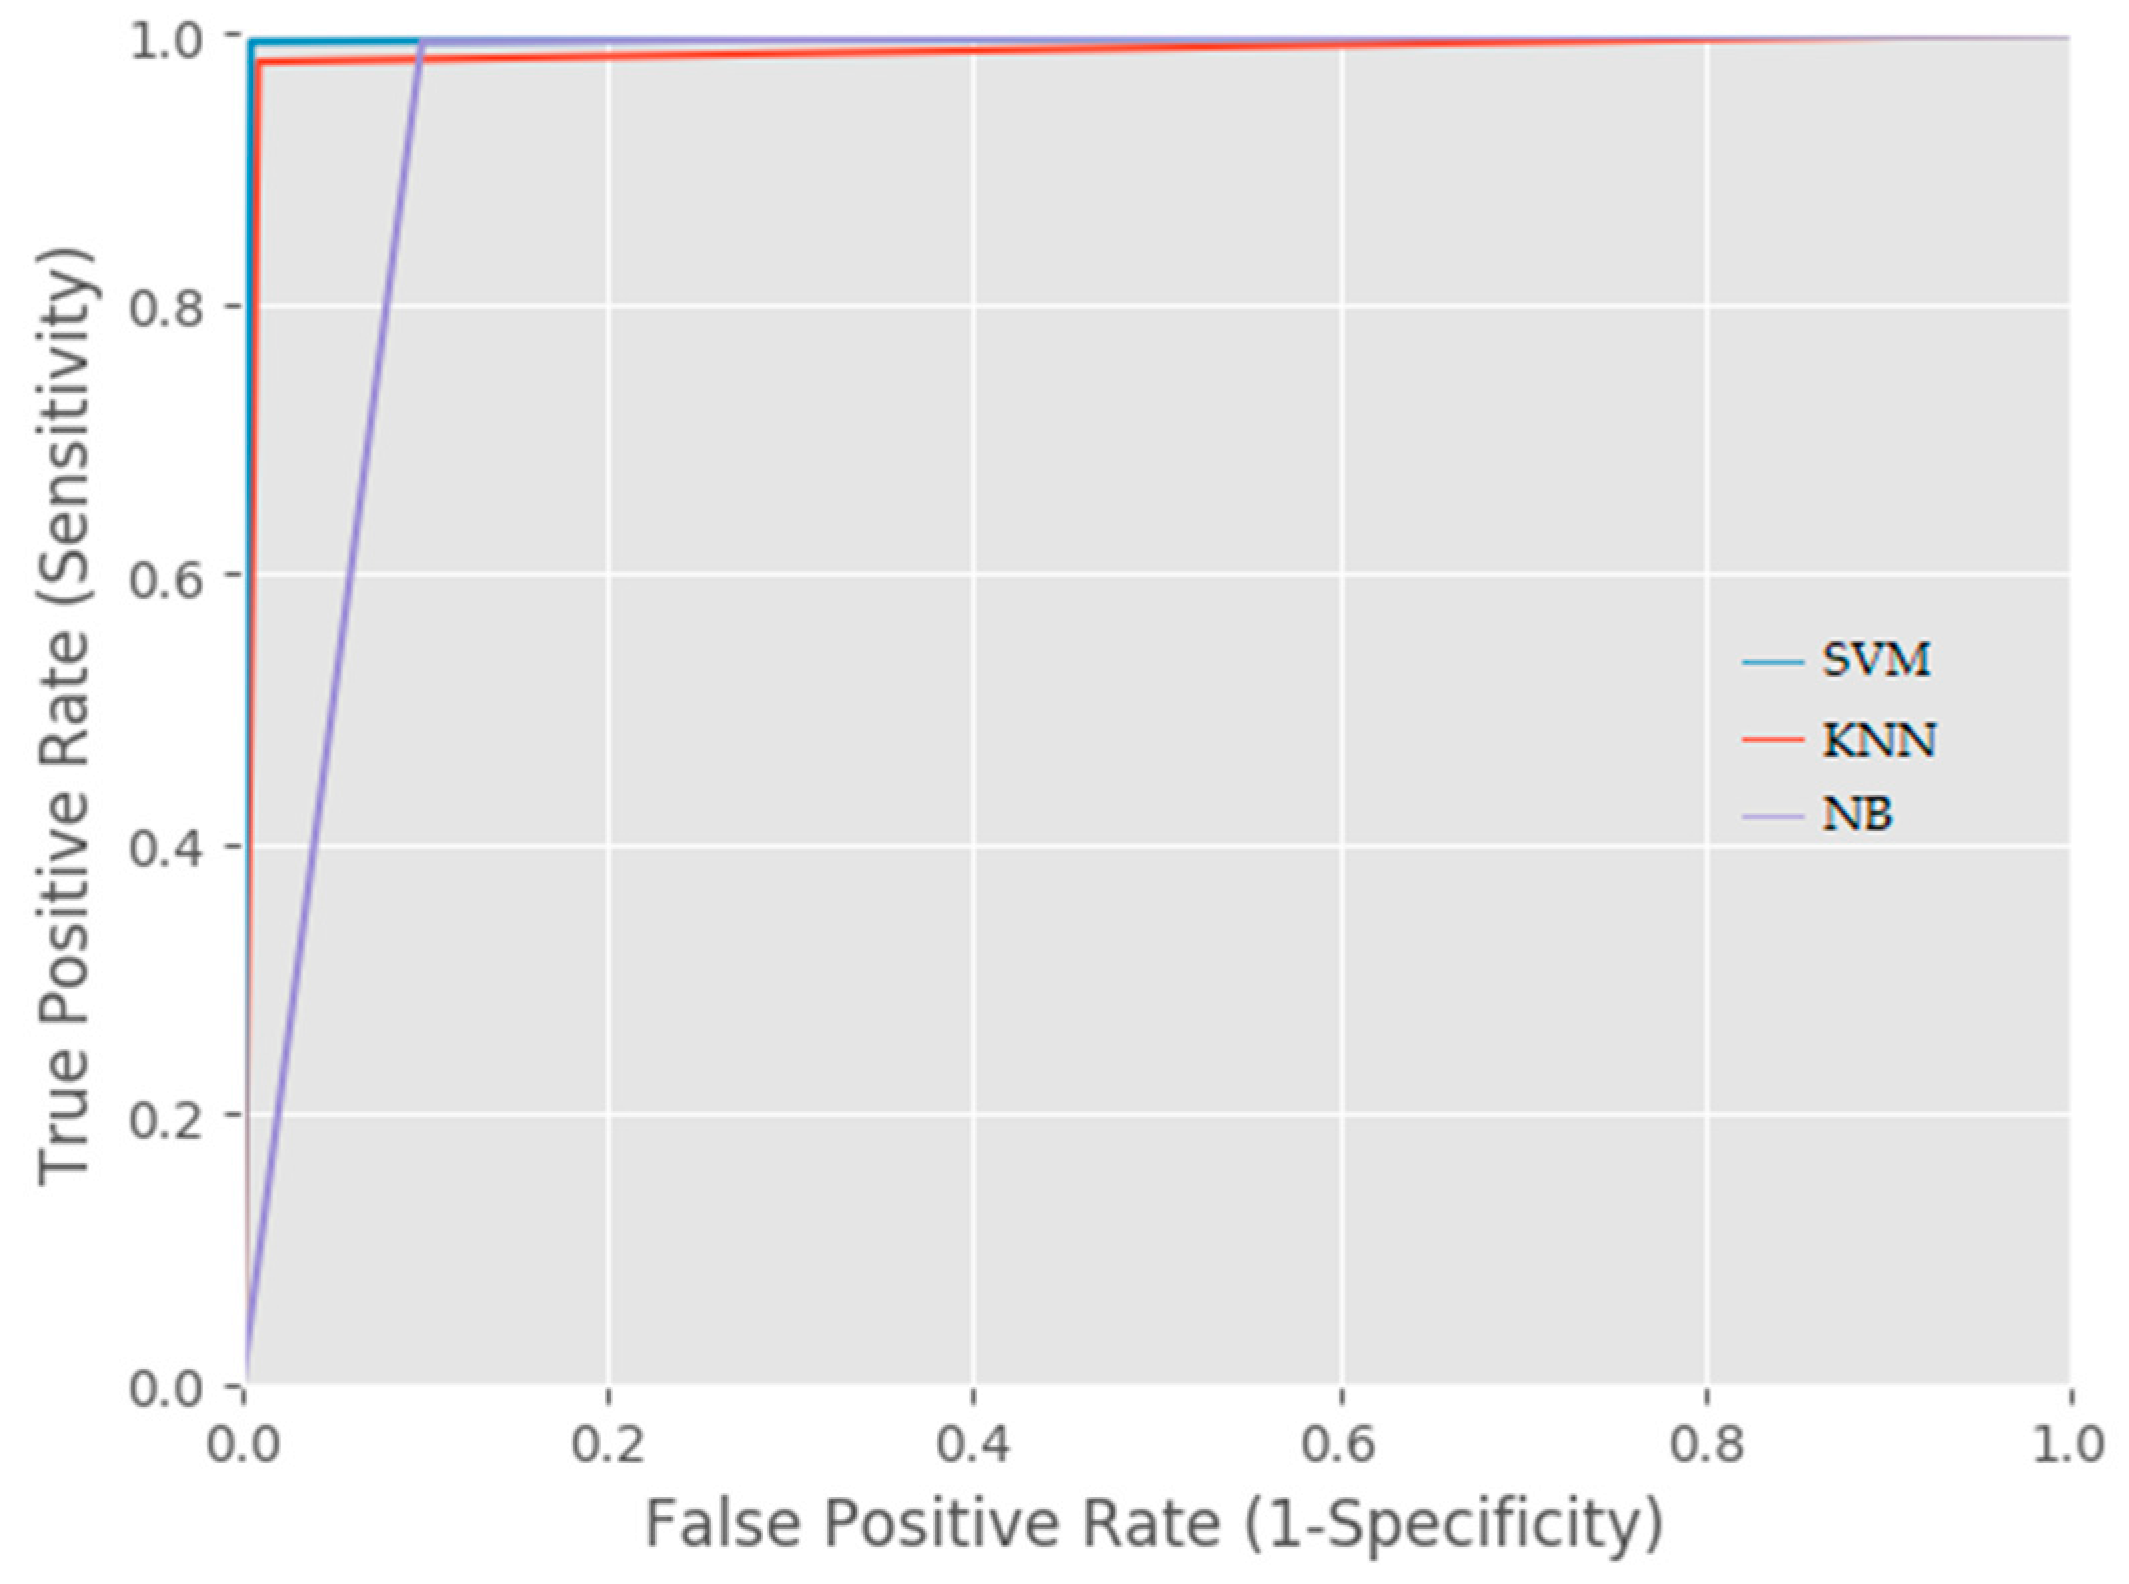
- Evaluate the accuracy of supervised learning classifiers (SVM, KNN, and NB) using generated cluster labels.
2. Related Works
2.1. Supervised Learning Paradigms
2.2. Semi-Supervised Learning Paradigm
2.3. Unsupervised Learning Paradigm
3. Materials and Methods
3.1. k-Means Clustering
3.2. Multiple Pair-Frequency Cluster Validation Index (MPFCVI)
3.3. Dataset
3.4. Experimental Procedures
4. Results
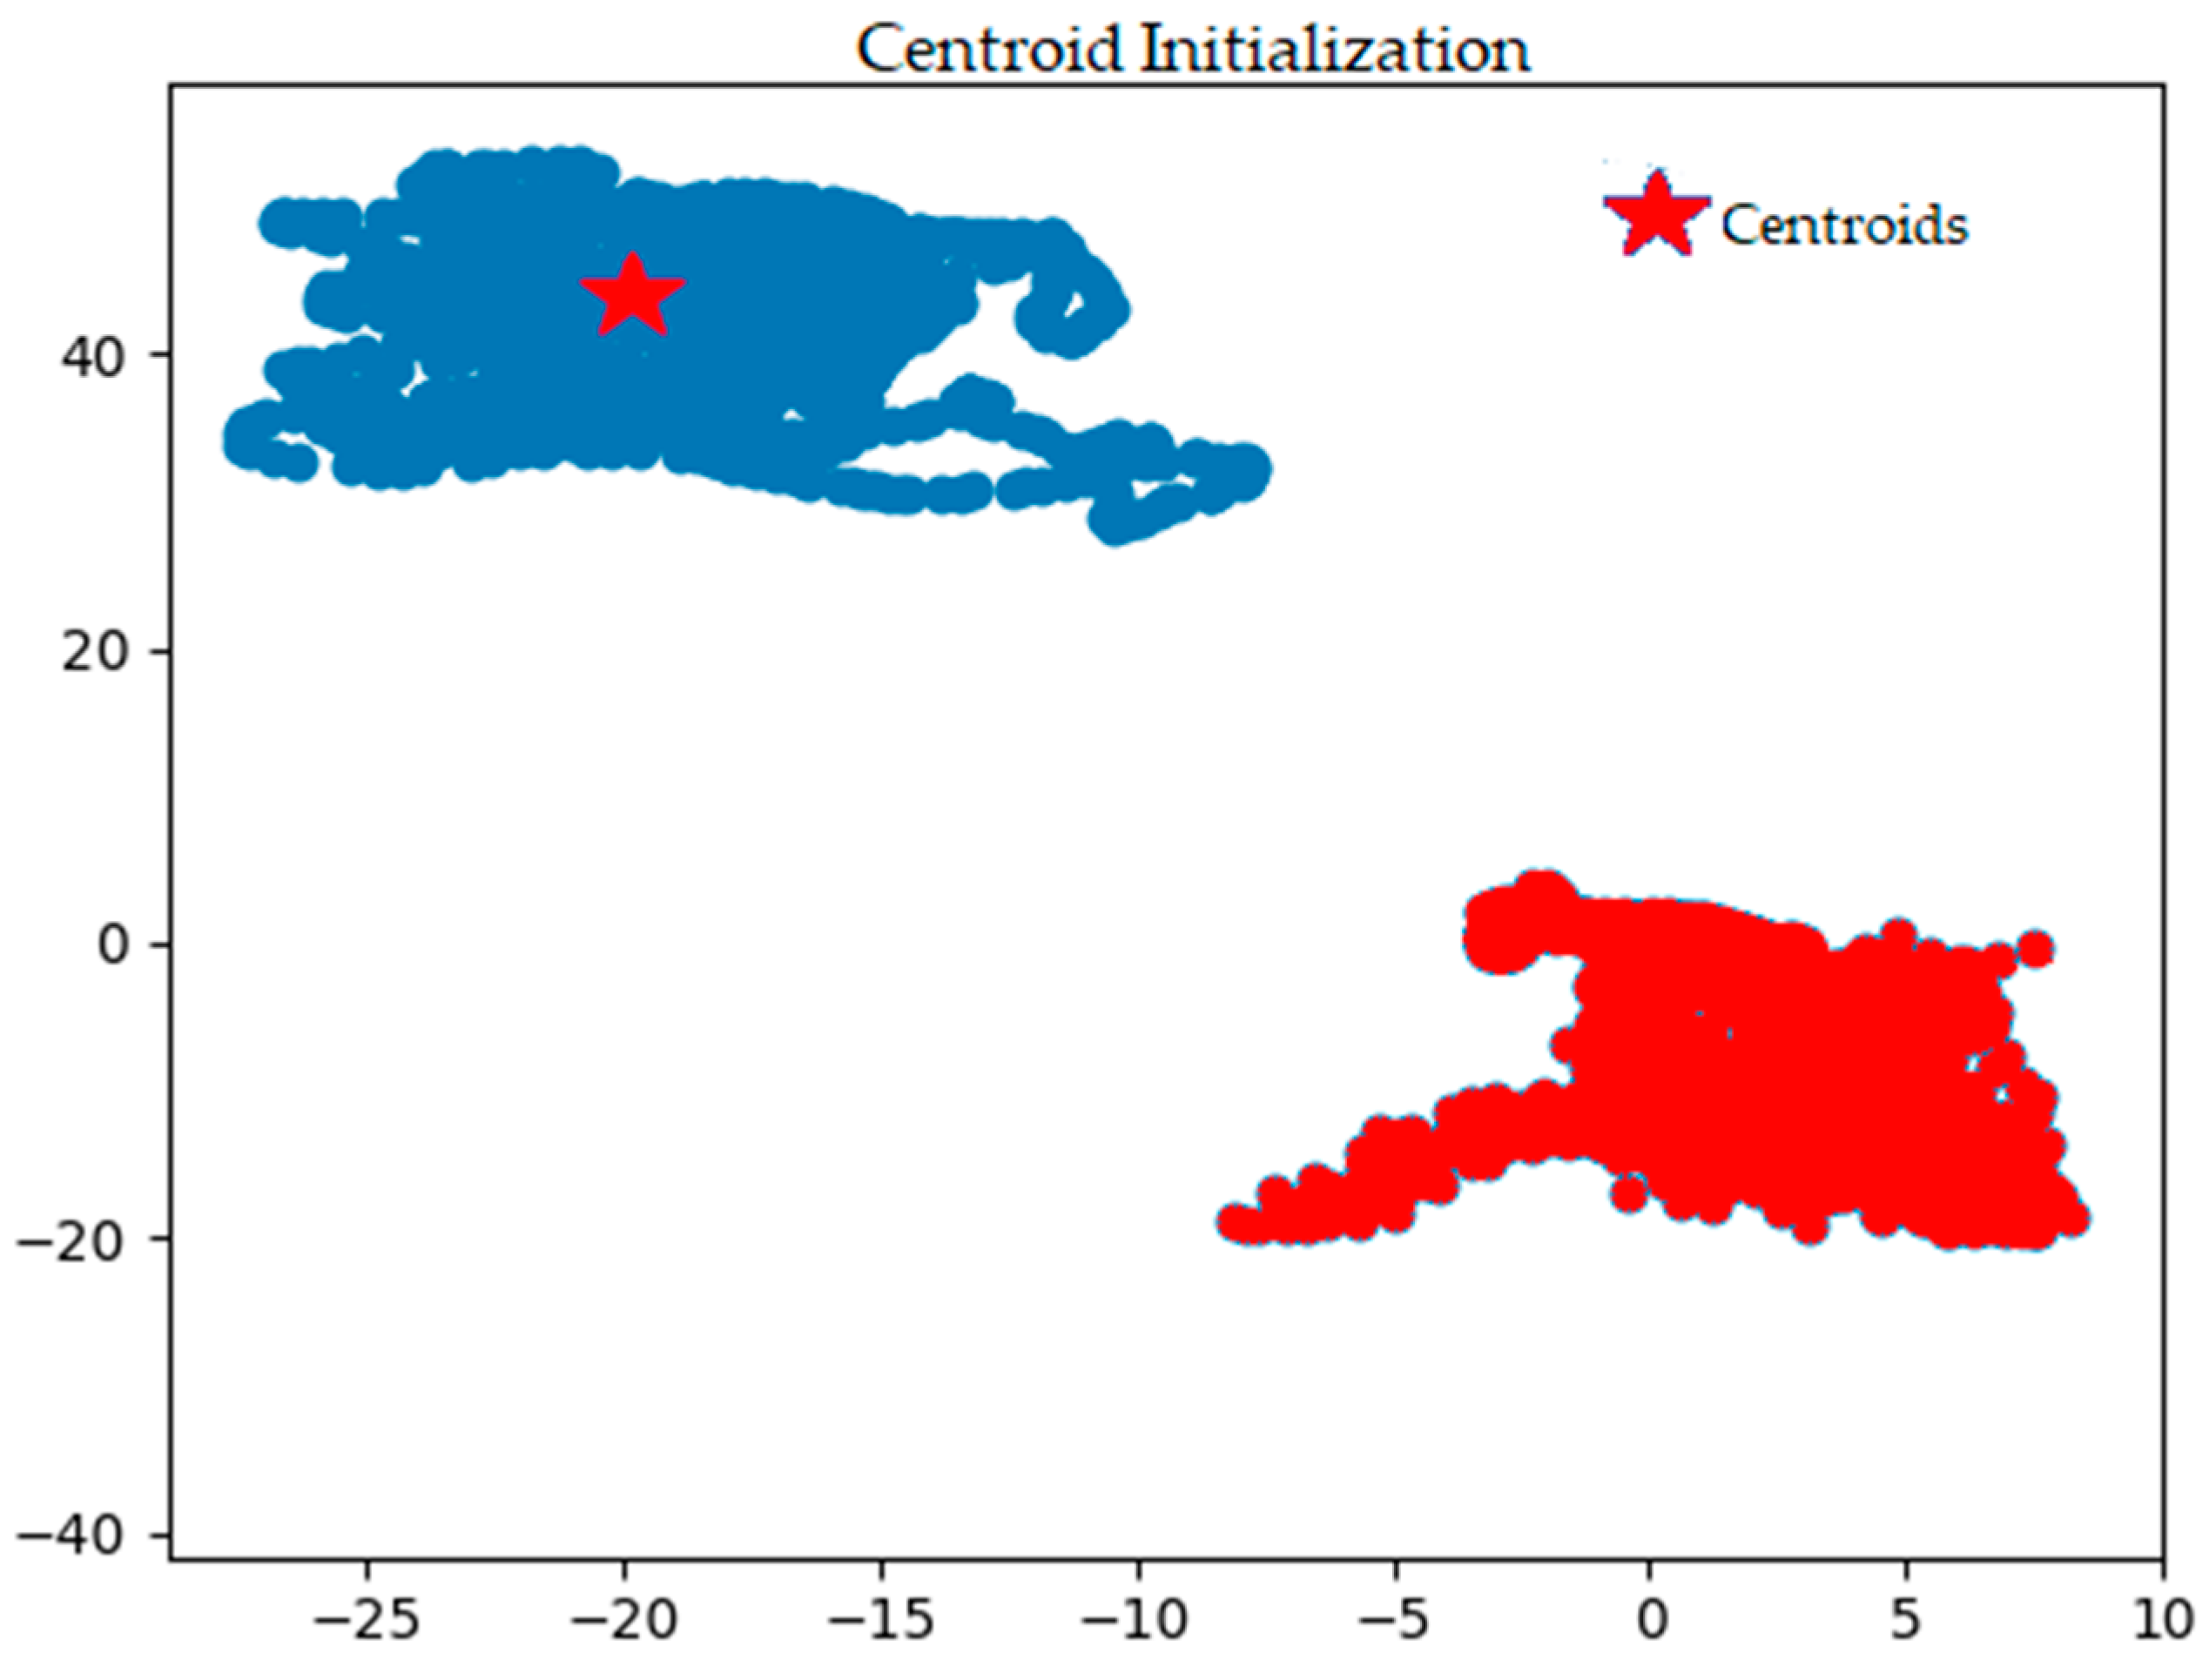
 ) in Figure 3 to its new position in Figure 4. The different color shades and shapes of clusters seen in Figure 3 and Figure 4 show the iteration process where new members are added to each cluster before the actual convergence, which is shown in Figure 4.
- True Positive (TP) = Correctly annotated observations containing GPS data as ‘1’ (sensitive class)
- True Negative (TN) = Correctly annotated observations without GPS data as ‘0’ (non-sensitive class)
- False Positive (FP) = Incorrectly annotated observations without GPS data as ‘1’ (i.e., wrongly classified into sensitive class)
- False Negative (FN) = Incorrectly annotated observations containing GPS data as ‘0’ (i.e., wrongly classified into non-sensitive class)
5. Discussion
6. Conclusions
Author Contributions
Funding
Acknowledgments
Conflicts of Interest
References
- Capponi, A.; Fiandrino, C.; Kliazovich, D.; Bouvry, P.; Giordano, S. A cost-effective distributed framework for data collection in cloud-based mobile crowd sensing architectures. IEEE Trans. Sustain. Comput. 2017, 2, 3–16. [Google Scholar] [CrossRef]
- Ganti, R.K.; Ye, F.; Lei, H. Mobile crowdsensing: Current state and future challenges. IEEE Commun. Mag. 2011, 49, 32–39. [Google Scholar] [CrossRef]
- Cardone, G.; Foschini, L.; Bellavista, P.; Corradi, A.; Borcea, C.; Talasila, M.; Curtmola, R. Fostering ParticipAction in Smart Cities: A Geo-Social Crowdsensing Platform. IEEE Commun. Mag. 2013, 48, 32–39. [Google Scholar] [CrossRef]
- Khan, W.Z.; Xiang, Y.; Aalsalem, M.Y.; Arshad, Q. Mobile Phone Sensing Systems: A Survey. IEEE Commun. Surv. Tutor. 2013, 15, 402–427. [Google Scholar] [CrossRef]
- Cardone, G.; Cirri, A.; Corradi, A.; Foschini, L. The participact mobile crowd sensing living lab: The testbed for smart cities. IEEE Commun. Mag. 2014, 52, 78–85. [Google Scholar] [CrossRef]
- Zhang, Y.; Qiu, M.; Tsai, C.; Hassan, M.; Alamri, A. Health-CPS: Healthcare Cyber-Physical System Assisted by Cloud and Big Data. IEEE Syst. J. 2017, 17, 88–95. [Google Scholar] [CrossRef]
- Fox, E.B.; Hughes, M.C.; Sudderth, E.B.; Jordan, M.I. Joint modeling of multiple time series via the beta process with application to motion capture segmentation. Ann. Appl. Stat. 2014, 8, 1281–1313. [Google Scholar] [CrossRef]
- Lane, N.D.; Lin, M.; Mohammod, M.; Yang, X.; Lu, H.; Cardone, G.; Ali, S.; Doryab, A.; Berke, E.; Campbell, A.T. Bewell: Sensing sleep, physical activities and social interactions to promote wellbeing. Mob. Netw. Appl. 2014, 19, 345–359. [Google Scholar] [CrossRef]
- Lane, N.D.; Chon, Y.; Zhou, L.; Zhang, Y.; Li, F.; Kim, D.; Ding, G.; Zhao, F.; Cha, H. Piggyback CrowdSensing (PCS): Energy efficient crowdsourcing of mobile sensor data by exploiting smartphone app opportunities. In Proceedings of the 11th ACM Conference on Embedded Networked Sensor Systems, Rome, Italy, 11–15 November 2013; p. 7. [Google Scholar]
- Martindale, C.F.; Hoenig, F.; Strohrmann, C.; Eskofier, B.M. Smart Annotation of Cyclic Data Using Hierarchical Hidden Markov Models. Sensors 2017, 17, 2328. [Google Scholar] [CrossRef] [PubMed]
- Szewcyzk, S.; Dwan, K.; Minor, B.; Swedlove, B.; Cook, D. Annotating smart environment sensor data for activity learning. Technol. Health Care 2009, 17, 161–169. [Google Scholar] [PubMed]
- Stikic, M.; Larlus, D.; Ebert, S.; Schiele, B. Weakly supervised recognition of daily life activities with wearable sensors. IEEE Trans. Pattern Anal. Mach. Intell. 2011, 33, 2521–2537. [Google Scholar] [CrossRef] [PubMed]
- Huynh, T.; Fritz, M.; Schiele, B. Discovery of activity patterns using topic models. In Proceedings of the 10th International Conference on Ubiquitous Computing, Seoul, Korea, 21–24 September 2008; pp. 10–19. [Google Scholar]
- Bhattacharya, S.; Nurmi, P.; Hammerla, N.; Plötz, T. Using unlabeled data in a sparse-coding framework for human activity recognition. Pervas. Mob. Comput. 2014, 15, 242–262. [Google Scholar] [CrossRef]
- Maekawa, T.; Watanabe, S. Unsupervised activity recognition with user’s physical characteristics data. In Proceedings of the 15th Annual International Symposium on Wearable Computers (ISWC), San Francisco, CA, USA, 12–15 June 2011; pp. 89–96. [Google Scholar]
- Riboni, D.; Sztyler, T.; Civitarese, G.; Stuckenschmidt, H. Unsupervised recognition of interleaved activities of daily living through ontological and probabilistic reasoning. In Proceedings of the 2016 ACM International Joint Conference on Pervasive and Ubiquitous Computing, Heidelberg, Germany, 12–16 September 2016; pp. 1–12. [Google Scholar]
- Kapadia, A.; Kotz, D.; Triandopoulos, N. Opportunistic sensing: Security challenges for the new paradigm. In Proceedings of the Communication Systems and Networks and Workshops, Bangalore, India, 5–10 January 2009; pp. 1–10. [Google Scholar]
- Rawassizadeh, R.; Momeni, E.; Dobbins, C.; Gharibshah, J.; Pazzani, M. Scalable daily human behavioral pattern mining from multivariate temporal data. IEEE Trans. Knowl. Data Eng. 2016, 28, 3098–3112. [Google Scholar] [CrossRef]
- Miluzzo, E.; Lane, N.D.; Fodor, K.; Peterson, R.; Lu, H.; Musolesi, M.; Eisenman, S.B.; Zheng, X.; Campbell, A.T. Sensing meets mobile social networks: The design, implementation and evaluation of the cenceme application. In Proceedings of the 6th ACM Conference on Embedded Network Sensor Systems, Raleigh, NC, USA, 4–7 November 2008; pp. 337–350. [Google Scholar]
- Bulling, A.; Blanke, U.; Schiele, B. A tutorial on human activity recognition using body-worn inertial sensors. ACM Comput. Surv. 2014, 46, 33. [Google Scholar] [CrossRef]
- Radu, V.; Lane, N.D.; Bhattacharya, S.; Mascolo, C.; Marina, M.K.; Kawsar, F. Towards multimodal deep learning for activity recognition on mobile devices. In Proceedings of the 2016 ACM International Joint Conference on Pervasive and Ubiquitous Computing: Adjunct, Heidelberg, Germany, 12–16 September 2016; pp. 185–188. [Google Scholar]
- Hammerla, N.Y.; Halloran, S.; Ploetz, T. Deep, convolutional, and recurrent models for human activity recognition using wearables. arXiv, 2016; arXiv:1604.08880. [Google Scholar]
- Ronao, C.A.; Cho, S.-B. Human activity recognition with smartphone sensors using deep learning neural networks. Expert Syst. Appl. 2016, 59, 235–244. [Google Scholar] [CrossRef]
- Ordóñez, F.J.; Roggen, D. Deep convolutional and lstm recurrent neural networks for multimodal wearable activity recognition. Sensors 2016, 16, 115. [Google Scholar] [CrossRef] [PubMed]
- Liu, S.; Gao, R.X.; John, D.; Staudenmayer, J.W.; Freedson, P.S. Multisensor data fusion for physical activity assessment. IEEE Trans. Biomed. Eng. 2012, 59, 687–696. [Google Scholar] [PubMed]
- Calatroni, A.; Roggen, D.; Tröster, G. Collection and curation of a large reference dataset for activity recognition. In Proceedings of the 2011 IEEE International Conference on Systems, Man, and Cybernetics (SMC), Anchorage, AK, USA, 9–12 October 2011; pp. 30–35. [Google Scholar]
- Liu, R.; Chen, T.; Huang, L. Research on human activity recognition based on active learning. In Proceedings of the 2010 International Conference on Machine Learning and Cybernetics (ICMLC), Qingdao, China, 11–14 July 2010; pp. 285–290. [Google Scholar]
- Miu, T.; Missier, P.; Plötz, T. Bootstrapping personalised human activity recognition models using online active learning. In Proceedings of the 2015 IEEE International Conference on Computer and Information Technology, Liverpool, UK, 26–28 October 2015; pp. 1138–1147. [Google Scholar]
- Yao, L.; Nie, F.; Sheng, Q.Z.; Gu, T.; Li, X.; Wang, S. Learning from less for better: Semi-supervised activity recognition via shared structure discovery. In Proceedings of the 2016 ACM International Joint Conference on Pervasive and Ubiquitous Computing, Heidelberg, Germany, 12–16 September 2016; pp. 13–24. [Google Scholar]
- Hong, J.-H.; Ramos, J.; Dey, A.K. Toward personalized activity recognition systems with a semipopulation approach. IEEE Trans. Hum. Mach. Syst. 2016, 46, 101–112. [Google Scholar] [CrossRef]
- Guan, X.; Raich, R.; Wong, W.-K. Efficient multi-instance learning for activity recognition from time series data using an auto-regressive hidden Markov model. In Proceedings of the International Conference on Machine Learning, New York, NY, USA, 20–22 June 2016; pp. 2330–2339. [Google Scholar]
- Nath, S. ACE: Exploiting correlation for energy-efficient and continuous context sensing. In Proceedings of the 10th International Conference on Mobile Systems, Applications, and Services, Lake District, UK, 25–29 June 2012; pp. 29–42. [Google Scholar]
- Srinivasan, V.; Moghaddam, S.; Mukherji, A.; Rachuri, K.K.; Xu, C.; Tapia, E.M. Mobileminer: Mining your frequent patterns on your phone. In Proceedings of the 2014 ACM International Joint Conference on Pervasive and Ubiquitous Computing, Seattle, WA, USA, 13–17 September 2014; pp. 389–400. [Google Scholar]
- Kiukkonen, N.; Blom, J.; Dousse, O.; Gatica-Perez, D.; Laurila, J. Towards rich mobile phone datasets: Lausanne data collection campaign. In Proceedings of the ACM International Conference on Pervasive Services (ICPS 2010), Berlin, Germany, 13–16 July 2010; pp. 1–7. [Google Scholar]
- Fiandrino, C.; Capponi, A.; Cacciatore, G.; Kliazovich, D.; Sorger, U.; Bouvry, P.; Kantarci, B.; Granelli, F.; Giordano, S. Crowdsensim: A simulation platform for mobile crowdsensing in realistic urban environments. IEEE Access 2017, 5, 3490–3503. [Google Scholar] [CrossRef]
- Alsheikh, M.A.; Lin, S.; Niyato, D.; Tan, H.-P. Machine learning in wireless sensor networks: Algorithms, strategies, and applications. IEEE Commun. Surv. Tutor. 2014, 16, 1996–2018. [Google Scholar] [CrossRef]
- Palma, A.T.; Bogorny, V.; Kuijpers, B.; Alvares, L.O. A clustering-based approach for discovering interesting places in trajectories. In Proceedings of the 2008 ACM Symposium on Applied Computing, Fortaleza, Ceara, Brazil, 16–20 March 2008; pp. 863–868. [Google Scholar]
- Zheng, Y.; Li, Q.; Chen, Y.; Xie, X.; Ma, W.-Y. Understanding mobility based on GPS data. In Proceedings of the 10th International Conference on Ubiquitous Computing, Seoul, Korea, 21–24 September 2008; pp. 312–321. [Google Scholar]
- Li, Y.; Zhang, X.; Li, X.; Zhang, Y.; Yang, J.; He, Q. Mobile Phone Clustering From Speech Recordings Using Deep Representation and Spectral Clustering. IEEE Trans. Inf. Forensics Secur. 2018, 13, 965–977. [Google Scholar] [CrossRef]
- Guo, G.; Chen, L.; Ye, Y.; Jiang, Q. Cluster validation method for determining the number of clusters in categorical sequences. IEEE Trans. Neural Netw. Learn. Syst. 2017, 28, 2936–2948. [Google Scholar] [CrossRef] [PubMed]
- Khanmohammadi, S.; Adibeig, N.; Shanehbandy, S. An improved overlapping k-means clustering method for medical applications. Expert Syst. Appl. 2017, 67, 12–18. [Google Scholar] [CrossRef]
- Jain, A.K. Data clustering: 50 years beyond K-means. Pattern Recognit. Lett. 2010, 31, 651–666. [Google Scholar] [CrossRef]
- Yu, H.; Liu, Z.; Wang, G. An automatic method to determine the number of clusters using decision-theoretic rough set. Int. J. Approx. Reason. 2014, 55, 101–115. [Google Scholar] [CrossRef]
- Cui, H.; Zhang, K.; Fang, Y.; Sobolevsky, S.; Ratti, C.; Horn, B.K. A Clustering Validity Index Based on Pairing Frequency. IEEE Access 2017, 5, 24884–24894. [Google Scholar] [CrossRef]
- Freedman, R. Smartphone recorded driving sensor data. In Indianapolis International Airport to Urbana, IL; University of Illinois at Urbana-Champaign: Champaign, IL, USA, 2017. [Google Scholar]
- Yan, Z.; Chakraborty, D.; Parent, C.; Spaccapietra, S.; Aberer, K. SeMiTri: A framework for semantic annotation of heterogeneous trajectories. In Proceedings of the 14th International Conference on Extending Database Technology, Uppsala, Sweden, 21–24 March 2011; pp. 259–270. [Google Scholar]


| Symbol | Definition |
|---|---|
| D | Data |
| n | Total number of samples |
| K | Total number of clusters |
| S | Observations |
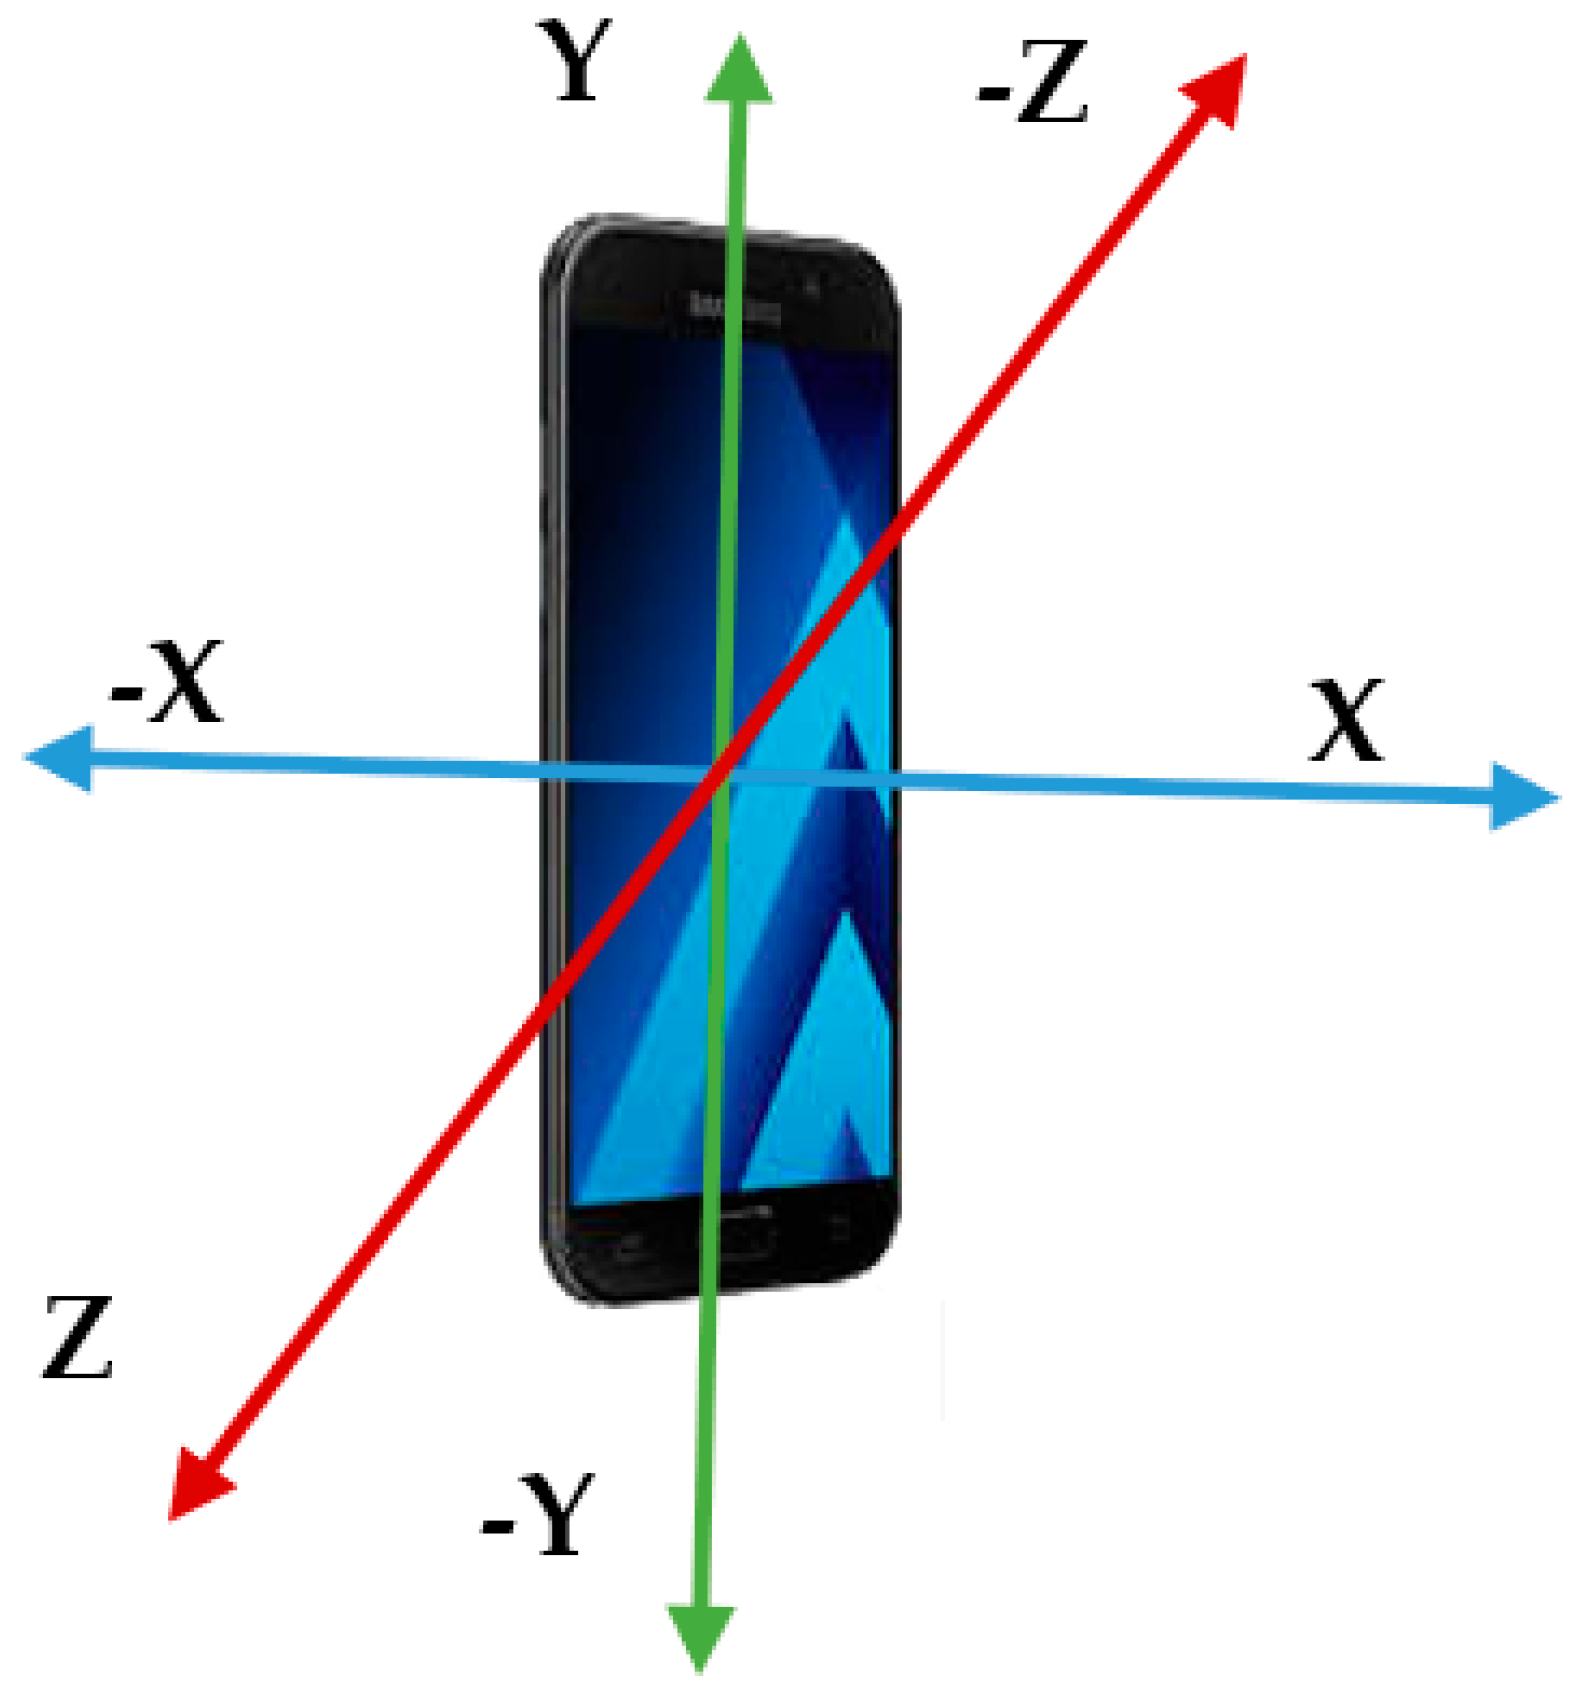
| F | Features (X, Y, Z, L, V) |
| |X| | Absolute value of X |
| |Y| | Absolute value of Y |
| |Z| | Absolute value of Z |
| |L| | Absolute value of L |
| |V| | Absolute value of V |
| Dot Operator |
| Algorithm to validate k-means clusters |
| Input: The dataset is the total number of instances; the number of clusters. |
| 1. Choose the number of clusters 2. Randomize the initialization of clusters 3. Assign each data point to the closest centroid 4. Update centroid position to the average of all assigned data points to the centroid 5. Repeat 3 6. Initialize X, Y, Z, L, V for validation |
| 7. For , set as 0 |
| 8. Else if |
| 9. set as 1 |
| 10. End if |
| Output: The validated clusters of unlabeled datasets from multiple smartphone sensors |
| SVM Classifier | KNN Classifier | NB Classifier | ||||||
|---|---|---|---|---|---|---|---|---|
| N = 2000 | Predicted Class 0 (Non-sensitive) | Predicted Class 1 (Sensitive) | N = 2000 | Predicted Class 0 (Non-sensitive) | Predicted Class 1 (Sensitive) | N = 2000 | Predicted Class 0 (Non-sensitive) | Predicted Class 1 (Sensitive) |
| Actual Class 0 (Non-sensitive) | TN = 1008 | FN = 6 | Actual Class 0 (Non-sensitive) | TN = 1005 | FN = 9 | Actual Class 0 (Non-sensitive) | TN = 909 | FN = 105 |
| Actual Class 1 (Sensitive) | FP = 10 | TP = 976 | Actual Class 1 (Sensitive) | FP = 13 | TP = 973 | Actual Class 1 (Sensitive) | FP = 21 | TP = 965 |
| Classifiers | Accuracy | Prediction Mean | Precision | Recall | False Positive Rate (FPR) | Misclassification Rate | |
|---|---|---|---|---|---|---|---|
| 0 s | 1 s | ||||||
| SVM | 99.3% | 0.5125 | 0.4875 | 0.9948 | 0.9848 | 0.0050 | 0.0056 |
| KNN | 98% | 0.5070 | 0.4930 | 0.9790 | 0.9700 | 0.0090 | 0.0150 |
| NB | 94% | 0.5070 | 0.4930 | 0.9430 | 0.9019 | 0.1034 | 0.0535 |
© 2018 by the authors. Licensee MDPI, Basel, Switzerland. This article is an open access article distributed under the terms and conditions of the Creative Commons Attribution (CC BY) license (http://creativecommons.org/licenses/by/4.0/).
Share and Cite
Pius Owoh, N.; Mahinderjit Singh, M.; Zaaba, Z.F. Automatic Annotation of Unlabeled Data from Smartphone-Based Motion and Location Sensors. Sensors 2018, 18, 2134. https://doi.org/10.3390/s18072134
Pius Owoh N, Mahinderjit Singh M, Zaaba ZF. Automatic Annotation of Unlabeled Data from Smartphone-Based Motion and Location Sensors. Sensors. 2018; 18(7):2134. https://doi.org/10.3390/s18072134
Chicago/Turabian StylePius Owoh, Nsikak, Manmeet Mahinderjit Singh, and Zarul Fitri Zaaba. 2018. "Automatic Annotation of Unlabeled Data from Smartphone-Based Motion and Location Sensors" Sensors 18, no. 7: 2134. https://doi.org/10.3390/s18072134
APA StylePius Owoh, N., Mahinderjit Singh, M., & Zaaba, Z. F. (2018). Automatic Annotation of Unlabeled Data from Smartphone-Based Motion and Location Sensors. Sensors, 18(7), 2134. https://doi.org/10.3390/s18072134