Optical-Spectrometry-Based Method for Immunosuppressant Medicine Level Detection in Aqueous Solutions

 , , , ,
Abstract
:
1. Introduction
2. Materials and Methods
2.1. Materials
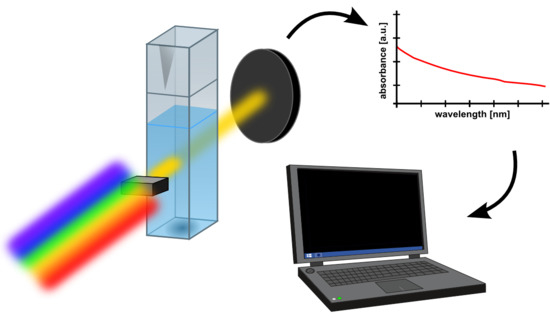
2.2. Methods
3. Results
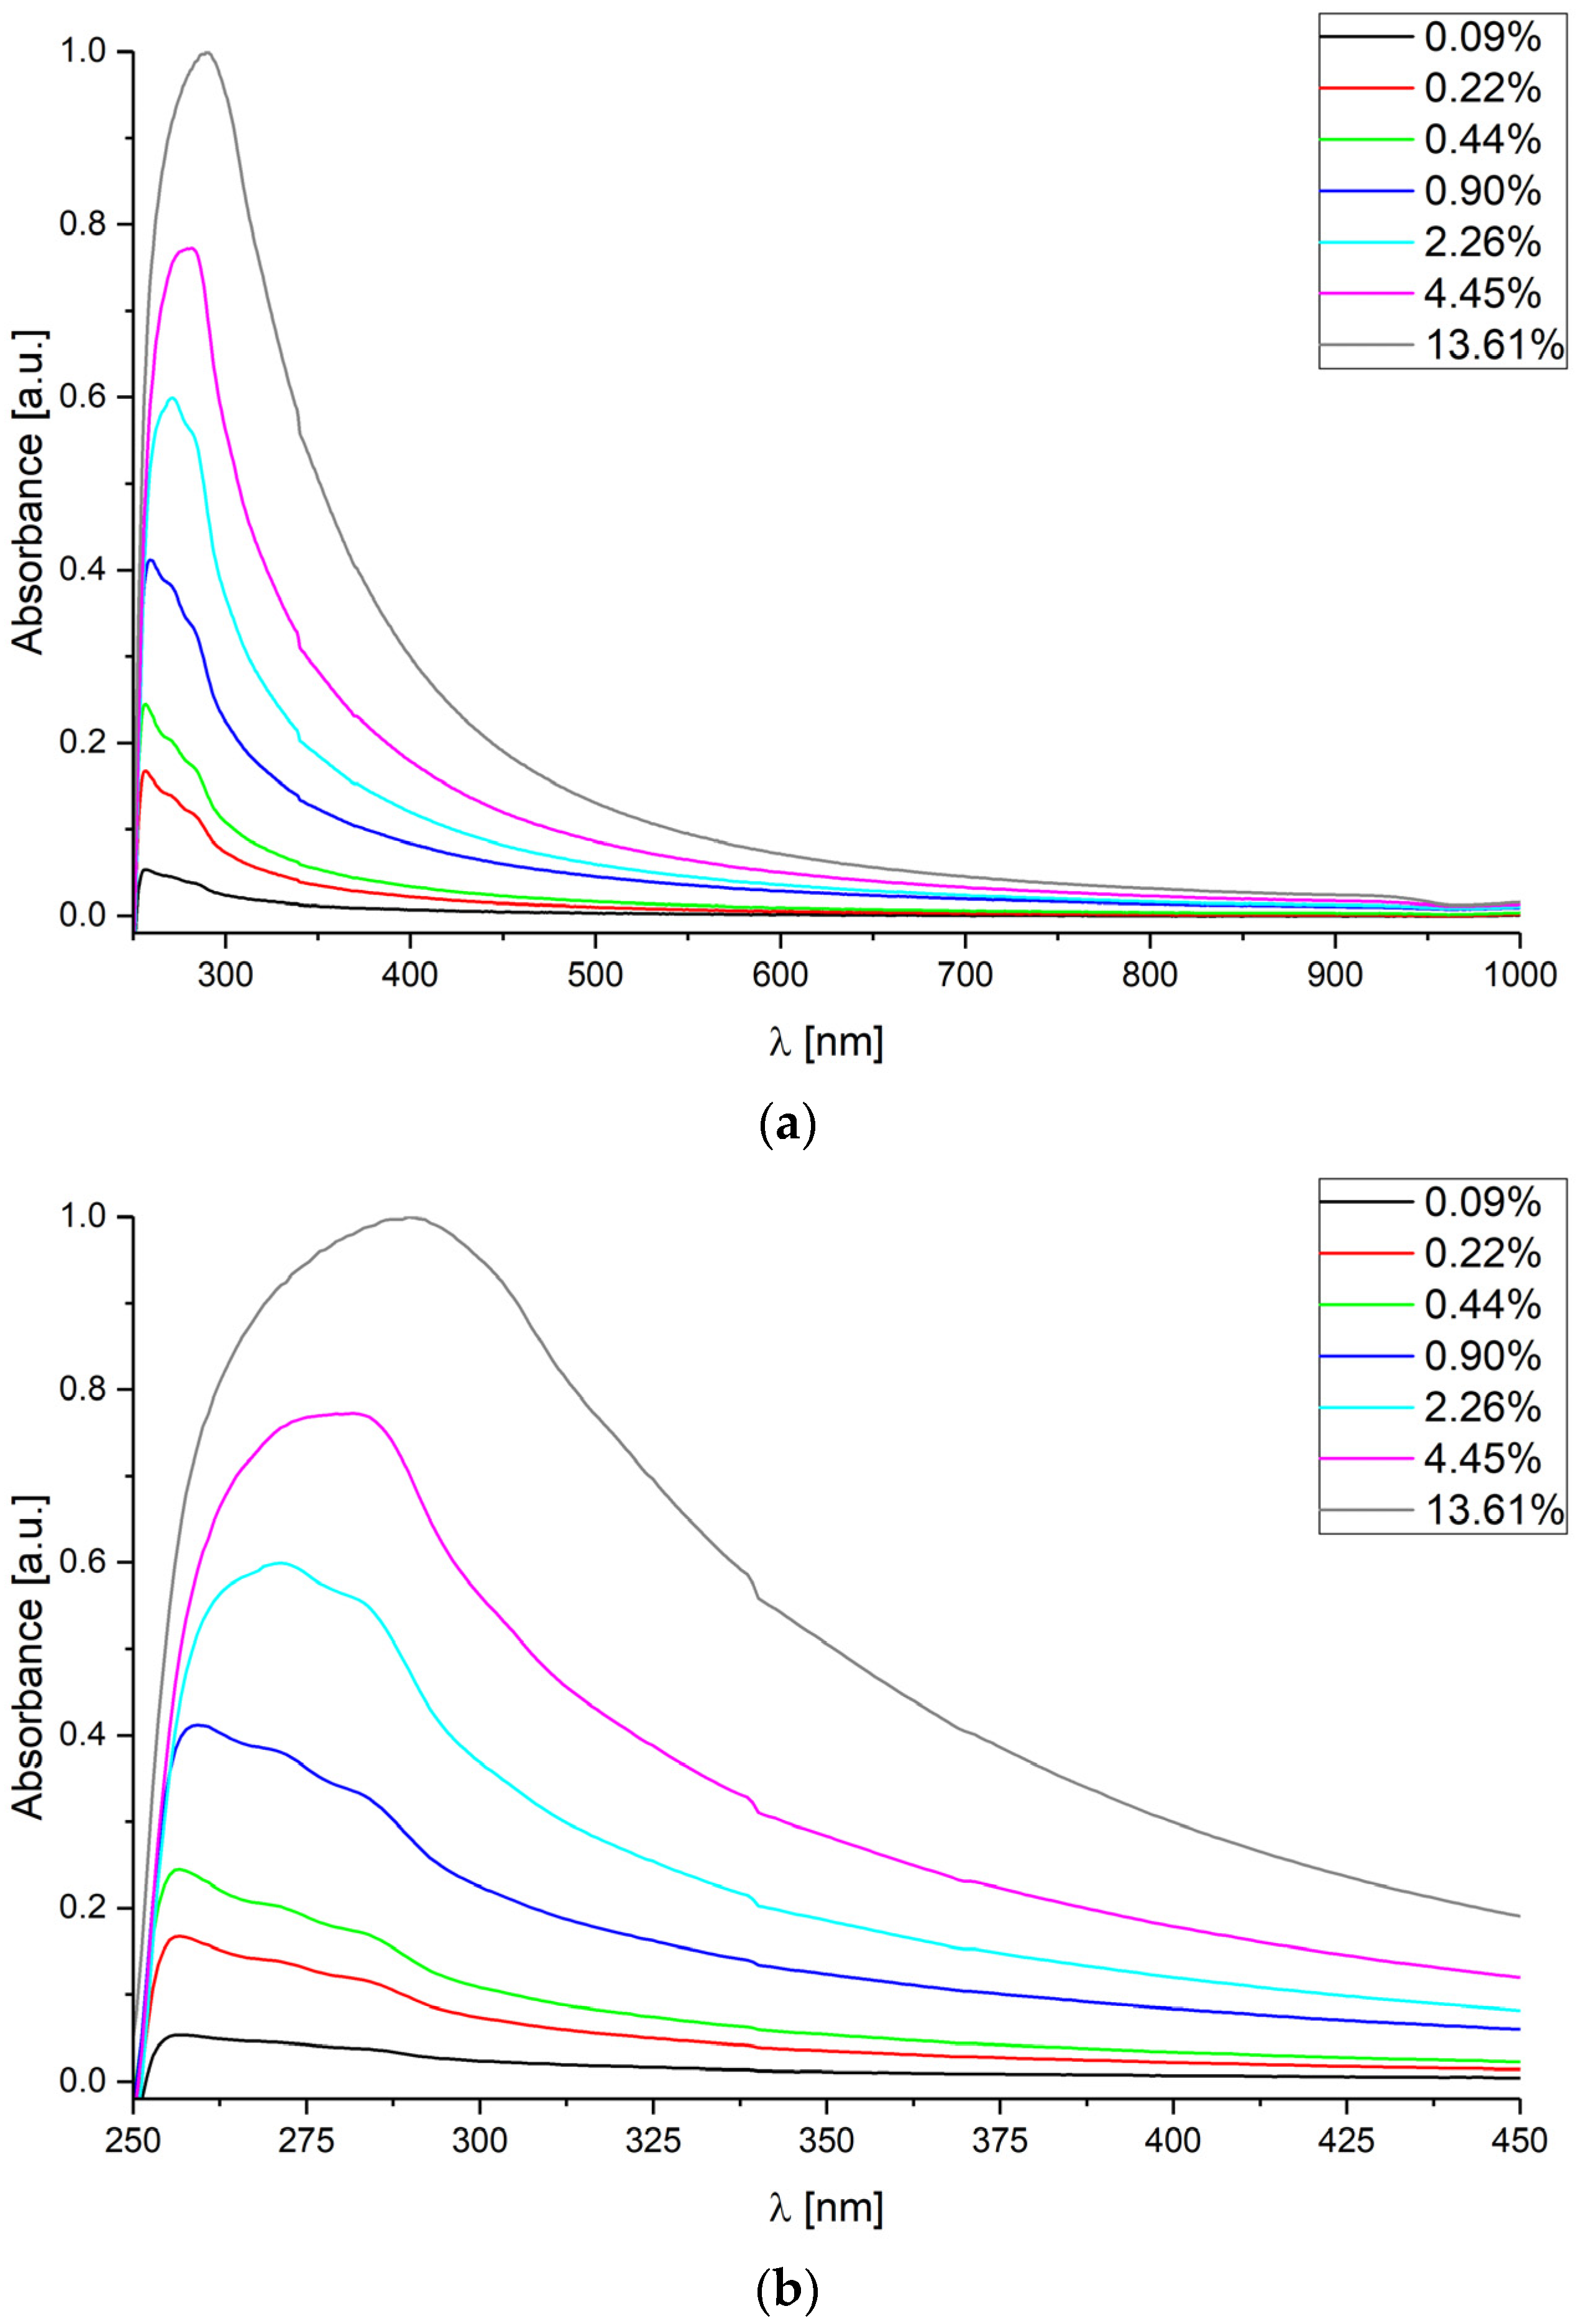
3.1. Aqueous CsA Solutions
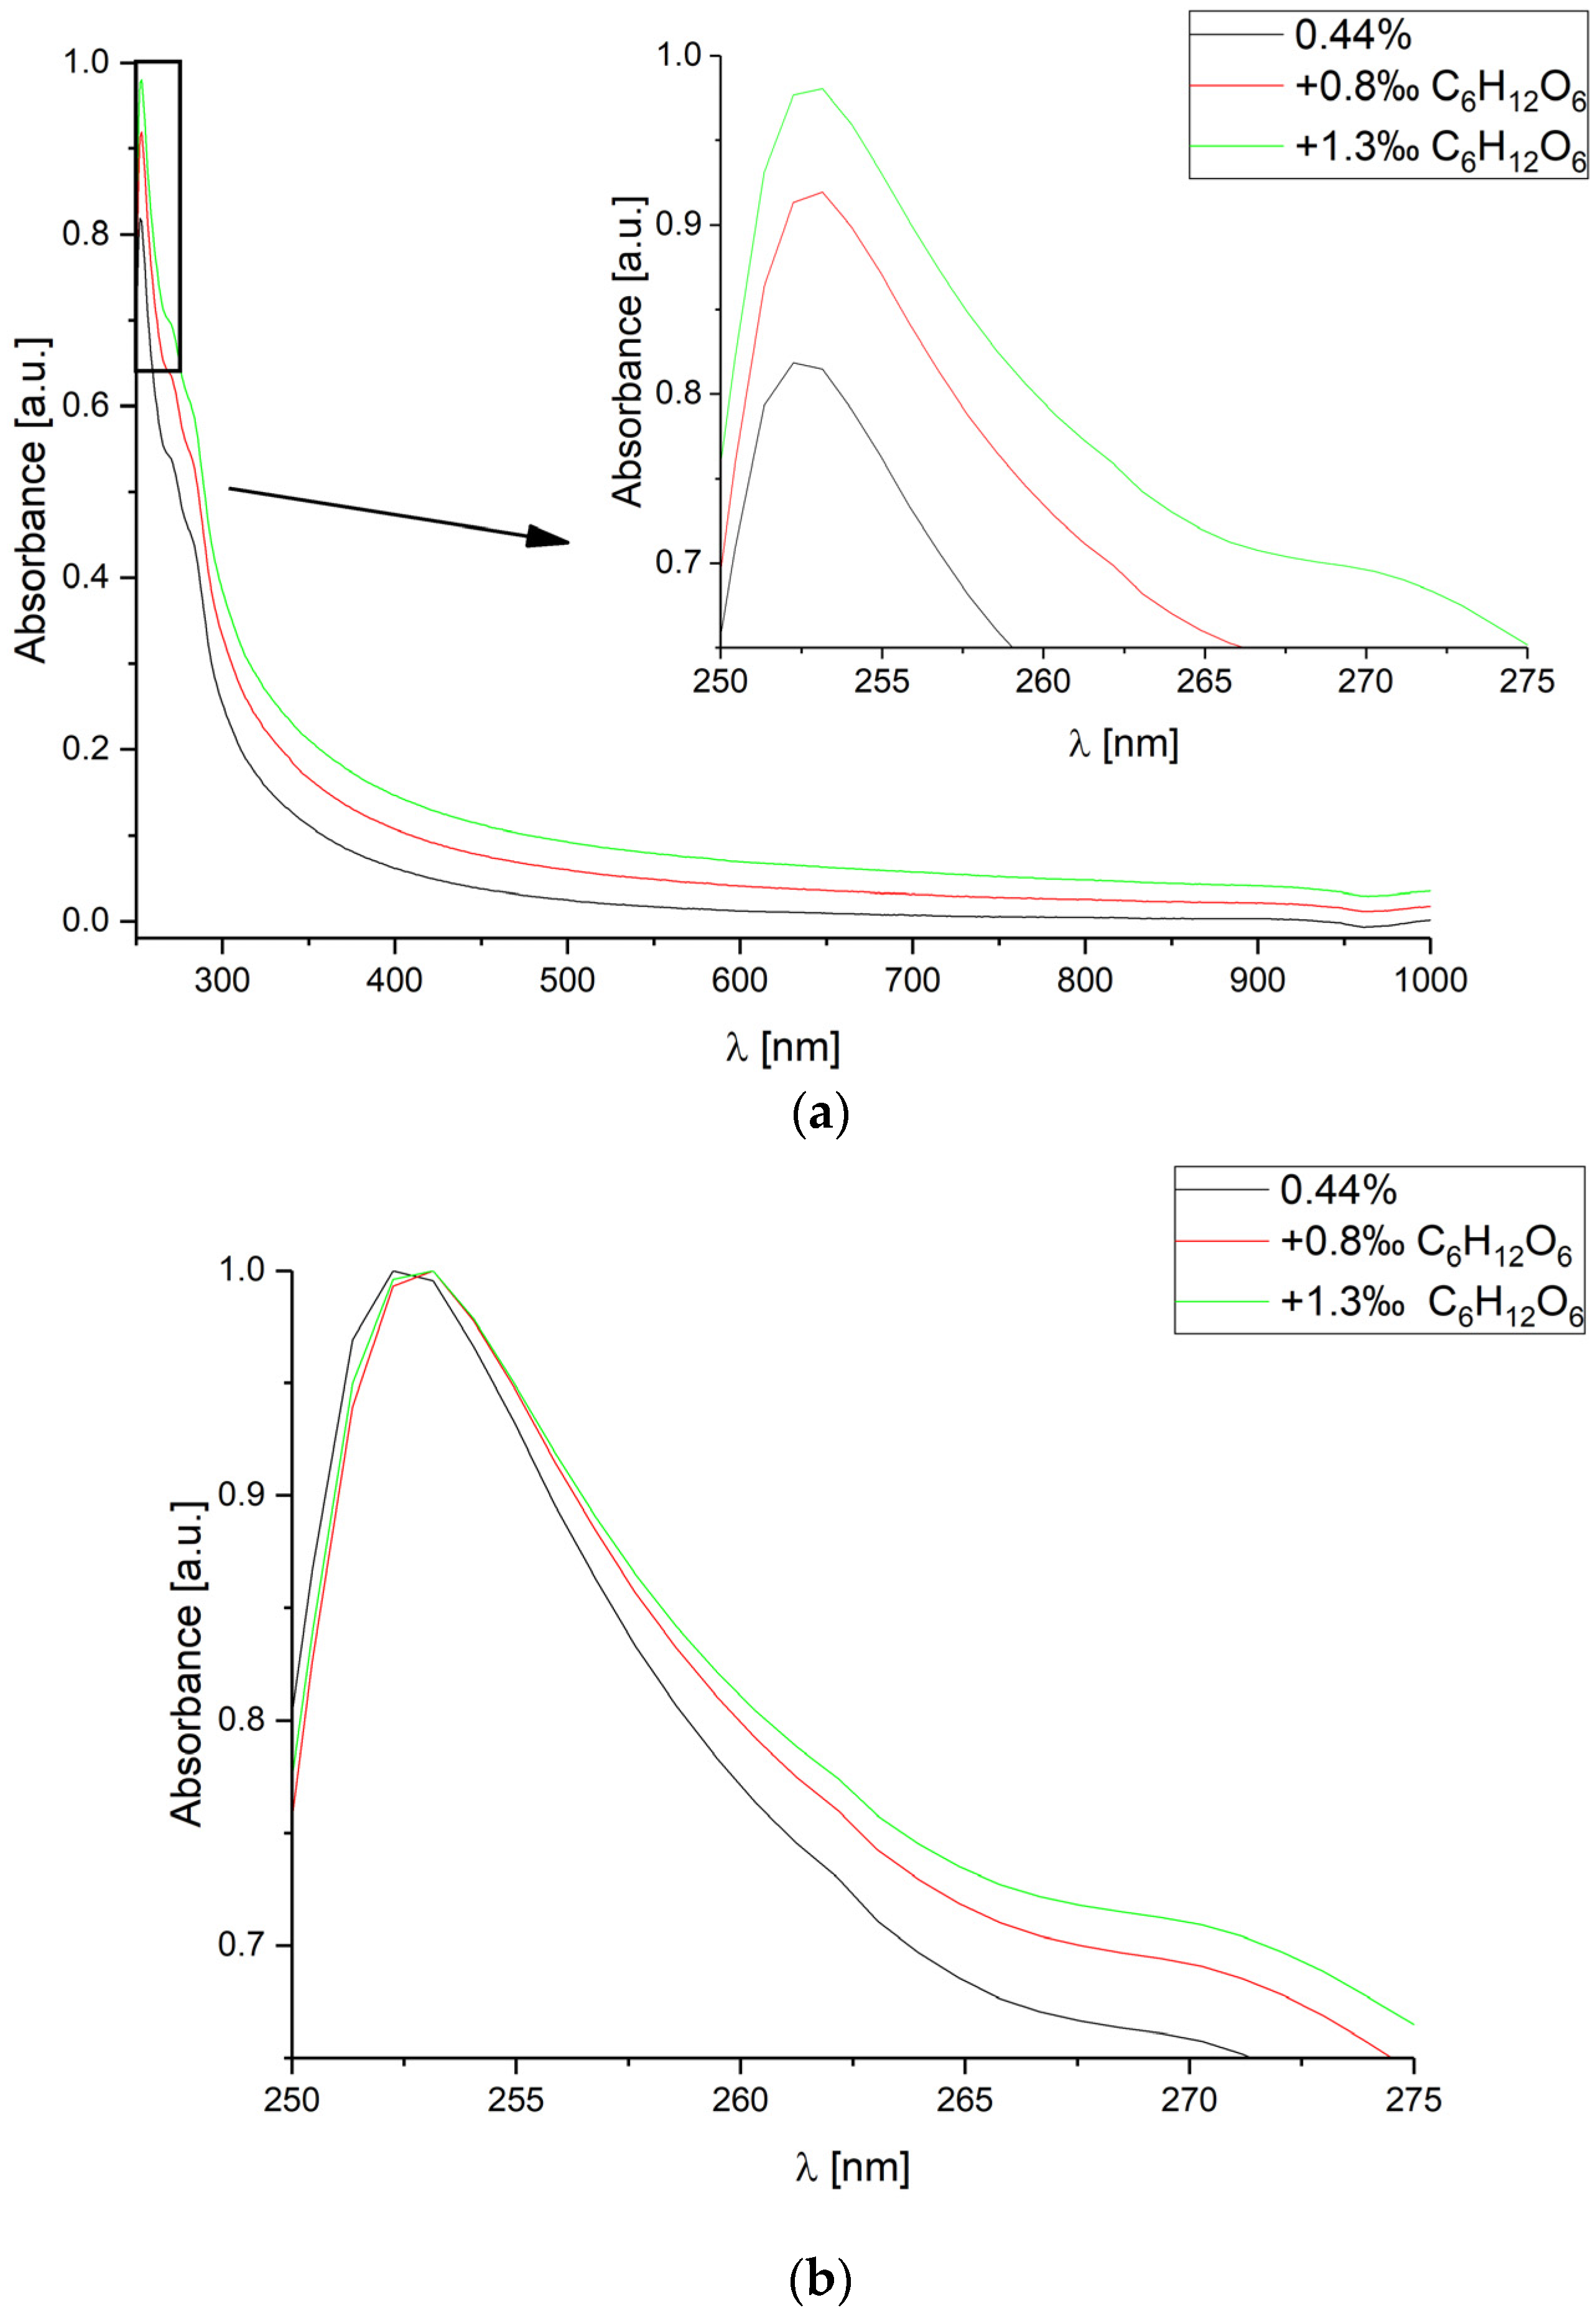
3.2. Selectivity of the Proposed Method
4. Discussion
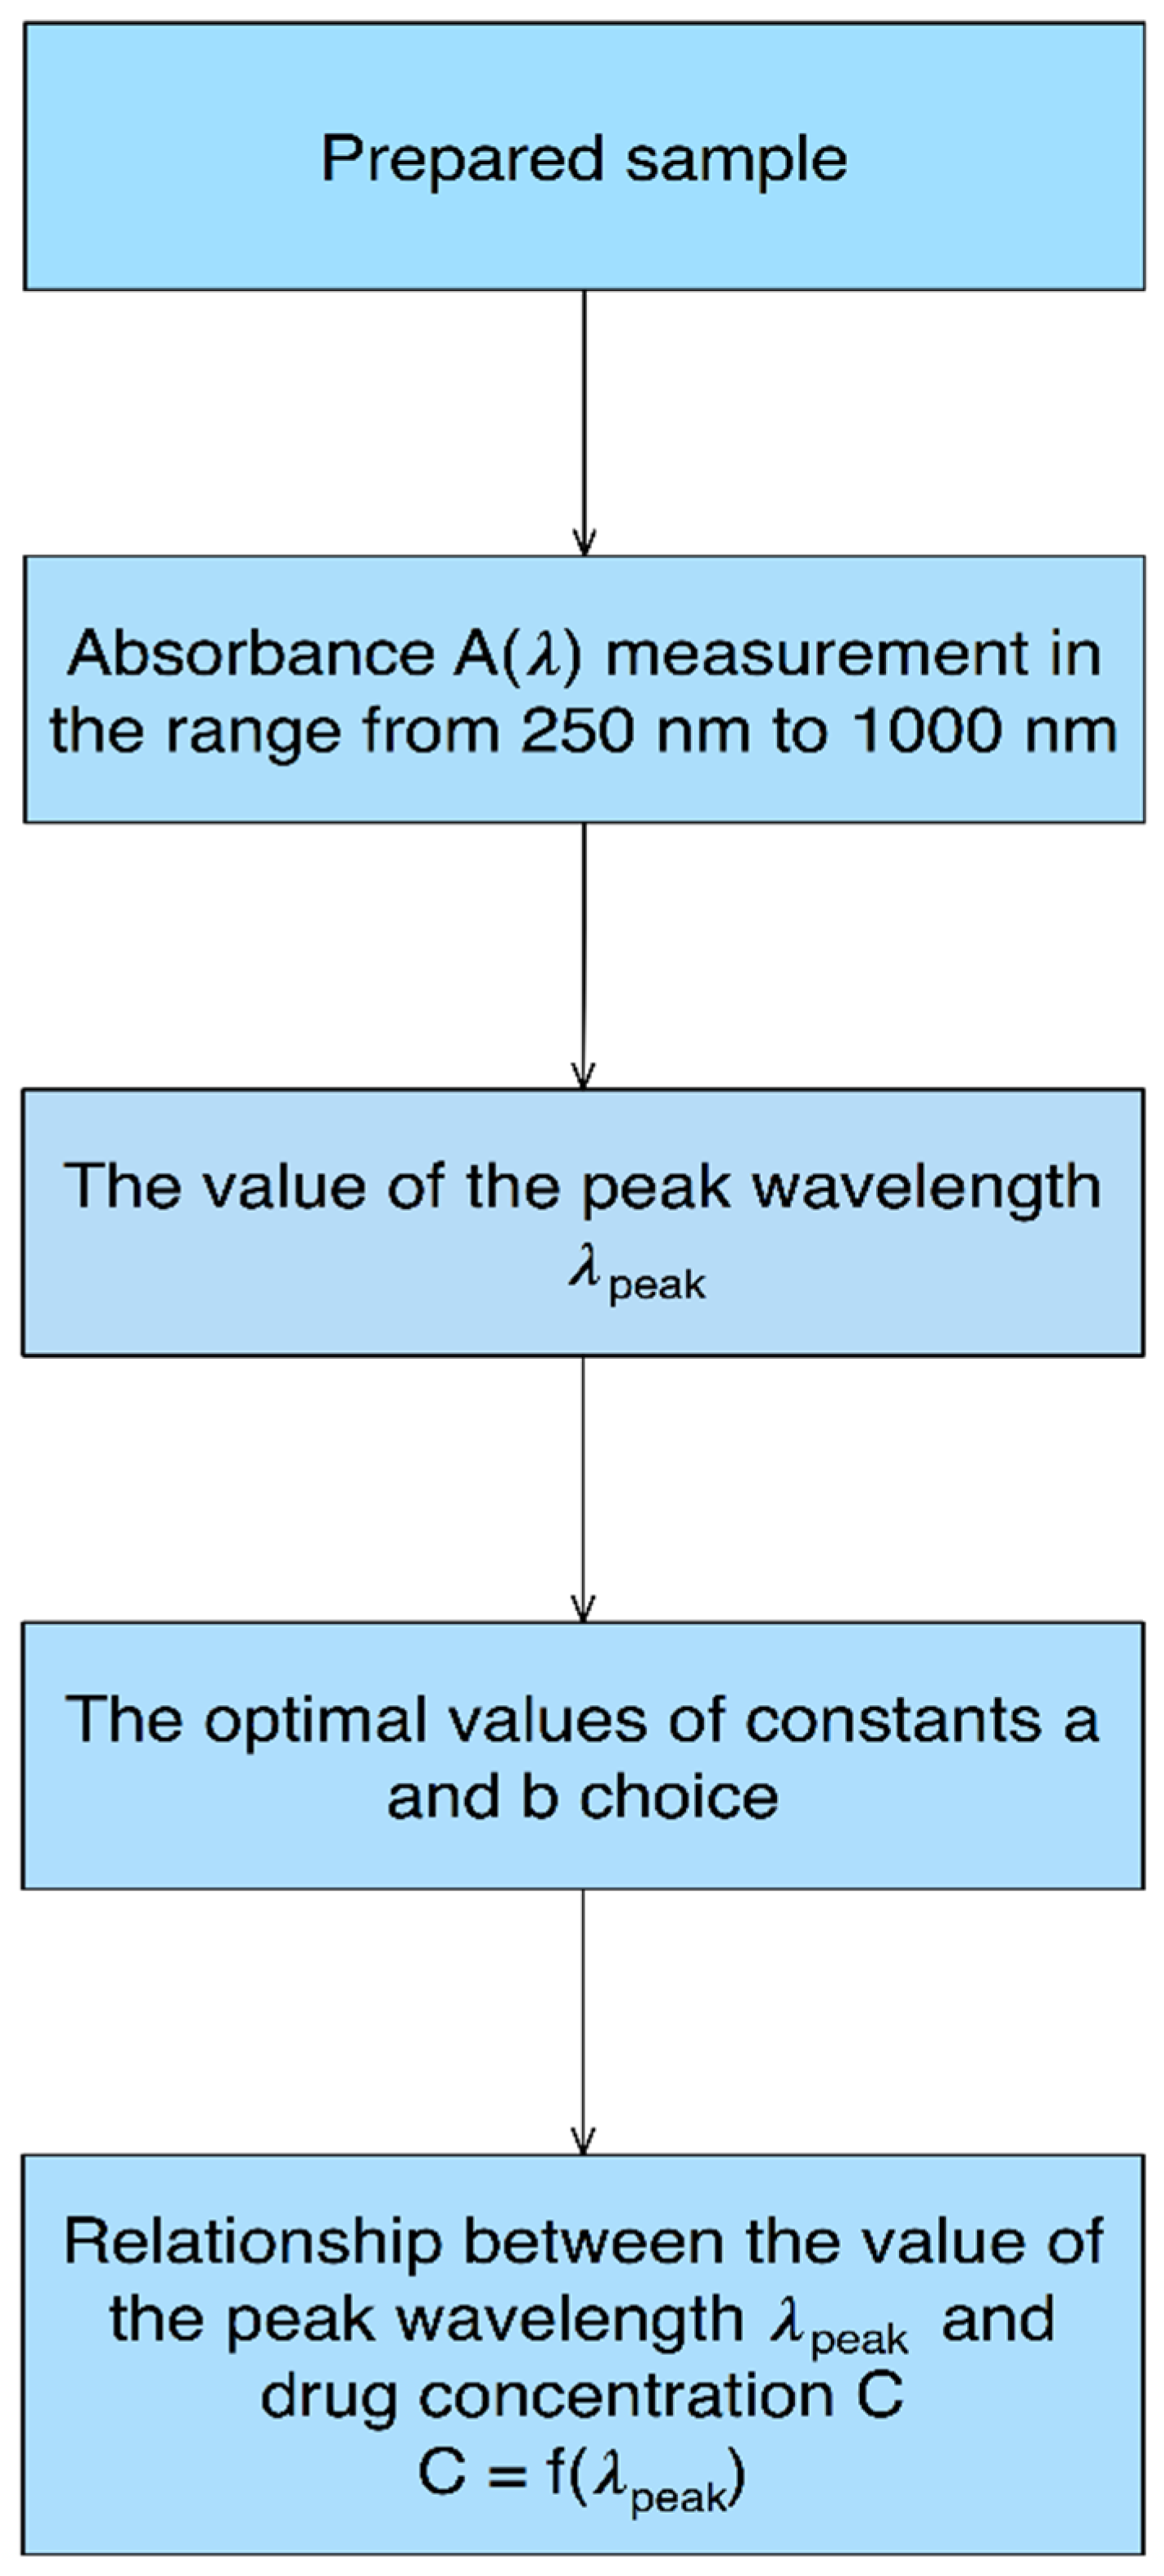
4.1. Data Analysis Algorithm
4.2. Relationship between the Value of the Peak Wavelength λpeak and CsA Concentration
5. Conclusions
Author Contributions
Funding
Acknowledgments
Conflicts of Interest
References
- Haschek, W.M.; Rousseaux, C.G.; Wallig, M.A. Chapter 15—Immune System. In Fundamentals of Toxicologic Pathology, 2nd ed.; Academic Press: San Diego, CA, USA, 2010; pp. 451–489. ISBN 978-0-12-370469-6. [Google Scholar]
- Hernández-Martín, A.; Noguera-Morel, L.; Bernardino-Cuesta, B.; Torrelo, A.; Pérez-Martin, M.A.; Aparicio-López, C.; de Lucas-Collantes, C. Cyclosporine A for severe atopic dermatitis in children. efficacy and safety in a retrospective study of 63 patients. J. Eur. Acad. Dermatol. Venereol. 2017, 31, 837–842. [Google Scholar] [CrossRef] [PubMed]
- Chew, A.-L.; Bashir, S.J.; Johnston, A.; Barker, J.N.W.N.; Smith, C.H. The value of monitoring ciclosporin concentration 2 hours post-dose (C2) in dermatology: A prospective cohort study. J. Dermatol. Treat. 2011, 22, 79–85. [Google Scholar] [CrossRef] [PubMed]
- Griffiths, C.E.M.; Katsambas, A.; Dijkmans, B.A.C.; Finlay, A.Y.; Ho, V.C.; Johnston, A.; Luger, T.A.; Mrowietz, U.; Thestrup-Pedersen, K. Update on the use of ciclosporin in immune-mediated dermatoses. Br. J. Dermatol. 2006, 155 (Suppl. 2), 1–16. [Google Scholar] [CrossRef] [PubMed]
- Walsh, S.B.; Xu, J.; Xu, H.; Kurundkar, A.R.; Maheshwari, A.; Grizzle, W.E.; Timares, L.; Huang, C.C.; Kopelovich, L.; Elmets, C.A.; et al. Cyclosporine a mediates pathogenesis of aggressive cutaneous squamous cell carcinoma by augmenting epithelial-mesenchymal transition: Role of TGFβ signaling pathway. Mol. Carcinog. 2011, 50, 516–527. [Google Scholar] [CrossRef] [PubMed]
- Abikhair, M.; Mitsui, H.; Yanofsky, V.; Roudiani, N.; Ovits, C.; Bryan, T.; Oberyszyn, T.M.; Tober, K.L.; Gonzalez, J.; Krueger, J.G.; et al. Cyclosporine A immunosuppression drives catastrophic squamous cell carcinoma through IL-22. JCI Insight 2016, 1, e86434. [Google Scholar] [CrossRef] [PubMed]
- Van der Schaft, J.; van Zuilen, A.D.; Deinum, J.; Bruijnzeel-Koomen, C.A.F.M.; de Bruin-Weller, M.S. Serum creatinine levels during and after long-term treatment with cyclosporine a in patients with severe atopic dermatitis. Acta Derm. Venereol. 2015, 95, 963–967. [Google Scholar] [CrossRef] [PubMed]
- Han, W.; Soltani, K.; Ming, M.; He, Y.-Y. Deregulation of XPC and CypA by cyclosporin A: An immunosuppression-independent mechanism of skin carcinogenesis. Cancer Prev. Res. Phila. Pa 2012, 5, 1155–1162. [Google Scholar] [CrossRef] [PubMed]
- Muellenhoff, M.W.; Koo, J.Y. Cyclosporine and skin cancer: An international dermatologic perspective over 25 years of experience. A comprehensive review and pursuit to define safe use of cyclosporine in dermatology. J. Dermatol. Treat. 2012, 23, 290–304. [Google Scholar] [CrossRef] [PubMed]
- Roekevisch, E.; Spuls, P.I.; Kuester, D.; Limpens, J.; Schmitt, J. Efficacy and safety of systemic treatments for moderate-to-severe atopic dermatitis: A systematic review. J. Allergy Clin. Immunol. 2014, 133, 429–438. [Google Scholar] [CrossRef] [PubMed]
- Van der Schaft, J.; Politiek, K.; van den Reek, J.M.P.A.; Christoffers, W.A.; Kievit, W.; de Jong, E.M.G.J.; Bruijnzeel-Koomen, C.A.F.M.; Schuttelaar, M.L.A.; de Bruin-Weller, M.S. Drug survival for ciclosporin A in a long-term daily practice cohort of adult patients with atopic dermatitis. Br. J. Dermatol. 2015, 172, 1621–1627. [Google Scholar] [CrossRef] [PubMed]
- Commission Decision of 20 November 2008 on Guidelines for the Purpose of the Risk-Based Animal Health Surveillance Schemes Provided for in Council Directive 2006/88/EC (Notified under Document Number C(2008) 6787) (Text with EEA relevance) (2008/896/EC). Available online: https://eur-lex.europa.eu/legal-content/EN/ALL/?uri=CELEX%3A32008D0896 (accessed on 6 June 2018).
- Council Directive 2006/88/EC of 24 October 2006 on Animal Health Requirements for Aquaculture Animals and Products Thereof, and on the Prevention and Control of Certain Diseases in Aquatic Animals. Available online: https://eur-lex.europa.eu/legal-content/EN/ALL/?uri=CELEX%3A32006L0088 (accessed on 6 June 2018).
- Legrand, J.-J.; Bouchez, C.; Mimouni, C.; N’Guyen, A.; Bouchard, J.; Ameller, T.; Descotes, J. Immunotoxic effects of cyclophosphamide and cyclosporine in the dog. J. Immunotoxicol. 2013, 10, 90–95. [Google Scholar] [CrossRef] [PubMed]
- Elshama, S.S.; EL-Kenawy, A.E.-M.; Osman, H.-E.H. Histopathological Study of Cyclosporine Pulmonary Toxicity in Rats. Available online: https://www.hindawi.com/journals/jt/2016/2973274/ (accessed on 15 May 2018).
- Kovalik, M.; Thoday, K.L.; Handel, I.G.; Bronsvoort, B.M.C.; Evans, H.; van den Broek, A.H.M.; Mellanby, R.J. Ciclosporin A therapy is associated with disturbances in glucose metabolism in dogs with atopic dermatitis. Vet. Dermatol. 2011, 22, 173–180. [Google Scholar] [CrossRef] [PubMed]
- Last, R.D.; Suzuki, Y.; Manning, T.; Lindsay, D.; Galipeau, L.; Whitbread, T.J. A case of fatal systemic toxoplasmosis in a cat being treated with cyclosporin A for feline atopy. Vet. Dermatol. 2004, 15, 194–198. [Google Scholar] [CrossRef] [PubMed]
- Bechstein, W.O. Neurotoxicity of calcineurin inhibitors: Impact and clinical management. Transpl. Int. Off. J. Eur. Soc. Organ Transplant. 2000, 13, 313–326. [Google Scholar] [CrossRef]
- Gauglitz, G.; Vo-Dinh, T. Handbook of Spectroscopy; Wiley-VCH: Weinheim, Germany, 2003; ISBN 3-527-29782-0. [Google Scholar]
- Benavides, A.L.; Aragones, J.L.; Vega, C. Consensus on the solubility of NaCl in water from computer simulations using the chemical potential route. J. Chem. Phys. 2016, 144, 124504. [Google Scholar] [CrossRef] [PubMed]
- Jørgensen, N.O.G. Carbohydrates. In Encyclopedia of Inland Waters; Academic Press: Oxford, UK, 2009; pp. 727–742. ISBN 978-0-12-370626-3. [Google Scholar]
- Rai, H. Glucose in Freshwater of Central Amazon Lakes: Natural Substrate Concentrations Determined by Dilution Bioassay. Int. Rev. Gesamten Hydrobiol. Hydrogr. 1979, 64, 141–146. [Google Scholar] [CrossRef]


| Sample | Cyclaid Mass [mg] | Deionized Water Mass [g] | CsA [mg] in 4 g of Sample |
|---|---|---|---|
| 13.61% | 630.10 | 4 | 65.74 |
| 4.45% | 186.37 | 4 | 19.44 |
| 2.26% | 92.30 | 4 | 9.63 |
| 0.90% | 36.39 | 4 | 4.02 |
| 0.44% | 17.75 | 4 | 1.85 |
| 0.22% | 17.75 | 8 | 0.92 |
| 0.09% | 17.75 | 20 | 0.37 |
| Solution | Peak Wavelength λpeak [nm] | |
|---|---|---|
| CsA Concentration | 0.44% | 4.45% |
| CsA in water | 252.25 | 272.07 |
| +0.8‰ of C6H12O6 | 253.15 | 272.07 |
| +1.3‰ of C6H12O6 | 253.15 | 273.87 |
| +7‰ of NaCl | 252.25 | 272.07 |
| +36‰ of NaCl | 252.25 | 272.07 |
| +1.3‰ of C6H12O6 + 36‰ of NaCl | 252.25 | 272.07 |
© 2018 by the authors. Licensee MDPI, Basel, Switzerland. This article is an open access article distributed under the terms and conditions of the Creative Commons Attribution (CC BY) license (http://creativecommons.org/licenses/by/4.0/).
Share and Cite
Marzejon, M.; Kosowska, M.; Majchrowicz, D.; Bułło-Piontecka, B.; Wąsowicz, M.; Jędrzejewska-Szczerska, M. Optical-Spectrometry-Based Method for Immunosuppressant Medicine Level Detection in Aqueous Solutions. Sensors 2018, 18, 2001. https://doi.org/10.3390/s18072001
Marzejon M, Kosowska M, Majchrowicz D, Bułło-Piontecka B, Wąsowicz M, Jędrzejewska-Szczerska M. Optical-Spectrometry-Based Method for Immunosuppressant Medicine Level Detection in Aqueous Solutions. Sensors. 2018; 18(7):2001. https://doi.org/10.3390/s18072001
Chicago/Turabian StyleMarzejon, Marcin, Monika Kosowska, Daria Majchrowicz, Barbara Bułło-Piontecka, Michał Wąsowicz, and Małgorzata Jędrzejewska-Szczerska. 2018. "Optical-Spectrometry-Based Method for Immunosuppressant Medicine Level Detection in Aqueous Solutions" Sensors 18, no. 7: 2001. https://doi.org/10.3390/s18072001
APA StyleMarzejon, M., Kosowska, M., Majchrowicz, D., Bułło-Piontecka, B., Wąsowicz, M., & Jędrzejewska-Szczerska, M. (2018). Optical-Spectrometry-Based Method for Immunosuppressant Medicine Level Detection in Aqueous Solutions. Sensors, 18(7), 2001. https://doi.org/10.3390/s18072001