Article

Sensitive and Selective Detection of Tartrazine Based on TiO2-Electrochemically Reduced Graphene Oxide Composite-Modified Electrodes

1
School of Materials Science and Energy Engineering, Foshan University, Foshan 528000, China
2
Department of Chemistry and Material Science, Hengyang Normal University, Hengyang 421008, China
3
Hunan Key Laboratory of Biomedical Nanomaterials and Devices, College of Life Sciences and Chemistry, Hunan University of Technology, Zhuzhou 412007, China
*
Authors to whom correspondence should be addressed.
These authors contributed equally.
Sensors 2018, 18(6), 1911; https://doi.org/10.3390/s18061911
Submission received: 23 April 2018 / Revised: 9 June 2018 / Accepted: 11 June 2018 / Published: 12 June 2018
(This article belongs to the Section Chemical Sensors)

Abstract

:
TiO2-reduced graphene oxide composite-modified glassy carbon electrodes (TiO2–ErGO–GCE) for the sensitive detection of tartrazine were prepared by drop casting followed by electrochemical reduction. The as-prepared material was characterized by transmission electron microscopy (TEM) and X-ray diffraction (XRD). Cyclic voltammetry and second-order derivative linear scan voltammetry were performed to analyze the electrochemical sensing of tartrazine on different electrodes. The determination conditions (including pH, accumulation potential, and accumulation time) were optimized systematically. The results showed that the TiO2–ErGO composites increased the electrochemical active area of the electrode and enhanced the electrochemical responses to tartrazine significantly. Under the optimum detection conditions, the peak current was found to be linear for tartrazine concentrations in the range of 2.0 × 10⁻⁸–2.0 × 10⁻⁵ mol/L, with a lower detection limit of 8.0 × 10⁻⁹ mol/L (S/N = 3). Finally, the proposed TiO2–ErGO–GCEs were successfully applied for the detection of trace tartrazine in carbonated beverage samples.

1. Introduction

With the rapid development of modern life, artificially sweetened beverages attract a lot of children because of their colorful appearance and sweet taste. Food colorants are commonly used in these artificially sweetened beverages as additives. Tartrazine is an important food colorant used in various kinds of drinks and foods [1,2]. However, the azodi group and aromatic ring in tartrazine are found to be a potential risk to human health; thus, the dosage of tartrazine used should be monitored constantly. The acceptable daily intake (ADI) of tartrazine recommended by the FDA is 3.75 mg/kg for humans. Moreover, the World Health Organization (WHO) suggest that the ADI could be limited to 2.5 mg/kg. The excessive intake of tartrazine could cause various diseases, such as allergy, asthma, eczema, anxiety, migraine, and even cancer [3,4]. More importantly, the accidental abuse of tartrazine (such as from tainted steamed buns) has often happened in recent years. Thus, detecting the content of tartrazine in foods and drinks is important for improving food security in the modern society. Developing a detecting method characterized by celerity, high sensitivity, and high selectivity is a significant way to promote the progress of human health.
In recent years, various methods have been developed for detecting the content of food colorants [5,6,7], especially for the detection of tartrazine, such as general fluorescent methods [8,9], enzyme-linked immunosorbent methods [10], and electroanalytical methods [11]. The fluorescent method requires that the analyzed materials possess fluorescent properties, which restricts its application. The enzyme-linked immunosorbent method is a novel biological technique. It requires expensive biological materials, such as antibodies, and its complex operation steps could cause inaccuracy in the colorant detection. The electroanalytical method is one of the most important ways for trace detection and possesses various advantages, such as low cost, high sensitivity, and high selectivity [12]. Various modified electrodes have been developed for the electrochemical detection of tartrazine. For example, Squella and co-workers prepared multi-walled carbon nanotube (MWCNT)-modified GCE by using 1,3-dioxolane as a dispersant agent. The proposed sensor was successfully applied to the simultaneous detection of tartrazine, sunset yellow, and carnosine with high sensitivity and reproducibility. The sensitivity (3.5 μA/μM) toward tartrazine was improved significantly with a low limit of detection (0.22 μM), due to the large surface area and high electrical conductibility of the MWCNTs [13]. Multi-walled carbon nanotubes–film-coated glassy carbon electrodes have also been proposed to determinate tartrazine, and successfully applied to determinate tartrazine in soft drinks [14]. Gold nanorods–graphene-modified electrodes were developed for the sensitive determination of tartrazine, and exhibited a linear response in the concentration range of 0.03–6.0 μM, with a detection limit of 8.6 nM [15]. A novel electrochemical sensor based on ionic liquid-modified expanded graphite paste electrode showed excellent sensing performance, including a wide linear response range (0.01 μM–2 μM), low detection limit (3.0 nM), good reproducibility, stability, and reusability [16]. Although these modified electrodes exhibit outstanding sensing performance towards tartrazine, their high costs make them commercially unfavorable. Besides, the stability of the ionic liquid-modified electrode is poor, since ionic liquid is susceptible to the air moisture. Hence, it is necessary to seek suitable electrode modification materials with low cost, excellent electrocatalytic performance, large surface areas, and excellent electrical conductibility.
It is well known that carbon-based nanomaterials possess various advantages, such as low cost, good electrical conductibility, and high surface area and have been developed intensely. These carbon materials mainly include carbon nanofibers, porous activated carbon, carbon nanotubes, fullerene, and graphene. Graphene, an emerging 2-dimensional (2D) nanomaterial, has been widely applied in many fields, such as materials science, biomedicine, aerospace, and electronics, owing to its outstanding merits, including good thermal and electron conductivity, high number of surface active sites, and low-cost raw materials [17,18]. In the field of electrochemical analysis, graphene is regarded as one of the preferred candidates for modified electrodes. In our previous reports, a series of metal oxides–graphene nanocomposite-modified GCEs have been developed for the sensitive detection of dopamine and vanillin [19,20,21]. In these nanocomposite systems, various metal oxides, used as the main functional materials, such as Fe3O4, Fe2O3, MnO2, and Cu2O, show good electrocatalytic activities in electrochemical analyses [22,23,24,25]. The detection sensitivity was enhanced greatly because these semiconductors offer more active reaction sites for the analyses. TiO2, as a common semiconductor, has been developed for several decades. TiO2 nanomaterials are widely used in the photocatalytic field, because of their good catalytic activity [26,27,28]. Recently, the electrocatalytic activity of TiO2 has also been reported. For example, Arkan and co-workers fabricated a TiO2 nanoparticles–carbon nanofiber-modified GCE, and the results demonstrated that the proposed modified electrode lowered the overpotential of idarubicin (IDA) during the oxidation process. The composite exhibited a good electrocatalytic activity with a wide liner range from 0.012 to 10 μM [29].
By coupling the merits of 2D graphene materials (larger surface area and high electrical conductivity) with the good catalytic performance of TiO2 semiconductors, the electrochemical properties may be improved for the detection of trace food colorants. However, to the best of our knowledge, TiO2–graphene nanocomposite-modified electrodes for tartrazine have rarely been reported. A novel electrochemical sensor based on graphene–mesoporous TiO2-modified carbon paste electrodes was developed for the detection of trace tartrazine and exhibited a wide linear detection range (0.02–0.18 μM) and a low detection limit (8.0 nM) using square wave voltammetry (SWV). However, the graphene was obtained by chemically reduction of graphene oxide, which requires a poisonous reductant and several steps in the reduction process. Herein, TiO2-electrochemically reduced graphene oxide-modified glassy carbon electrodes (TiO2–ErGO–GCEs) were prepared by a facile hydrothermal and electrochemical reduction method. Second-order derivative linear sweep voltammetry was employed to detect tartrazine, because of its advantages, including higher sensitivity and better selectivity than differential pulse voltammetry (DPV) and square wave voltammetry (SWV) [30]. The morphologies and structures of these samples were analyzed by transmission electron microscopy (TEM) and powder X-ray diffraction (XRD). Moreover, the electrochemical behavior of tartrazine on TiO2–ErGO–GCE was investigated in detail. Furthermore, various electrochemical parameters (pH, scan rate, accumulation potential, and time) were discussed. Finally, the TiO2–ErGO–GCE was successfully applied for tartrazine detection in a carbonate beverage.

2. Experimental Section

2.1. Materials and Chemicals

Titanous sulfate (Ti(SO4)2), graphite powder, sodium nitrate (NaNO3), concentrated sulfuric acid (H2SO4), potassium permanganate (KMnO4), hydrogen peroxide (H2O2), potassium nitrate (KNO3), phosphoric acid (H3PO4), sodium hydroxide (NaOH), hydrochloric acid (HCl), and ethyl alcohol were purchased from Sinopharm Chemical Reagent Co., Ltd. (Shanghai, China). Tartrazine was purchased from Sigma-Aldrich Co. (Shanghai, China). All reagents were used without further purification. Finally, ultrapure water was used in all experiments (18.2 MΩ).

2.2. Synthesis of TiO2 Nanoparticles (NPs)

The TiO2 NPs were synthesized according to a published method [31]. Typically, 4.899 g of Ti(SO4)2 were dissolved in 50 mL of water under stirring for 30 min. This solution was transferred to a Teflon-lined stainless-steel autoclave (100 mL) and reacted at 200 °C for 4 h. After cooling to room temperature, the TiO2 reactants were centrifugated at 7920 rcf. Then, the samples were washed with water and ethyl alcohol for several times, and the TiO2 NPs were obtained by drying at 60 °C in vacuum for 10 h.

2.3. Synthesis of TiO2–GO Composite Nanomaterials

Graphene oxide (GO) was synthesized by the modified Hummers’ method [32]. In a typical process, concentrated H2SO4 was cooled down to 0 °C, and 0.5 g of graphite powder and NaNO3 were added subsequently under stirring. Then, 3.0 g of KMnO4 was added slowly at 5 °C. After that, the temperature was raised to 35 °C for 2 h under stirring to form a mash, and 40 mL of water was added at 50 °C; then, the temperature was increased to 95 °C for 0.5 h. The above solution was added to 20 mL of 30% H2O2 in batches. The as-obtained precipitate was washed with 150 mL of hydrochloric acid (1:10) and 150 mL of H2O. Then, it was vacuum-dried at 50 °C for 12 h to obtain the graphite oxide. Subsequently, 100 mg of GO were dispersed in 100 mL of water under ultrasound exfoliation for 2 h. Finally, 2 mg of TiO2 NPs was added to 5 mL of GO supernatant solution (1 mg/mL) under ultrasounds for 2 h to obtain the TiO2–GO composite.

2.4. Fabrication of TiO2–ErGO-Modified GCE

Firstly, the polished GCE was immersed in ethyl alcohol and water under ultrasounds for 1 min. Then the TiO2–GO–GCEs were fabricated via drop casting of the TiO2–GO dispersion on the GCE, followed by an electrochemical reduction process. Specifically, 5 μL of TiO2–GO dispersion was dropped and casted on the surface of bare GCE to prepare the TiO2–GO–GCE. Then, the TiO2–GO–GCE was reduced by electrochemical reduction under the potential of −1.2 V for 120 s for the formation of TiO2–ErGO–GCE. Reduced graphene oxide-modified GCEs (ErGO–GCE) were also prepared for comparison.

2.5. Characterization

TEM images were obtained by JEOL JEM-2010 (HT, Tokyo, Japan), operated at 200 kV. XRD patterns were obtained by X-ray diffractometry (PANalytical, Holland), performed at 40 kV and 40 mA with Cu Kα radiation (λ = 0.1542 nm).

2.6. Electrochemical Experiments

Both cyclic voltammetry (CV) and second-order derivative linear sweep voltammetry (SDLSV) were carried out with a standard three-electrode system. The bare or nanomaterial-modified GCEs were used as working electrodes. A platinum electrode and a saturated calomel electrode (SCE) acted as counter electrode and reference electrode, respectively. The CVs were measured by CHI 660E electrochemical workstation (Chenhua Instrument Co. Ltd., Shanghai, China), and the SDLSV was tested by a JP-303E Polarographic Analyzer (Chengdu Instrument Company, Chengdu, China). Fresh PBS, 0.1 M, was used as a supporting electrolyte for all electrochemical tests. Unless stated otherwise, all electrochemical tests were recorded at a scan rate of 100 mV/s, after a suitable accumulation period under stirring at 500 rpm and a 5 s rest. The potential scan ranges were 0.4–1.2 V for CV and 0.6–1.2 V for the SDLSV.

2.7. Analysis of Real Samples

The carbonate beverage was purchased from a local supermarket. The CO2 was eliminated by an ultrasound process. An amount of 1 mL of sample was diluted to 6 mL with 1.0 M PBS (pH 3.7). Then, carbonate beverage samples at various concentration were prepared by dilution. The content of tartrazine in the carbonate beverage was measured using SDLSV by the standard addition method under the optimal detection conditions.

3. Result and Discussion

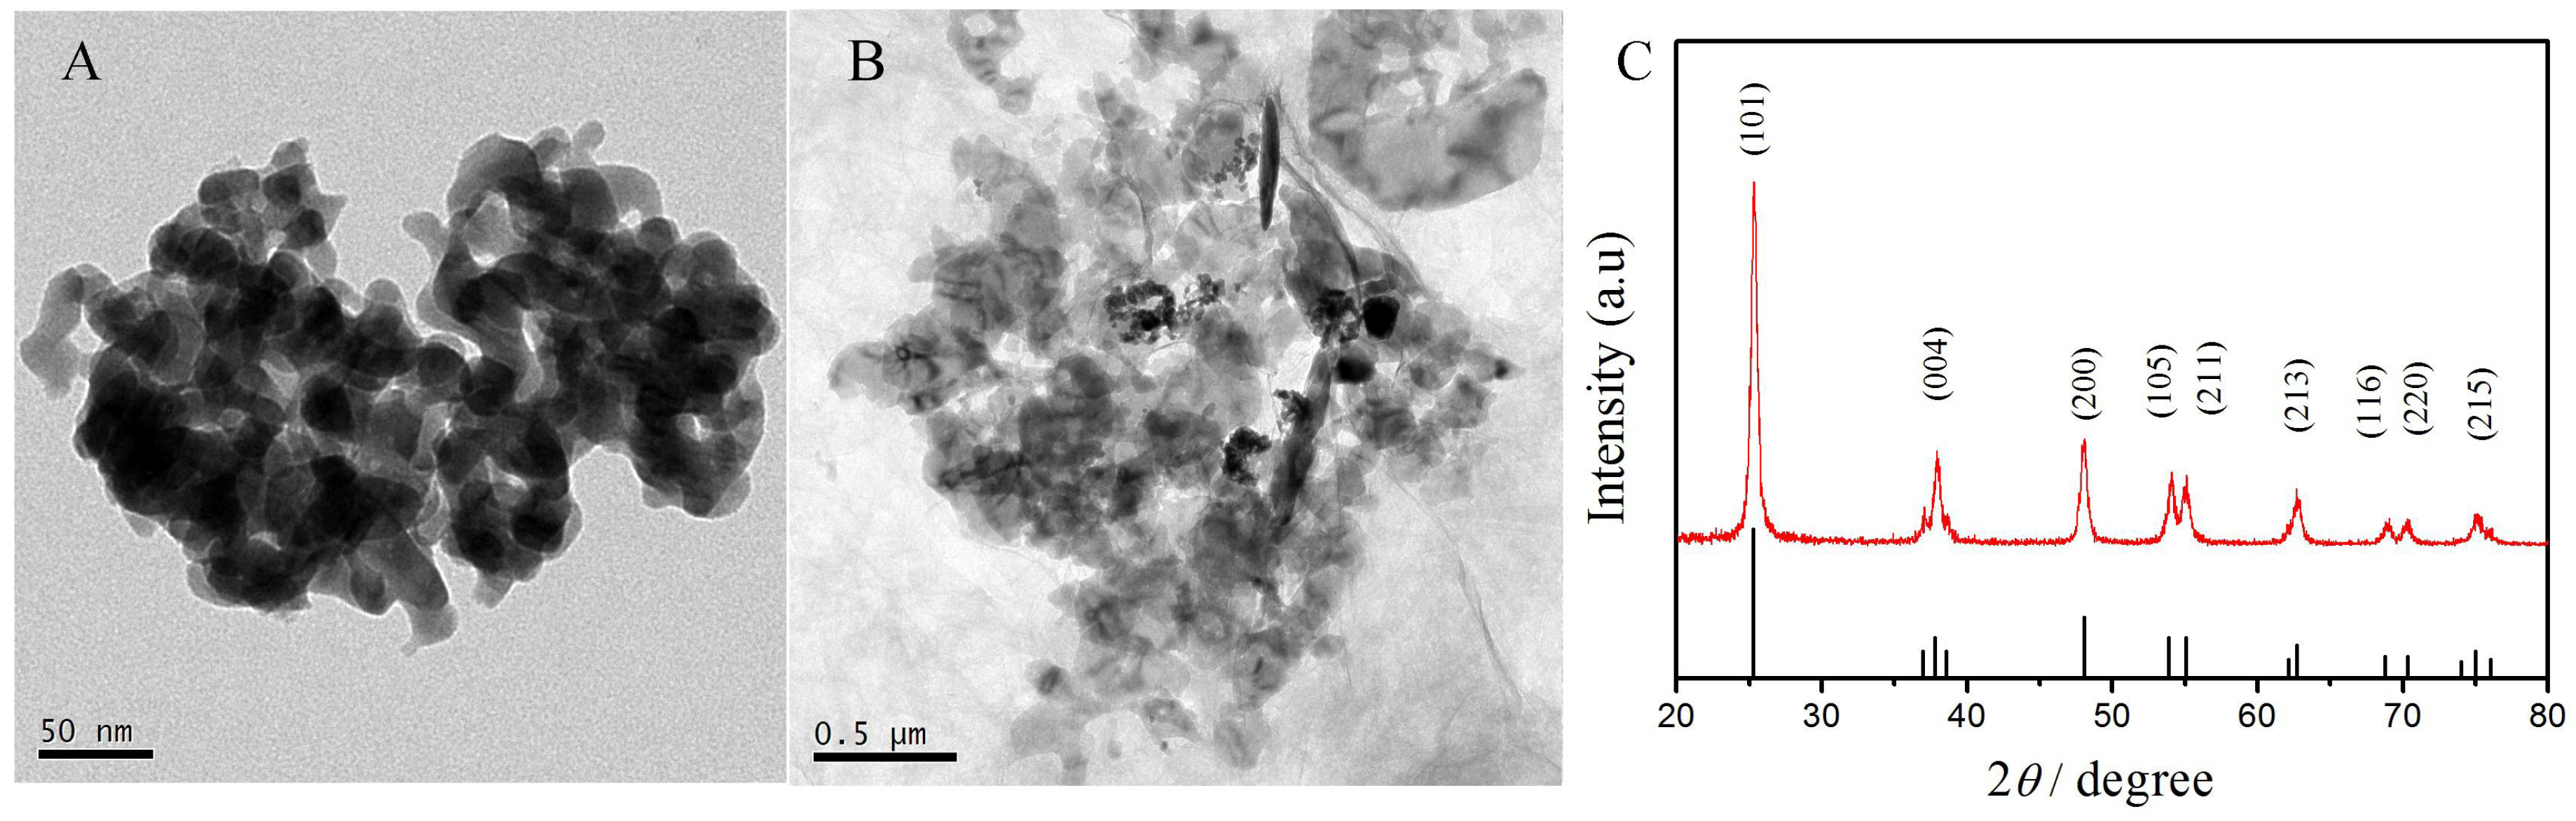
3.1. Morphologic and Structural Characterization of TiO2–GO Nanocomposites

The morphologies of the TiO2 and TiO2–GO composite samples were characterized by TEM. As shown in the TEM images (Figure 1A), the TiO2 NPs was cube-like with an average particle size of 50 nm. The TiO2 NPs aggregated with each other, and their dispersibility could be improved. Moreover, GO sheets were obviously observed in the surrounding of the TiO2 NPs (Figure 1B), indicating that the TiO2 NPs were well combined with the GO nanosheets. The XRD pattern of the TiO2 NPs is also presented (Figure 1C). The standard JCPDS card of pure anatase TiO2 (21-1272, black lines) were used for comparison. The apparent diffraction peaks of anatase TiO2 located at 25.37, 37.03, 37.88, 48.12, 53.97, 55.10, 62.14, 68.78, 70.35, and 75.13 could be indexed to (101), (004), (200), (105), (211), (213), (116), (220), and (215) planes of anatase TiO2. This indicates that as-prepared TiO2 NPs presented the anatase structure with high crystallinity.

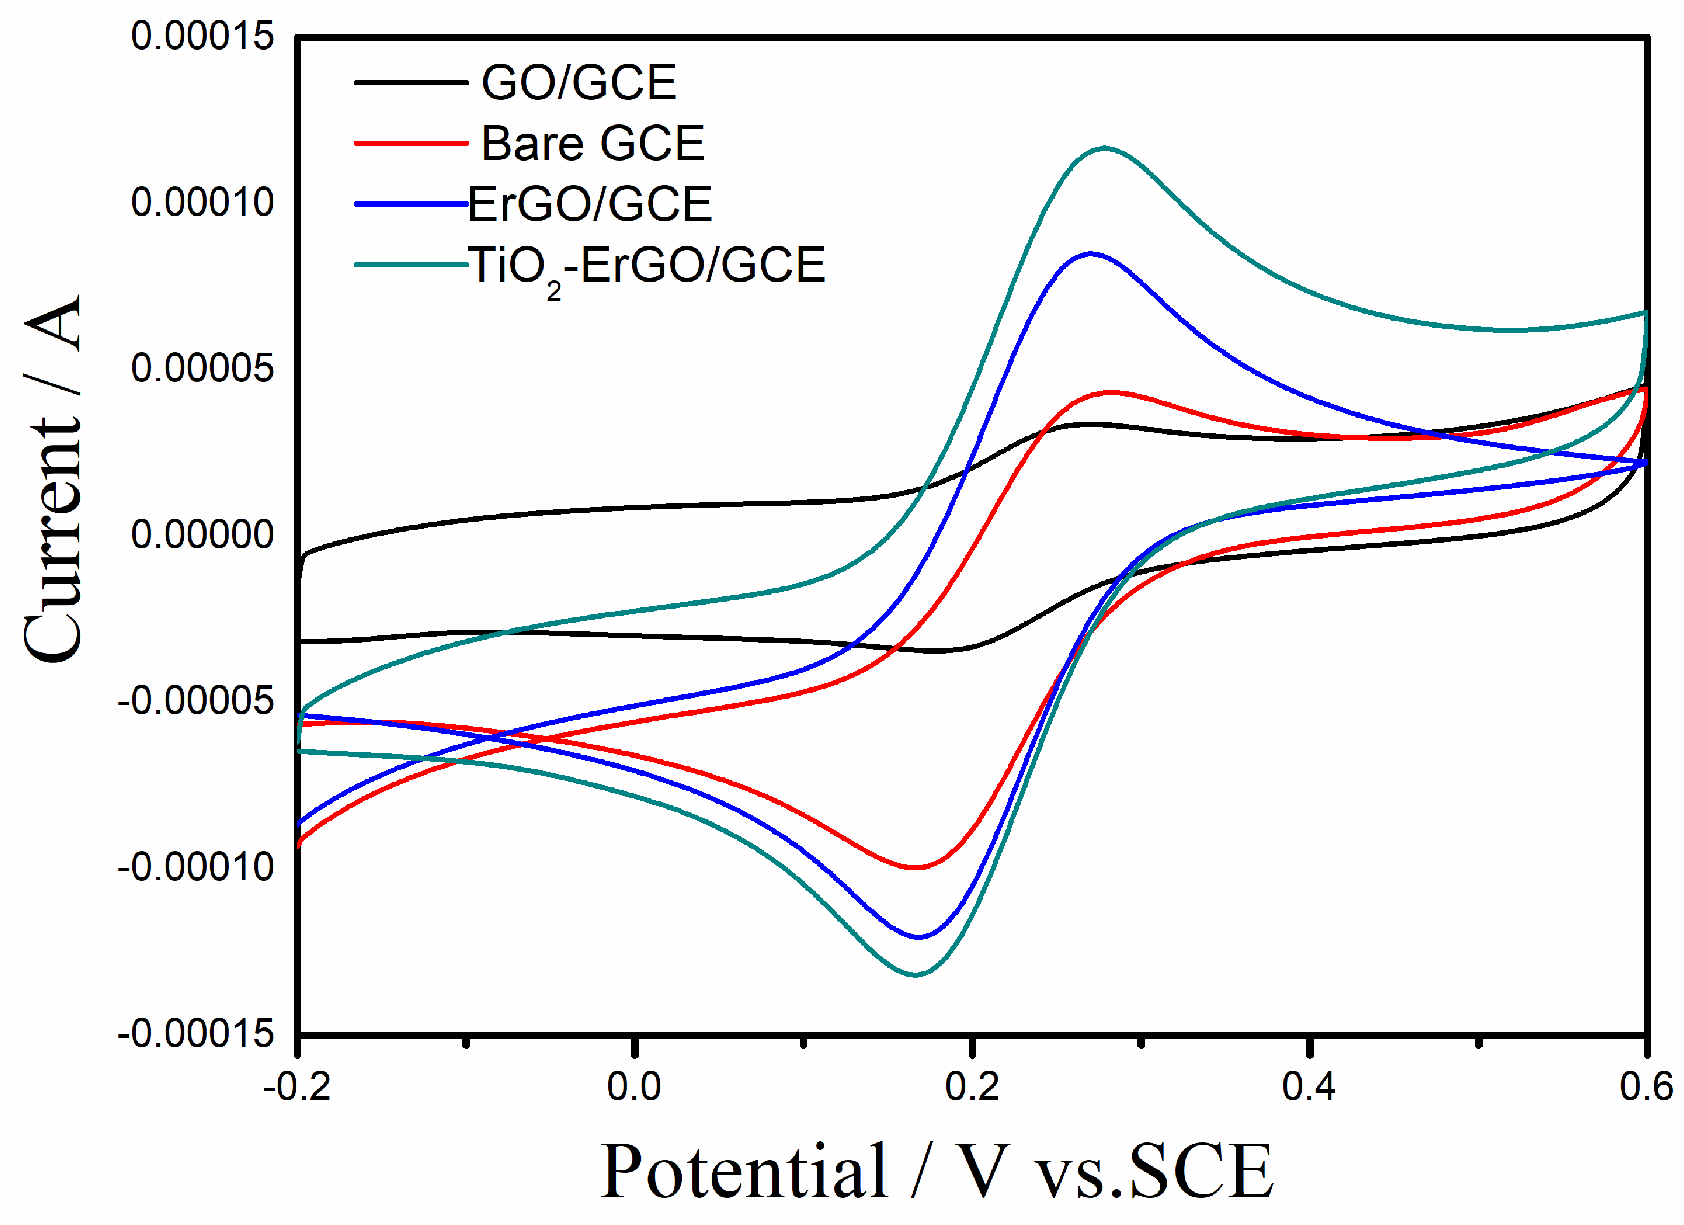
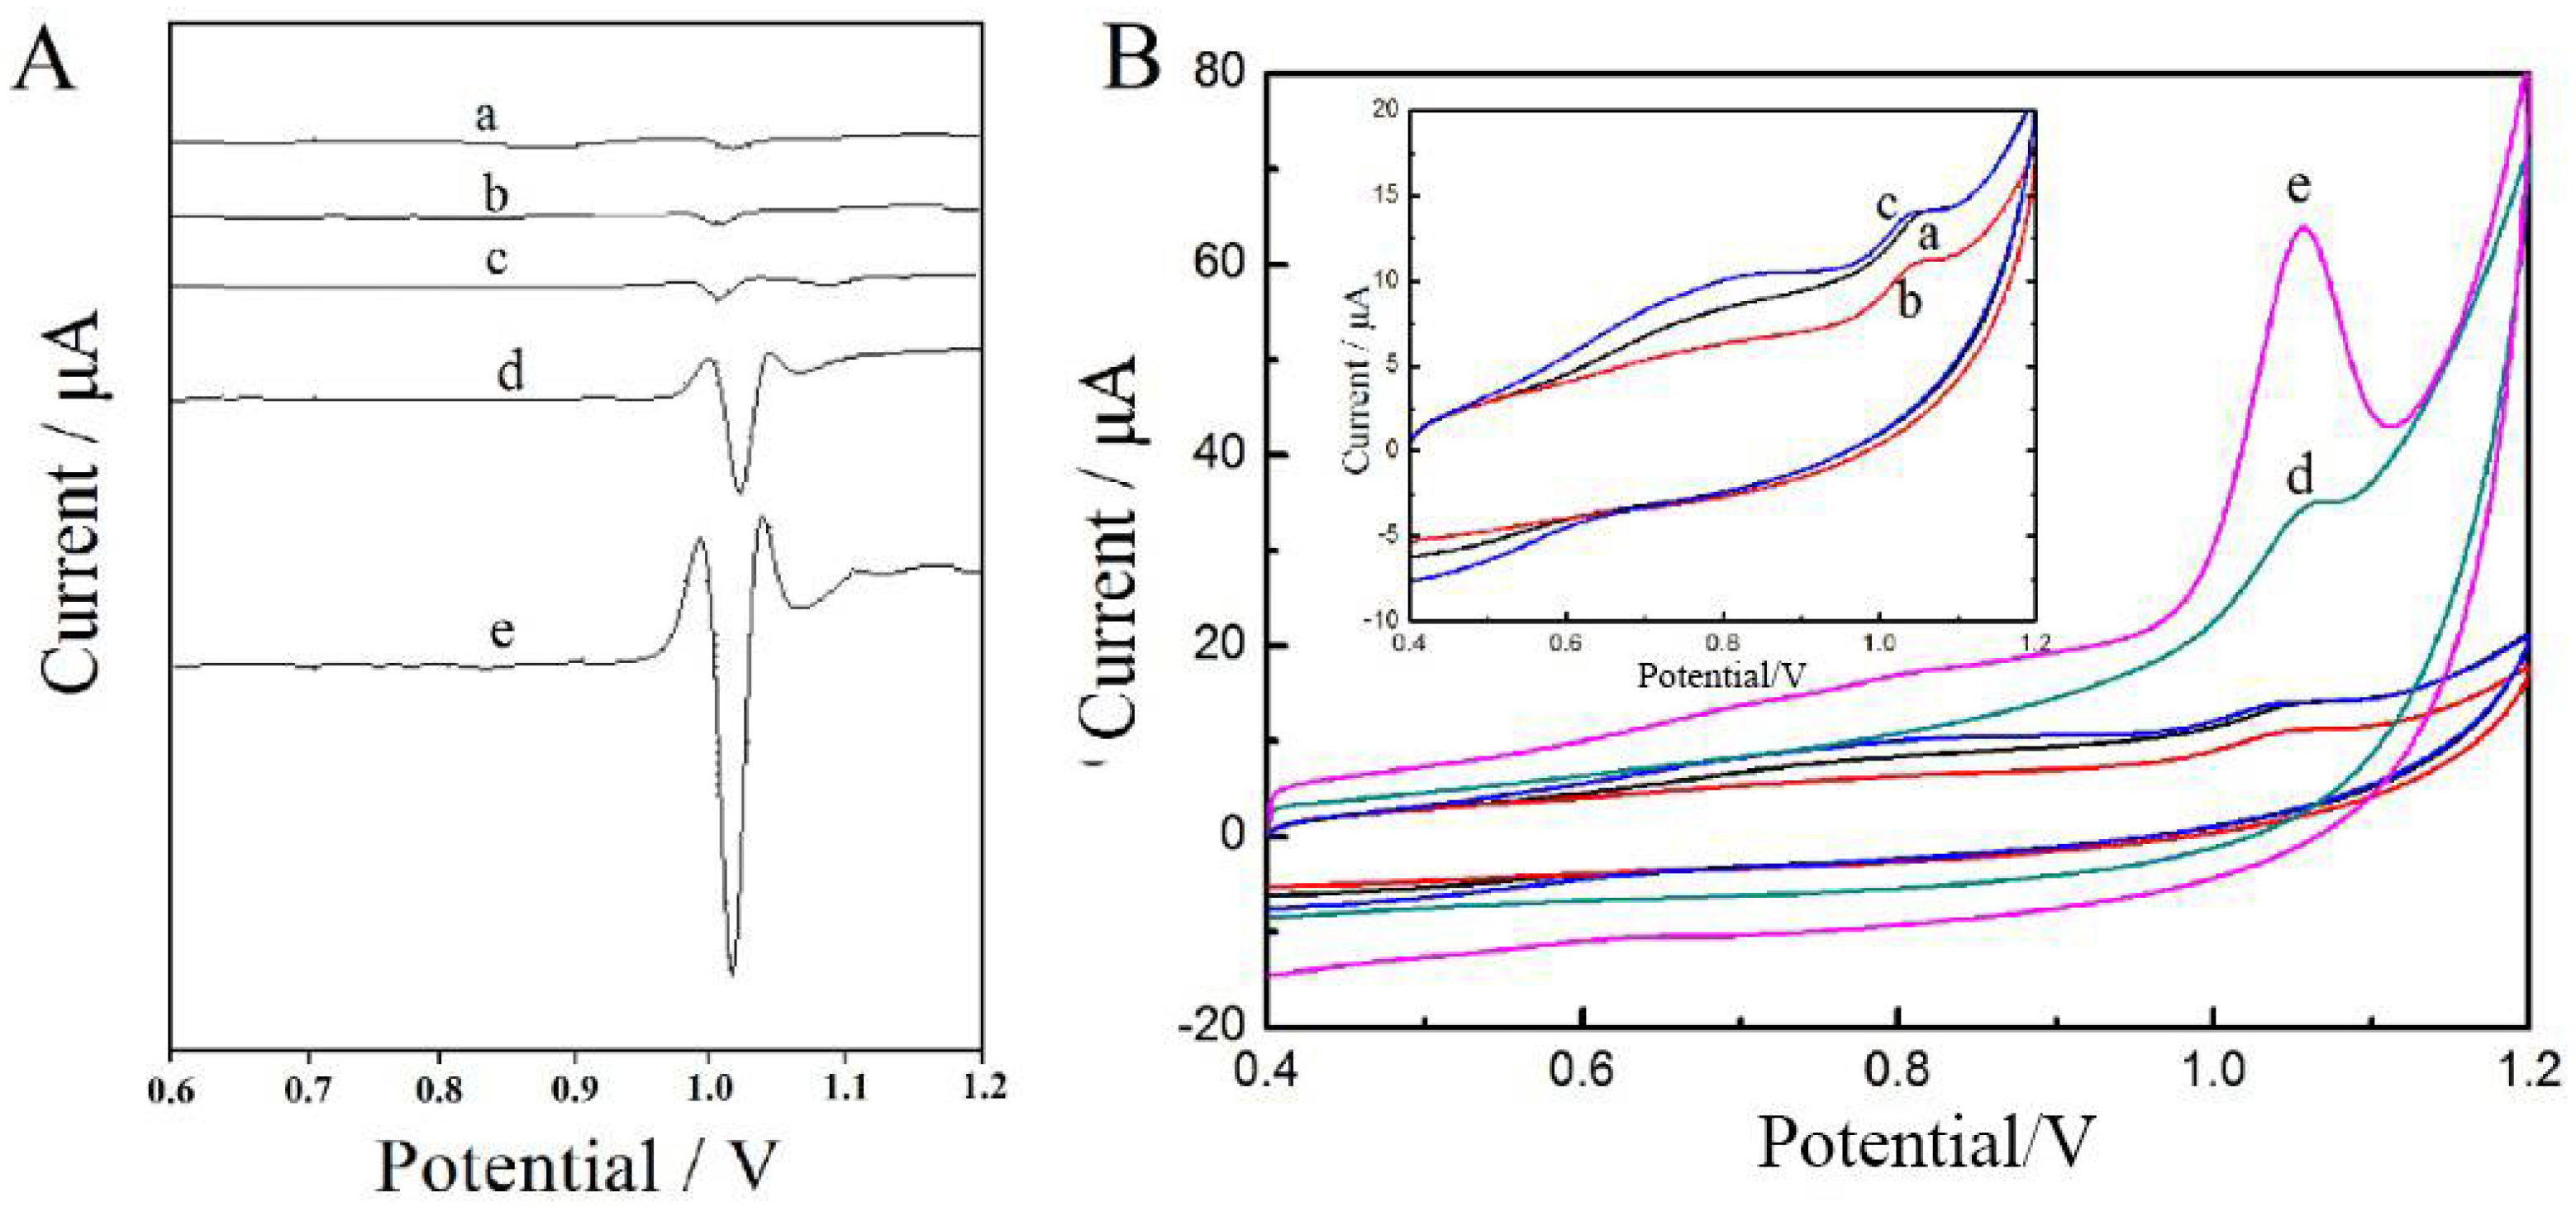
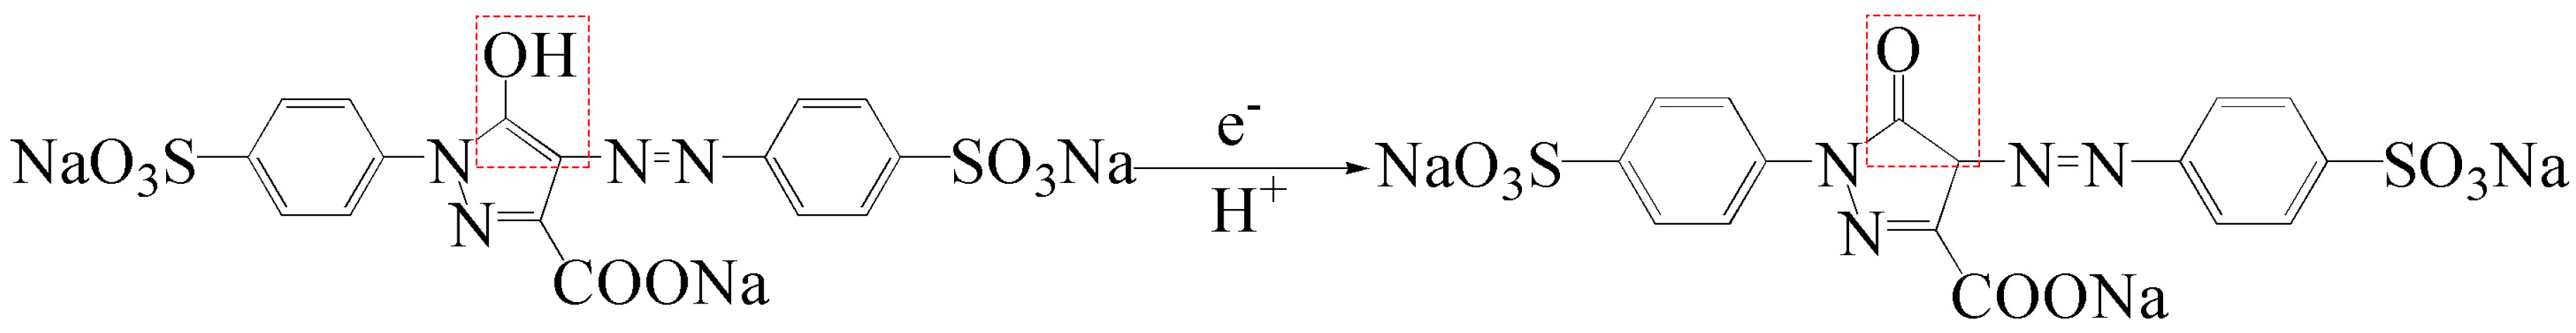
3.2. Electrochemical Behavior of Tartrazine on Different Electrodes

The cyclic voltammograms of bare GCE, GO–GCE, ErGO–GCE, andTiO2–ErGO–GCE in 2.5 × 10⁻³ mol/L [Fe(CN)6]3−/4− solution were investigated, and the results are shown in Figure 2. As expected, a pair of reversible redox peaks appeared on all electrodes. However, the intensities of the redox peaks increased in the following order, GO–GCE, bare GCE, ErGO–GCE, and TiO2–ErGO–GCE. The redox peak current on the GO–GCE was the smallest because of the poor electrical conductivity. When GO was reduced to ErGO, the redox peak current enhanced greatly because of the restoration of the conductive carbon conjugate network and large surface area. When ErGO was combined with TiO2 NPs, the redox peak current further increased because of a synergistic enhancement between ErGO and TiO2 NPs. The reduction peak currents of bare GO, GCE, RGO–GCE, and TiO2–RGO–GCE were 3.37 × 10⁻⁵ A, 4.32 × 10⁻⁵ A, 8.49 × 10⁻⁵ A, and 1.17 × 10⁻⁴ A, respectively. According to Randles–Sevcik equation, their electroactive area were estimated as 0.058 cm2, 0.074 cm2, 0.145 cm2, and 0.199 cm2, respectively. The electrochemical active area of bare GCE coincided with the geometric area (Φ 3.0 mm, 0.071 cm2), and the electrochemical active area of ErGO–CCE and TiO2–ErGO–GCE were approximately 2.0 and 2.7 times that on the bare GCE, in relation to the large specific surface area of TiO2 NPs and ErGO. The large electrochemical active area of the TiO2–ErGO nanocomposites will enhance the adsorption capacity of tartrazine and offer more catalytic sites for tartrazine oxidation.
The electrochemical behavior of tartrazine on (1.0 × 10⁻⁵ mol/L) the surface of the bare and modified GCEs were investigated by SDLSV. The results are shown in Figure 3A. A wide and short peak appeared on the surface of the GCE at 1000 mV (curve a), and the peak current was 1.594 μA. The peak current of tartrazine on the surface of GO–GCE was 1.006 μA (curve b); the lower current could be attributed to the inferior electrical conductivity of GO. Moreover, a wide and short peak (1004 mV, 1.987 μA) were detected on the surface of TiO2–GO–GCE, probably because of the catalytic properties of TiO2 with mesoporous structure and the poor electrical conductivity of GO. However, a manifest oxidation peak located at 1036 mV was observed on the ErGO–GCE, and the peak current increased significantly to 20.10 μA (curve d). This phenomenon could be ascribed to the higher electrical conductivity of ErGO due to the restoration of the conductive carbon-conjugated structure. Moreover, the large surface area could promote the adsorption of tartrazine onto the electrodes. More importantly, the peak current further increases to 26.98 μA when TiO2–ErGO-GCE acted as the work electrode (curve e). The peak current on the TiO2–ErGO–GCE was 18 times higher than that on the bare GCE, because of the synergistic effects of TiO2 and ErGO that enhanced the electrochemical oxidation of tartrazine.
The CV curves of bare and modified GCEs recorded in 1.0 × 10⁻⁵ mol/L of tartrazine solution are presented in Figure 3B. Only the oxidation peak can be observed on all the electrodes, suggesting that the electrochemical oxidation of tartrazine is an irreversible process. The order of peak current for the different electrodes was consistent with the results of SDSLV. As expected, the largest peak current was obtained on the TiO2–ErGO–GCE, further confirming that the synergistic effect of TiO2 and ErGO improved the electrochemical oxidation of tartrazine.

3.3. Optimization of the Detection Conditions of Tartrazine

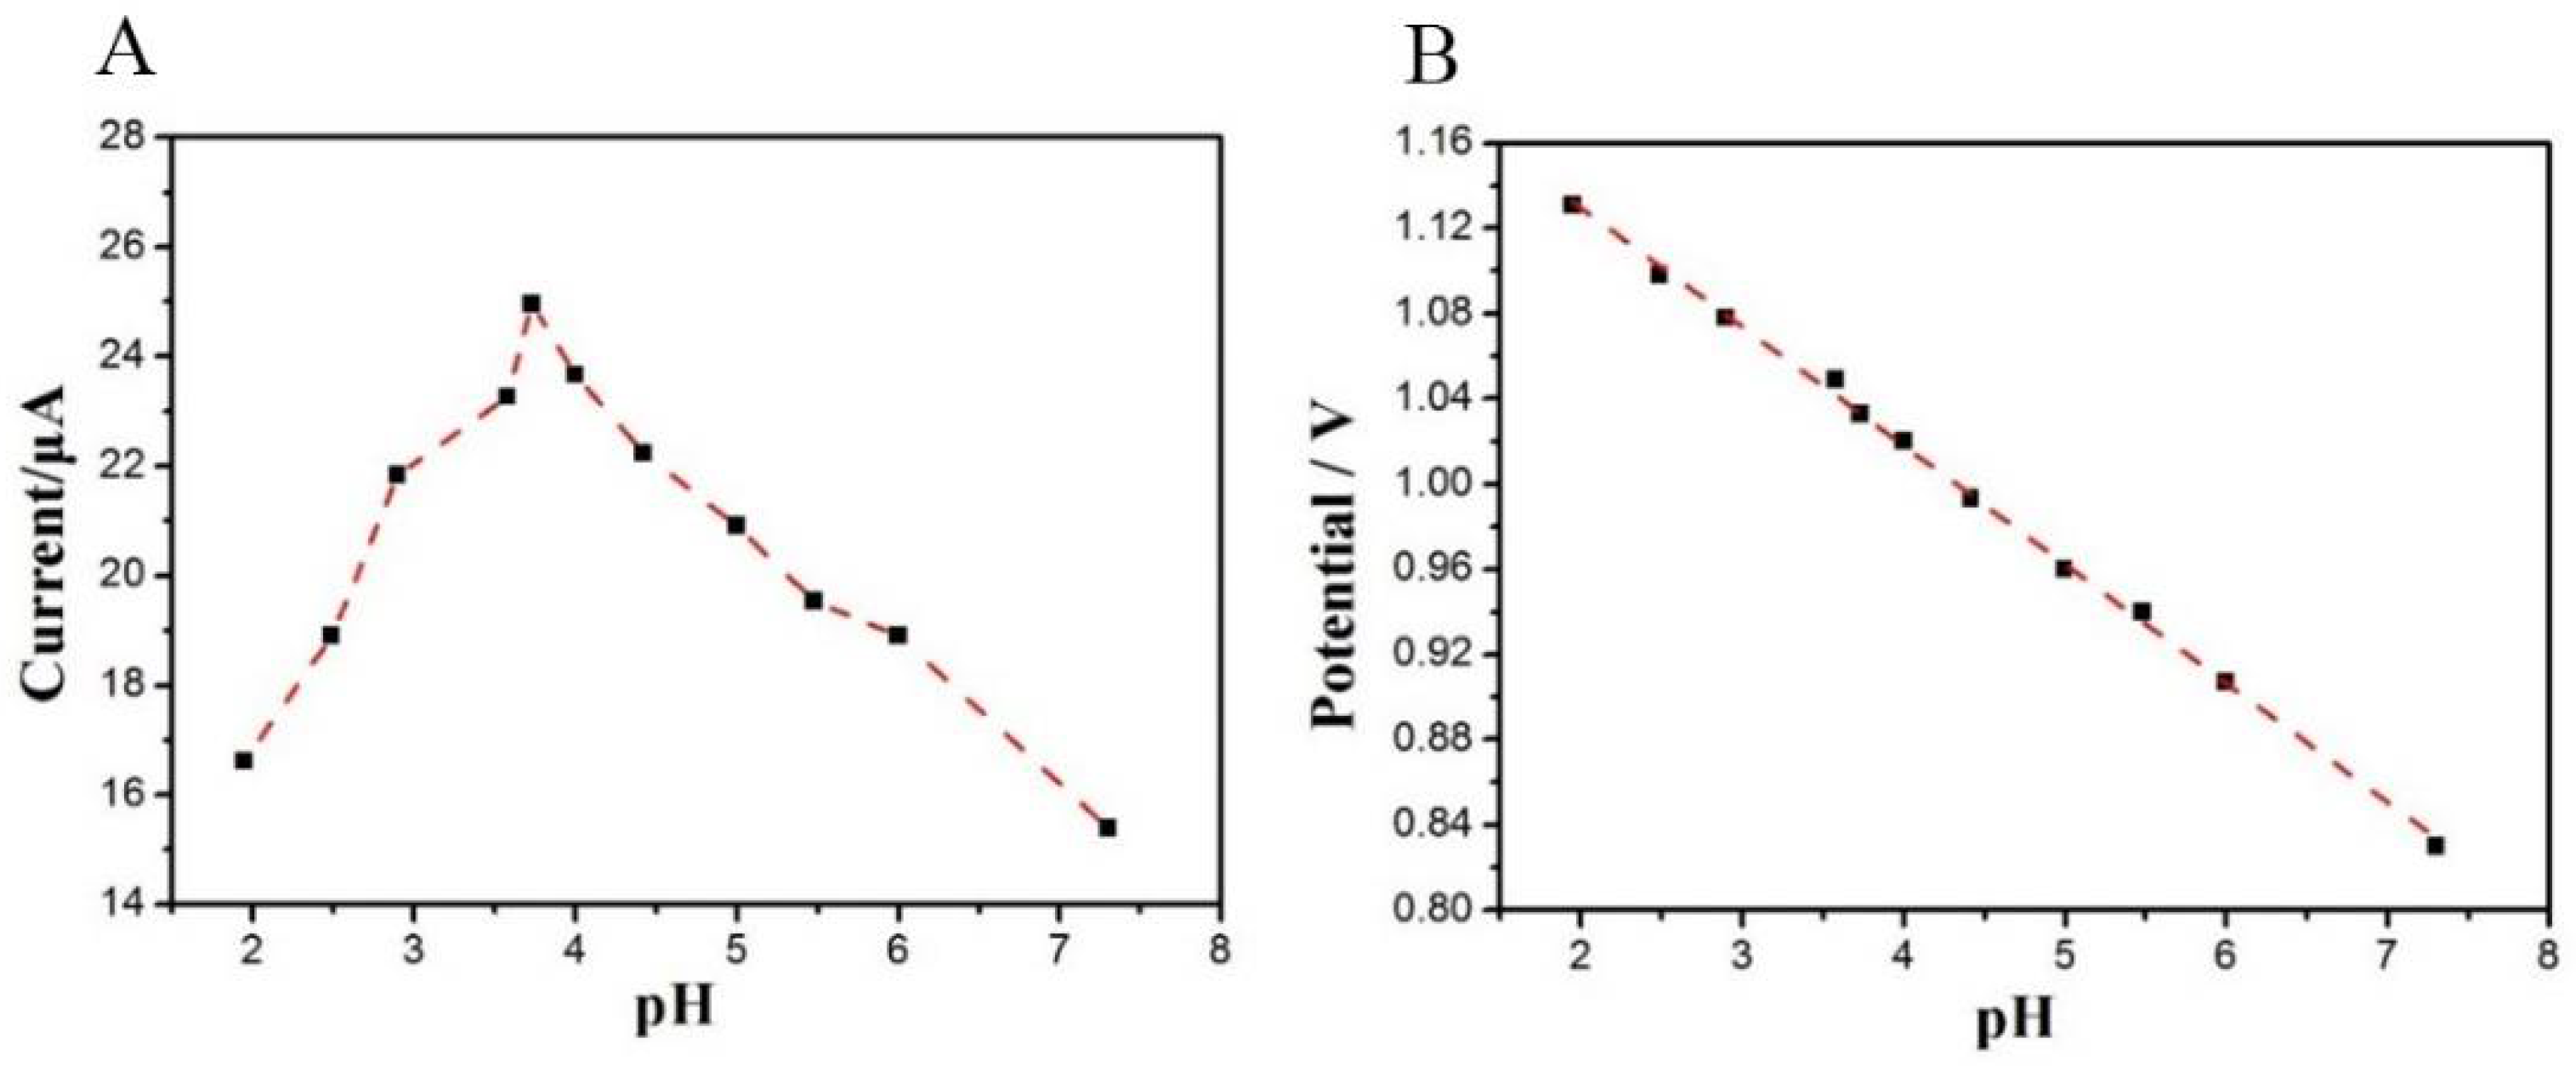
3.3.1. The Influence of pH

Since the pH is an important parameter influencing the electrochemical oxidation of tartrazine, it is important to evaluate the optimal pH value for tartrazine detection. As shown in Figure 4A, the largest current intensity (ipa) of tartrazine was observed when the pH was 3.7. The electro-oxidation of tartrazine was performed better in more acidic media, whereas in neutral to alkaline media, the anodic peak current was considerably decreased. Moreover, the oxidation peak potential Ep is linear to the pH in the pH range of 2.5–7.5 (Figure 4B). The linear equation was Ep = −0.0560 pH + 1.024 (R2 = 0.999), and the slope (−63 mV/pH) was very close to the theoretical value (−59 mV/pH), indicating that the same electron and proton number participate in the electrochemical oxidation process.

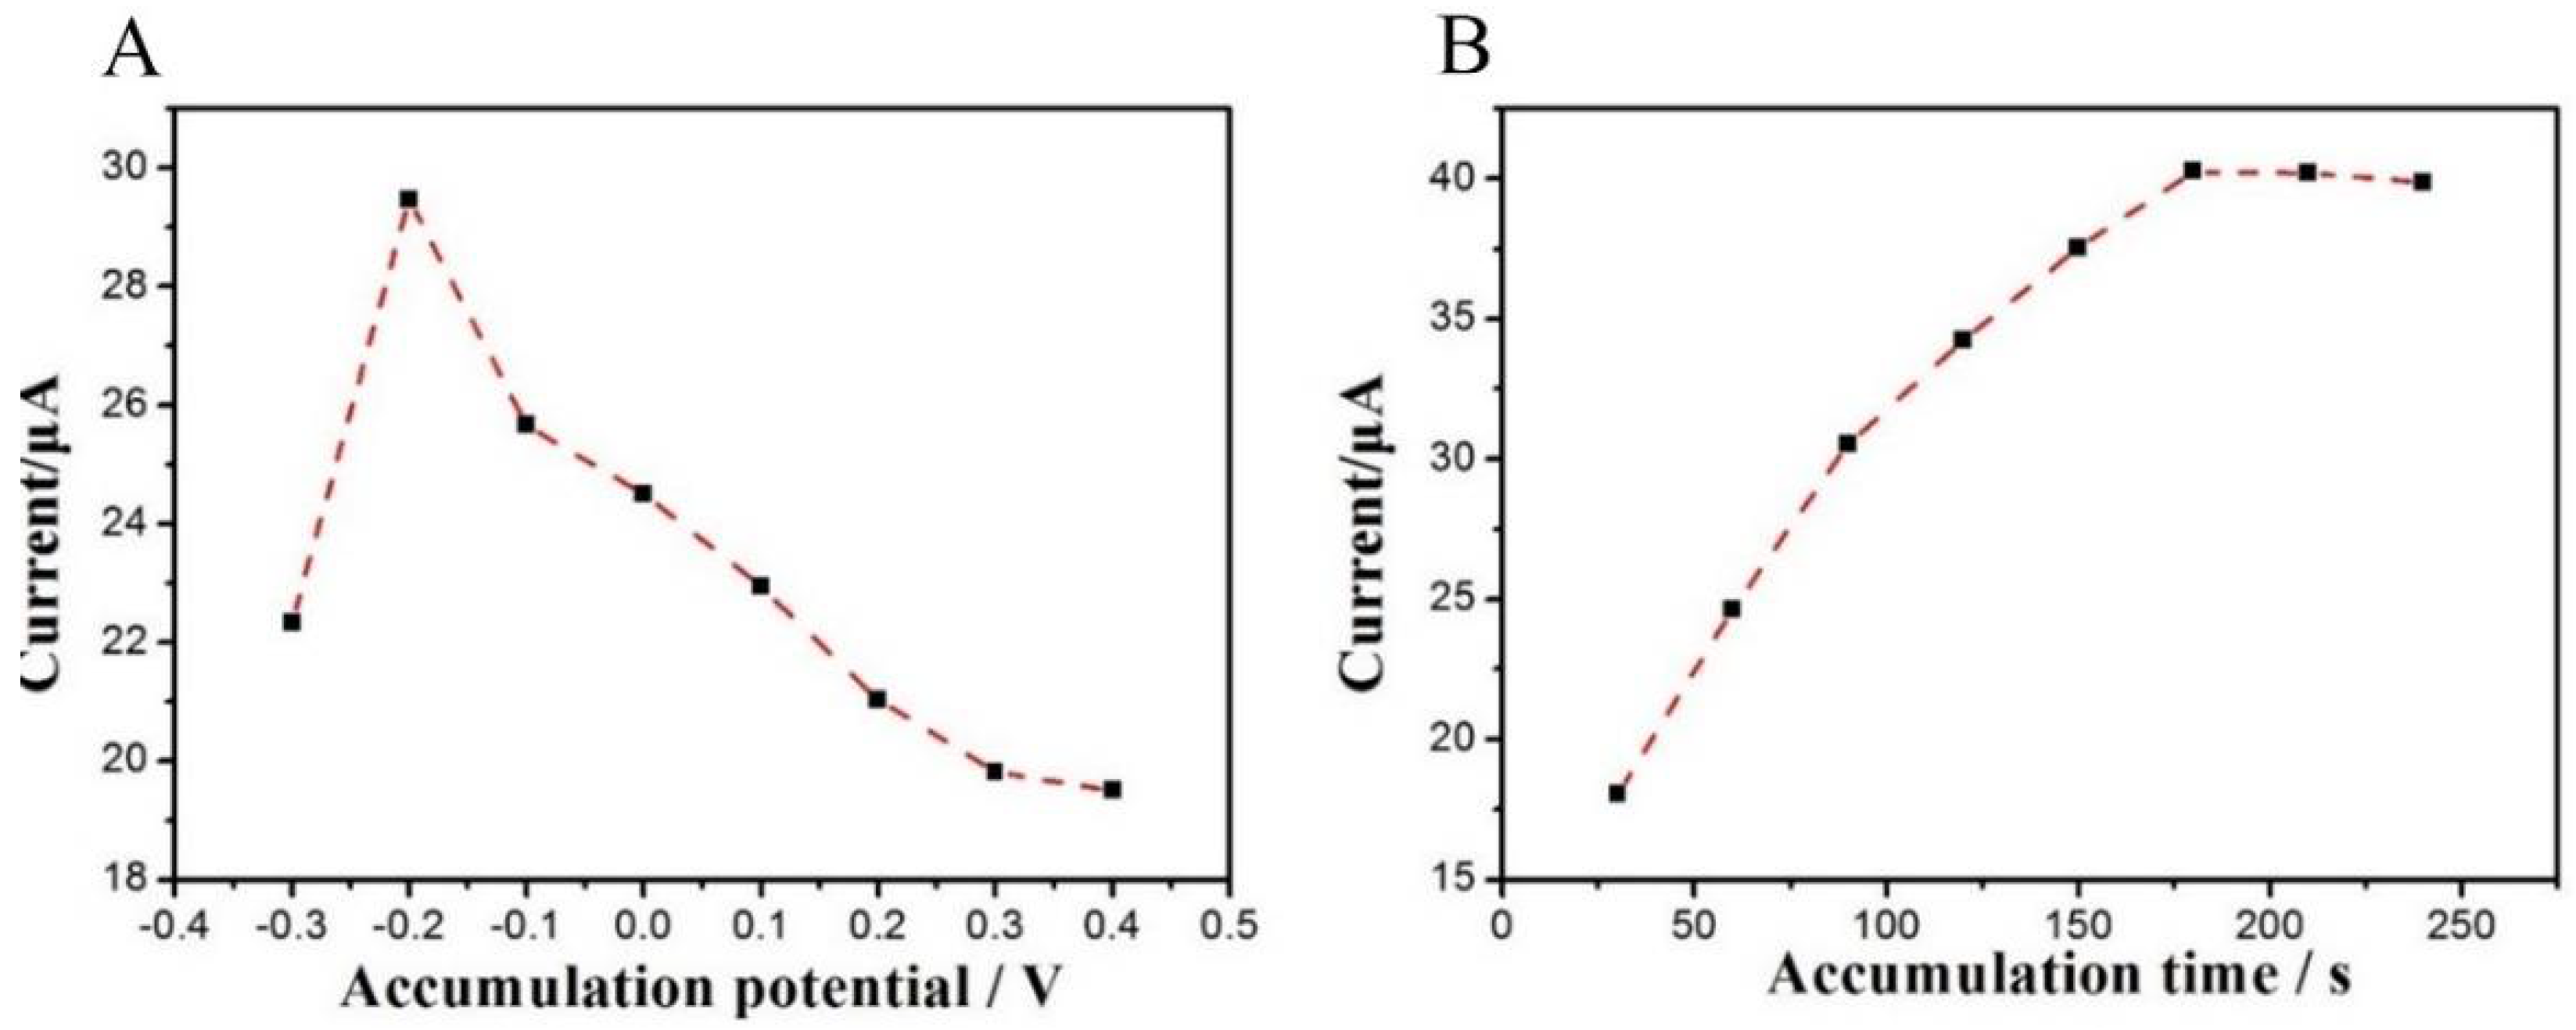
3.3.2. Effect of Accumulation Conditions

Accumulation potential and time are other two important factors that influence the oxidation current of tartrazine. After accumulation for 180 s with different accumulation potentials (−0.3 to 0.4 V), the oxidation peak currents in 1 × 10⁻⁵ mol/L tartrazine were measured. When the accumulation potential was −0.2 V, the largest oxidation peak current was obtained (Figure 5A), indicating that −0.2 V was the best accumulation potential. In addition, the accumulation at −0.2 V for various times was also investigated. As plotted in Figure 5B, the oxidation peak currents increased with the accumulation time between 0 and 180 s. Afterward, the ipa remained stable because of the saturation adsorption of tartrazine on the surface of TiO2–ErGO–GCE. Thus, 180 s was the optimal accumulation time.

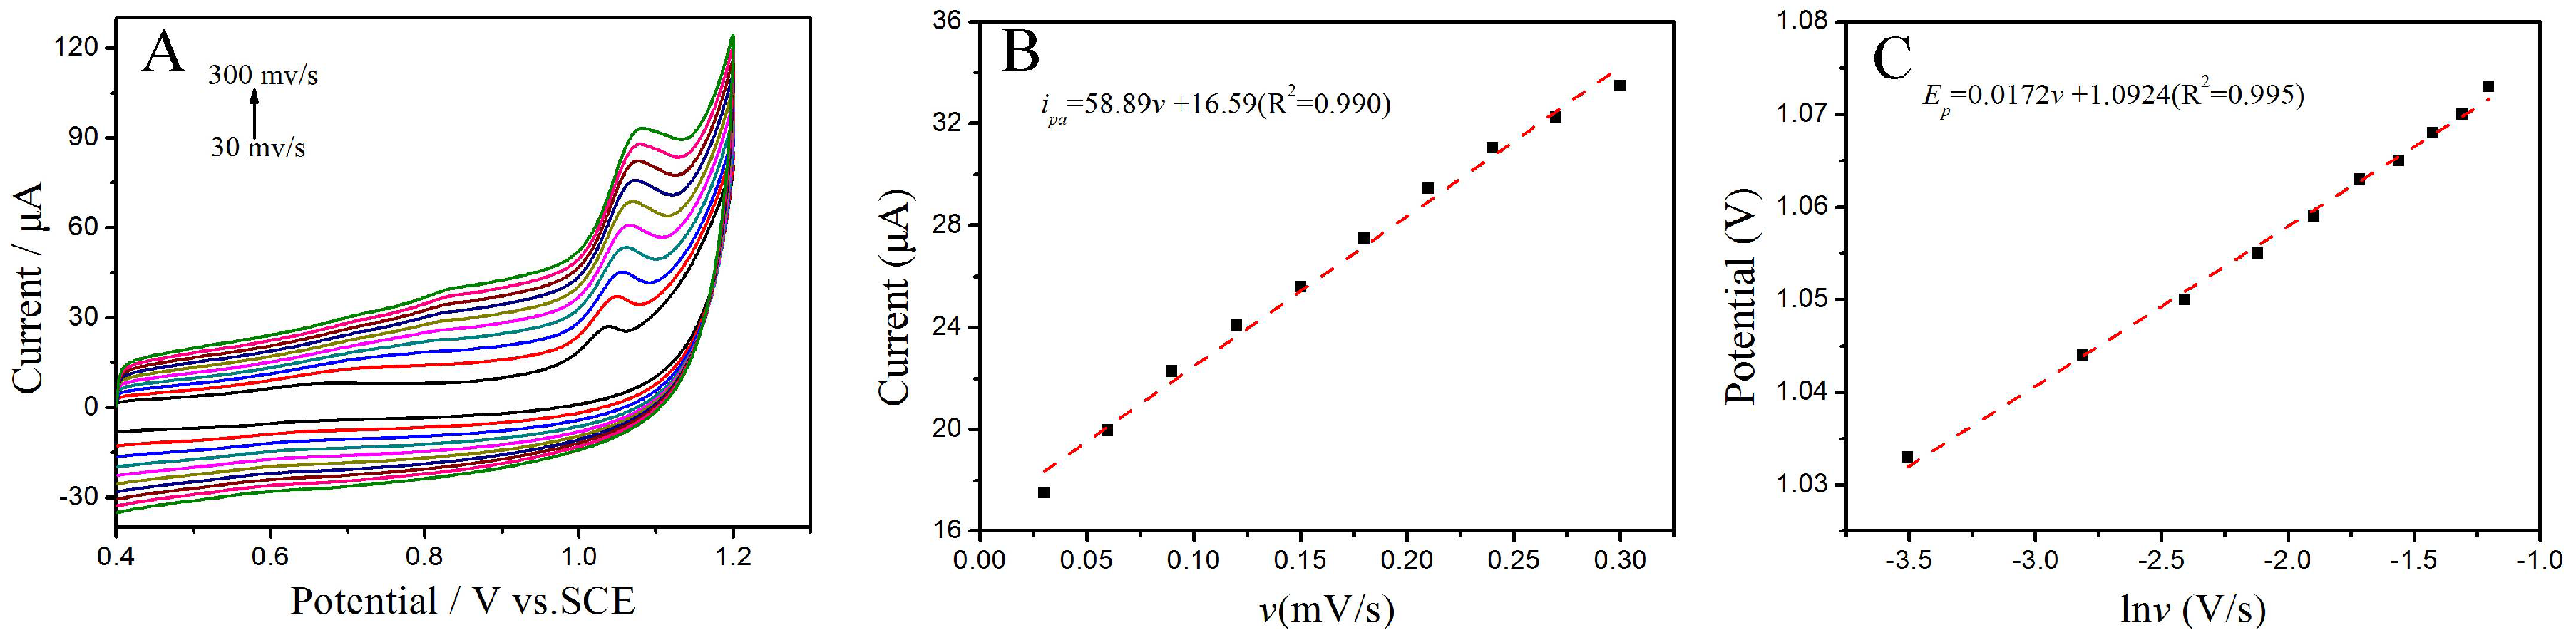
3.3.3. The Influence of the Scan Rate

The electrochemical response of tartrazine is strongly dependent on the scan rate, thus this parameter was also considered. The CVs were scanned at different scan rates (30~300 mV/s) in PBS (0.1 M, pH 3.7) solution containing 1 × 10⁻⁵ mol/L of tartrazine, and the results are presented in Figure 6A. The oxidation peak current increased gradually with the increase of the scan rate. As shown in Figure 6B, a good linear relationship between oxidation peak currents (ipa) and scan rate (v) was obtained, and the corresponding linear equation was ipa = 58.89v + 16.59 (R2 = 0.990). This result indicates that the electrochemical oxidation of tartrazine was an adsorption-controlled process. Thus, the accumulation method was adopted in the subsequent experiments in order to enhance the sensitivity. However, the background currents were also increased correspondingly. Considering the best signal to noise ratio (SNR) and the lowest background current, a suitable scan rate was found to be 100 mV/s.
Furthermore, only a positive oxidation peak potential (Epa) shifts with the rising of the scan rates (v) was observed, meaning that the oxidation process of tartrazine was irreversible. The liner relationship between Epa and the Napierian logarithm of the scan rate (ln v) is also presented (Figure 6C). The linear equation was Epa = 0.0172 ln v + 1.0924 (R2 = 0.995). According to Lavrion equation [33],
E p = E 0 R T α n F [ 0.780 + ln ( D 1 / 2 k 0 ) + ln ( α n F v R T ) 1 / 2 ] = K + R T 2 α n F ln v
where E0′ is the formal potential (V), α is the charge transfer coefficient, n is the electron transfer number, F is the Faraday constant (96,480 C·mol−1), R is the ideal gas constant (8.314 J·mol−1·K−1), T is the Kelvin temperature (K), D is the diffusion coefficient, and k0 is the heterogeneous electron transfer rate. The value of α is always supposed to be 0.5 in an irreversible process, and the n value is calculated as 1. Thus, the oxidation of tartrazine is an irreversible process with one electron and one proton. This result is consistent with those of a previous report [34]. The electrochemical oxidation mechanism of tartrazine is summarized in Figure 7.

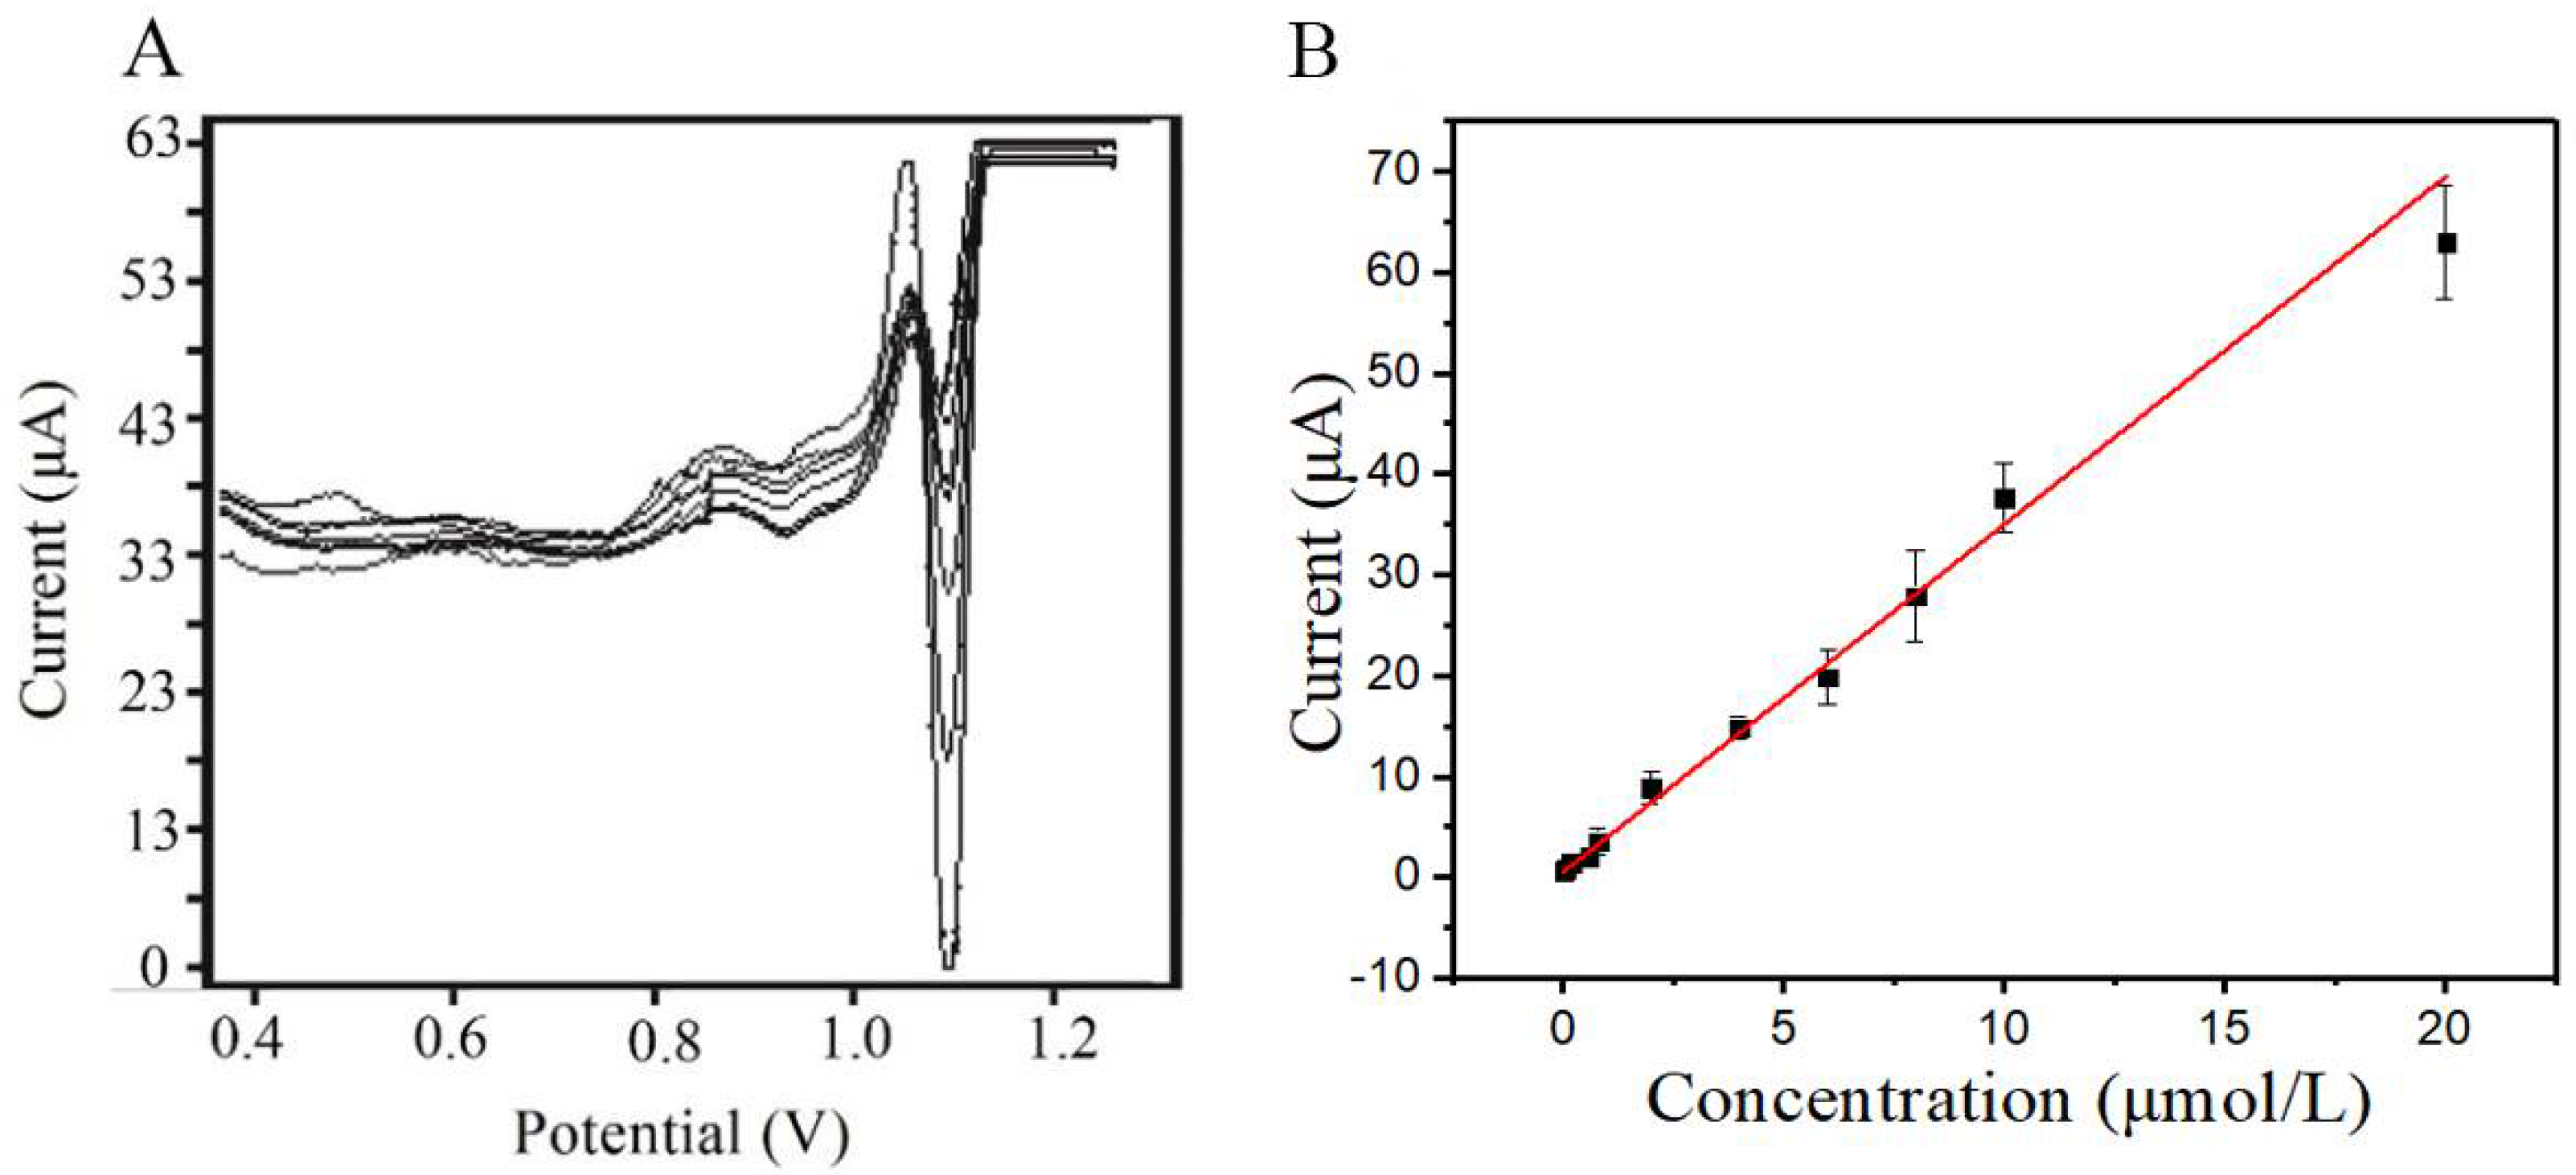
3.3.4. Calibration Curve and Detection Limit

Under the optimal detection conditions, the SDLSV response of tartrazine at various concentration (range of 2.0 × 10⁻⁸–2.0 × 10⁻⁵ mol/L) was measured, and the results are presented in Figure 8A. With the increase of tartrazine concentration, the peak currents ipa were enhanced linearly. Moreover, the linear relationship between the peak currents ipa and the concentration of tartrazine was calculated as ipa (μA) = 3.450c (μmol/L) + 0.486 (R2 = 0.991, with a standard error of slope: 0.104 and standard error of intercept: 0.0704) (Figure 8B); the detection limit (S/N = 3) was calculated as 8.0 × 10⁻⁹ mol/L. This results were comparable and even better than those reported in the literature [35,36].

3.4. Interference Studies

The interference studies on species and other food colorants coexistent with tartrazine was also investigated. Different kinds of interfering species were added into 0.45 mol/L PBS (pH 3.7) containing 1.0 × 10⁻⁵ mol/L of tartrazine, and the peak currents were tested and compared. The peak currents ipa of 10 μmol/L of tartrazine in the presence of interferents are listed in Table 1. Under an acceptable error range, 100-times higher (than the concentration of tartrazine) concentrations of glucose, benzoic acid, citric acid, Na+, K+, and Fe3+, and 10-times higher concentrations of sunset yellow and amaranth did not interfere with the detection of tartrazine. Moreover, the peak currents intensities of tartrazine under the influence of interferents were still similar to those of pure Ttrtrazine, meaning that no oxidation peaks of the interfering species appeared or that the oxidation peaks separated well from those of tartrazine. This indicates that the TiO2–ErGO–GCE showed superior anti-interference performance and presents great prospects for the detection of tartrazine in various real samples. It is noteworthy that the oxidation peaks of sunset yellow and amaranth did not overlay with those of tartrazine, in spite of their similar structure. Hence, the TiO2–ErGO–GCE shows great potential for the simultaneous detection of tartrazine, sunset yellow, and amaranth. This work will be carried out in the future.

3.5. Reproducibility of the Detection

Under the optimal detection conditions, tartrazine standard solutions (1.0 × 10⁵ mol/L) were detected for seven times by using the same TiO2–ErGO–GCE as the work electrode. After every test, the electrode was washed in 0.1 mol/L of nitric acid for two times under cyclic voltammetry. The reproducibility results are listed in Table 2. The relative standard deviation (RSD) was 0.45%, indicating that the TiO2–ErGO–GCE exhibited good reproducibility for tartrazine detection.

3.6. Real Sample Detection

SDLSV shows high resolution and sensitivity in electrochemical analyses, thus it is widely applied in food additives detection. In this section, this method was used to analyze carbonated beverage samples. These carbonated beverage samples at various concentration were measured by using SDLSV under the optimal conditions. A shown inn Table 3, the concentration of tartrazine detected in samples 1–3 were 0.2, 2.24, and 4.26, respectively, which were well consistent with the standard values. Moreover, the corresponding RSD was 1.05–2.32%, and the recovery rate of the samples 2 and 3 was 112.0% and 106.5%, respectively. These results indicate that the TiO2–ErGO-GCE could be an efficient system for tartrazine detection in carbonate beverage samples.

4. Conclusions

In summary, a TiO2–ErGO–GCE was successfully fabricated by hydrothermal and electrochemical reduction and it was used for practical tartrazine detection. After electrochemical reduction, the TiO2 NPs were coated by ErGO. The oxidation peak current on the TiO2–ErGO–GCE increased to 26.98 μA, which was 18 times higher than that on the bare GCE. Moreover, the electrochemical results revealed that the electrochemical oxidation of tartrazine is an adsorption-controlled process with one electron and one proton. A wide linear range (from 2 × 10⁻⁸ mol/L to 2 × 10⁻⁵ mol/L) and a low detection limit (S/N = 3) of 8.0 × 10⁻⁹ mol/L were also obtained with the TiO2–ErGO–GCE. Finally, in practice, the TiO2–ErGO–GCE also showed a good detection sensitivity in the detection of tartrazine in a carbonated beverage. This detection system shows great application prospects for the sensitive detection of food additives in real samples, due to its prominent advantages including facile fabrication, rapid response, good selectivity, low detection limit, and wide linear range of detection.

Author Contributions

Q.H., P.D., and D.C. conceived and designed the experiments; J.L., X.L., and L.J. performed the experiments; G.L. and X.L. analyzed the data; Q.H. and D.C. contributed reagents/materials/analysis tools; J.L. and G.L. wrote the paper.

Acknowledgments

This work was supported by the NSFC (61703152), Hunan Provincial Natural Science Foundation (2016JJ4010, 2018JJ3134), Doctoral Program Construction of Hunan University of Technology, Project of Science and Technology Department of Hunan Province (GD16K02), Project of Science and Technology Plan in Zhuzhou (201706-201806) and Opening Project of Key Discipline of Materials Science in Guangdong (CNXY2017001, CNXY2017002 and CNXY2017003).

Conflicts of Interest

The authors declare no conflict of interest.

References

  1. Llamas, N.E.; Garrido, M.; Nezio, M.S.D.; Band, B.S.F. Second order advantage in the determination of amaranth, sunset yellow FCF and tartrazine by UV–vis and multivariate curve resolution-alternating least squares. Anal. Chim. Acta 2009, 655, 38–42. [Google Scholar] [CrossRef] [PubMed]
  2. Nevado, J.J.B.; Flores, J.R.; Llerena, M.J.V. Adsorptive stripping voltammetry of Tartrazine at the hanging mercury drop electrode in soft drinks. Fresenius J. Anal. Chem. 1997, 357, 989–994. [Google Scholar] [CrossRef]
  3. Vidotti, E.C.; Costa, W.F.; Oliveira, C.C. Development of a green chromatographic method for determination of colorants in food samples. Talanta 2006, 68, 516–521. [Google Scholar] [CrossRef] [PubMed]
  4. Majidi, M.R.; Pournaghi-Azar, M.H.; Baj, R.F.B.; Naseri, A. Formation of graphene nanoplatelet-like structures on carbon–ceramic electrode surface: Application for simultaneous determination of sunset yellow and tartrazine in some food samples. Ionics 2015, 21, 863–875. [Google Scholar] [CrossRef]
  5. Ma, M.; Luo, X.; Chen, B.; Su, S.; Yao, S. Simultaneous determination of water-soluble and fat-soluble synthetic colorants in foodstuff by high-performance liquid chromatography-diode array detection-electrospray mass spectrometry. J. Chromatogr. A 2006, 1103, 170–176. [Google Scholar] [CrossRef] [PubMed]
  6. Pan, X.; Qin, P.; Liu, R.; Wang, J. Characterizing the Interaction between Tartrazine and Two Serum Albumins by a Hybrid Spectroscopic Approach. J. Agric. Food Chem. 2011, 59, 6650–6656. [Google Scholar] [CrossRef] [PubMed]
  7. Jager, A.V.; Tonin, F.G.; Tavares, M.F.M. Optimizing the separation of food dyes by capillary electrophoresis. J. Sep. Sci. 2005, 28, 957–965. [Google Scholar] [CrossRef] [PubMed]
  8. Huang, S.T.; Shi, Y.; Li, N.B.; Luo, H.Q. Sensitive turn-on fluorescent detection of tartrazine based on fluorescence resonance energy transfer. Chem. Commun. 2012, 48, 747–749. [Google Scholar] [CrossRef] [PubMed]
  9. Xu, H.; Yang, X.; Li, G.; Zhao, C.; Liao, X. Green Synthesis of Fluorescent Carbon Dots for Selective Detection of Tartrazine in Food Samples. J. Agric. Food Chem. 2015, 63, 6707–6714. [Google Scholar] [CrossRef] [PubMed]
  10. Lei, Y.; Zhang, S.; Fang, L.; Hamid Akash, M.S.; Shi, W.; Sun, K.; Xu, Y.; Chen, S. A sensitive and specific enzyme immunoassay for detecting tartrazine in human urinary samples. Anal. Methods 2013, 5, 925–930. [Google Scholar] [CrossRef]
  11. Zhang, W.; Liu, T.; Zheng, X.; Huang, W.; Wan, C. Surface-enhanced oxidation and detection of Sunset Yellow and Tartrazine using multi-walled carbon nanotubes film-modified electrode. Colloids Surf. B Biointerfaces 2009, 74, 28–31. [Google Scholar] [CrossRef] [PubMed]
  12. Wang, M.; Gao, Y.; Sun, Q.; Zhao, J. Sensitively Simultaneous Determination of Sunset Yellow and Tartrazine in Foods Based on Polypyrrole Modified Oxidized Single-Walled Carbon Nanotubes. J. Electrochem. Soc. 2014, 161, B297–B304. [Google Scholar] [CrossRef]
  13. Sierra-Rosales, P.; Toledo-Neira, C.; Squella, J.A. Electrochemical determination of food colorants in soft drinks using MWCNT-modified GCEs. Sens. Actuators B Chem. 2017, 240, 1257–1264. [Google Scholar] [CrossRef]
  14. Chang, M.; Hu, H.; Zhang, Y.; Chen, D.; Wu, L.; Li, X. Improving Visible Light-Absorptivity and Photoelectric Conversion Efficiency of a TiO2 Nanotube Anode Film by Sensitization with Bi2O3 Nanoparticles. Nanomaterials 2017, 7, 104. [Google Scholar] [CrossRef] [PubMed]
  15. Deng, K.; Li, C.; Li, X.; Huang, H. Simultaneous detection of sunset yellow and tartrazine using the nanohybrid of gold nanorods decorated graphene oxide. J. Electroanal. Chem. 2016, 780, 296–302. [Google Scholar] [CrossRef]
  16. Jing, Z.; Xue, W.; Zhang, S.; Wang, W.; Hojo, M.; Chen, Z. An Electrochemical Sensor for Simultaneous Determination of Ponceau 4R and Tartrazine Based on an Ionic Liquid Modified Expanded Graphite Paste Electrode. J. Electrochem. Soc. 2014, 161, H453–H457. [Google Scholar]
  17. Raccichini, R.; Varzi, A.; Passerini, S.; Scrosati, B. The role of graphene for electrochemical energy storage. Nat. Mater. 2014, 14, 271. [Google Scholar] [CrossRef] [PubMed]
  18. Pattar, V.P.; Nandibewoor, S.T. Selective and Sensitive Electro Chemical Determination of D-Cycloserine Using Graphene Paste Sensor and its Application Studies. Anal. Chem. Lett. 2016, 6, 478–491. [Google Scholar] [CrossRef]
  19. He, Q.; Liu, J.; Liu, X.; Li, G.; Deng, P.; Liang, J. Preparation of Cu2O-Reduced Graphene Nanocomposite Modified Electrodes towards Ultrasensitive Dopamine Detection. Sensors 2018, 18, 199. [Google Scholar] [CrossRef] [PubMed]
  20. He, Q.; Liu, J.; Liu, X.; Li, G.; Chen, D.; Deng, P.; Liang, J. Fabrication of Amine-Modified Magnetite-Electrochemically Reduced Graphene Oxide Nanocomposite Modified Glassy Carbon Electrode for Sensitive Dopamine Determination. Nanomaterials 2018, 8, 194. [Google Scholar] [CrossRef] [PubMed]
  21. Deng, P.; Xu, Z.; Zeng, R.; Ding, C. Electrochemical behavior and voltammetric determination of vanillin based on an acetylene black paste electrode modified with graphene–polyvinylpyrrolidone composite film. Food Chem. 2015, 180, 156–163. [Google Scholar] [CrossRef] [PubMed]
  22. Li, S.S.; Zhou, W.Y.; Jiang, M.; Guo, Z.; Liu, J.H.; Zhang, L.; Huang, X.J. Surface Fe(II)/Fe(III) Cycle Promoted Ultra-Highly Sensitive Electrochemical Sensing of Arsenic(III) with Dumbbell-Like Au/Fe3O4 Nanoparticles. Anal. Chem. 2018, 90, 4569–4577. [Google Scholar] [CrossRef] [PubMed]
  23. Shetti, N.P.; Nayak, D.S.; Kuchinad, G.T.; Naik, R.R. Electrochemical behavior of thiosalicylic acid at γ-Fe2O3 nanoparticles and clay composite carbon electrode. Electrochim. Acta 2018, 269, 204–211. [Google Scholar] [CrossRef]
  24. Dong, S.; Xi, J.; Wu, Y.; Liu, H.; Fu, C.; Liu, H.; Xiao, F. High loading MnO2 nanowires on graphene paper: Facile electrochemical synthesis and use as flexible electrode for tracking hydrogen peroxide secretion in live cells. Anal. Chim. Acta 2015, 853, 200–206. [Google Scholar] [CrossRef] [PubMed]
  25. Su, Y.; Guo, H.; Wang, Z.; Long, Y.; Li, W.; Tu, Y. Au@Cu2O core-shell structure for high sensitive non-enzymatic glucose sensor. Sens. Actuators B Chem. 2018, 255, 2510–2519. [Google Scholar] [CrossRef]
  26. Liu, J.; Yang, S.; Wu, W.; Tian, Q.; Cui, S.; Dai, Z.; Ren, F.; Xiao, X.; Jiang, C. 3D Flowerlike α-Fe2O3@TiO2 Core–Shell Nanostructures: General Synthesis and Enhanced Photocatalytic Performance. ACS Sustain. Chem. Eng. 2015, 3, 2975–2984. [Google Scholar] [CrossRef]
  27. Lee, A.; Libera, J.A.; Waldman, R.Z.; Ahmed, A.; Avila, J.R.; Elam, J.W.; Darling, S.B. Conformal Nitrogen-Doped TiO2 Photocatalytic Coatings for Sunlight-Activated Membranes. Adv. Sustain. Syst. 2017, 1, 1600041. [Google Scholar] [CrossRef]
  28. Zhou, D.; Dong, S.; Shi, J.; Cui, X.; Ki, D.; Torres, C.I.; Rittmann, B.E. Intimate coupling of an N-doped TiO2 photocatalyst and anode respiring bacteria for enhancing 4-chlorophenol degradation and current generation. Chem. Eng. J. 2017, 317, 882–889. [Google Scholar] [CrossRef]
  29. Arkan, E.; Paimard, G.; Moradi, K. A novel electrochemical sensor based on electrospun TiO2 nanoparticles/carbon nanofibers for determination of Idarubicin in biological samples. J. Electroanal. Chem. 2017, 801, 480–487. [Google Scholar] [CrossRef]
  30. Deng, P.; Fei, J.; Feng, Y. Sensitive voltammetric determination of tryptophan using an acetylene black paste electrode modified with a Schiff’s base derivative of chitosan. Analyst 2011, 136, 5211–5217. [Google Scholar] [CrossRef] [PubMed]
  31. Chen, N.; Li, Y.; Deng, D.; Liu, X.; Xing, X.; Xiao, X.; Wang, Y. Acetone sensing performances based on nanoporous TiO2 synthesized by a facile hydrothermal method. Sens. Actuators B Chem. 2017, 238, 491–500. [Google Scholar] [CrossRef]
  32. Hummers, W.S.; Offeman, R.E. Preparation of Graphitic Oxide. J. Am. Chem. Soc. 1958, 80, 1339. [Google Scholar] [CrossRef]
  33. Hu, H.; Chang, M.; Zhang, M.; Wang, X.; Chen, D. A new insight into PAM/graphene-based adsorption of water-soluble aromatic pollutants. J. Mater. Sci. 2017, 52, 8650–8664. [Google Scholar] [CrossRef]
  34. Wang, Z.; Zhang, H.; Wang, Z.; Zhang, J.; Duan, X.; Xu, J.; Wen, Y. Trace analysis of Ponceau 4R in soft drinks using differential pulse stripping voltammetry at SWCNTs composite electrodes based on PEDOT:PSS derivatives. Food Chem. 2015, 180, 186–193. [Google Scholar] [CrossRef] [PubMed]
  35. Zhao, L.; Zeng, B.; Zhao, F. Electrochemical determination of Tartrazine using a molecularly imprinted polymer–multiwalled carbon nanotubes-ionic liquid supported Pt nanoparticles composite film coated electrode. Electrochim. Acta 2014, 146, 611–617. [Google Scholar] [CrossRef]
  36. Song, X.; Shi, Z.; Tan, X.; Zhang, S.; Liu, G.; Wu, K. One-step solvent exfoliation of graphite to produce a highly-sensitive electrochemical sensor for tartrazine. Sens. Actuators B Chem. 2014, 197, 104–108. [Google Scholar] [CrossRef]
Figure 1. The TEM images of TiO2 (A) and TiO2–graphene oxide (GO) (B); The XRD pattern of TiO2 nanoparticles (NPs) (C).
Sensors 18 01911 g001
Figure 2. Cyclic voltammograms of bare glassy carbon electrode (GCE), GO–GCE, reduced graphene oxide-modified GCEs (ErGO–GCE), andTiO2–ErGO–GCE in 2.5 × 10⁻³ mol/L [Fe(CN)6]3−/4− solution.
Sensors 18 01911 g002
Figure 3. Second-order derivative linear sweep voltammetry (SDLSV) (A) and cyclic voltammetry (CV) (B) of 1.0 × 10⁻⁵ mol/L tartrazine on different electrodes (a: GCE; b: GO–GCE; c: TiO2–GO–GCE; d: ErGO–GCE; e: TiO2–ErGO–GCE).
Sensors 18 01911 g003
Figure 4. (A) Influence of pH on the oxidation peak currents in a 1.0 × 10⁻⁵ mol/L tartrazine solution on the TiO2–ErGO–GCE; (B) The linear plot of tartrazine oxidation peak potential and pH.
Sensors 18 01911 g004
Figure 5. Effects of accumulation potential (A) and accumulation time (B) on the oxidation peak currents of 1.0 × 10⁻⁵ mol/L Tartrazine at TiO2–ErGO–GCE.
Sensors 18 01911 g005
Figure 6. (A) CVs of 1.0 × 10⁻⁵ mol/L tartrazine on the TiO2–ErGO–GCE at different scan rates; (B) Relationship between oxidation peak current and scan rate; (C) Relationship between peak potential and the Napierian logarithm of the scan rate. Saturated calomel electrode (SCE).
Sensors 18 01911 g006
Figure 7. The mechanism of the electrochemical oxidation of tartrazine on the TiO2–ErGO–GCE.
Sensors 18 01911 g007
Figure 8. (A) SDLSV of different concentrations of tartrazine on the TiO2–ErGO–GCE; linear curve representing the relationship between oxidation peak current and concentrations of tartrazine in the range of 2.0 × 10⁻⁸–2.0 × 10⁻⁵ mol/L (B).
Sensors 18 01911 g008
Table 1. The influence of different interferents on the detection ability of tartrazine by TiO2–ErGO–GCE.
InterferentsPeak Currents ipa (μA)
Without interferents (10 μmol/L of tartrazine)36.73
Glucose (100-times concentration)36.80
Benzoic acid (100-times concentration)36.30
Citric acid (100-times concentration)36.27
Na+ (100-times concentration)36.69
K+ (100-times concentration)36.75
Fe3+ (100-times concentration)36.71
Amaranth (10-times concentration)36.54
Sunset yellow (10-times concentration)36.60
Table 2. The reproducibility of TiO2–ErGO–GCE determination of tartrazine.
No.1234567
ipa/μA36.8237.5236.9937.2037.0036.9536.98
Average value/μA37.06
RSD/%0.45
Table 3. The results of the determination of tartrazine in a soft drink at different adding concentrations (n = 3).
No.Added/(μmol/L)Total Found/(μmol/L)Recovery (%)RSD/(%)
10.202.32
222.24112.01.05
344.26106.51.50

