Real-Life/Real-Time Elderly Fall Detection with a Triaxial Accelerometer


Abstract
:1. Introduction
2. Materials
- Individual activities: Six young adults (subjects SA03, SA04, SA05, SA06, SA09, and SA21) and one elderly person (subject SE06) performed again three trials of all activities in SisFall (except for D17, getting in and out of a car, due to logistic issues).
- On-line uncontrolled tests: We gave the device to three elderly participants that were not part of the SisFall dataset. They were independent and healthy. Table 1 shows their gender, age, height, and weight. The subjects used the device permanently for several days, except while sleeping and showering (as the device is not waterproof yet). We used three devices to guarantee the integrity of the system.
3. Methods
3.1. Pre-Processing Stage
3.2. Feature Extraction
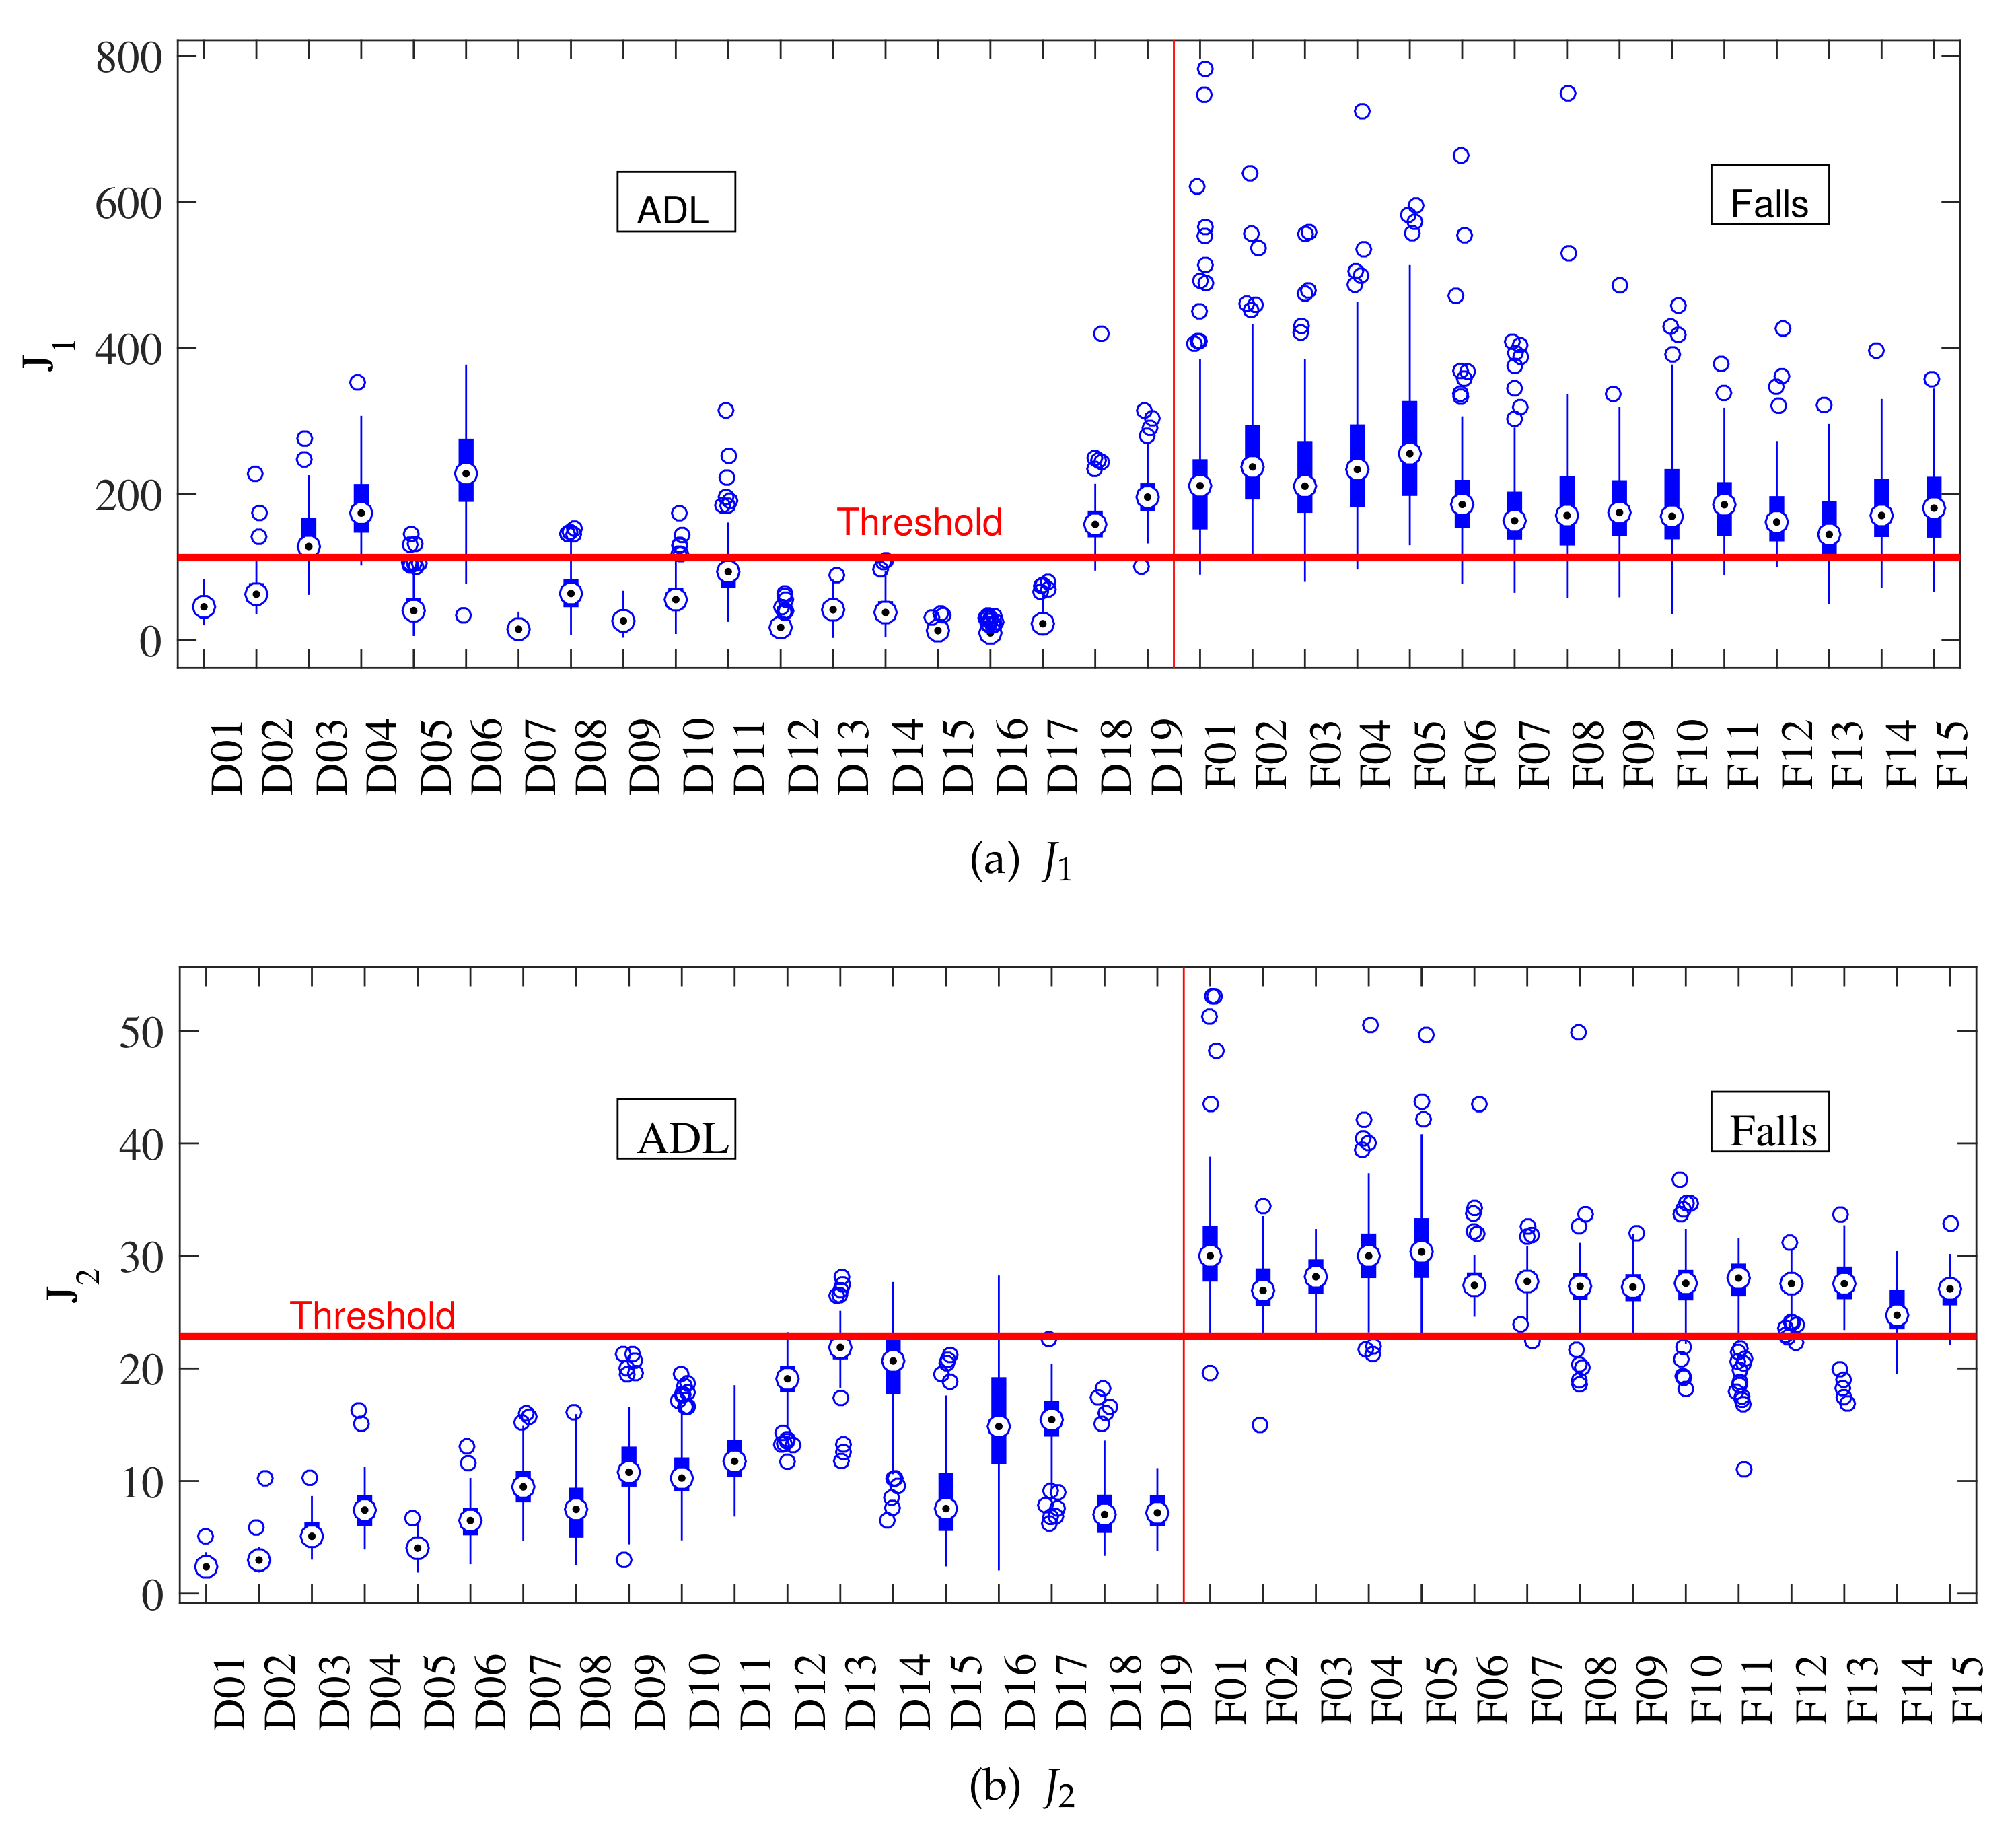
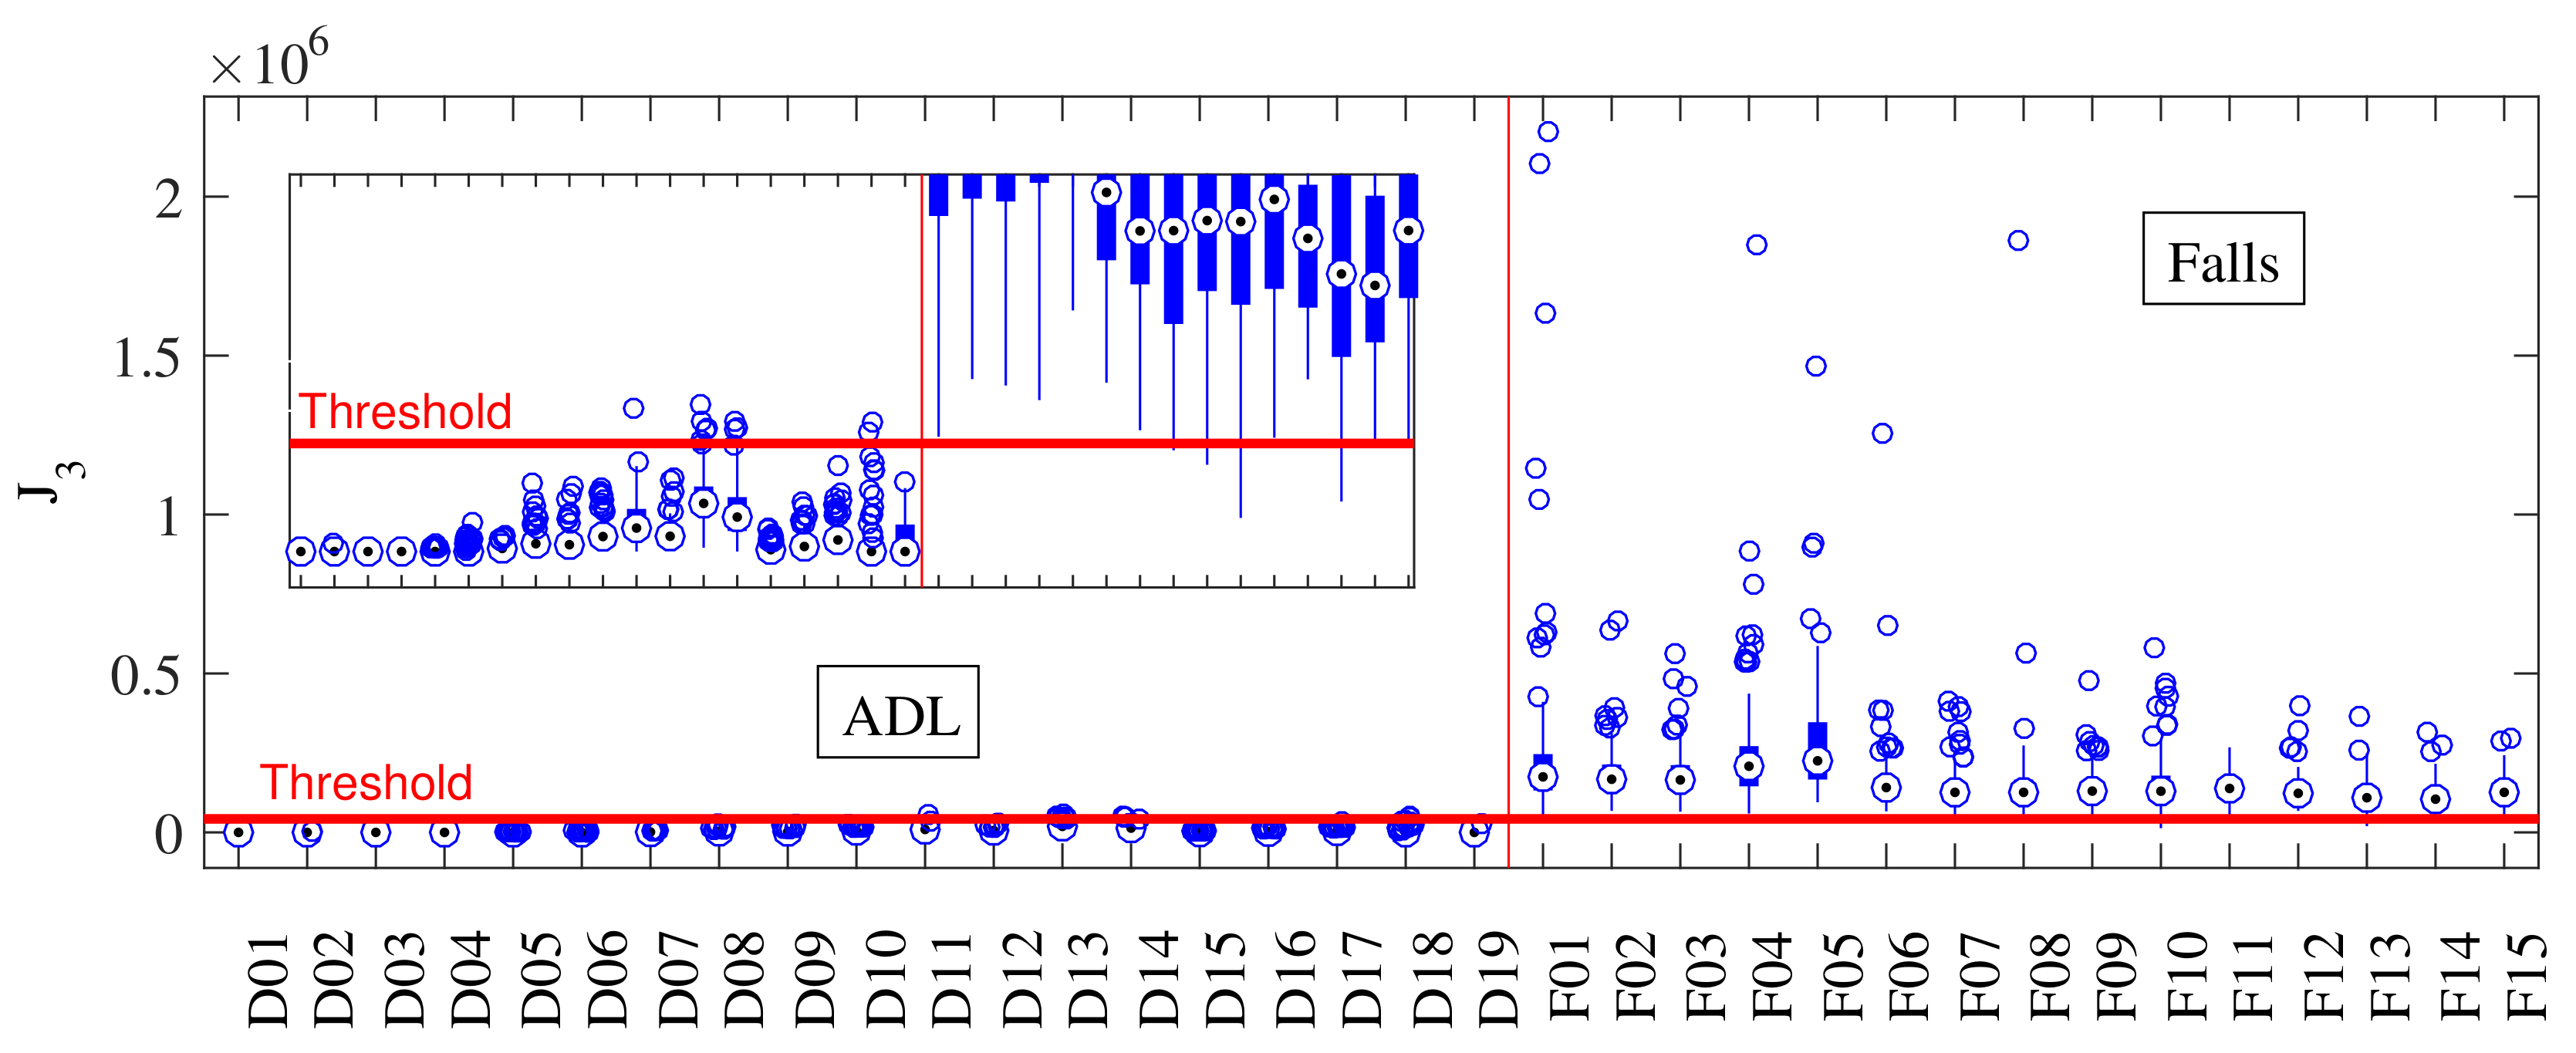
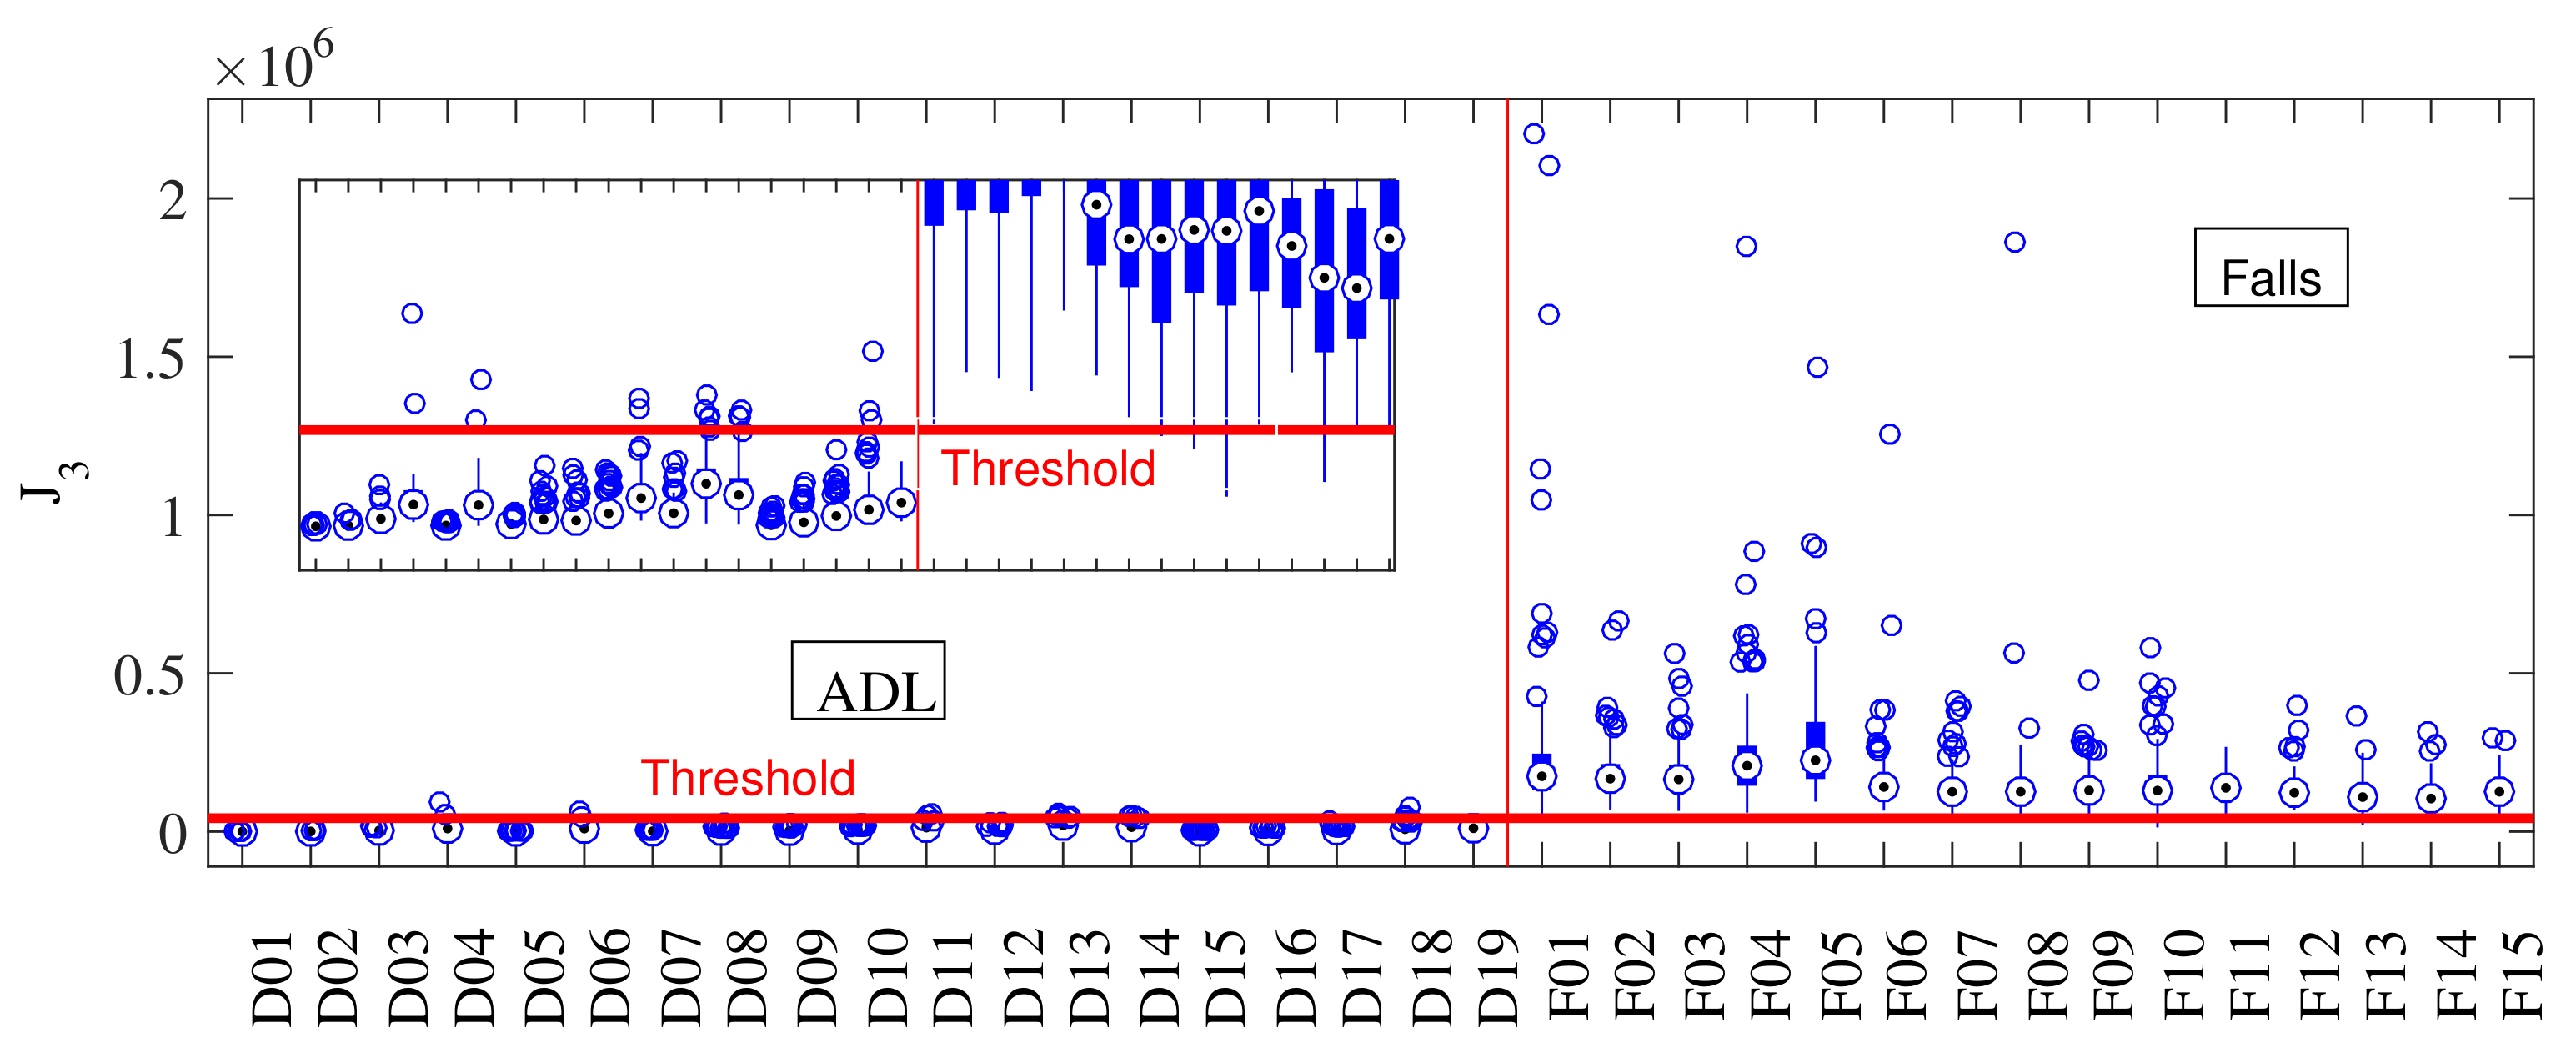
- Generate an ADL/fall box-plot for each candidate feature, as shown in Figure 4a,b.
- For each feature, draw a threshold computed following the maximum accuracy of the feature.
- From visual inspection, select those features that fail in separated activities.
- Multiply the selected features. Test with and without the square of the most accurate feature and select the option with higher performance.
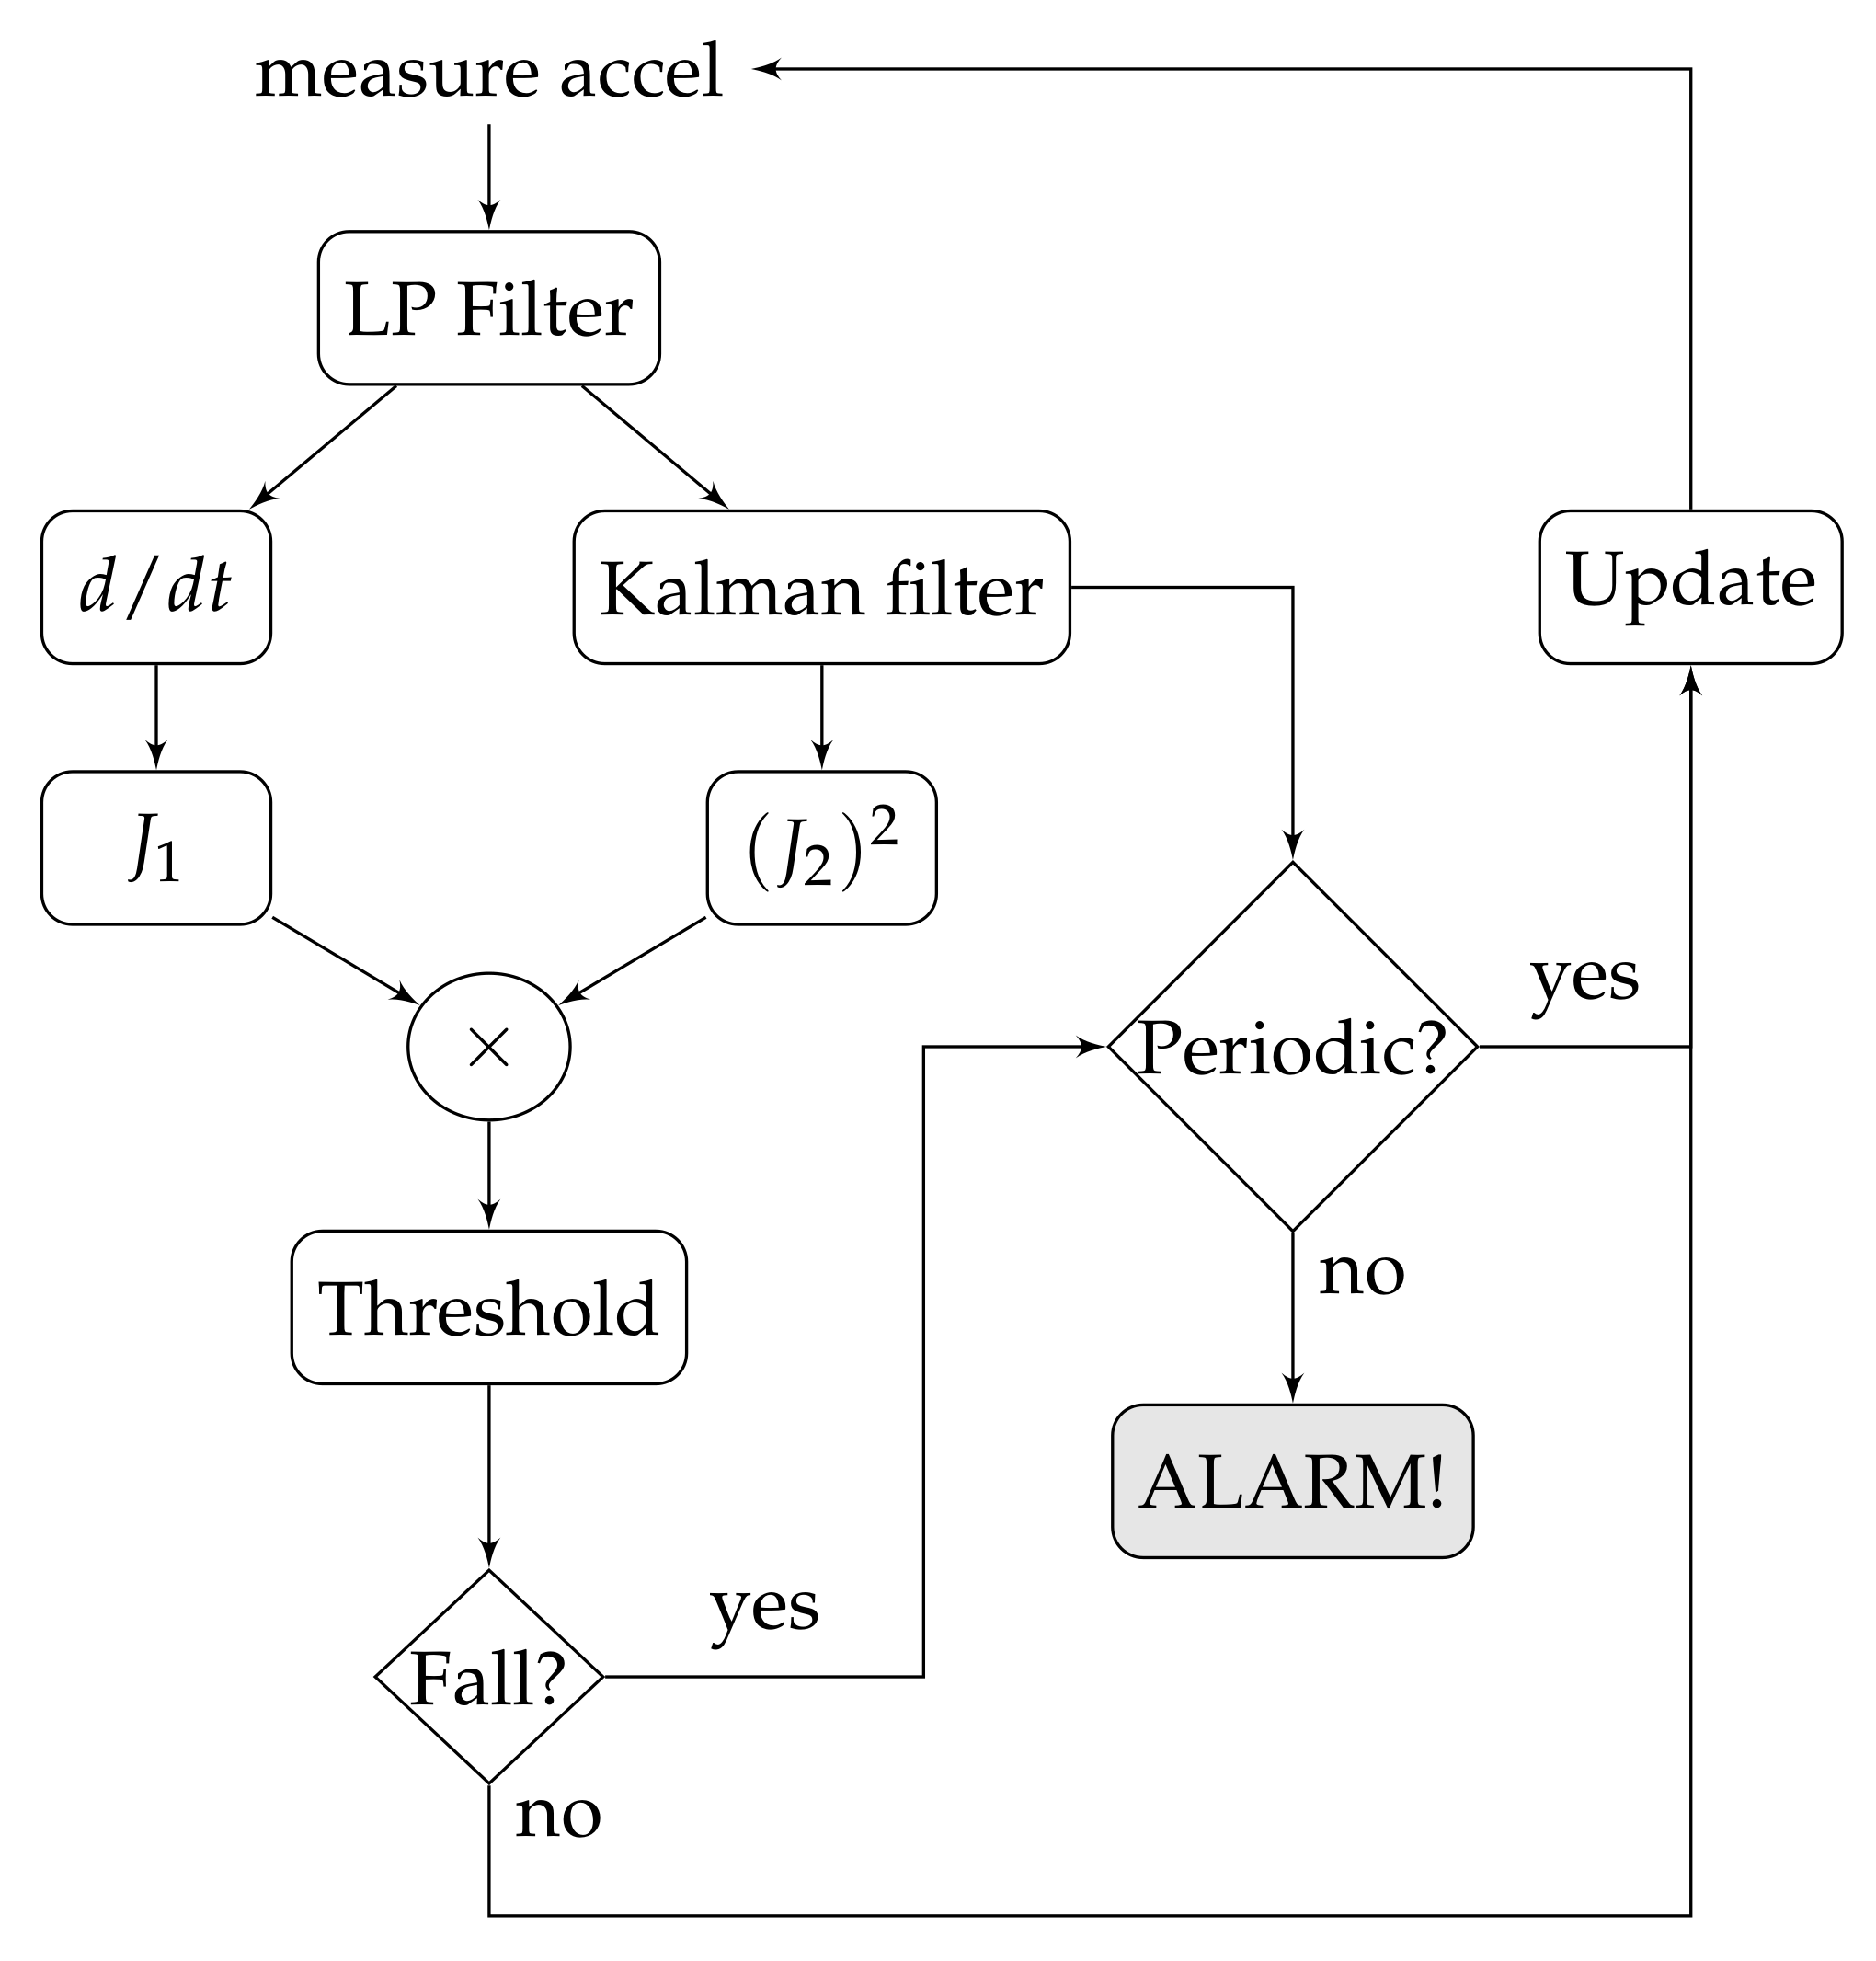
3.3. Periodicity Detector
- At time step k, the current vertical bias level is determined by averaging a sliding window of 1 s over .
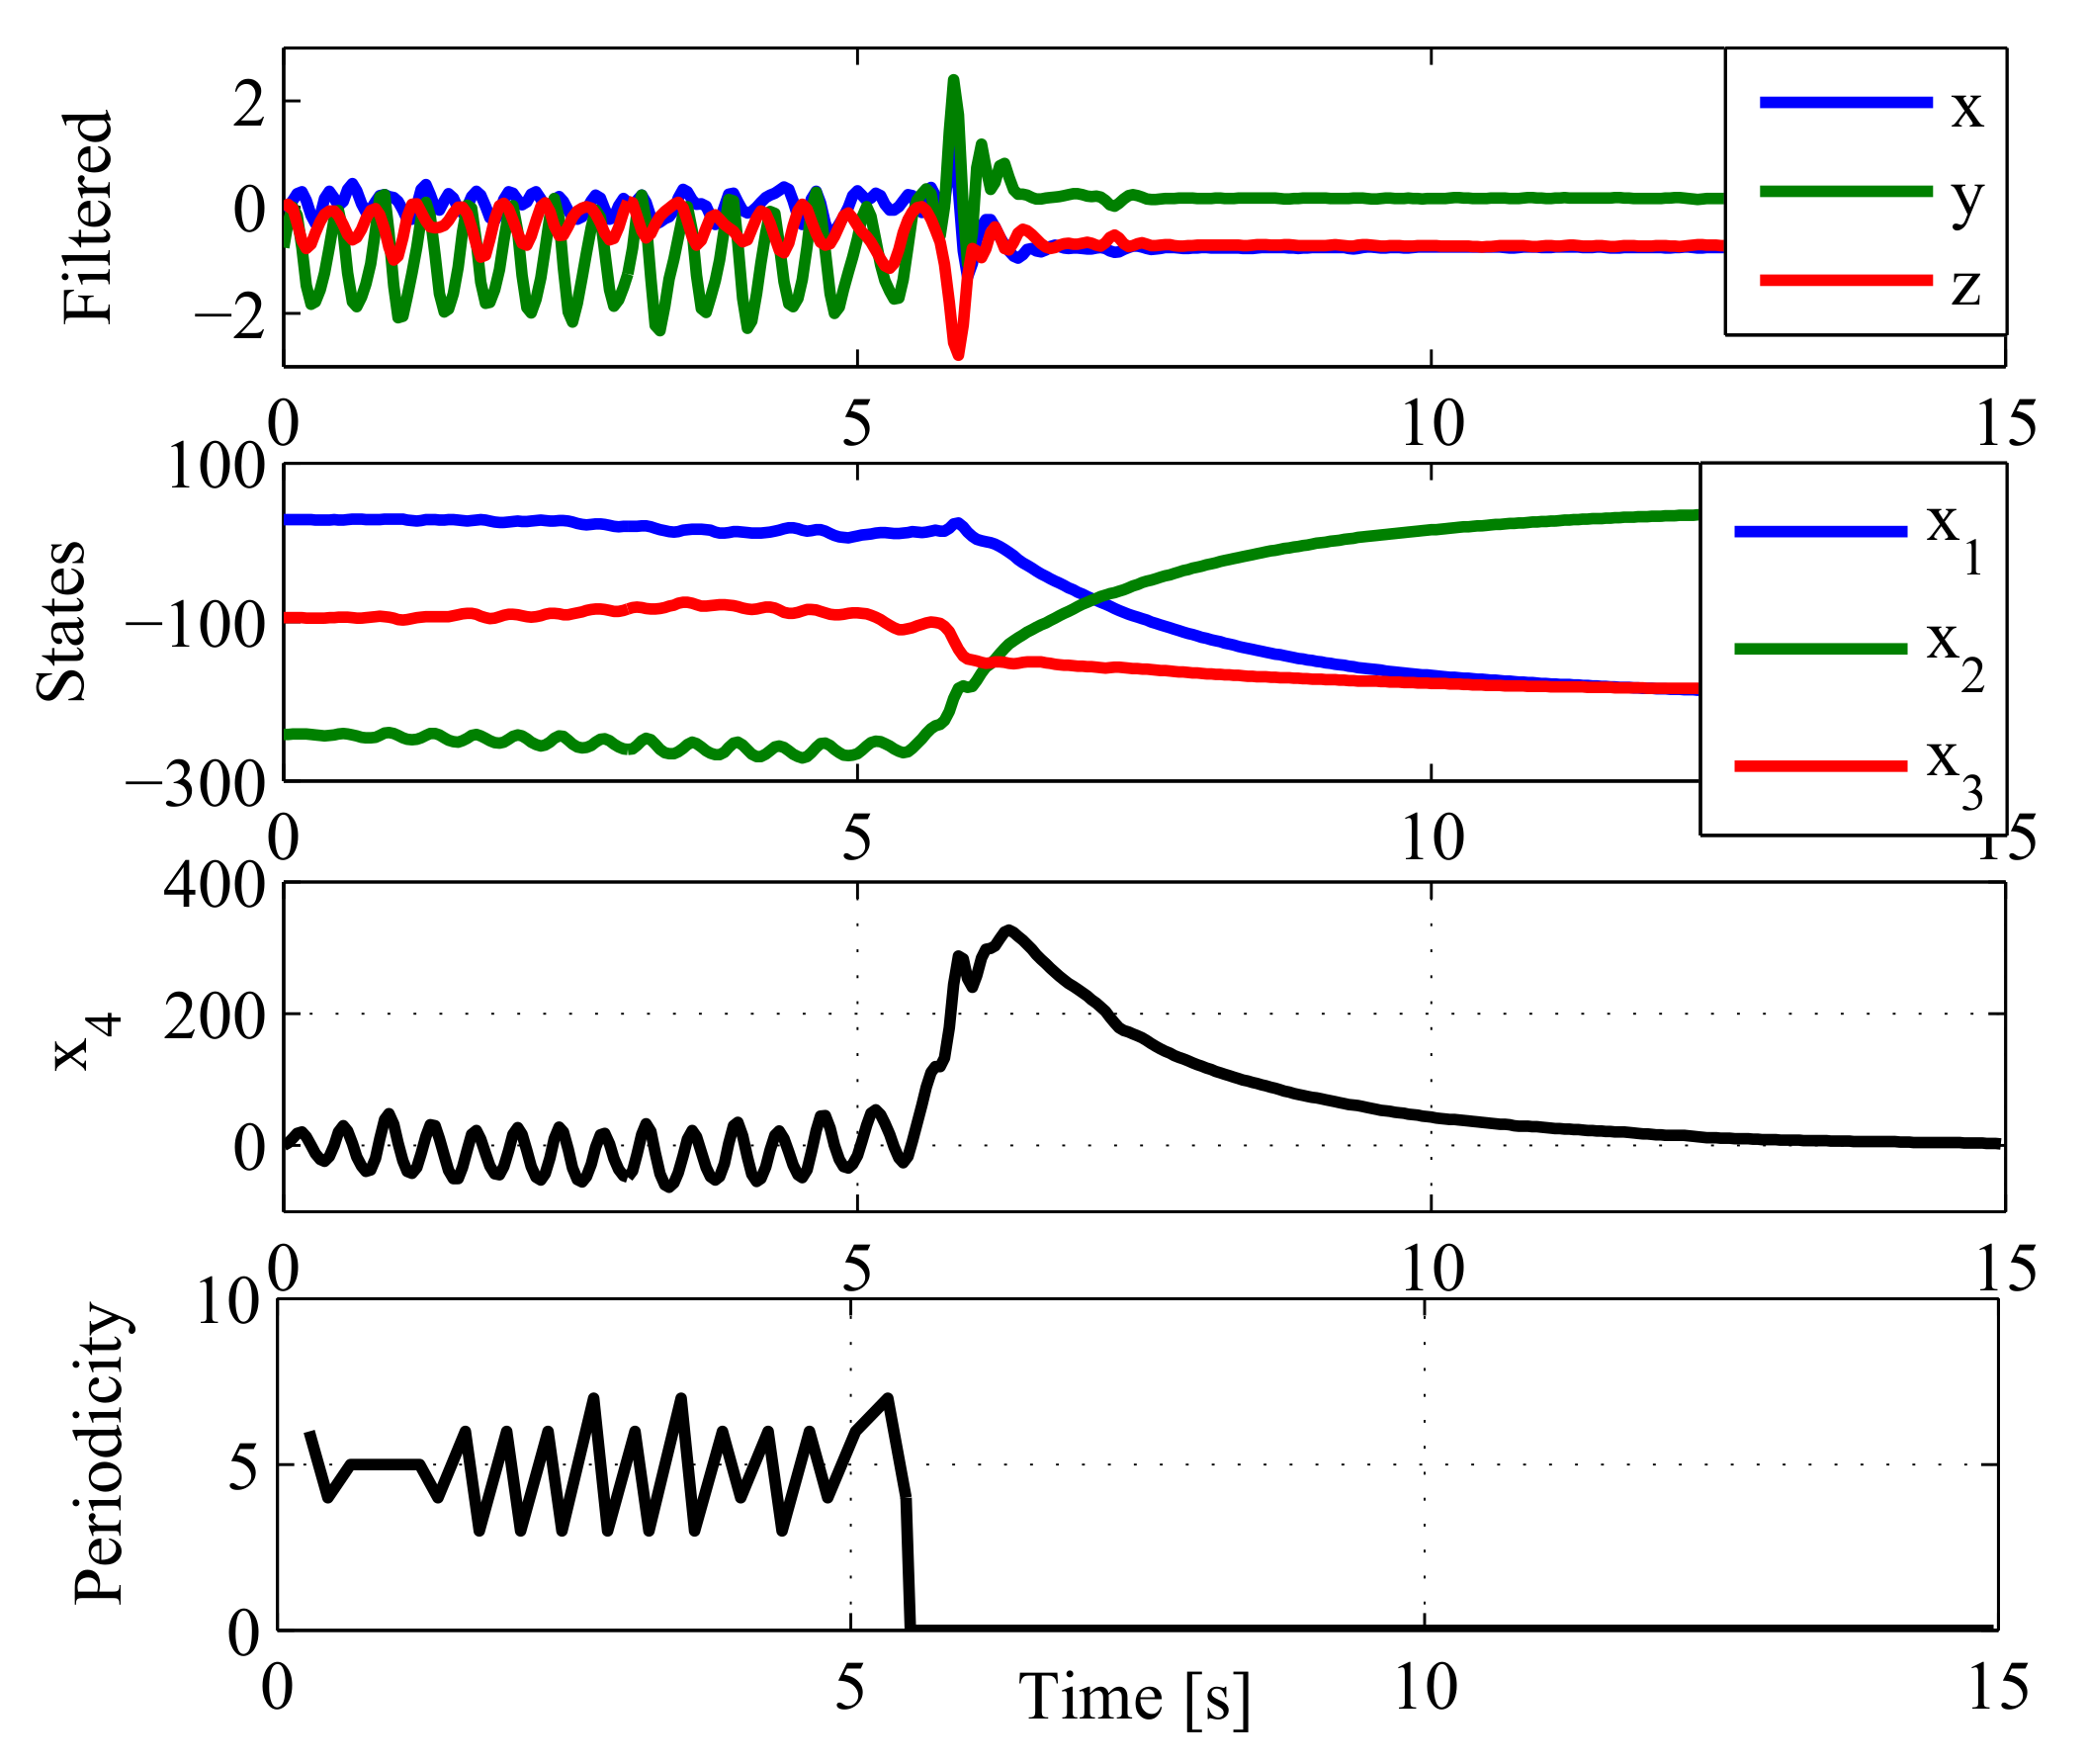
- State of the Kalman filter is then tuned to eliminate local maxima and minima when the shape of the acceleration signal is close to a sinusoid (characteristic of periodic activities). Simultaneously, the current bias level is removed from . Figure 3 (bottom panel) shows how state tends to a zero-bias sinusoidal shape when the person walks or jogs.
- A simple zero-crossing periodicity detector is implemented. It consists in determining the number of data samples between each change of sign on , and multiplying this value by two.
- The periodicity detector analyzes three seconds after a possible fall event. If during this 3 s window, the periodicity is kept stable, we may expect that it was not a fall. The size of the window is selected as the minimum needed to determine if the person is slowly walking. Note from Figure 3 (bottom panel) how the periodicity is lost when the person trips and falls.
3.4. Classification
3.5. Power Consumption
- Sampling frequency: Working directly with the inclination of the subject and not with the peak of the fall allows for reduction in sampling frequency from the usual 50–100 Hz to just 25 Hz. Considering that the fall detection algorithm must be computed every time a new sample arrives, the computation time required in other methodologies is halved. In terms of power consumption, this means that the device will be in an idle state for longer time periods, with a consequent reduction in battery consumption.
- Number of sensors: There is a large difference in power consumption between an accelerometer and a gyroscope (with wide variations differing between references, but with the same trend). The gyroscope consumes on average between 6 and 10 times more current than an accelerometer (the ADXL345 selected for this work consumes 30–140 A according to its data sheet). Table 2 shows the current consumption (under normal operating modes) of commercial embedded gyroscope and accelerometer sensors (obtained from their respective data sheet).Assuming that the fall detection algorithm consumes a similar amount of current with or without a gyroscope, we can estimate the reduction in the battery charge on the same scale; i.e., a device without a gyroscope (like ours) could stay active 5–10 times longer than a device with one.
- Threshold-based classifier: In recent years, authors have focused on machine-learning-based classifiers. The reason is clear: though a large amount of features can be extracted (see [9] (Table 4)), none of them has proven to be discriminant enough. We have powered our discrimination feature by non-linearly combining well-known metrics. Our approach, although simple, allowed us to go back to a simple threshold classifier, which significantly reduces the power consumption compared, for example, with SVM alternatives [10].
4. Results
4.1. Fall Detection
4.2. Fall Detection with Periodicity Detector
4.3. On-Line Validation
4.4. Full-Day (Pilot) Tests
- SM01 assisted in Tae-Bo dancing lessons for adults (INDER Medellín, Colombia) and stayed at home cooking, washing clothes, cleaning, and resting. She also made several trips downtown, walked on the street, and traveled by motorcycle.
- SM02 stayed at home most of the time and engaged in cooking, cleaning, and sitting in the dining room. She is a dressmaker, so she sits at home for long periods of time. She also traveled by bus sometimes, and during the last two days she was sick and rested at home.
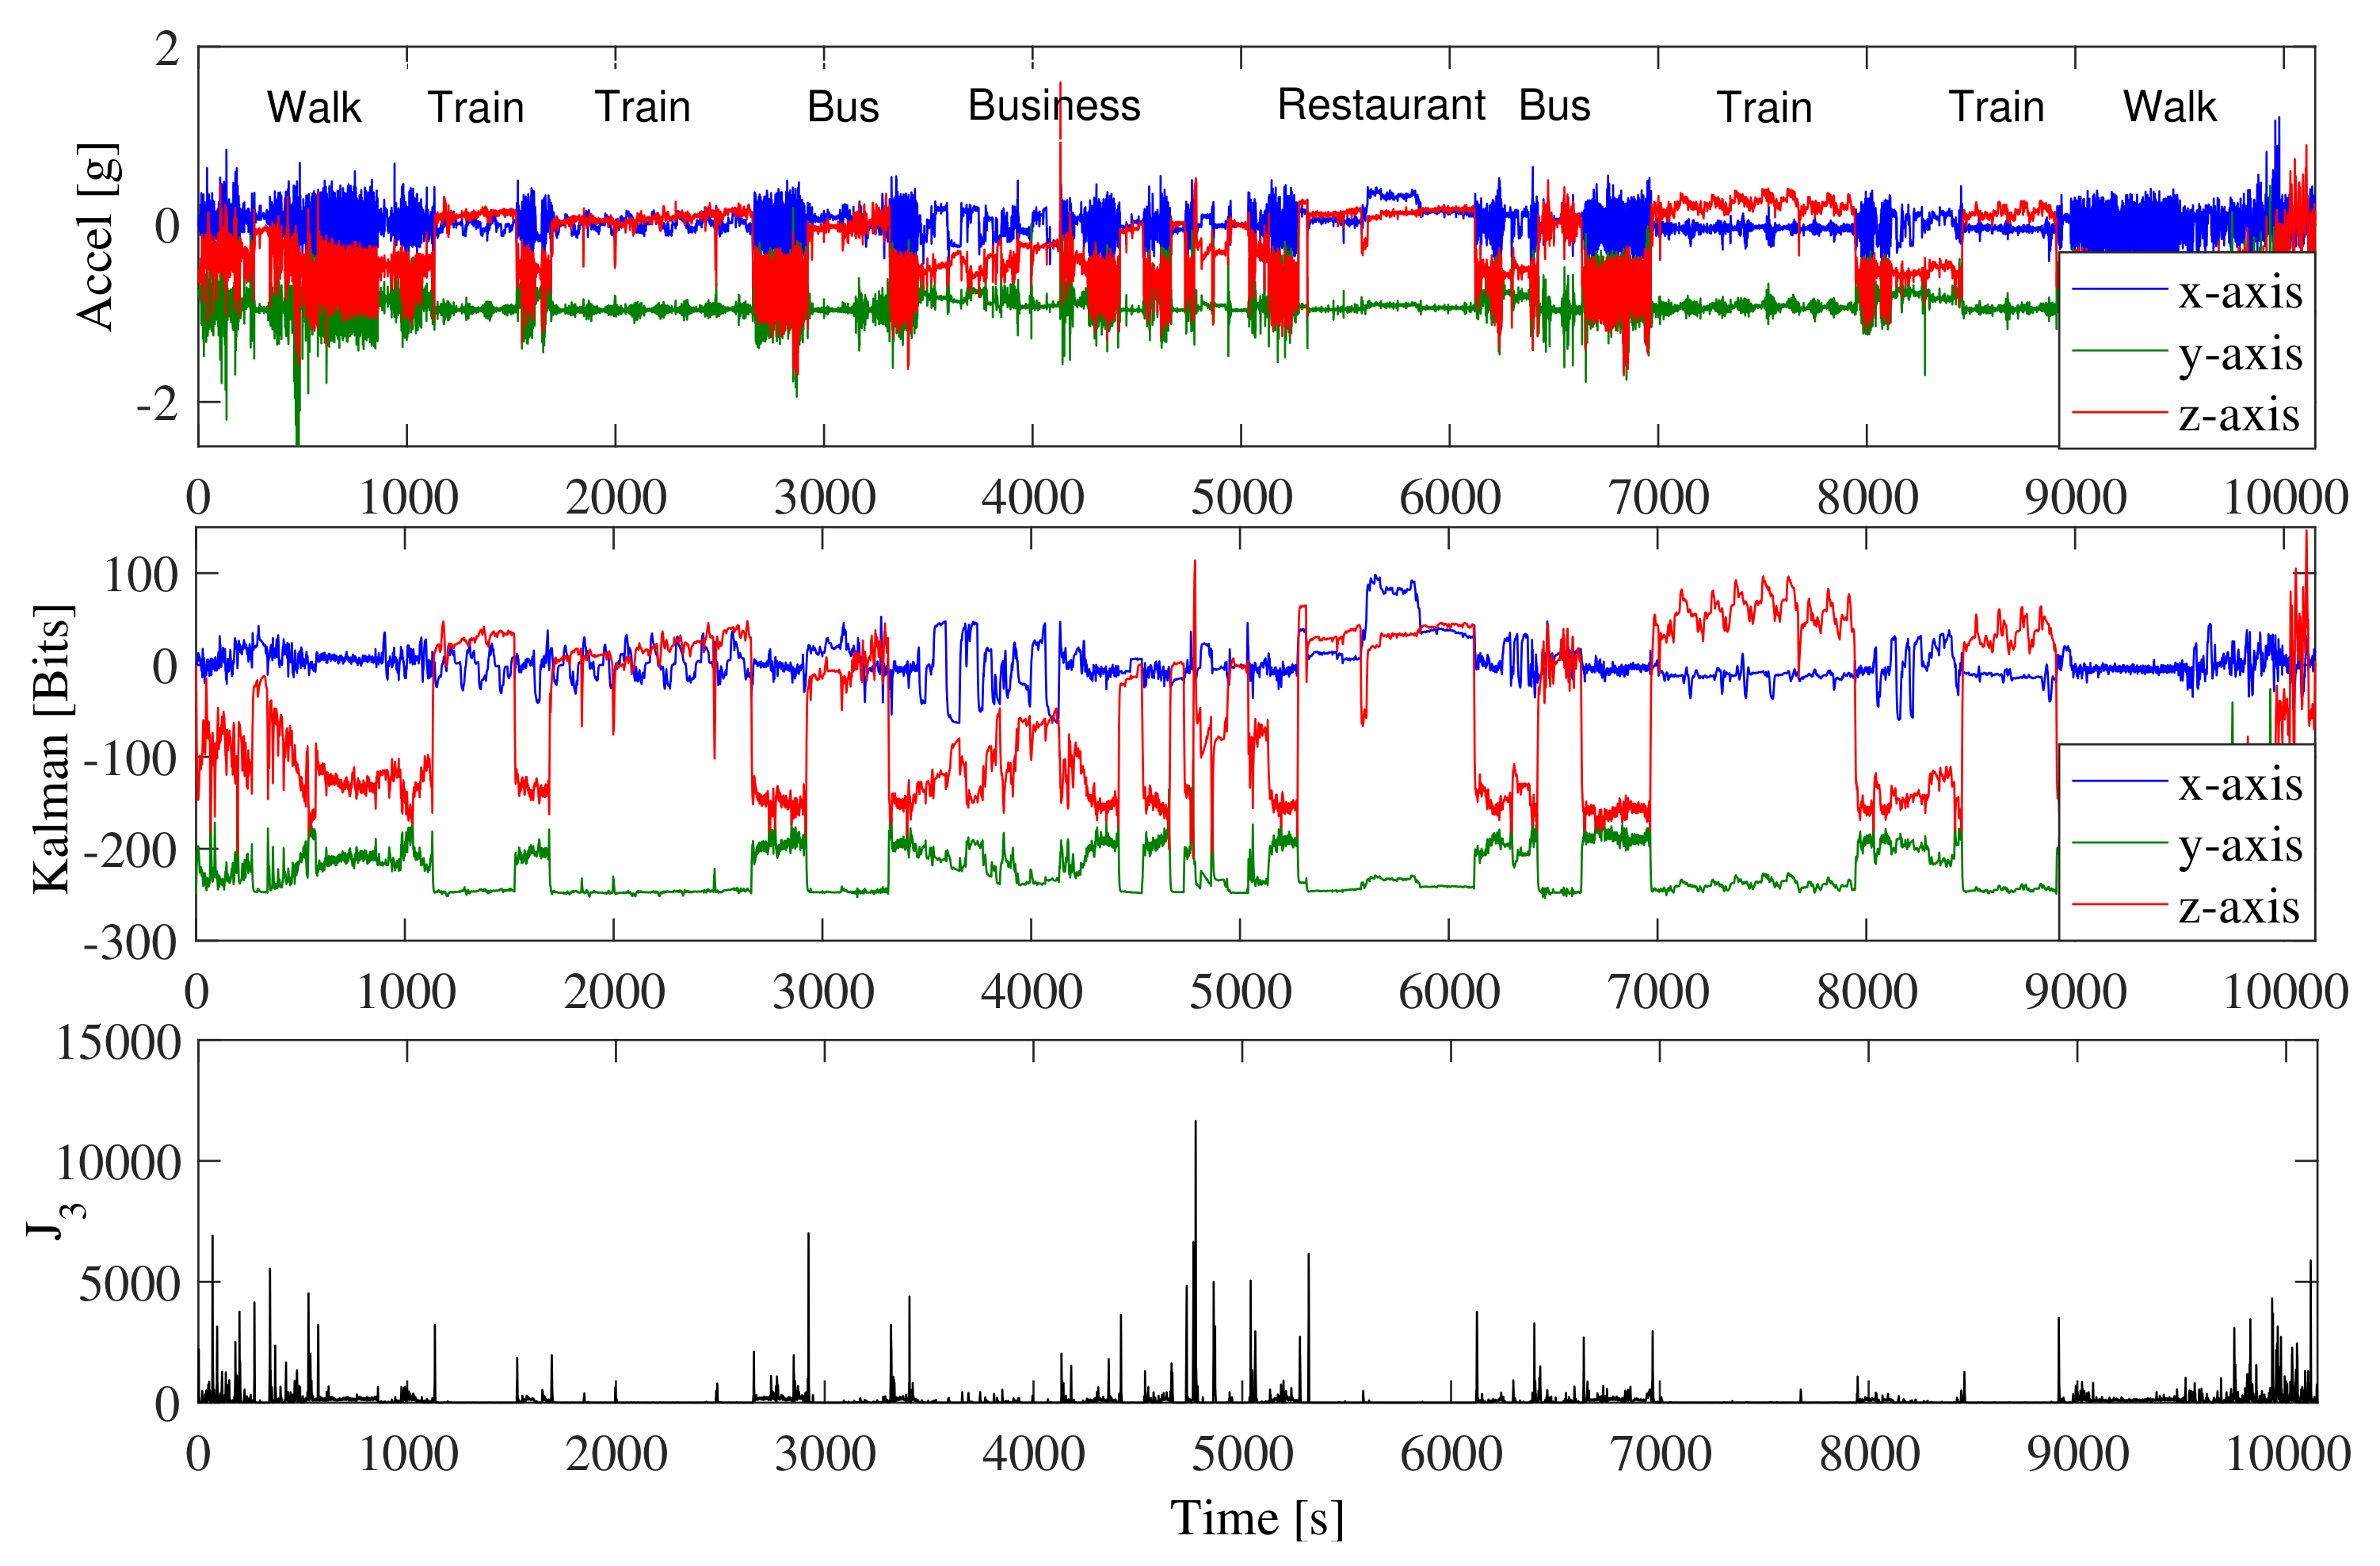
- SM03 commuted to a business downtown and to a church. The rest of the time, he stayed at home in bed or in the dining room (reading). In Figure 8, we show one of his trips downtown (file SM03_1 of [34]). This trip included stairs, two train trips, and two bus trips. Note that, despite the wide amount of activities, the levels of feature were not close to the threshold (40,000).
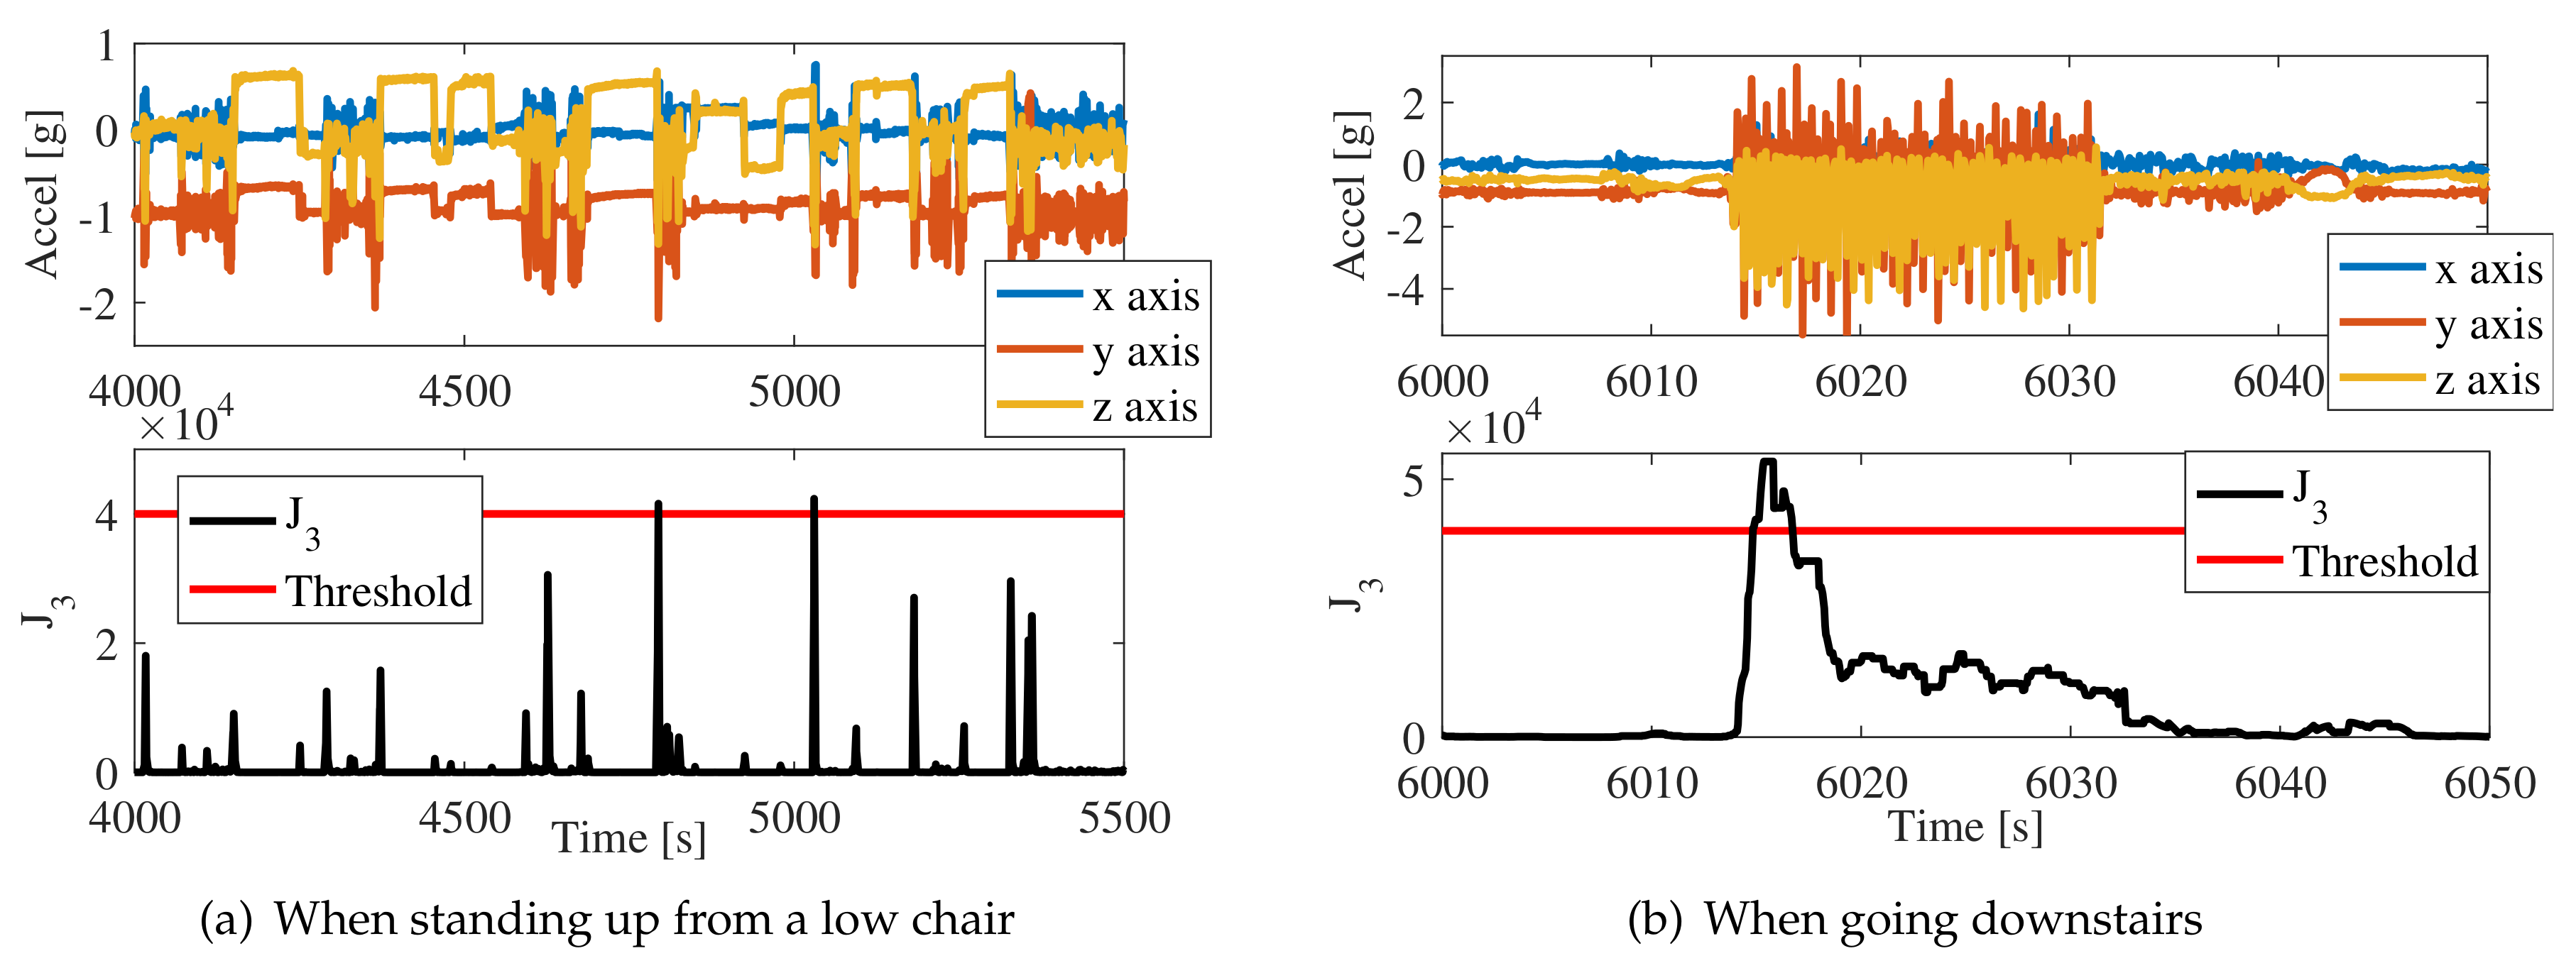
- SM01 had nine false positives during the recordings. Four of them were generated when she stood up from a low chair or from the sidewalk. As shown in Figure 9a, she would stand up fast and her acceleration was close to the threshold. Another two false positives were generated when going downstairs (see Figure 9b). The final three false positives were undetermined, but are presumed to be due to direct impacts to the device.The subject is an active person and overall, her movements showed accelerations close (and sometimes higher) to young adults. This behavior contradicts findings of [32]. Our findings suggest that independent elderly people may show the same accelerations in ADLs as do young adults. Consequently, simulating the ADLs of young people to obtain information about the uncontrolled ADLs of elderly people might be a better alternative to simulating ADLs with elderly people, who always show lower acceleration values.
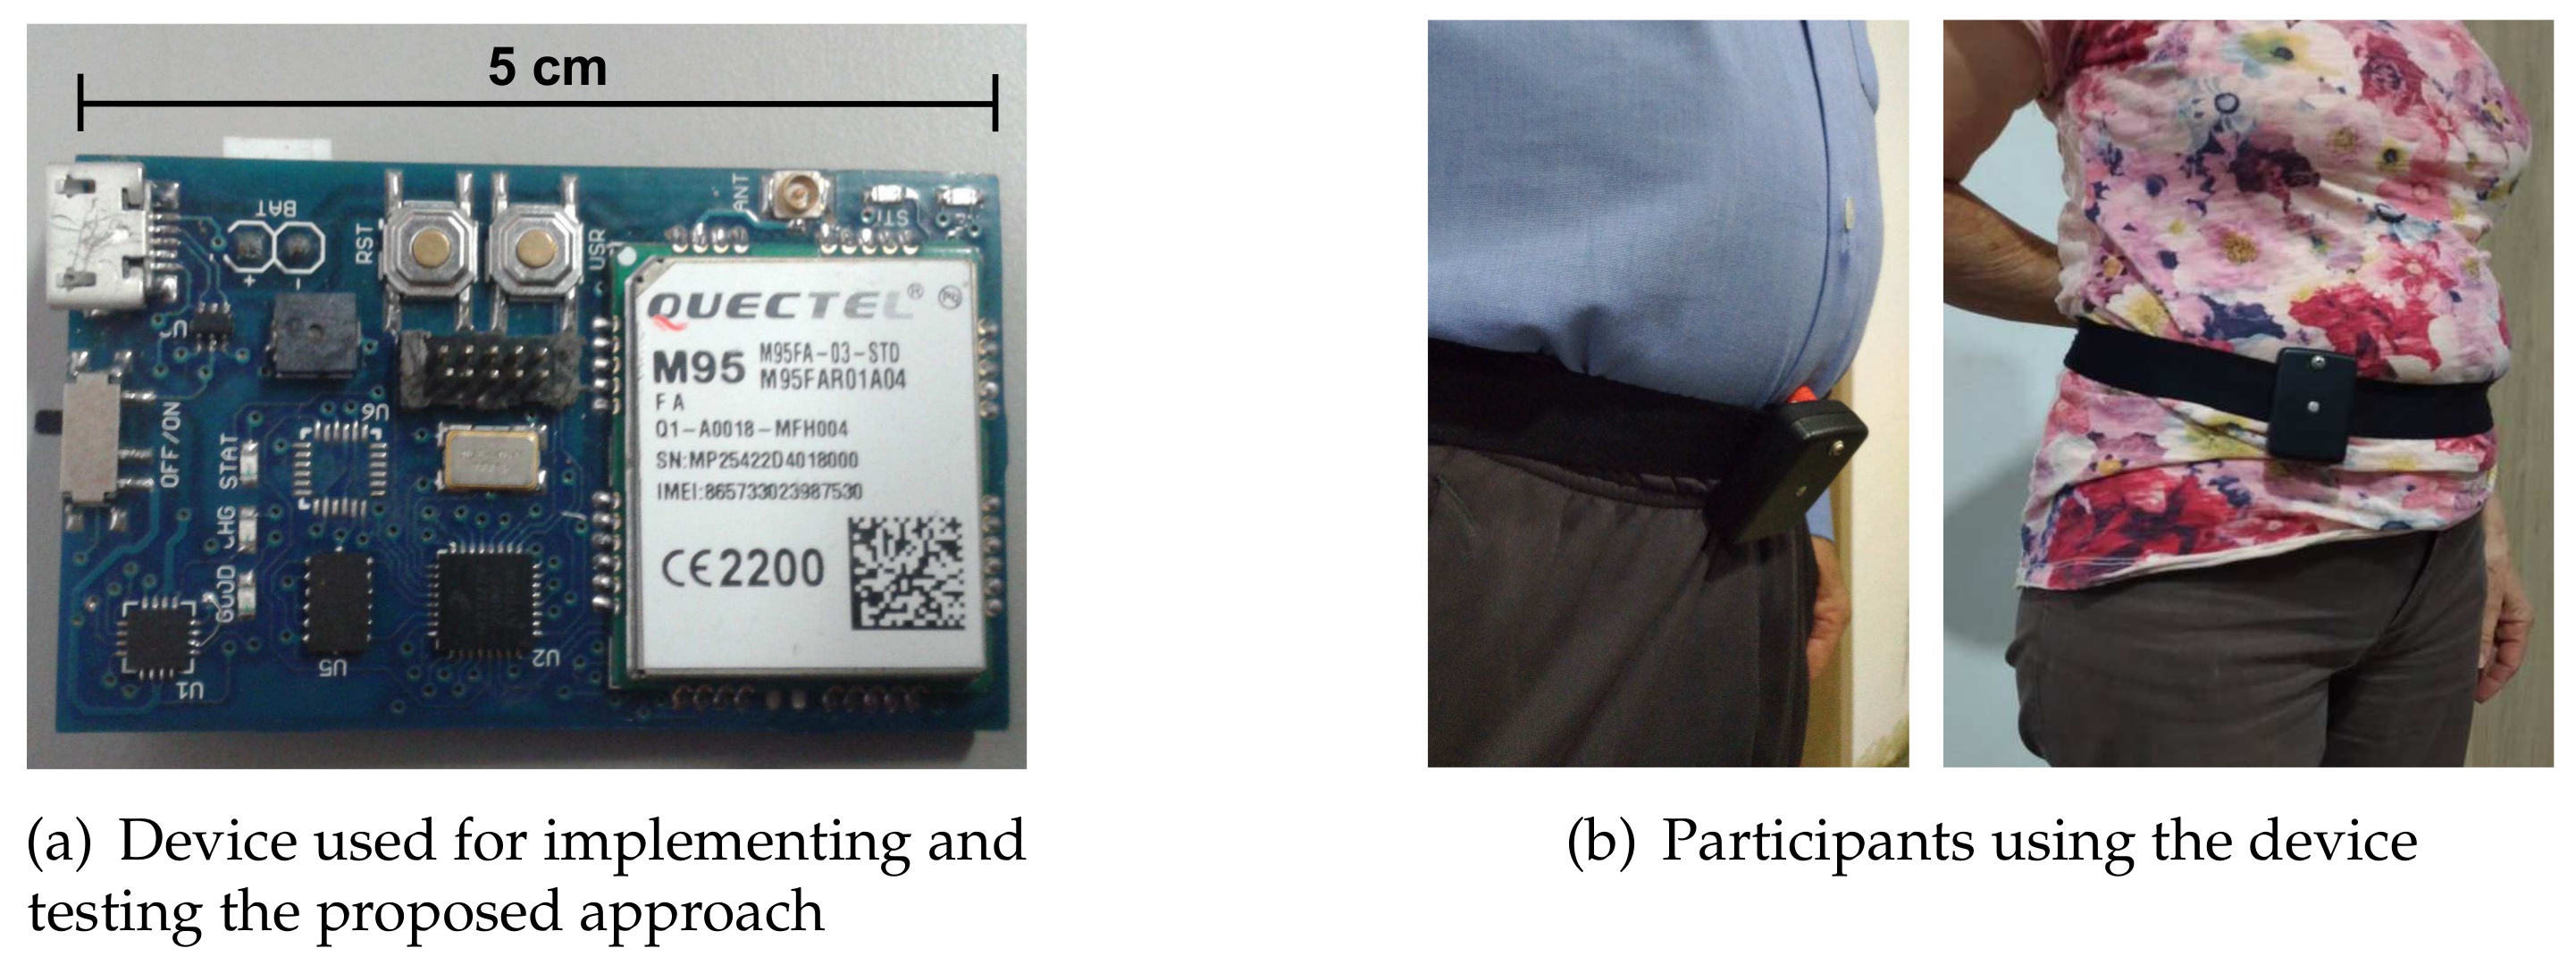
- SM02 had a total of seven false positives. One was a false positive for sitting fast on a chair. Five other false positives were generated because she usually supported her belly against the kitchen or the table. She left her home several times, and twice the device was impacted and lost its SD card. This is worrying since, after an interview, we concluded that she strongly impacted the device in both cases, presumably against furniture. We presume that it was caused by her low height and by the shape of her belly (see Figure 1b). In order to solve this issue, we asked her to use the device on the inner side of the belt (i.e., with the z-axis pointing towards the back of the subject). After this modification, she did not show any more false positives.
- SM03 did not show false positives.
5. Discussion and Conclusions
Acknowledgments
Author Contributions
Conflicts of Interest
References
- Masdeu, J.; Sudarsky, L.; Wolfson, L. Gait Disorders of Aging. Falls and Therapeutic Strategies; Lippincot-Raven: Philadelphia, PA, USA, 1997. [Google Scholar]
- Vellas, B.; Wayne, S.; Romero, L.; Baumgartner, R.; Garry, P. Fear of falling and restriction of mobility in elderly fallers. Age Ageing 1997, 26, 189–193. [Google Scholar] [CrossRef] [PubMed]
- Lord, S.; Sherrington, C.; Menz, H. Falls in Older People: Risk Factors and Strategies for Prevention, 1st ed.; Cambridge University Press: Cambridge, UK, 2001. [Google Scholar]
- Delbaere, K.; Crombez, G.; Vanderstraeten, G.; Willems, T.; Cambier, D. Fear-related avoidance of activities, falls and physical frailty. A prospective community-based cohort study. Age Ageing 2004, 33, 368–373. [Google Scholar] [CrossRef] [PubMed]
- Lord, S.; Ward, J.; Williams, P.; Anstey, K. An epidemiological study of falls in older community-dwelling women: The Randwick falls and fractures study. Aust. J. Public Health 1993, 17, 240–245. [Google Scholar] [CrossRef] [PubMed]
- Henao, G.M.; Curcio Borrero, C.L.; Gómez Montes, J.F. Consecuencias De Las Caídas En Ancianos Institucionalizados. Revista de la Asociación Colombiana de Gerontología y Geriatría 2009, 23, 1221–1233. [Google Scholar]
- Igual, R.; Medrano, C.; Plaza, I. Challenges, issues and trends in fall detection systems. BioMed. Eng. Online 2013, 12, 1–24. [Google Scholar] [CrossRef] [PubMed]
- Shany, T.; Redmond, S.J.; Narayanan, M.R.; Lovell, N.H. Sensors-Based Wearable Systems for Monitoring of Human Movement and Falls. IEEE Sensors J. 2012, 12, 658–670. [Google Scholar] [CrossRef]
- Pannurat, N.; Thiemjarus, S.; Nantajeewarawat, E. Automatic fall monitoring: A review. Sensors 2014, 14, 12900–12936. [Google Scholar] [CrossRef] [PubMed]
- Habib, M.A.; Mohktar, M.S.; Kamaruzzaman, S.B.; Lim, K.S.; Pin, T.M.; Ibrahim, F. Smartphone-Based Solutions for Fall Detection and Prevention: Challenges and Open Issues. Sensors 2014, 14, 7181–7208. [Google Scholar] [CrossRef] [PubMed]
- Sucerquia, A.; López, J.; Vargas-Bonilla, F. SisFall: A fall and movement dataset. Sensors 2017, 17, 198. [Google Scholar] [CrossRef] [PubMed]
- Igual, R.; Medrano, C.; Plaza, I. A comparison of public datasets for acceleration-based fall detection. Med. Eng. Phys. 2015, 37, 870–878. [Google Scholar] [CrossRef] [PubMed]
- Bagala, F.; Becker, C.; Cappello, A.; Chiari, L.; Aminian, K.; Hausdorff, J.M.; Zijlstra, W.; Klenk, J. Evaluation of Accelerometer-Based Fall Detection Algorithms on Real-World Falls. PLoS ONE 2012, 7, e37062. [Google Scholar] [CrossRef] [PubMed]
- López, J.D.; Ocampo, C.; Sucerquia, A.; Vargas-Bonilla, F. Analyzing multiple accelerometer configurations to detect falls and motion. In Proceedings of the Latin American Congress on Biomedical Engineering, Santander, Colombia, 26–28 October 2016. [Google Scholar]
- Cola, G.; Avvenuti, M.; Vecchio, A.; Yang, G.Z.; Lo, B. An On-Node Processing Approach for Anomaly Detection in Gait. IEEE Sensors J. 2015, 15, 6640–6649. [Google Scholar] [CrossRef]
- Oner, M.; Pulcifer-Stump, J.A.; Seeling, P.; Kaya, T. Towards the Run and Walk Activity Classification through Step Detection—An Android Application. In Proceedings of the 34th Annual International Conference of the IEEE EMBS, San Diego, CA, USA, 28 August–1 Sepember 2012; pp. 1980–1983. [Google Scholar]
- Wundersitz, D.W.T.; Gastin, P.B.; Richter, C.; Robertson, S.J.; Netto, K.J. Validity of a trunk-mounted accelerometer to assess peak accelerations during walking, jogging and running. Eur. J. Sport Sci. 2014, 2014, 382–390. [Google Scholar] [CrossRef] [PubMed]
- Clements, C.M.; Buller, M.J.; Welles, A.P.; Tharion, W.J. Real Time Gait Pattern Classification from Chest Worn Accelerometry During a Loaded Road March. In Proceedings of the IEEE 34th Annual International Conference of the EMBS, San Diego, CA, USA, 28 August–1 Sepember 2012. [Google Scholar]
- López, J.D.; Sucerquia, A.; Duque-Muñoz, L.; Vargas-Bonilla, F. Walk and jog characterization using a triaxial accelerometer. In Proceedings of the IEEE International Conference on Ubiquitous Computing and Communications (IUCC), Liverpool, UK, 26–28 October 2015; pp. 1406–1410. [Google Scholar]
- Kalman, R.E. A New Approach to Linear Filtering and Prediction Problems. Trans. ASME J. Basic Eng. 1960, 82, 35–45. [Google Scholar] [CrossRef]
- Bagalà, F.; Klenk, J.; Cappello, A.; Chiari, L.; Becker, C.; Lindemann, U. Quantitative Description of the Lie-to-Sit-to-Stand-to-Walk Transfer by a Single Body-Fixed Sensor. IEEE Trans. Neural Syst. Rehabil. Eng. 2013, 21, 624–633. [Google Scholar] [CrossRef] [PubMed]
- Berg, K.; Wood-Dauphinee, S.; Williams, J.; Maki, B. Measuring balance in the elderly: Validation of an instrument. Can. J. Public Health 1992, 83, S7–S11. [Google Scholar] [PubMed]
- Otebolaku, A.M.; Andrade, M.T. User context recognition using smartphone sensors and classification models. J. Netw. Comput. Appl. 2016, 66, 33–51. [Google Scholar] [CrossRef]
- Novak, D.; Rebersek, P.; De Rossi, S.M.M.; Donati, M.; Podobnika, J.; Beravs, T.; Lenzi, T.; Vitiello, N.; Carrozza, M.C.; Muniha, M. Automated detection of gait initiation and termination using wearable sensors. Med. Eng. Phys. 2013, 35, 1713–1720. [Google Scholar] [CrossRef] [PubMed]
- Yuan, X.; Yu, S.; Dan, Q.; Wang, G.; Liu, S. Fall Detection Analysis with Wearable MEMS-based Sensors. In Proceedings of the 16th International Conference on Electronic Packaging Technology (ICEPT), Changsha, China, 11–14 August 2015; pp. 1184–1187. [Google Scholar]
- Li, H.; Yang, Y.-L. Research of elderly fall detection based on dynamic time warping algorithm. In Proceedings of the 35th Chinese Control Conference, Chengdu, China, 27–29 July 2016. [Google Scholar]
- He, J.; Bai, S.; Wang, X. An Unobtrusive Fall Detection and Alerting System Based on Kalman Filter and Bayes Network Classifier. Sensors 2017, 17, 1393. [Google Scholar] [CrossRef] [PubMed]
- Mao, A.; Ma, X.; He, Y.; Luo, J. Highly Portable, Sensor-Based System for Human Fall Monitoring. Sensors 2017, 17, 2096. [Google Scholar] [CrossRef] [PubMed]
- Zhang, C.; Lai, C.F.; Lai, Y.H.; Wu, Z.W.; Chao, H.C. An inferential real-time falling posture reconstruction for Internet of healthcare things. J. Netw. Comput. Appl. 2017, 89, 86–95. [Google Scholar] [CrossRef]
- Luenberger, D. An Introduction to Observers. IEEE Trans. Autom. Control 1971, 16, 596–602. [Google Scholar] [CrossRef]
- Noury, N.; Rumeau, P.; Bourke, A.; ÓLaighin, G.; Lundy, J. A proposal for the classification and evaluation of fall detectors. IRBM 2008, 29, 340–349. [Google Scholar] [CrossRef]
- Klenk, J.; Becker, C.; Lieken, F.; Nicolai, S.; Maetzler, W.; Alt, W.; Zijlstra, W.; Hausdorff, J.; van Lummel, R.; Chiari, L.; et al. Comparison of acceleration signals of simulated and real-world backward falls. Med. Eng. Phys. 2011, 33, 368–373. [Google Scholar] [CrossRef] [PubMed]
- Noury, N.; Fleury, A.; Rumeau, P.; Bourke, A.; Laighin, G.; Rialle, V.; Lundy, J. Fall detection—Principles and Methods. In Proceedings of the 29th Annual International Conference of the IEEE EMBS, Lyon, France, 22–26 August 2007; pp. 1663–1666. [Google Scholar]
- Sisfall 2: Real-Life/Real-Time Elderly ADL. 2018. Available online: http://sistemic.udea.edu.co/en/research/projects/sucerquia2018/ (accessed on 2 April 2018).


| Code | Gender | Age | Height [m] | Weight [kg] |
|---|---|---|---|---|
| SM01 | Female | 61 | 1.56 | 54 |
| SM02 | Female | 70 | 1.46 | 56 |
| SM03 | Male | 81 | 1.62 | 68 |
| Brand | Device | Accelerometer | Gyroscope | Max Total |
|---|---|---|---|---|
| Analog Devices | ADXC1501 | N/A | N/A | <16 mA |
| InvenSense | MPU-9250 | 8 A | 3.2 mA | 6 mA |
| ST | LSM6DS3 | 70 A | N/A | 900 A |
| BOSCH | BMI160 | 180 A | 850 A | 990 A |
| Sensitivity [%] | 92.92 ± 1.56 | 96.06 ± 1.52 | 99.27 ± 0.78 |
| Specificity [%] | 81.72 ± 2.22 | 96.79 ± 1.12 | 99.37 ± 0.36 |
| Accuracy [%] | 86.14 ± 1.36 | 96.50 ± 0.84 | 99.33 ± 0.28 |
| Threshold | 110.88 ± 3.23 | 22.88 ± 0.027 | 42,628 ± 511.59 |
| Sensitivity [%] | 97.35 ± 1.37 | 96.15 ± 1.59 | 99.28 ± 0.59 |
| Specificity [%] | 91.49 ± 1.74 | 96.69 ± 1.30 | 99.51 ± 0.48 |
| Accuracy [%] | 94.42 ± 1.33 | 96.42 ± 0.58 | 99.39 ± 0.36 |
| Threshold | 103.03 ± 0.02 | 22.914 ± 0.11 | 42,230 ± 985.01 |
| Ground Truth | |||
|---|---|---|---|
| ADL | FALL | ||
| Proposed | ADL | ||
| Approach | FALL | ||
© 2018 by the authors. Licensee MDPI, Basel, Switzerland. This article is an open access article distributed under the terms and conditions of the Creative Commons Attribution (CC BY) license (http://creativecommons.org/licenses/by/4.0/).
Share and Cite
Sucerquia, A.; López, J.D.; Vargas-Bonilla, J.F. Real-Life/Real-Time Elderly Fall Detection with a Triaxial Accelerometer. Sensors 2018, 18, 1101. https://doi.org/10.3390/s18041101
Sucerquia A, López JD, Vargas-Bonilla JF. Real-Life/Real-Time Elderly Fall Detection with a Triaxial Accelerometer. Sensors. 2018; 18(4):1101. https://doi.org/10.3390/s18041101
Chicago/Turabian StyleSucerquia, Angela, José David López, and Jesús Francisco Vargas-Bonilla. 2018. "Real-Life/Real-Time Elderly Fall Detection with a Triaxial Accelerometer" Sensors 18, no. 4: 1101. https://doi.org/10.3390/s18041101
APA StyleSucerquia, A., López, J. D., & Vargas-Bonilla, J. F. (2018). Real-Life/Real-Time Elderly Fall Detection with a Triaxial Accelerometer. Sensors, 18(4), 1101. https://doi.org/10.3390/s18041101