QuantifyMe: An Open-Source Automated Single-Case Experimental Design Platform †


Abstract
1. Introduction
- A deeper understanding of the self-experiments that healthy individuals may be interested in, especially healthy, tech-savvy 18–24 years olds
- Development and evaluation (a six-week pilot user study with N = 13) of a platform (available at https://github.com/mitmedialab/AffectiveComputingQuantifyMeAndroid) for healthy individuals to conduct self-experiments based on a single-case design methodology (note, since the focus of this paper is how the platform works and how individuals use the platform, we only briefly discuss the individualized results of the single-case self-experiments)
- A collection of insights into participation patterns of healthy individuals when using a single-case based platform designed to help them find their optimal behaviors
2. Related Work
2.1. Quantified Self and Self-Experimentation
- To improve health by monitoring key indicators, identify triggers to specific medical conditions, and determine relationships between variables
- To improve other areas of life, such as productivity and mindfulness
- To find new life experiences and learn interesting things about oneself
2.2. Single-Case Experimental Design
- The intervention should be systematically manipulated by the researcher, with defined timing and process.
- Accepted psychometric measures should be used for agreement between multiple observers.
- There should be at least three attempts for interventions at different points in time when observing the dependent variable.
- Each phase should include a minimum of three to five data points.
3. Survey Study for Understanding Users’ Interest in Self-Experimentation
- How does my leisure time affect my happiness?
- How does my activity level affect my sleep efficiency?
- How does my nightly sleep affect my productivity?
- How do inconsistent bedtimes affect my stress level?
4. QuantifyMe Platform for Self-Experimentation
4.1. Single-Case Experimental Design on QuantifyMe
- If the user has (i) at least five days within the appropriate target behavior range and (ii) a stable output (defined as a self-reported output within 3 points on the Likert scale or sleep efficiencies within 10%, see Section 4.2 for more information), then they are sent to the next stage.
- If a stage lasts seven days and only four (instead of five) of the days were in the appropriate target behavior range, the user is sent to the next stage. If three or fewer days were in the target range, the stage is restarted. This was done because we need to have several days where the target behavior was achieved, but we do not want the user to be too frustrated with the system.
- If a stage lasts seven days and the output is unstable, the user is sent to the next stage. This was implemented because we did not want users to become too frustrated with the system restarting when they had high adherence to checking in and following the target behavior.
- If the user missed checking-in for two days, the stage is restarted. This rule is particularly strict because, if a user did not check-in (report outcomes and receive instructions for the day), he may not know the target behavior for that day.
- five days and all days were in the correct target behavior range and the output was stable;
- six days where five of the six days were in the correct target behavior range and the output was stable; or
- seven days where four or five of the days were in the correct target behavior range.
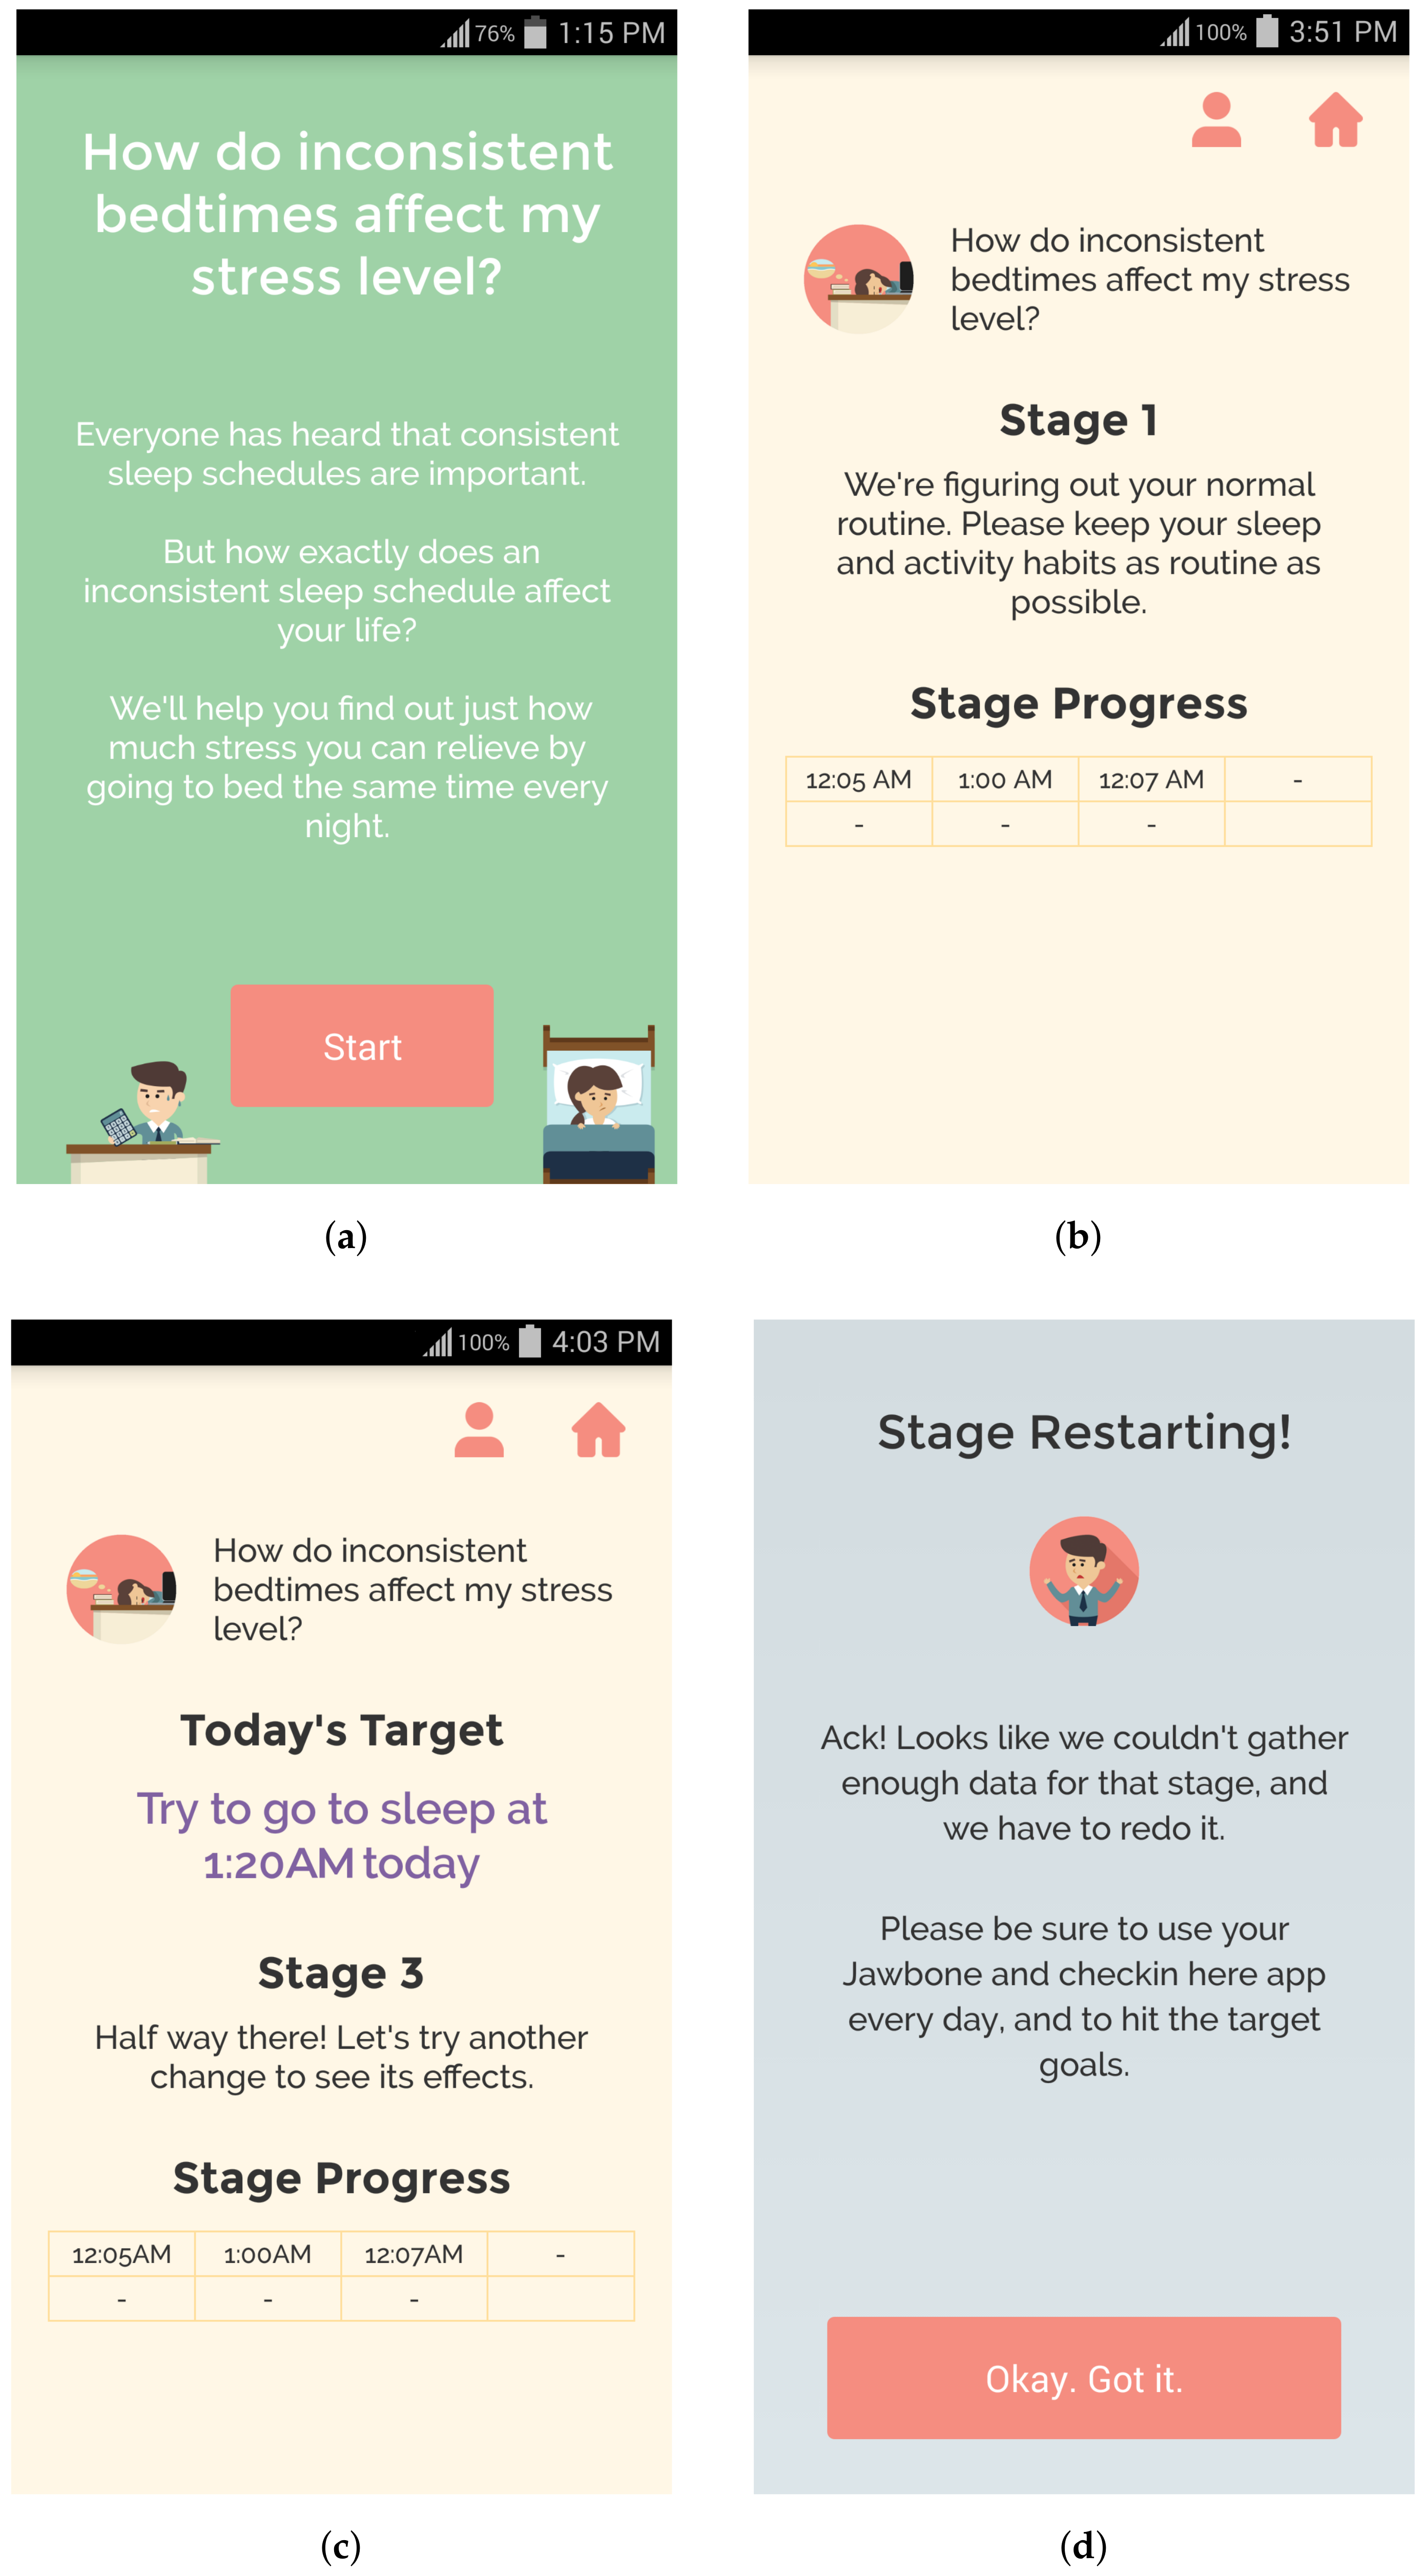
4.2. QuantifyMe Android App
- How effective do you think this app will be in helping you run this experiment? (App Efficacy)
- How effective do you think this experiment will be in getting concrete results? (Experiment Efficacy)
- How effective do you think you will be in carrying out the experiment? (Self Efficacy)
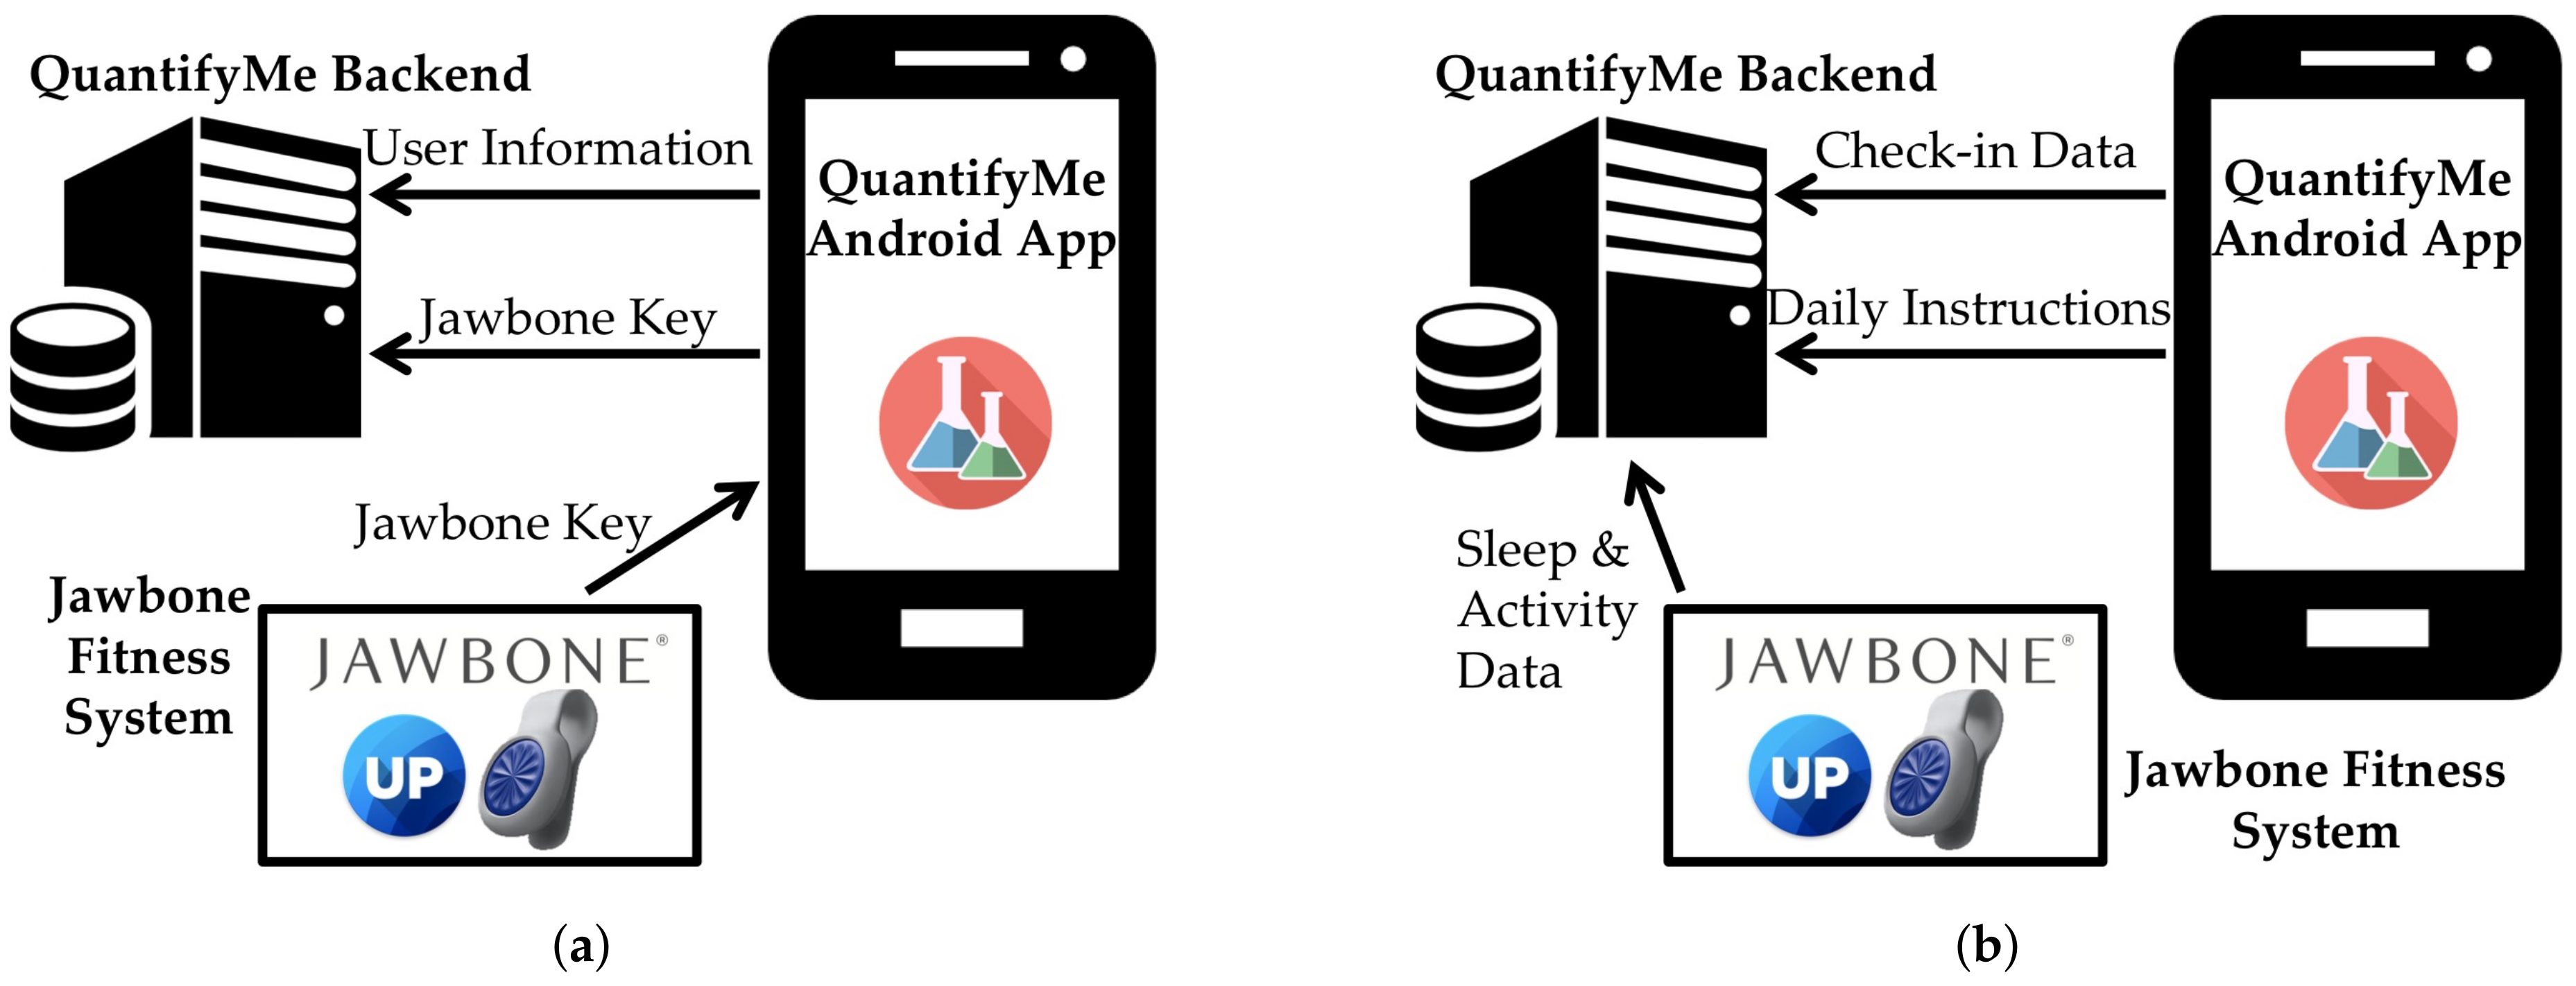
4.3. Backend System
5. App Evaluation Study Results
- Participants have lower average Perceived Stress Scale (PSS) scores than are typical in their age group.
- Participants self-reported neutral happiness, stress, and sleep quality before starting the study.
- Participants have lower than average extraversion, conscientiousness, neuroticism, and openness.
- Participants have higher than average agreeableness.
- Choice of self experiment matches the distribution of the self experiments in the survey study discussed in Section 3.
- Participants reported neutral efficacy scores.
- Some correlations were found between efficacy and personality types (agreeableness and conscientiousness).
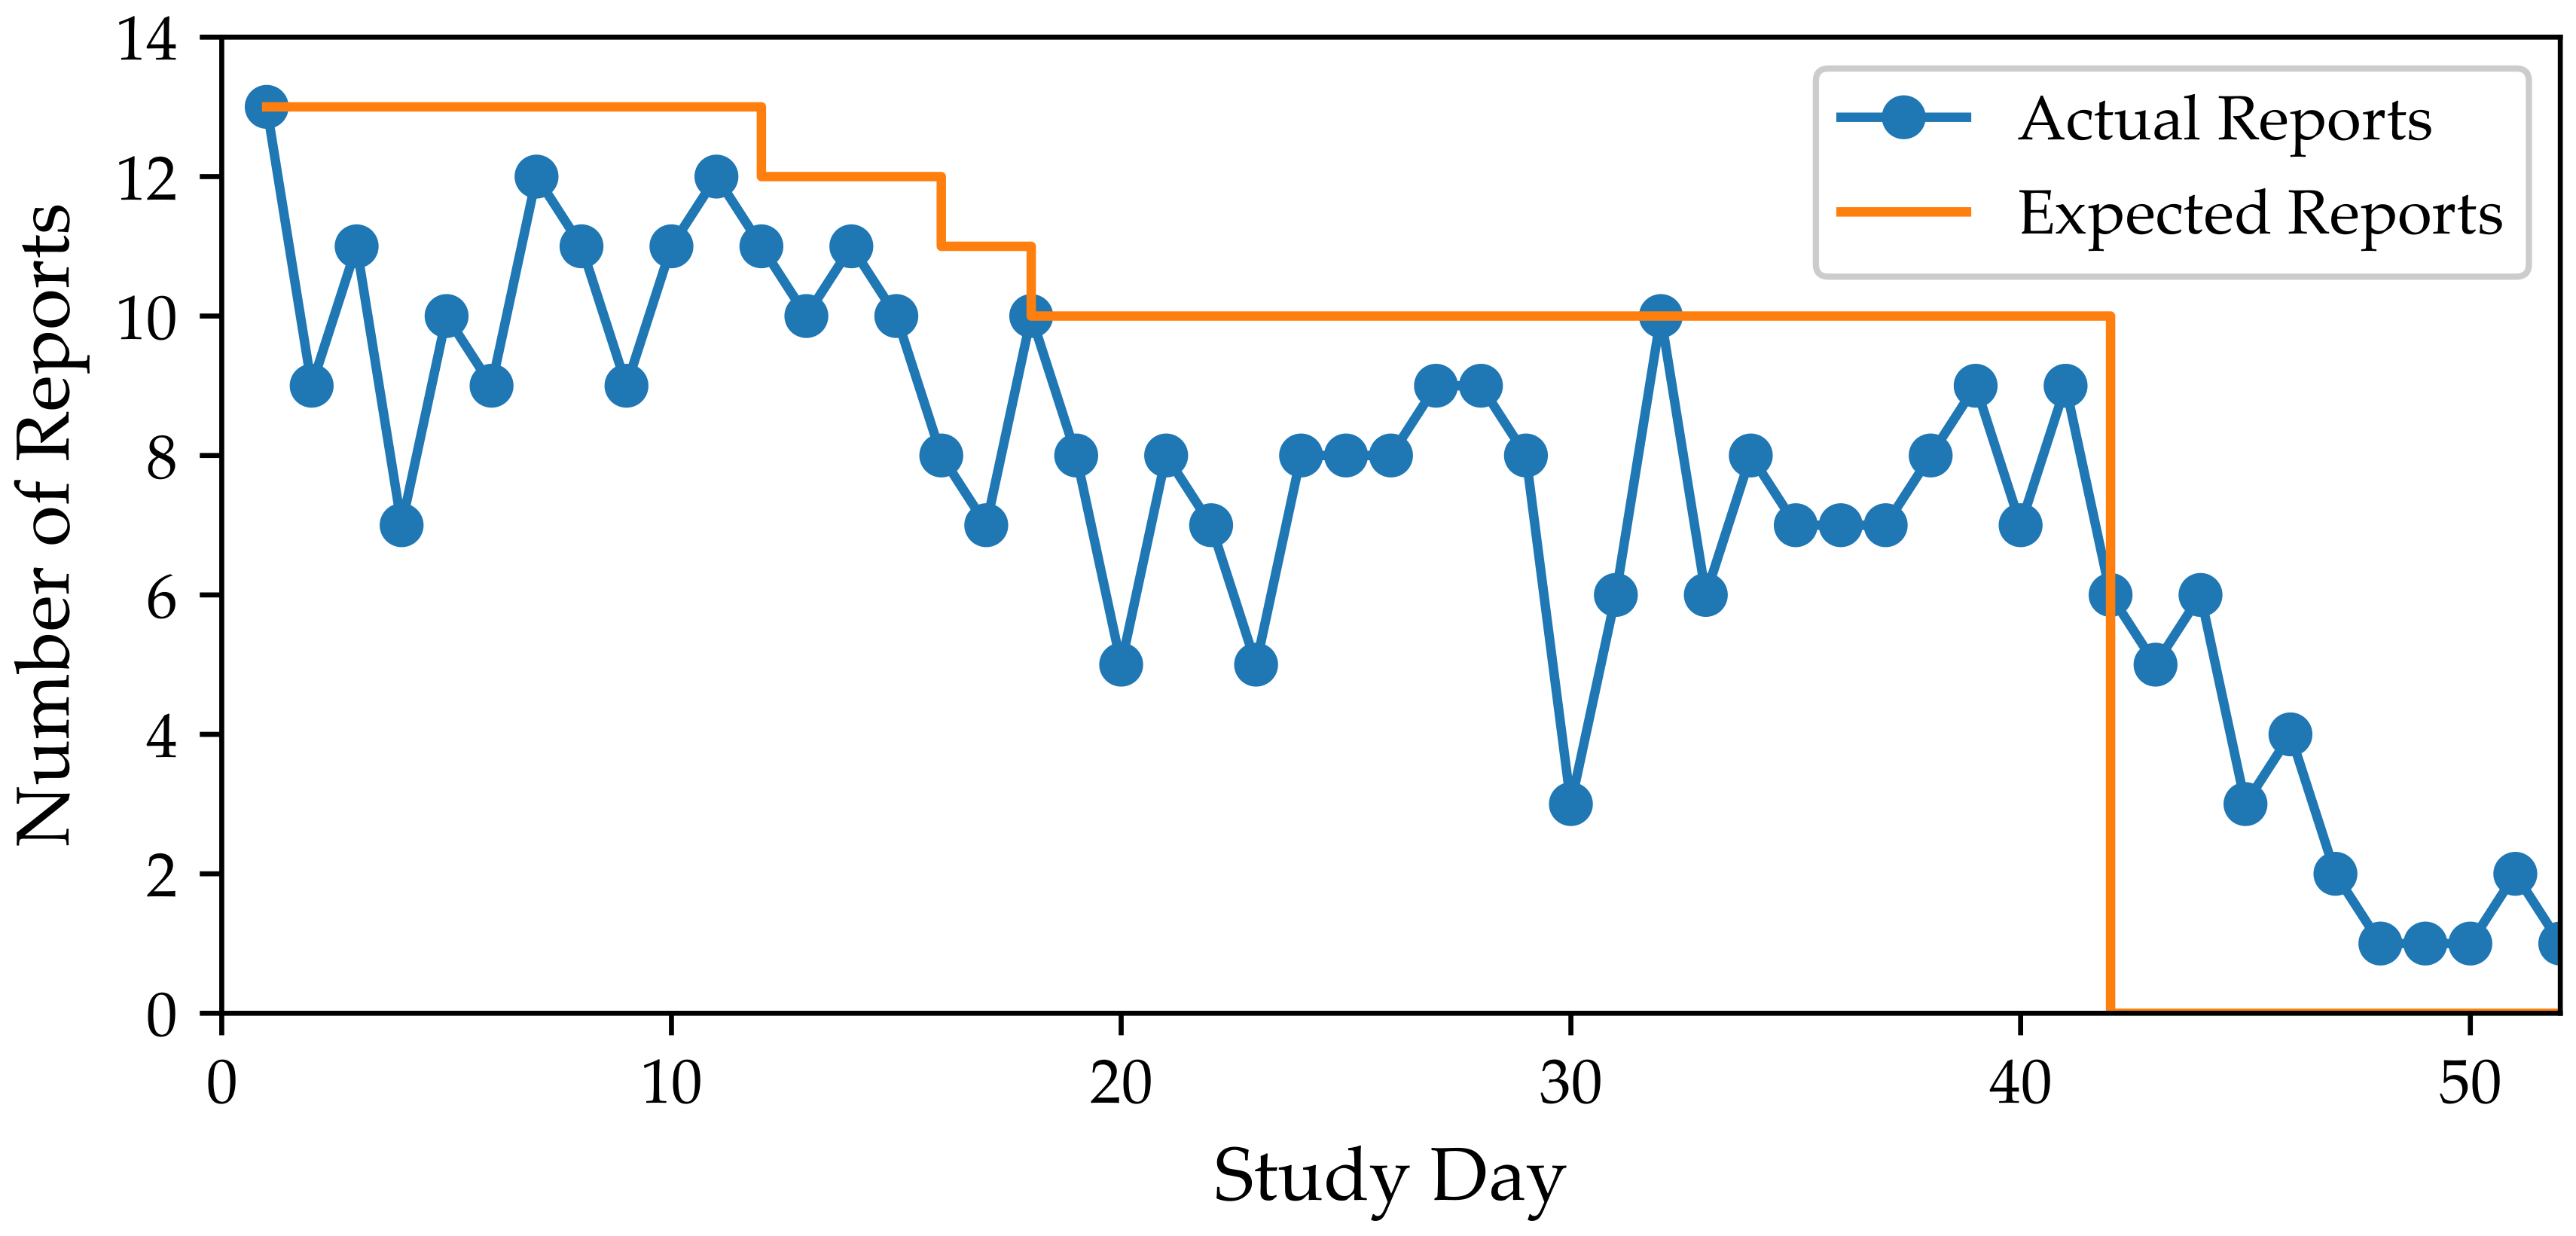
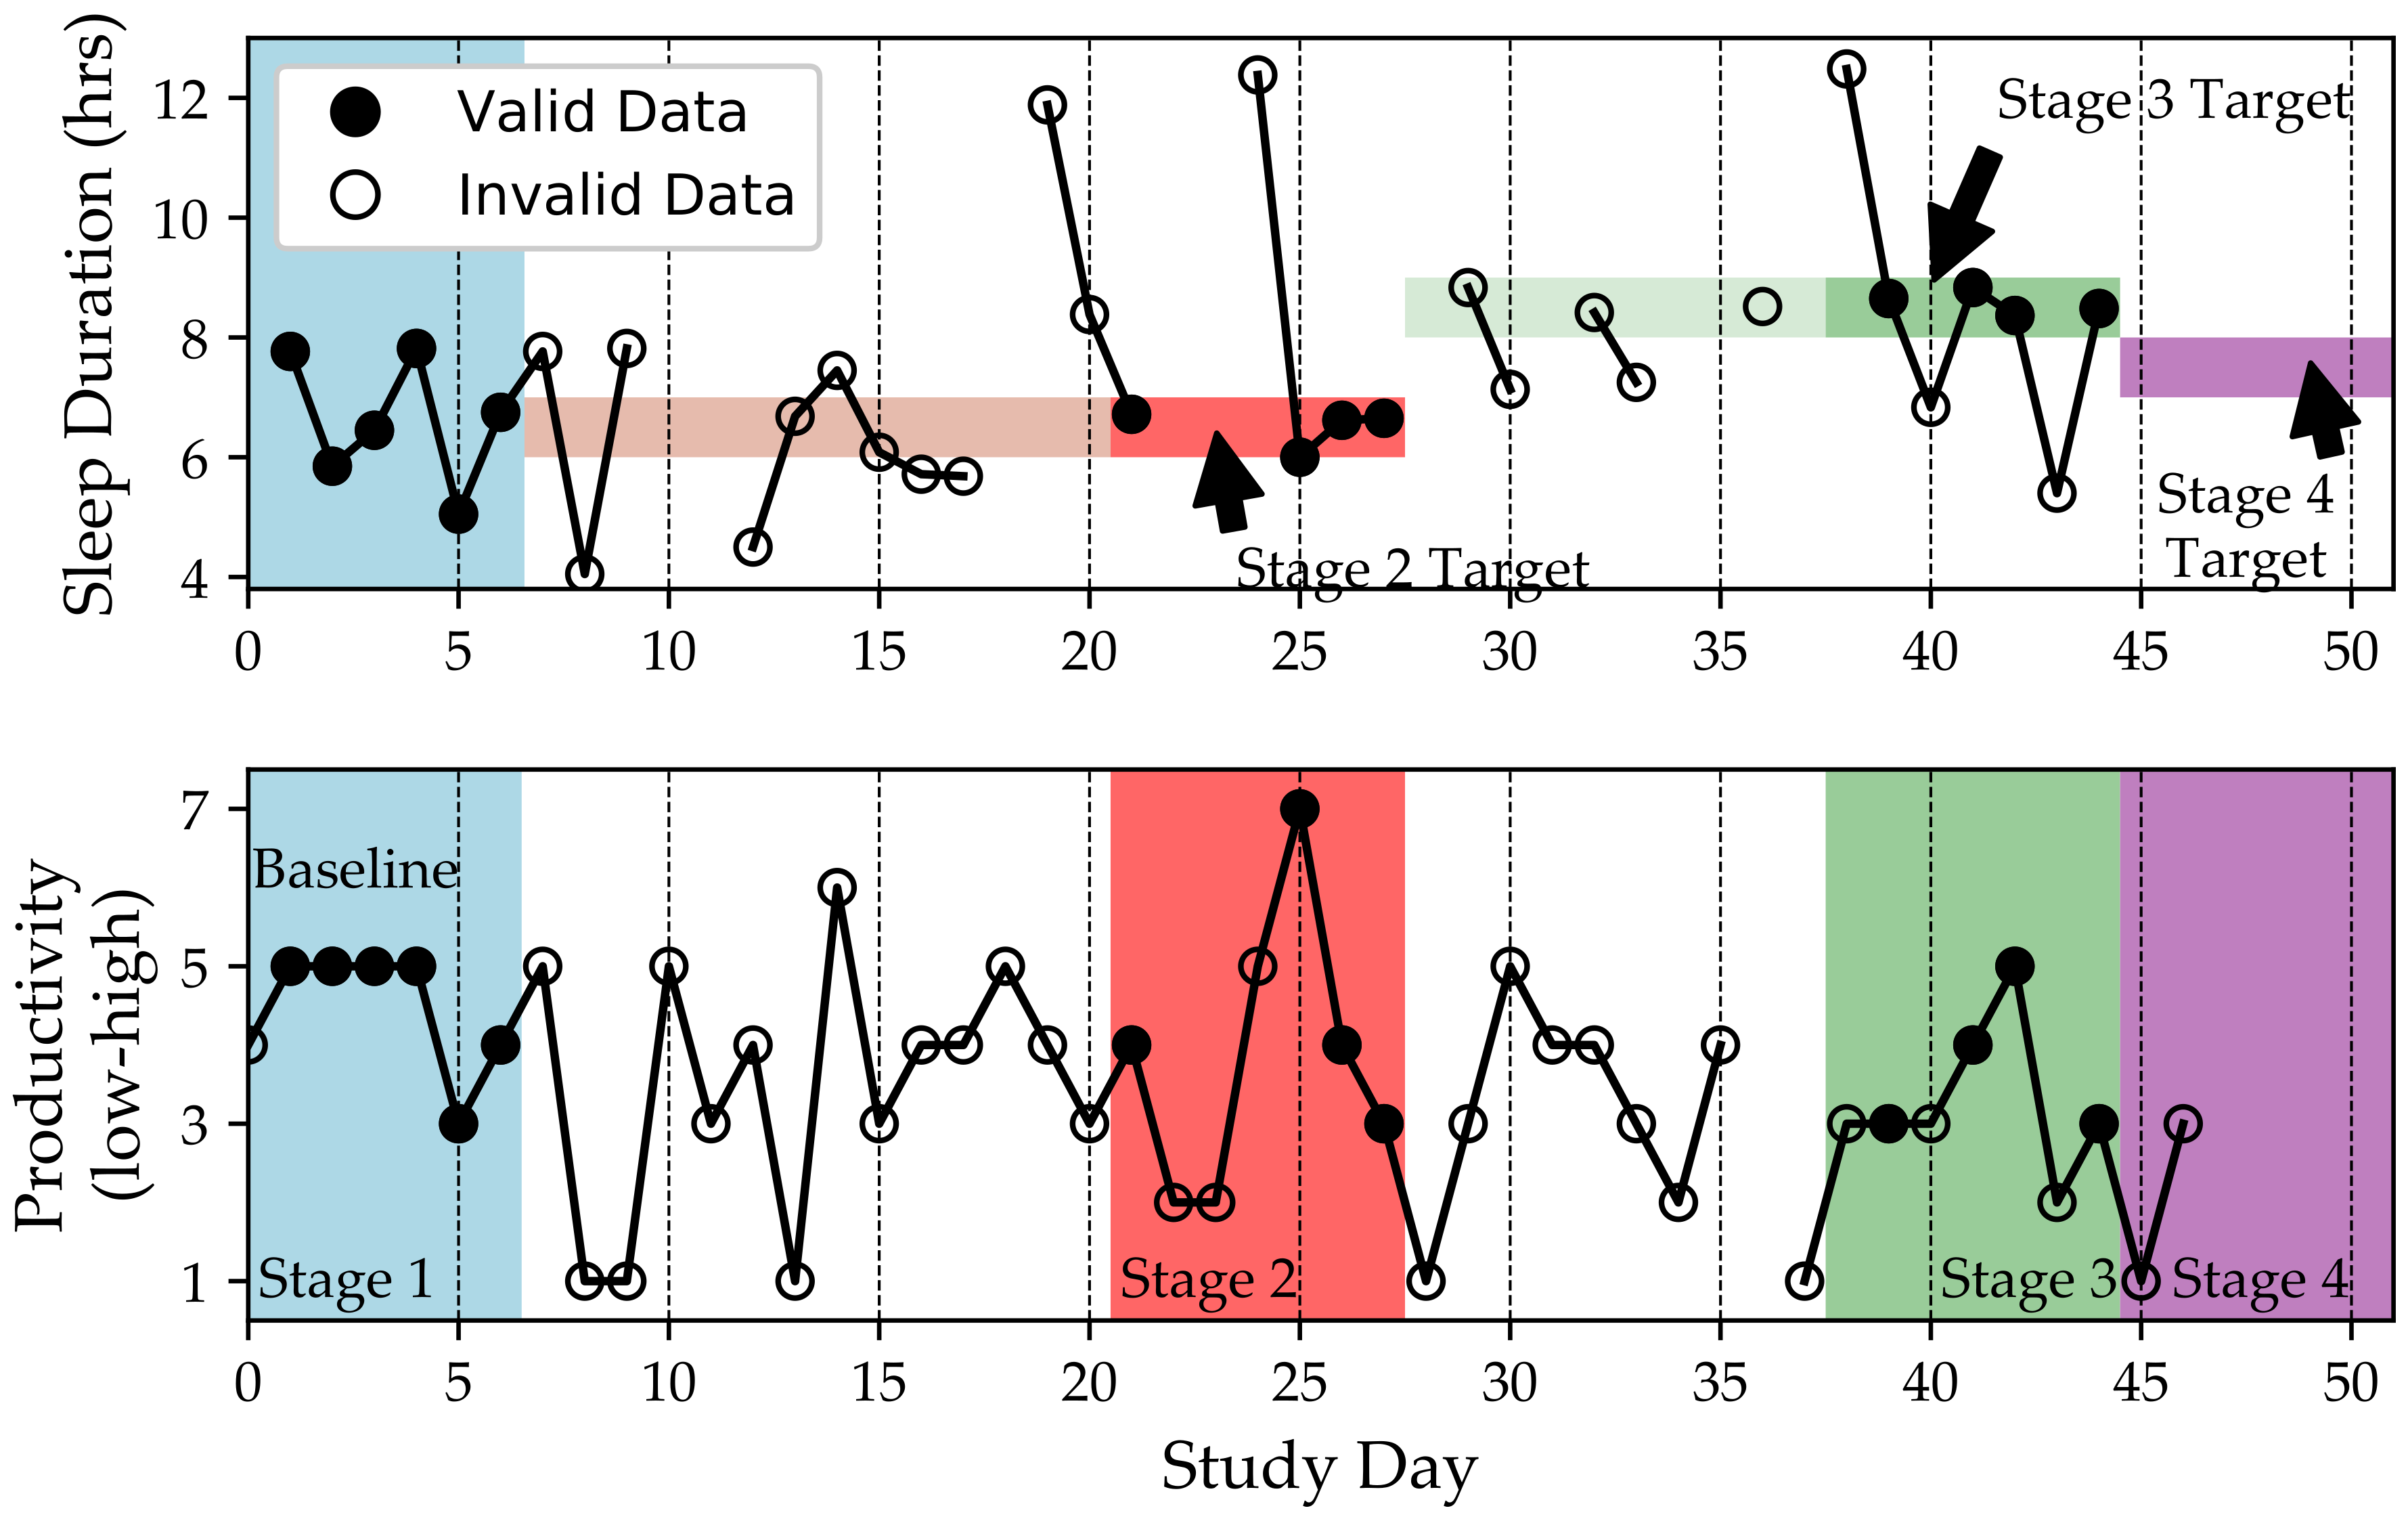
- Participants checked-in to the app on 75.6% of the days but they adapted their behaviors to the target ranges for 22.5% of the days.
- Self-reported adherence to the target behaviors was significantly higher than objective adherence to target behaviors.
- Adherence rates are correlated with personality types (agreeableness and conscientiousness).
- Check-in adherence and objective adherence to the target behaviors were highly correlated with self-reported efficacy.
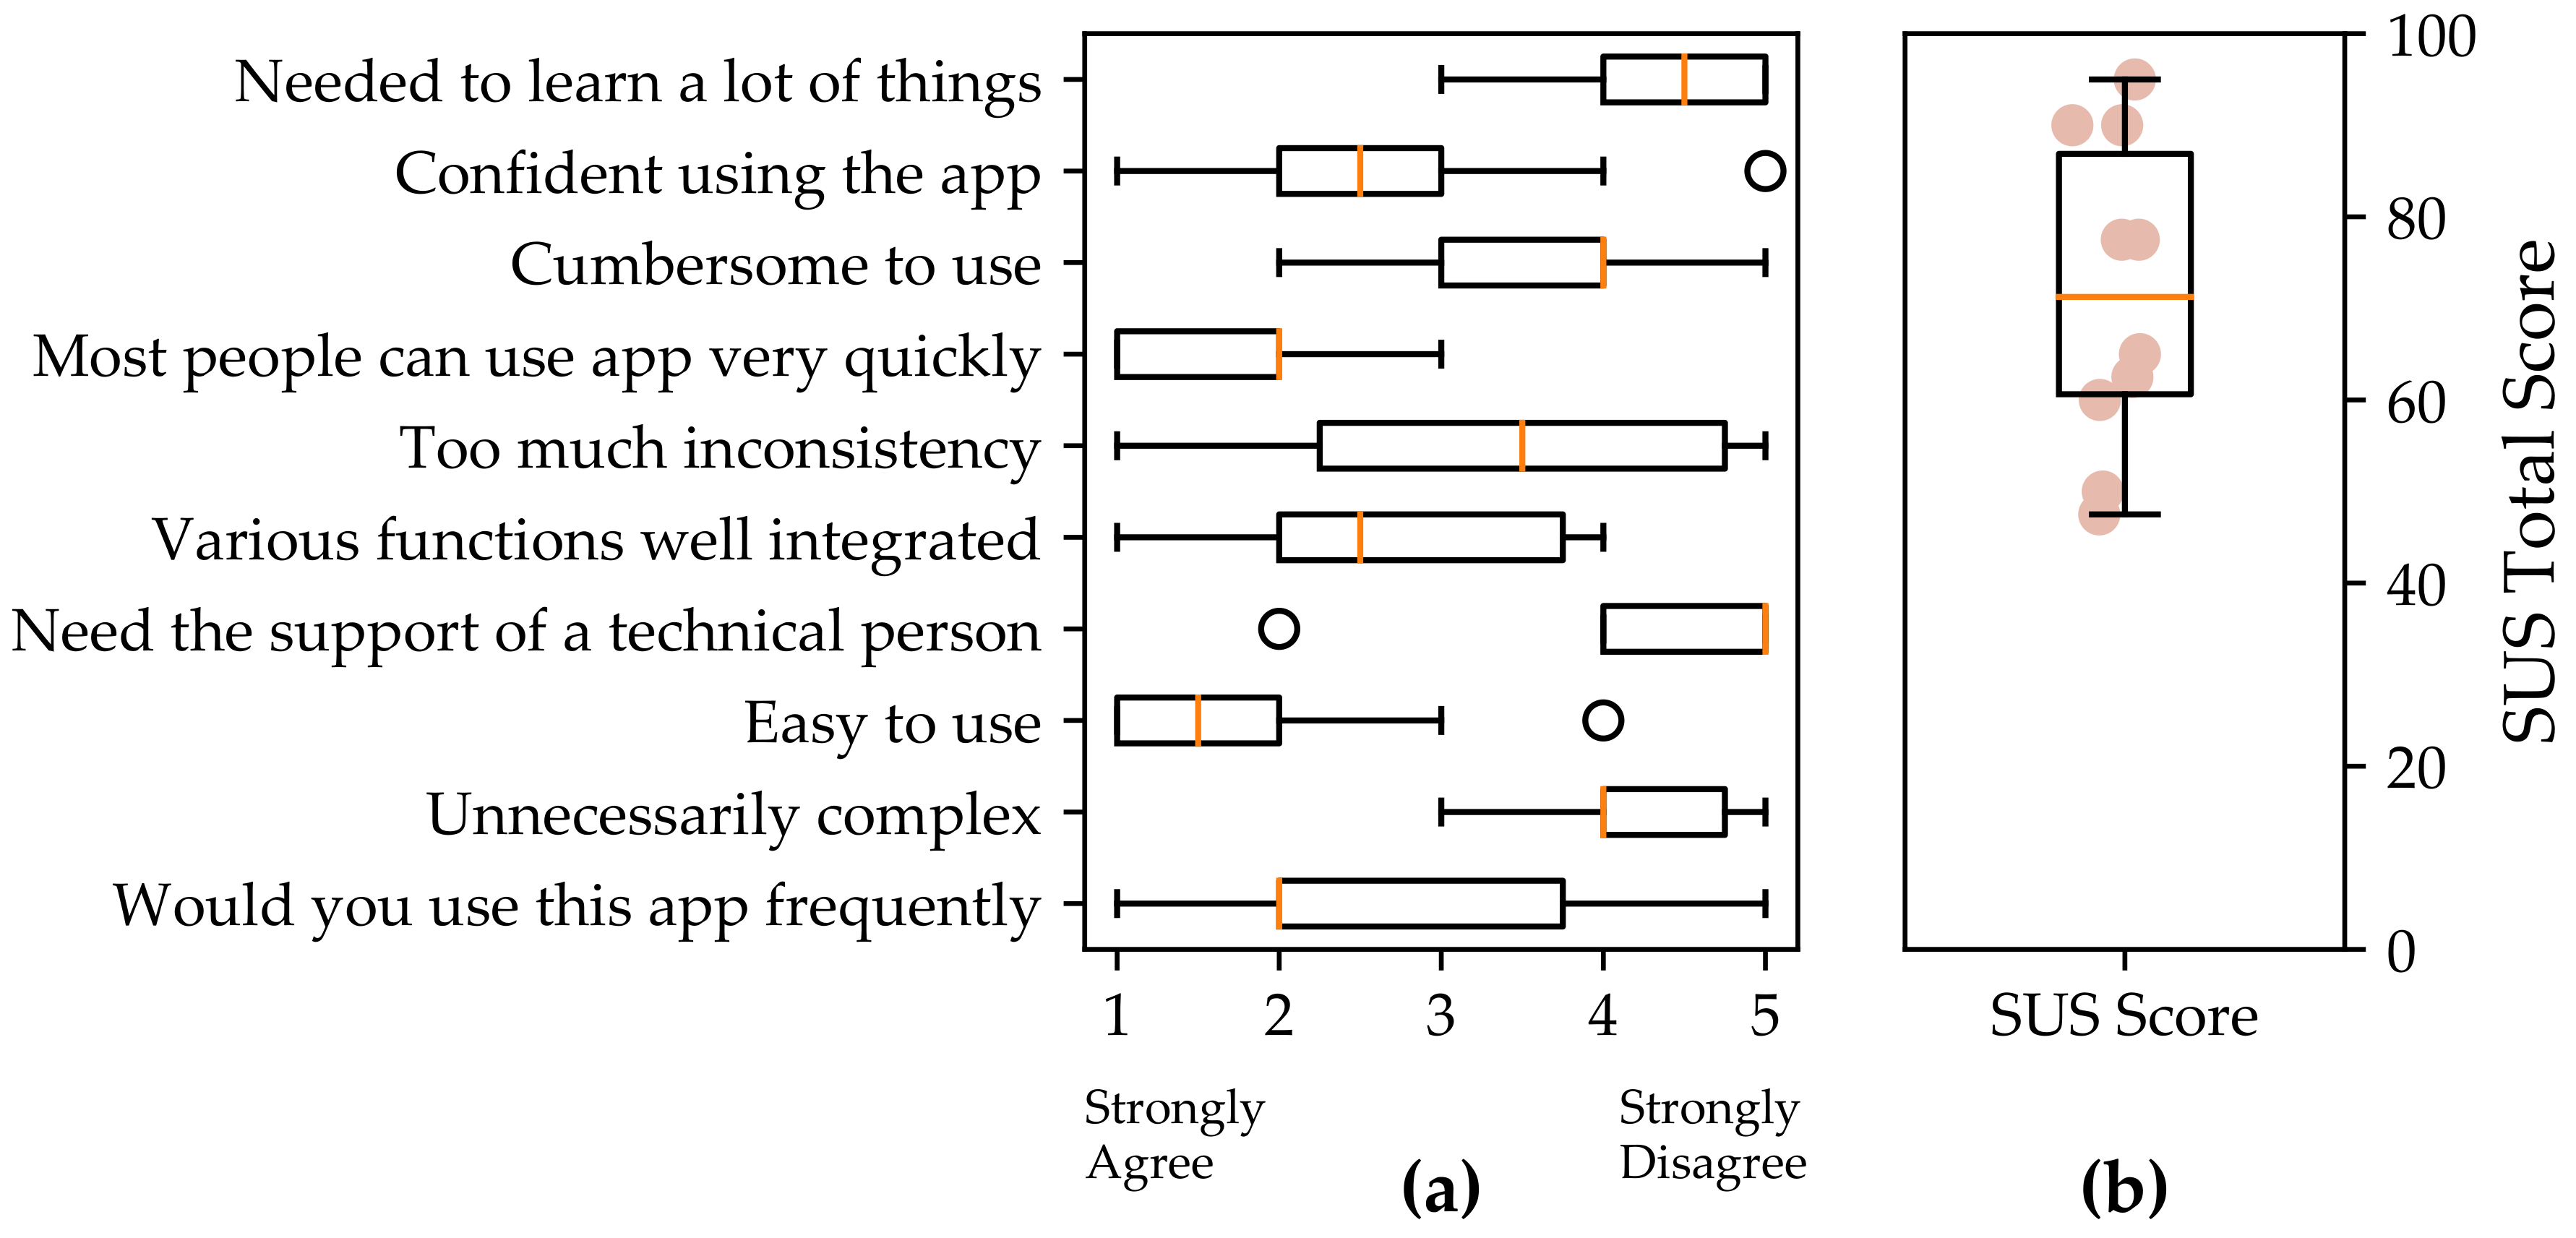
- Participants rated the QuantifyMe Android app as slightly above average on the System Usability scale.
5.1. Pre-Study Surveys
5.2. Self-Experiment Selection
5.3. Efficacy
5.4. Self-Experiment Adherence
5.5. Post-Study Survey
5.6. Relationships among Adherence, Personality, Efficacy, and Usability
6. Discussion
6.1. Usability of the QuantifyMe Platform
6.2. Data Visualizations
6.3. Enhancing Application Usability by Increasing Transparency
- An adequate explanation or motivation of scientific single-case experiment design to be provided throughout the use of the system—so adherence to a behavior is held for a sufficient number of days within each stage in order to properly evaluate its effects.
- Mechanisms that support such adherence, repeatedly, even as demands change in the participants’ life.
6.4. Limitations
7. Conclusions
Acknowledgments
Author Contributions
Conflicts of Interest
References
- IDC. IDC Forecasts Wearables Shipments to Reach 213.6 Million Units. 2016. Available online: http://www.idc.com/getdoc.jsp?containerId=prUS41530816 (accessed on 29 September 2017).
- IDC. Worldwide Mobile Phone Forecast, 2016–2020. Available online: https://www.idc.com/getdoc.jsp?containerId=US41084116 (accessed on 29 September 2017).
- Higgins, J.P. Smartphone applications for patients’ health and fitness. Am. J. Med. 2016, 129, 11–19. [Google Scholar] [CrossRef] [PubMed]
- Poushter, J. Smartphone Ownership and Internet Usage Continues to Climb in Emerging Economies; Pew Research Center: Washington, DC, USA, 2016. [Google Scholar]
- Epstein, D.A. Personal informatics in everyday life. In Proceedings of the 2015 ACM International Joint Conference on Pervasive and Ubiquitous Computing and Proceedings of the 2015 ACM International Symposium onWearable Computers, Osaka, Japan, 7–11 September 2015; pp. 429–434. [Google Scholar]
- CDC. Why Walk? Why Not! 2017. Available online: https://www.cdc.gov/physicalactivity/walking/ (accessed on 29 January 2017).
- Science, L. The Truth About 10,000 Steps a Day. 2017. Available online: http://www.livescience.com/43956-walking-10000-steps-healthy.html (accessed on 29 January 2017).
- Bearder, M. Stephen Wolfram on Personal Analytics. MIT Technol. Rev. July/August 2013. Available online: https://www.technologyreview.com/s/514356/stephen-wolfram-on-personal-analytics/ (accessed on 2 April 2018).
- Swan, M. The quantified self: Fundamental disruption in big data science and biological discovery. Big Data 2013, 1, 85–99. [Google Scholar] [CrossRef] [PubMed]
- Choe, E.K.; Lee, N.B.; Lee, B.; Pratt, W.; Kientz, J.A. Understanding quantified-selfers practices in collecting and exploring personal data. In Proceedings of the 32nd Annual ACM Conference on Human Factors in Computing Systems, Toronto, ON, Canada, 26 April–1 May 2014; pp. 1143–1152. [Google Scholar]
- Mohan, A.; Picard, R. Health0: A new health and lifestyle management paradigm. Stud. Health Technol. Inform. 2003, 108, 43–48. [Google Scholar]
- Pentland, A. Healthwear: Medical technology becomes wearable. Computer 2004, 37, 42–49. [Google Scholar] [CrossRef]
- Eslick, I.S. Crowdsourcing Health Discoveries: From Anecdotes to Aggregated Self-Experiments. Ph.D. Thesis, Massachusetts Institute of Technology, Cambridge, MA, USA, 2013. [Google Scholar]
- FitBit. FitBit App. 2017. Available online: https://www.fitbit.com/app (accessed on 29 January 2017).
- Jawbone. Jawbone Up App. 2017. Available online: https://jawbone.com/ (accessed on 30 April 2017).
- Withings, I. Withings Steel HR Watch. 2017. Available online: https://www.withings.com/es/en/products/steel-hr (accessed on 30 April 2017).
- Choudhury, T.; Consolvo, S.; Harrison, B.; Hightower, J.; LaMarca, A.; LeGrand, L.; Rahimi, A.; Rea, A.; Bordello, G.; Hemingway, B.; et al. The mobile sensing platform: An embedded activity recognition system. IEEE Pervasive Comput. 2008, 7. [Google Scholar] [CrossRef]
- Lester, J.; Choudhury, T.; Borriello, G. A practical approach to recognizing physical activities. In International Conference on Pervasive Computing; Springer: Berlin/Heidelberg, Germany, 2006; pp. 1–16. [Google Scholar]
- MyFitnessPal Inc. 2017. Available online: https://www.myfitnesspal.com/ (accessed on 29 January 2017).
- Cordeiro, F.; Epstein, D.A.; Thomaz, E.; Bales, E.; Jagannathan, A.K.; Abowd, G.D.; Fogarty, J. Barriers and negative nudges: Exploring challenges in food journaling. In Proceedings of the 33rd Annual ACM Conference on Human Factors in Computing Systems, Seoul, Korea, 18–23 April 2015; pp. 1159–1162. [Google Scholar]
- Thomaz, E.; Essa, I.; Abowd, G.D. A practical approach for recognizing eating moments with wrist-mounted inertial sensing. In Proceedings of the 2015 ACM International Joint Conference on Pervasive and Ubiquitous Computing, Osaka, Japan, 7–11 September 2015; pp. 1029–1040. [Google Scholar]
- Bedri, A.; Verlekar, A.; Thomaz, E.; Avva, V.; Starner, T. A wearable system for detecting eating activities with proximity sensors in the outer ear. In Proceedings of the 2015 ACM International Symposium on Wearable Computers, Osaka, Japan, 7–11 September 2015; pp. 91–92. [Google Scholar]
- Kay, M.; Choe, E.K.; Shepherd, J.; Greenstein, B.; Watson, N.; Consolvo, S.; Kientz, J.A. Lullaby: A capture & access system for understanding the sleep environment. In Proceedings of the 2012 ACM Conference on Ubiquitous Computing, Pittsburgh, Pennsylvania, 5–8 September 2012; pp. 226–234. [Google Scholar]
- Min, J.K.; Doryab, A.; Wiese, J.; Amini, S.; Zimmerman, J.; Hong, J.I. Toss’n’turn: Smartphone as sleep and sleep quality detector. In Proceedings of the SIGCHI Conference on Human Factors in Computing Systems, Toronto, ON, Canada, 26 April 26–1 May 2014; pp. 477–486. [Google Scholar]
- Hao, T.; Xing, G.; Zhou, G. iSleep: Unobtrusive sleep quality monitoring using smartphones. In Proceedings of the 11th ACM Conference on Embedded Networked Sensor Systems, Roma, Italy, 11–15 November 2013; p. 4. [Google Scholar]
- Team, U. Sleep as Android. 2017. Available online: https://play.google.com/store/apps/details?id=com.urbandroid.sleep&hl=en (accessed on 29 January 2017).
- Ali, A.A.; Hossain, S.M.; Hovsepian, K.; Rahman, M.M.; Plarre, K.; Kumar, S. mPuff: Automated detection of cigarette smoking puffs from respiration measurements. In Proceedings of the ACM/IEEE 11th International Conference on Information Processing in Sensor Networks (IPSN), Beijing, China, 16–20 April 2012; pp. 269–280. [Google Scholar]
- Sano, A. Measuring College Students’ Sleep, Stress, Mental Health and Wellbeing with Wearable Sensors and Mobile Phones. Ph.D. Thesis, Massachusetts Institute of Technology, Cambridge, MA, USA, 2016. [Google Scholar]
- Hernandez Rivera, J. Towards Wearable Stress Measurement. Ph.D. Thesis, Massachusetts Institute of Technology, Cambridge, MA, USA, 2015. [Google Scholar]
- Morris, M.; Guilak, F. Mobile heart health: Project highlight. IEEE Pervasive Comput. 2009, 8. [Google Scholar] [CrossRef]
- Madan, A.; Moturu, S.T.; Lazer, D.; Pentland, A.S. Social sensing: Obesity, unhealthy eating and exercise in face-to-face networks. Wirel. Health 2010, 104–110. [Google Scholar] [CrossRef]
- Rooksby, J.; Rost, M.; Morrison, A.; Chalmers, M.C. Personal tracking as lived informatics. In Proceedings of the 32nd annual ACM conference on Human factors in computing systems, Toronto, ON, Canada, 26 April–1 May 2014; pp. 1163–1172. [Google Scholar]
- Asimakopoulos, S.; Asimakopoulos, G.; Spillers, F. Motivation and User Engagement in Fitness Tracking: Heuristics for Mobile Healthcare Wearables. Informatics 2017, 4, 5. [Google Scholar] [CrossRef]
- Gouveia, R.; Karapanos, E.; Hassenzahl, M. How do we engage with activity trackers? A longitudinal study of Habito. In Proceedings of the 2015 ACM International Joint Conference on Pervasive and Ubiquitous Computing, Osaka, Japan, 7–11 September 2015; pp. 1305–1316. [Google Scholar]
- Harrison, D.; Marshall, P.; Bianchi-Berthouze, N.; Bird, J. Activity tracking: Barriers, workarounds and customisation. In Proceedings of the 2015 ACM International Joint Conference on Pervasive and Ubiquitous Computing, Osaka, Japan, 7–11 September 2015; pp. 617–621. [Google Scholar]
- Evans, B. PACO Personal Analytics Companion. 2017. Available online: https://quantifiedself.appspot.com/ (accessed on 29 January 2017).
- Daskalova, N.; Metaxa-Kakavouli, D.; Tran, A.; Nugent, N.; Boergers, J.; McGeary, J.; Huang, J. SleepCoacher: A Personalized Automated Self-Experimentation System for Sleep Recommendations. In Proceedings of the 29th Annual Symposium on User Interface Software and Technology, Tokyo, Japan, 16–19 October 2016; pp. 347–358. [Google Scholar]
- Karkar, R.; Schroeder, J.; Epstein, D.A.; Pina, L.R.; Scofield, J.; Fogarty, J.; Kientz, J.A.; Munson, S.A.; Vilardaga, R.; Zia, J. TummyTrials: A Feasibility Study of Using Self-Experimentation to Detect Individualized Food Triggers. In Proceedings of the 2017 CHI Conference on Human Factors in Computing Systems, Denver, CO, USA, 6–11 May 2017; pp. 6850–6863. [Google Scholar]
- Karkar, R.; Zia, J.; Vilardaga, R.; Mishra, S.R.; Fogarty, J.; Munson, S.A.; Kientz, J.A. A framework for self-experimentation in personalized health. J. Am. Med. Inform. Assoc. 2015, 23, 440–448. [Google Scholar] [CrossRef] [PubMed]
- Daskalova, N.; Desingh, K.; Papoutsaki, A.; Schulze, D.; Sha, H.; Huang, J. Lessons Learned from Two Cohorts of Personal Informatics Self-Experiments. Proc. ACM Interact. Mob. Wearable Ubiquitous Technol. 2017, 1, 1–22. [Google Scholar] [CrossRef]
- Meldrum, M.L. A brief history of the randomized controlled trial: From oranges and lemons to the gold standard. Hematol./Oncol. Clin. N. Am. 2000, 14, 745–760. [Google Scholar] [CrossRef]
- Barlow, D.H.; Hersen, M. Single Case Experimental Designs; Pergamon Press: Oxford, UK, 1984. [Google Scholar]
- Neuringer, A. Self-experimentation: A call for change. Behaviorism 1981, 9, 79–94. [Google Scholar]
- Lillie, E.O.; Patay, B.; Diamant, J.; Issell, B.; Topol, E.J.; Schork, N.J. The n-of-1 clinical trial: the ultimate strategy for individualizing medicine? Pers. Med. 2011, 8, 161–173. [Google Scholar] [CrossRef] [PubMed]
- Kratochwill, T.R.; Hitchcock, J.H.; Horner, R.H.; Levin, J.R.; Odom, S.L.; Rindskopf, D.M.; Shadish, W.R. Single-case intervention research design standards. Remedial Spec. Educ. 2013, 34, 26–38. [Google Scholar] [CrossRef]
- Newman, F.L.; Wong, S.E. Progress and outcome assessment of individual patient data: Selecting single subject design and statistical procedures. In The Use of Psychological Testing for Treatment Planning & Outcome Assessment, 3rd ed.; Lawrence Erlbaum Associates: Mahwah, NJ, USA, 2004; Volume 1, pp. 273–289. [Google Scholar]
- Van, d.N.; Onghena, P. Combining single-case experimental data using hierarchical linear models. Sch. Psychol. Q. 2003, 18, 325–346. [Google Scholar]
- Anderson, K.; Burford, O.; Emmerton, L. Mobile Health Apps to Facilitate Self-Care: A Qualitative Study of User Experiences. PLoS ONE 2016, 11, e0156164. [Google Scholar] [CrossRef] [PubMed]
- Cohen, S.; Kamarck, T.; Mermelstein, R. A global measure of perceived stress. J. Health Soc. Behav. 1983, 24, 385–396. [Google Scholar] [CrossRef] [PubMed]
- John, O.P.; Srivastava, S. The Big Five trait taxonomy: History, measurement, and theoretical perspectives. Handb. Personal. Theory Res. 1999, 2, 102–138. [Google Scholar]
- Brooke, J. SUS-A quick and dirty usability scale. Usabil. Evaluation Ind. 1996, 189, 4–7. [Google Scholar]
- Srivastava, S.; John, O.P.; Gosling, S.D.; Potter, J. Development of personality in early and middle adulthood: Set like plaster or persistent change? J. Personal. Soc. Psychol. 2003, 84, 1041–1053. [Google Scholar] [CrossRef]
- Sauro, J. SUStisfied? Little-Known System Usability Scale Facts. 2011. Available online: http://uxpamagazine.org/sustified/ (accessed on 12 February 2018).
- Hilliard, R.C.; Brewer, B.W.; Cornelius, A.E.; Van Raalte, J.L. Big Five Personality Characteristics and Adherence to Clinic-Based Rehabilitation Activities after ACL Surgery: A Prospective Analysis. Open Rehabil. J. 2014, 7, 1–5. [Google Scholar] [CrossRef] [PubMed]
- Wu, J.R.; Song, E.K.; Moser, D.K. Type D personality, self-efficacy, and medication adherence in patients with heart failure—A mediation analysis. Heart Lung J. Acute Crit. Care 2015, 44, 276–281. [Google Scholar] [CrossRef] [PubMed]
- Halko, S.; Kientz, J.A. Personality and Persuasive Technology: An Exploratory Study on Health-Promoting Mobile Applications. In Persuasive Technology; Springer: Berlin/Heidelberg, Germany, 2010; pp. 150–161. [Google Scholar]


| Independent Variables | Outcome Variables |
|---|---|
| the amount of time I am active | happiness |
| the number of steps I take | stress |
| my sleep duration | productivity |
| my bedtime | sleep efficiency 1 |
| the amount of time I meditate | |
| the time I spend outside | |
| the time I spend having fun | |
| attending a religious service once per week |
| Zone Goal | Target Zone Size | |||||
|---|---|---|---|---|---|---|
| Under | O1 | O2 | O3 | Over | ||
| Number of Steps (#) | <6500 | 8000 | 11,000 | 14,000 | >15,500 | ±1500 |
| Bed Time Variability (±min) | <15 | 30 | 60 | 90 | >105 | ±15 |
| Sleep Duration (h) | <6 | 6.5 | 7.5 | 8.5 | >9 | ±0.5 |
| Leisure Time (min) | <15 | 30 | 60 | 90 | >105 | ±15 |
| Stage 1 (Baseline) | Stage 2 | Stage 3 | Stage 4 |
|---|---|---|---|
| O1 | O3 | O1 | O2 |
| O2 | O3 | O1 | O2 |
| O3 | O1 | O3 | O2 |
| Under | O1 | O3 | O2 |
| Over | O3 | O1 | O2 |
| Happiness | Stress | Sleep Quality | |
|---|---|---|---|
| Mean | 4.1 | 3.5 | 3.6 |
| St. Dev. | 1.7 | 1.7 | 1.0 |
| Extraversion | Agreeableness | Conscientiousness | Neuroticism | Openness | |
|---|---|---|---|---|---|
| Mean | 2.6 | 3.7 | 3.2 | 3.1 | 3.7 |
| St. Dev. | 1.0 | 0.7 | 0.7 | 0.9 | 0.6 |
| App Efficacy | Experiment Efficacy | Self-Efficacy | |
|---|---|---|---|
| Mean | 3.7 | 4.2 | 3.9 |
| Median | 4 | 4 | 4 |
| St. Dev. | 1.1 | 1.6 | 1.0 |
© 2018 by the authors. Licensee MDPI, Basel, Switzerland. This article is an open access article distributed under the terms and conditions of the Creative Commons Attribution (CC BY) license (http://creativecommons.org/licenses/by/4.0/).
Share and Cite
Taylor, S.; Sano, A.; Ferguson, C.; Mohan, A.; Picard, R.W. QuantifyMe: An Open-Source Automated Single-Case Experimental Design Platform. Sensors 2018, 18, 1097. https://doi.org/10.3390/s18041097
Taylor S, Sano A, Ferguson C, Mohan A, Picard RW. QuantifyMe: An Open-Source Automated Single-Case Experimental Design Platform. Sensors. 2018; 18(4):1097. https://doi.org/10.3390/s18041097
Chicago/Turabian StyleTaylor, Sara, Akane Sano, Craig Ferguson, Akshay Mohan, and Rosalind W. Picard. 2018. "QuantifyMe: An Open-Source Automated Single-Case Experimental Design Platform" Sensors 18, no. 4: 1097. https://doi.org/10.3390/s18041097
APA StyleTaylor, S., Sano, A., Ferguson, C., Mohan, A., & Picard, R. W. (2018). QuantifyMe: An Open-Source Automated Single-Case Experimental Design Platform. Sensors, 18(4), 1097. https://doi.org/10.3390/s18041097