3.1. Structural Characterization of Nanoparticles and Ferrogels
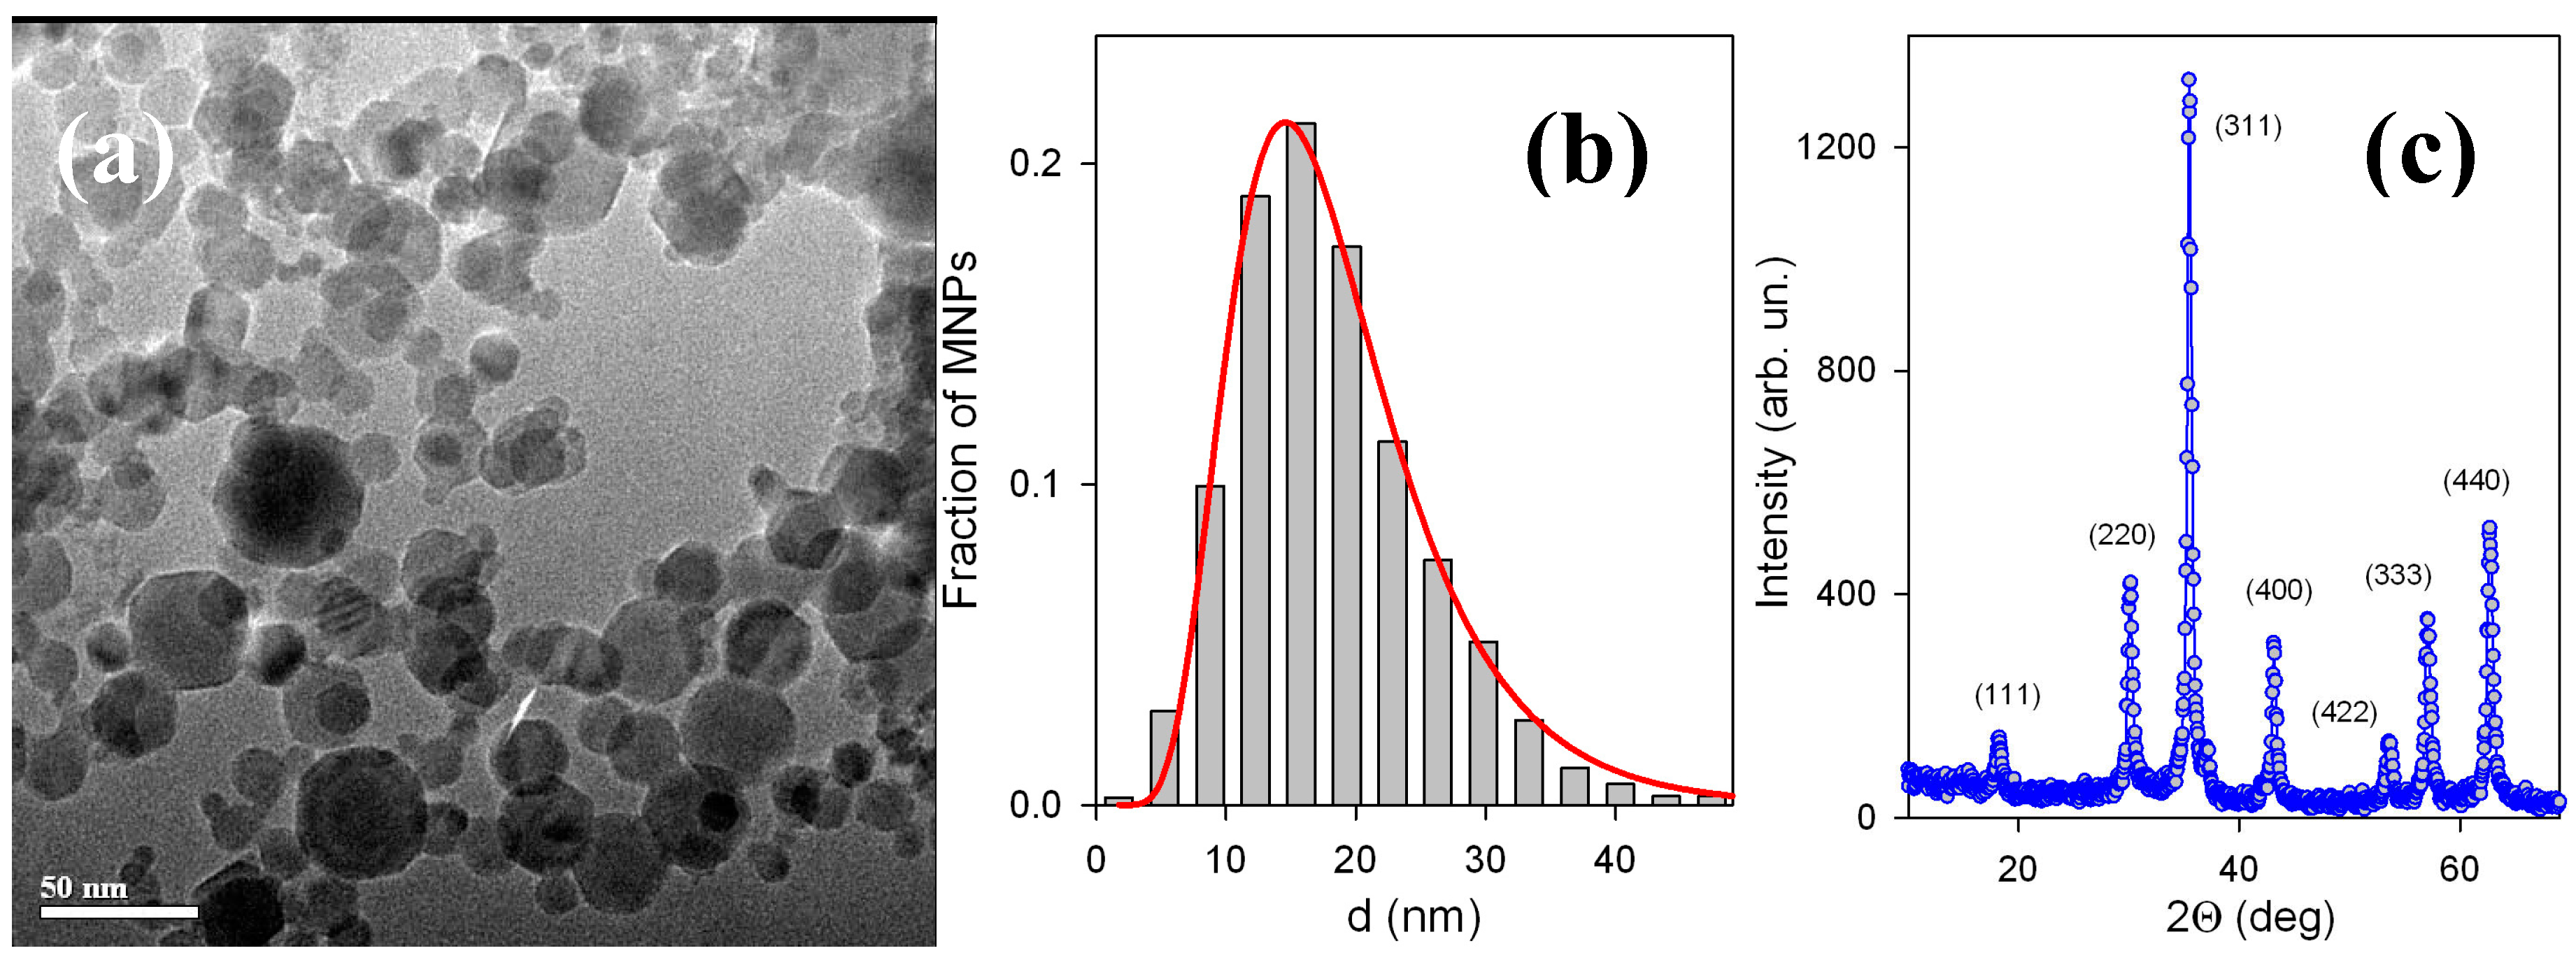
Figure 3a gives TEM image of synthesized MNPs and
Figure 2b gives particle size distribution (PSD) histogram which was obtained by the graphical evaluation of the diameter of 2160 particles. The particles are spherical and non-coalescent. Only a few of the particles appeared to be hexagonal or to have hexagonal corners. PSD is well fitted by the following lognormal distribution function:
The specific surface area of MNPs was 64 m
2/g. The surface average diameter of MNPs, calculated from this value using the equation d
s = 6/(ρ × S
sp) (ρ = 4.6 g/cm
3 being iron oxide density) was 20.7 nm. This was in fair agreement with the value d
s = 24.4 nm, obtained using PSD (Equation (5)). The discrepancy between these two values apparently stems from the deviation from the spherical shape of several MNPs, which can be noticed in
Figure 3. The polyhedral shape provides larger surface than sphere. Hence, the specific surface area of the ensemble of MNPs in the study is to some extent higher than that for the equivalent ensemble of exact spheres. The enlarged S
sp resulted in lower estimated values of d
s than that obtained from PSD.
XRD patterns of iron oxide MNPs are given in
Figure 3c. The crystalline structure of MNPs corresponded to the inverse spinel lattice with a space group Fd3m. The lattice period was found, a = 0.8358 nm, which was larger than that for maghemite (γ-Fe
2O
3, a = 0.8346 nm) but lower than that for magnetite (Fe
3O
4, a = 0.8396) [
36]. Based on the dependence between the lattice period of the spinel cell and the effective state of oxidation of Fe, the non-stoichiometric composition of MNPs was found Fe
2.75O
4.
Ferrofluids with MNPs were stable to aggregation and sedimentation. The average hydrodynamic diameter of MNPs in suspension measured by the dynamic light scattering was 56 nm, and it did not change during a month of observation. This value corresponds to the fifth mode of PSD and is therefore larger that the value of d
s given above, which stands for the second mode. The discrepancy between them stems from the polydispersity of the ensemble of MNPs. The value of hydrodynamic diameter correlates well with such data obtained for LTE iron oxide MNPs earlier [
28] and corresponds to the individual particles in ferrofluid. The stability of ferrofluids was provided by the adsorption of negatively charged citrate anions on the surface of MNPs [
28,
29]. It gave negative net charge to the dispersed MNPs, provided their repulsion in the suspension, and prevented aggregation. The value of zeta-potential of the suspension was −40 mV, which was higher (in absolute value) than the threshold for the electrostatic stability of water-based suspensions [
37].
No visible aggregation was observed in ferrofluid in the synthesis of ferrogels, which remained clear and non-opalescent after polymerization was completed. Thus, we assumed that individual MNPs present in ferrofluid remained in the ferrogel.
The main structural feature of ferrogel is the mesh size of its network. This can be estimated based on the equilibrium swelling ratio of a gel, which is the uptake of water by the dry polymeric network. The swelling ratio for all ferrogels is given in
Table 1. There is a noticeable diminishing trend in values of apparent swelling ratio α, which was calculated according to Equation (1). Meanwhile, one should take into account that values of α included the weight of embedded MNPs. It is more correct to use the value of the swelling ratio for the PAAm network, α’ for the mesh size characterization. These values only slightly depended on the presence of embedded MNPs (see
Table 1). We used the average value of α’ to characterize the mesh size of FG-I and FG-II series. It was 13.5 ± 0.8 for the FG-I series and 7.0 ± 0.4 for the FG-II series. The obtained values were then corrected, taking into account that dry residues contained both polymer and iron oxide MNPs. The degree of swelling related solely to the polyacrylamide network in ferrogels was independent of MNPs content in the gel. That is, iron oxide MNPs do not provide extra cross-linking of the network due to the adsorption of the sub-chains on their surface.
Based on the equilibrium degree of swelling of the polymeric network (
α’) the average number of monomer units in linear sub-chains between cross-links (
NC) was evaluated using the Flory-Rehner equation [
38]:
where
V1,
V2 are molar volumes of a solvent and of a polymer respectively,
χ is Flory-Huggins parameter for a polymer-solvent mixture. We used
V1 = 18 cm
3/mol (water),
V2 = 56.2 cm
3/mol (PAAm) and
χ = 0.12. The last two values were obtained by means of quantum mechanics molecular modeling software package CAChe7.5. Equation (7) gave the number of monomer units in linear sub-chains
NC = 55 for the PAAm network in the FG-I series and
NC = 16 for the FG-II series.
The equilibrium conformation of electrically neutral PAAm subchain in water is a random Gaussian coil with hindered rotation. The mean square end-to-end distance <R
2>, which corresponds to the distance between adjacent cross-links (in other words the mesh size of the network) can be calculated according to the equation [
39]:
where
N is the number of bonds in the polymeric chain,
a is the bond length,
θ is the bond angle. We took
a = 0.154 nm for the ordinary C–C bond,
θ = 109.5° for the bond angle, and
N = 2NC for the number of bonds. The mesh size of the network, calculated using Equation (8) is 2.4 nm for the FG-I series and 1.2 nm for the FG-II series. Both values are by an order of magnitude smaller than the average diameter of iron oxide MNPs (24.4 nm), which means that the cross-links of the polymeric network are closer to each other than the particle diameter. As a result, the MNPs cannot freely move inside the polymeric network of FG but are entrapped in it.
3.2. Deformation of Ferrogels and Their Electrical Properties
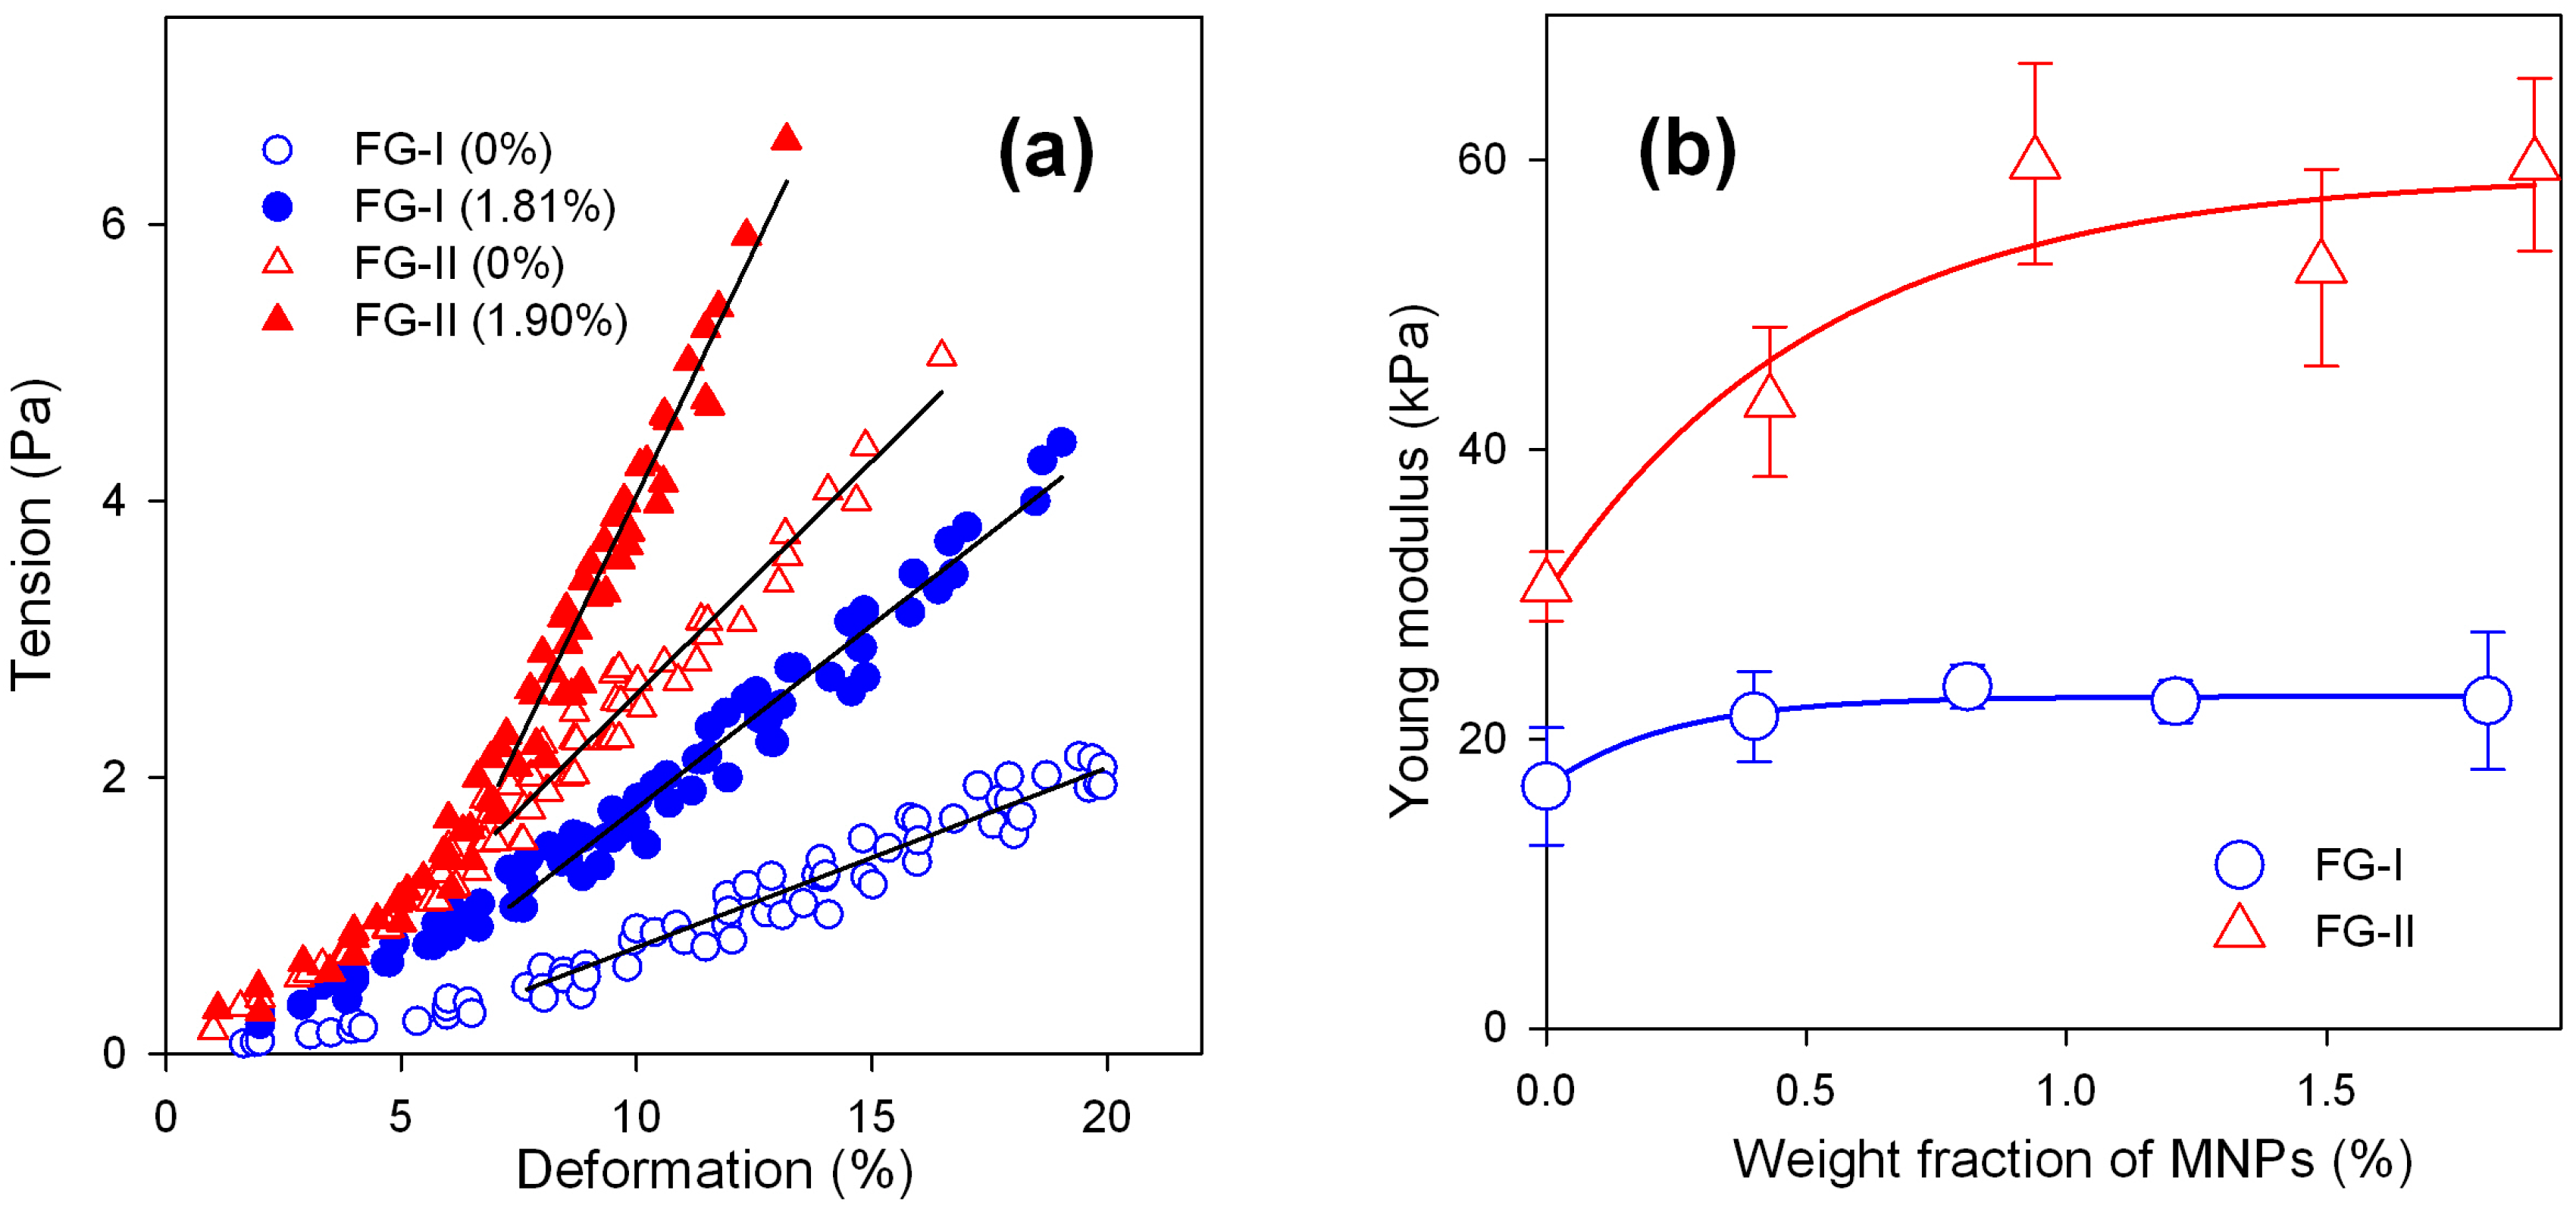
Figure 4a presents typical compression deformation plots for ferrogels of FG-I and FG-II series. Each plot is a combination of several step-wise deformation runs on the same sample. It is noticeable that deformation of soft ferrogels of the FG-I series takes place at lower values of tension than the deformation of ferrogels of the FG-II series (dense). This is a consequence of the smaller mesh size of the latter. In both series the embedding of MNPs in polymeric network substantially enlarges the tension, which is necessary to achieve a certain level of deformation. In this respect, embedded MNPs provide the enhancement of mechanical strength of a ferrogel equivalent to the additional cross-linking. Meanwhile, the swelling ratio of PAAm network (see
Table 1) is not as sensitive to the presence of MNPs in the structure as mechanical strength. One common feature among plots given in
Figure 4a is that there are two parts with a different slope in all of them. The initial part of the plot in the deformation range 0–7% is concave, while at higher deformations the plot is linear. Apparently, the concave part is the result of complex structural changes, which take place in the polymeric network under the applied force. The linear parts of the plots were taken for the calculation of Young modulus of ferrogels in both series.
Figure 4b shows the dependence of the Young modulus on the weight fraction of MNPs in ferrogel for FG-I and FG-II series. In FG-II (dense) series the embedding of MNPs in the polymeric network, even in a minimal concentration, resulted in a substantial increase of the Young modulus. In contrast, the addition of MNPs in a concentration larger than 1 wt % does not result in further increase of the modulus. In the FG-I (soft) series the influence of MNPs on the Young modulus of ferrogels is not as pronounced as in the FG-II series. Meanwhile, a limited increase in modulus with the weight fraction of MNPs can still be observed. There are two conclusions, which can be made from the data given in
Figure 4. The first is that iron oxide MNPs in low concentration provide the increase in the Young modulus of ferrogels. The second is that this effect is enhanced by the density of the polymeric network. It is almost negligible if the mesh size of the network is large, and it becomes substantial if it decreases. This could also be attributed to the water uptake (swelling ratio) of the polymeric network. In other words, the influence of MNPs on the Young modulus becomes larger at a lower water uptake of the network.
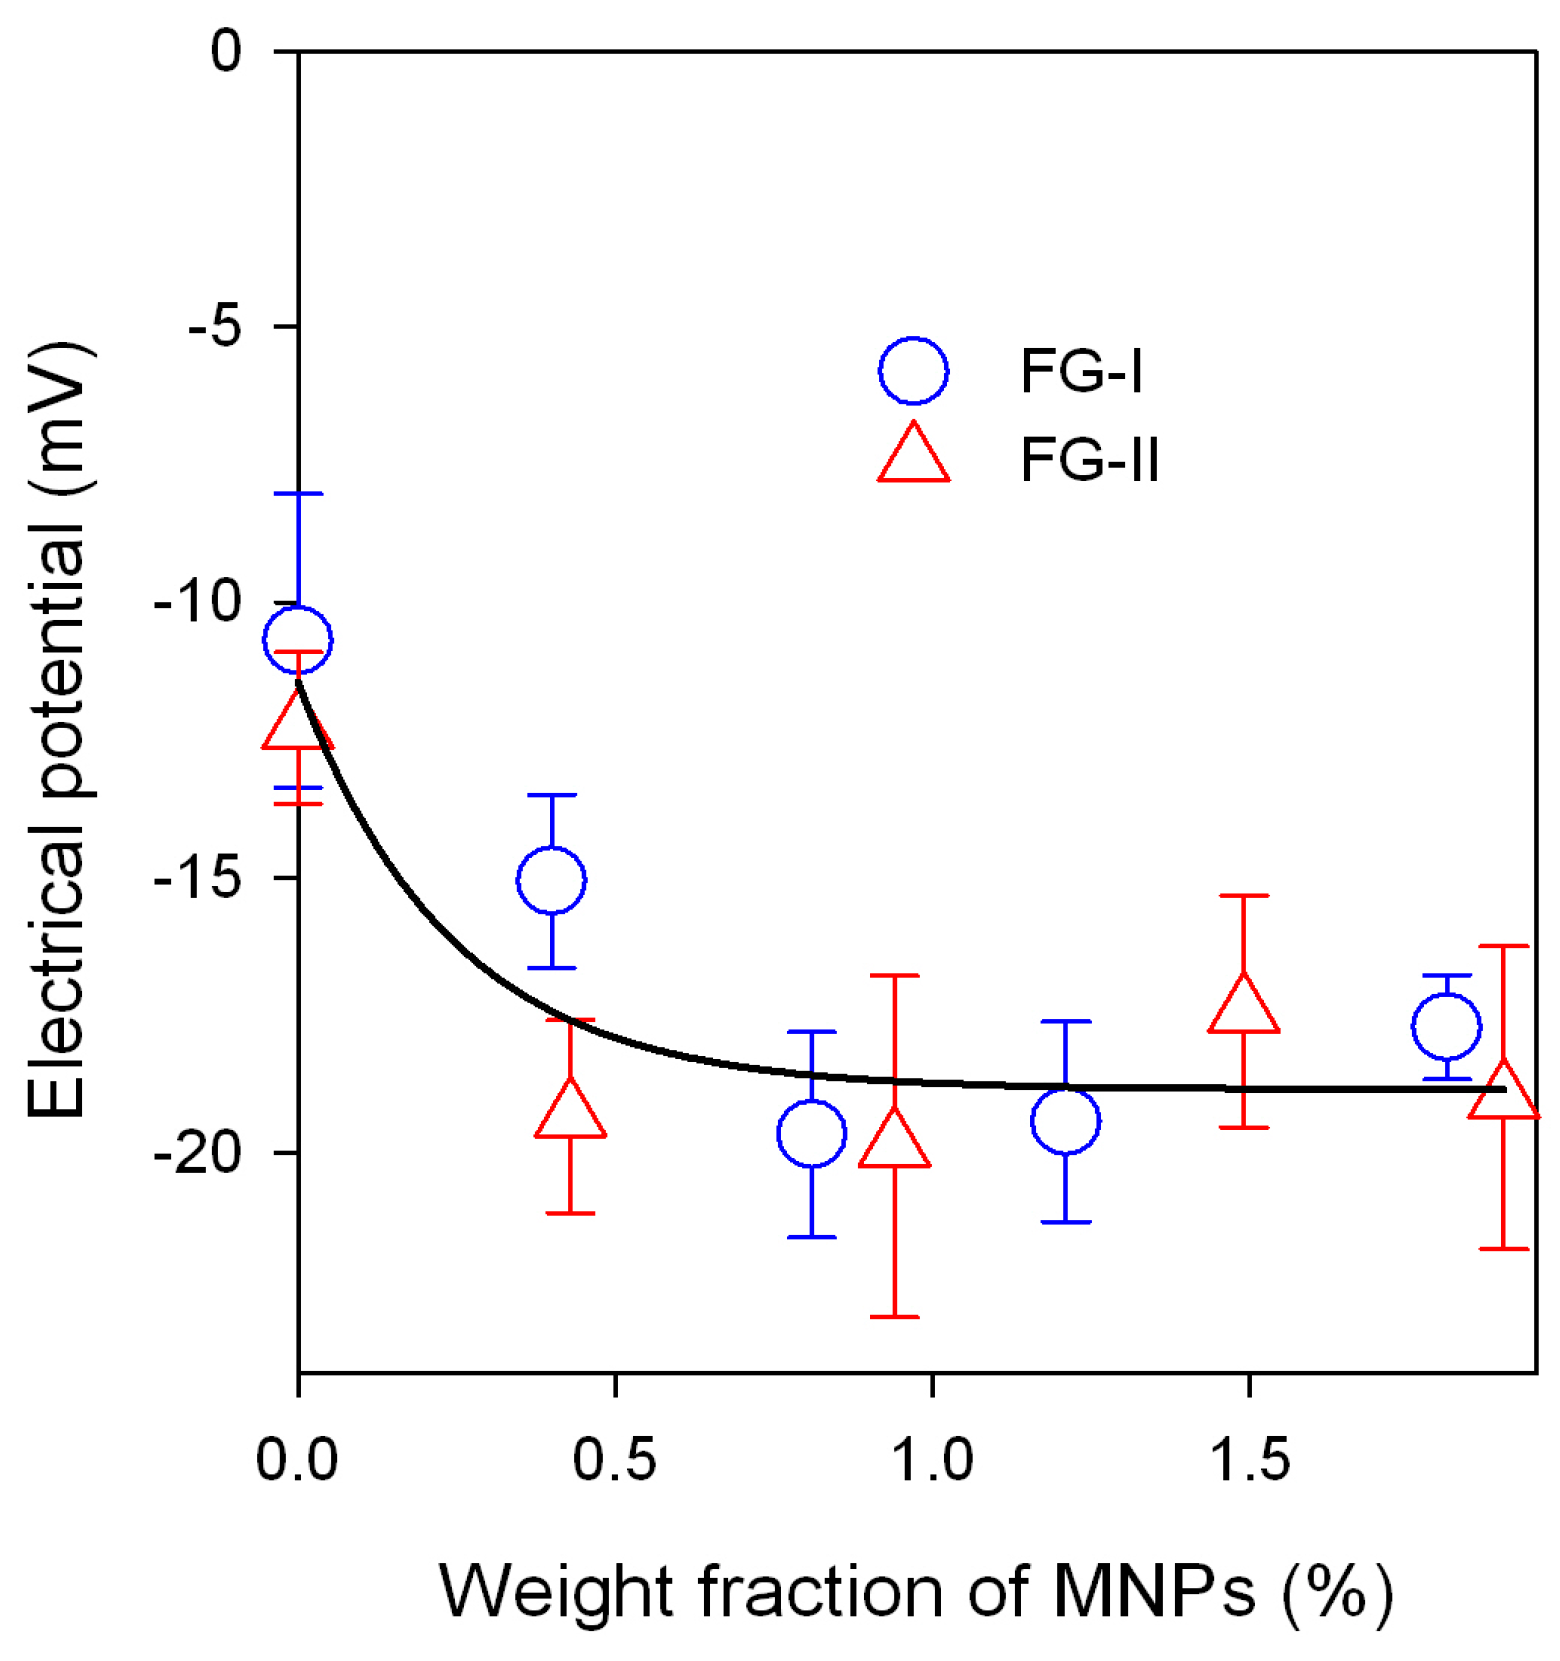
Figure 5 shows the dependence of the electrical potential of ferrogel on the weight fraction of iron oxide MNPs.
The potential in PAAm gel is negative and its value is ca. −10 mV. This value is low when compared to the typical values of the electrical potential for polyelectrolyte hydrogels such as gels of polyacrylic or polymethacrylic acid [
40,
41], which are larger by an order of magnitude. Certainly, it is because PAAm does not contain ionized groups in its polymeric sub-chains. In general, the electrical potential of the gel is Donnan potential [
42], which is the result of the restricted ionic equilibrium on the gel boundary with supernatant. If there are ionic species, which cannot freely cross the gel boundary, it causes non-uniform distribution of free ions and eventually results in the existence of the electrical potential step on the boundary. In the case of polyelectrolyte gels, such unmovable ions are those attached to the polymeric sub-chains.
There is a question as to why PAAm still show a low negative electrical potential even though they are non-ionic. For instance, it might be the result of a very small fraction of carboxylic residue in the PAAm structure due to the hydrolysis of AAm monomeric units.
The embedding of iron oxide MNPs in gel structure results in the increase of the negative values of the potential. Most likely it is due to the net negative electrical charge of MNPs themselves. As it was noted above, the ferrofluid taken for the synthesis of ferrogels was electrostatically stabilized by sodium citrate to prevent aggregation of MNPs. The zeta potential of the ferrofluid was −40 mV. This potential is located at the interface between the dense and the diffuse part of the double electrical layer at the surface of the MNPs. If MNPs are embedded into the PAAm network, they take the double electrical layer with them. As it was shown above, the mesh size of the network is by an order of magnitude smaller than the average diameter of MNPs. Thus, negatively charged MNPs cannot move across the ferrogel boundary and such a restriction gives rise to the native Donnan potential of the ferrogel.
It is noticeable in
Figure 5 that the negative values of the electrical potential substantially increase at low concentration of MNPs and stay almost constant at higher concentration. There is no difference between the FG-I and FG-II series with respect to the electrical potential. It is the same for both series within the experimental error.
3.3. Magnetic Characterization of Nanoparticles and Ferrogels
Figure 6 and
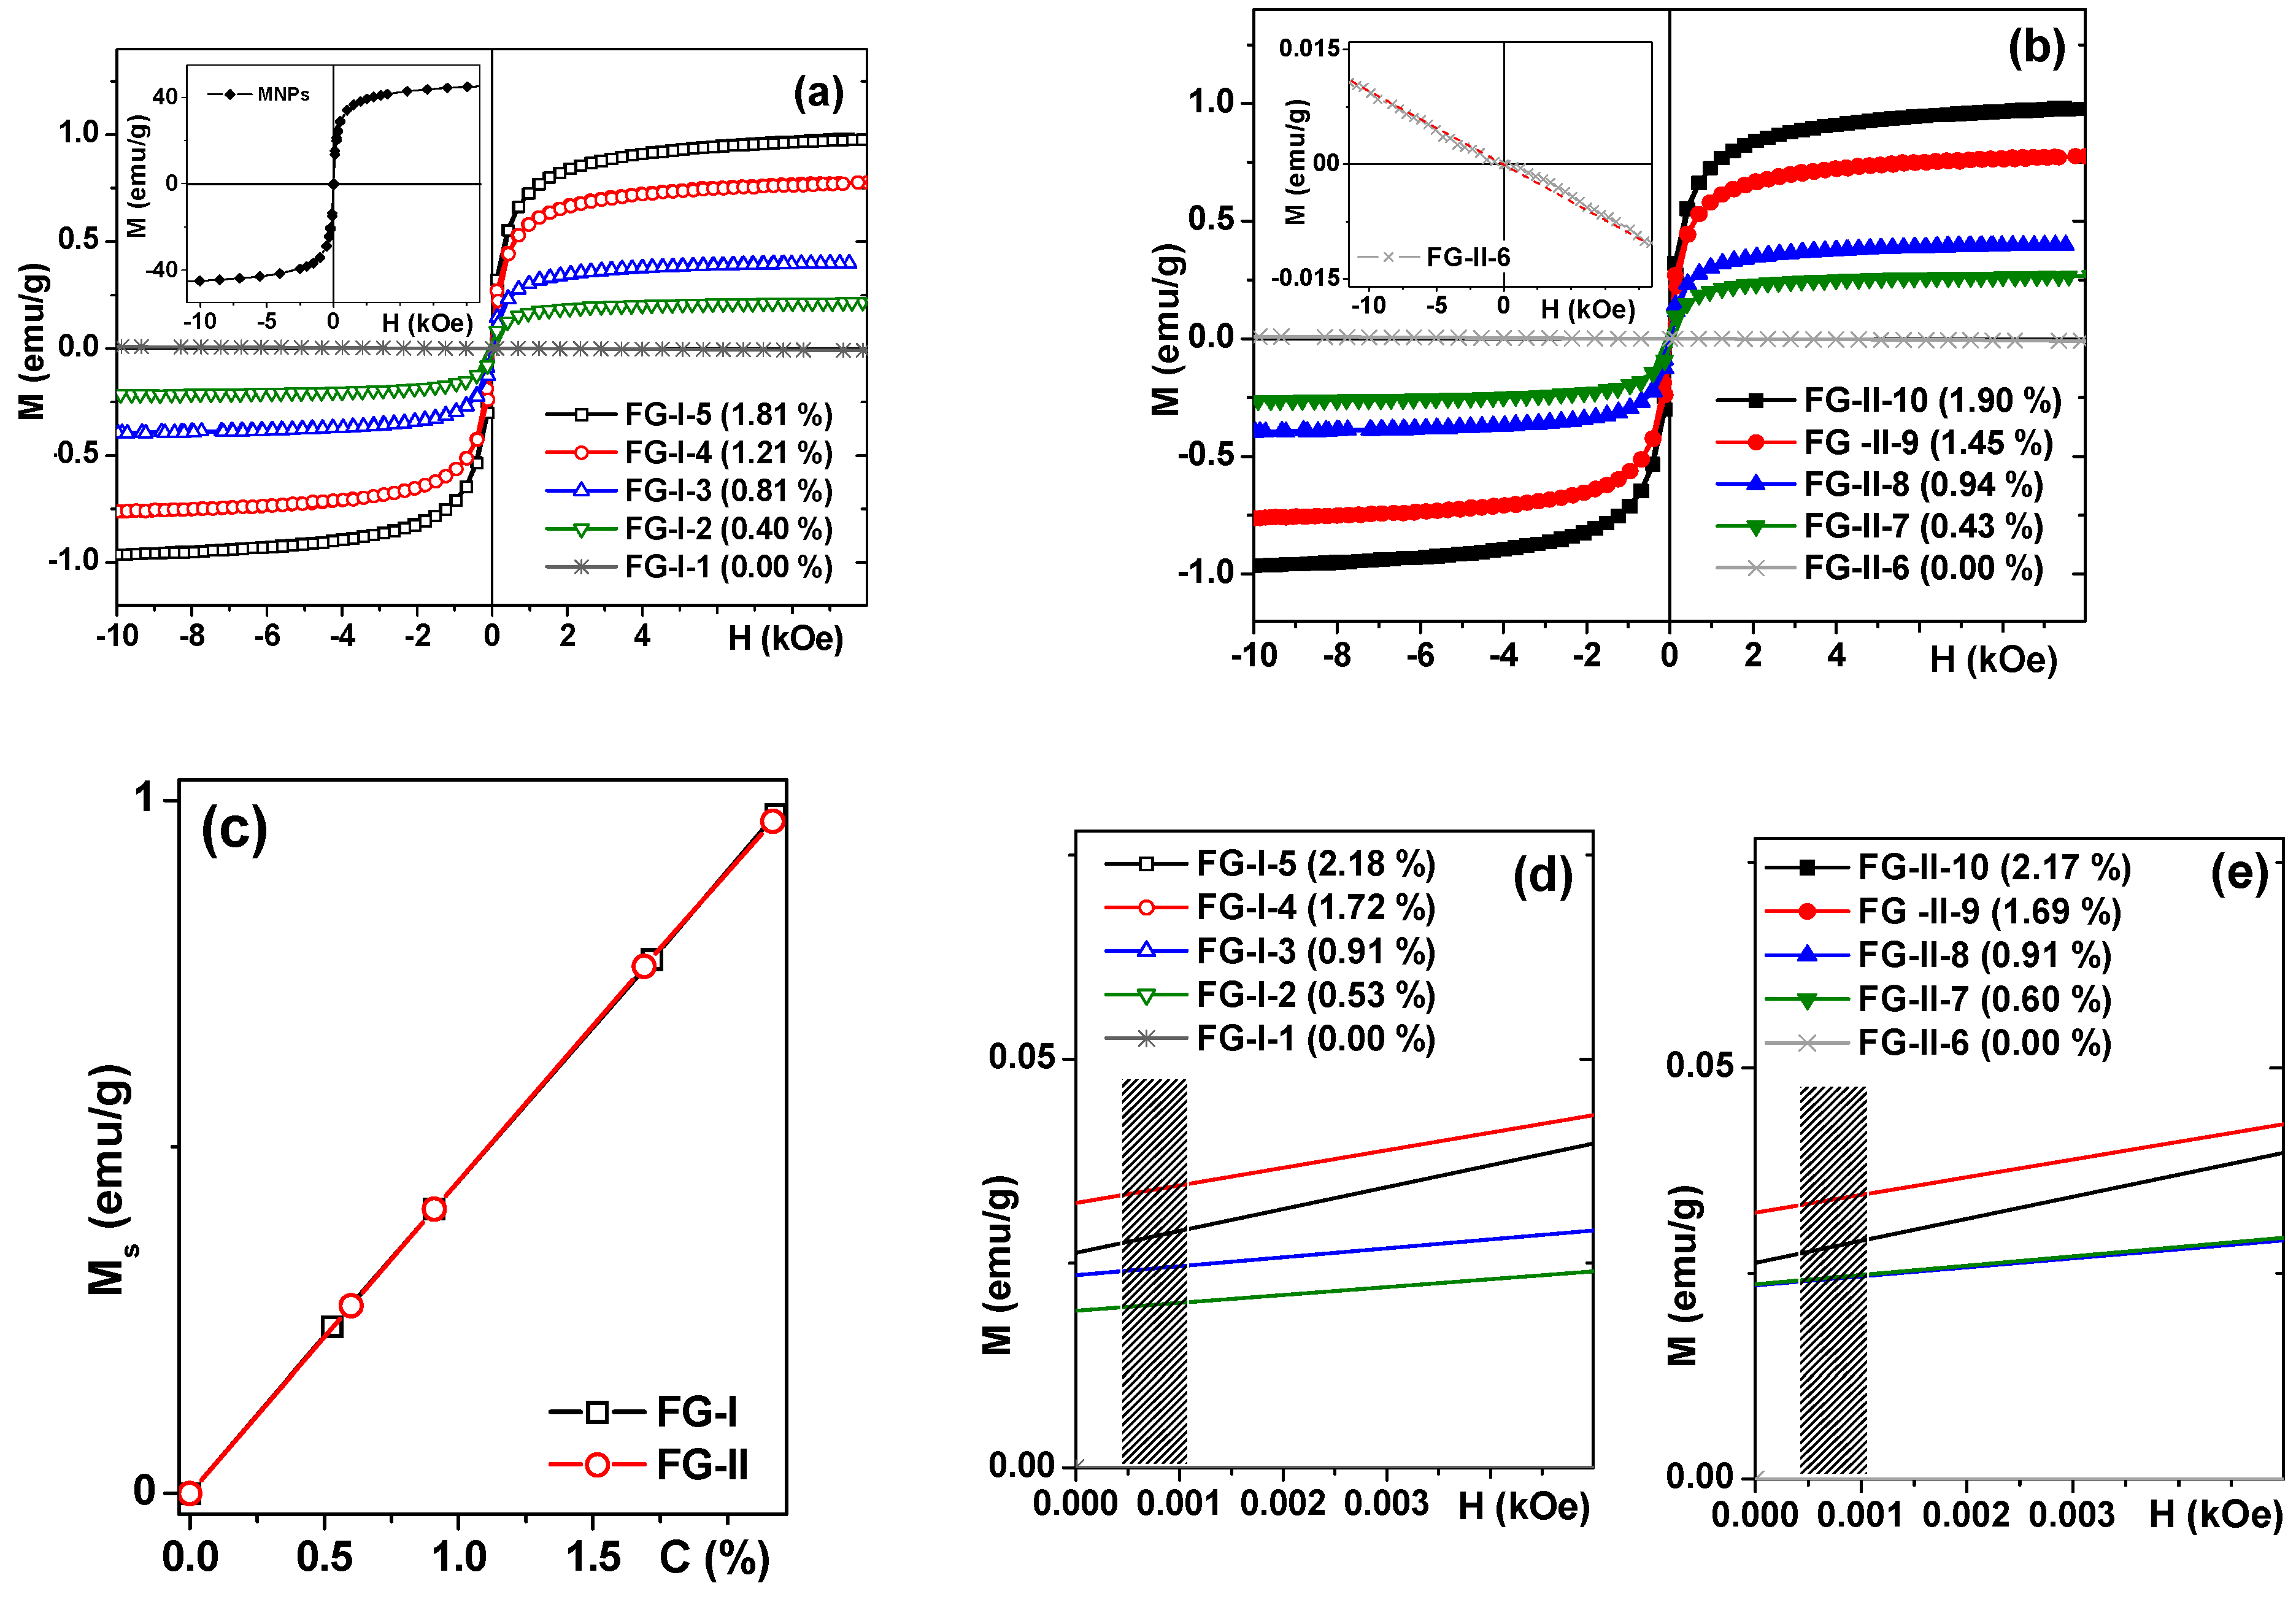
Table 2 summarize the results of the magnetic measurements: M(H) hysteresis loops of soft ferrogels are given in
Figure 6a and of dense ferrogels in
Figure 6b. Although full saturation was not reached in the field of 10 kOe for the samples with high concentration of MNPs, we used the magnetization value for this field as the saturation magnetization M
s just for simplicity. The validity of such approximation was confirmed by the fact that M(H = 10 kOe) ≈ 0.95 × M(H = 70 kOe) [
28]. For practical reasons of magnetic biodetection, magnetic field H = 1 kOe was sufficient. In all cases under consideration, including measurements of the MNPs dried from ferrofluid, very small coercivity of 8 Oe was observed at room temperature.
This can be explained by the presence of very small amounts of large particles due to the existence of particle size distribution (see
Figure 3b). Even so, the behavior is quite close to the one expected for a superparamagnetic ensemble of iron oxide MNPs of this size. It is also important to mention that the contribution of pure gels was diamagnetic and very small in comparison with the magnetic signals of ferrogels. We have subtracted gel contributions when necessary from the ferrogel signals in order to obtain magnetic signals corresponding to the MNPs.
Inset
Figure 6a shows the hysteresis loop of MNPs with saturation magnetization about 45 emu/g, which corresponds quite well to the average size, d
s = 24.4 nm of MNPs [
28,
43]. The measurements of MNPs allow us to check the iron oxide concentration in ferrogels.
Table 2 shows iron oxide concentrations obtained from the experimental data related to synthesis. Although these values are reliable, since the mass fraction of particles changes when manipulating the gel due to the inevitable loss of moisture, it is very difficult to estimate the MNPs concentrations from the synthesis data with high precision. Instead one can take advantage of magnetic measurements. Knowing the magnetization of the ferrogel in H = 10 kOe, we can calculate the concentration of the magnetic filler taking into account the magnetization of MNPs in the same magnetic field. The concentrations of MNPs obtained from M
s data were reasonably close to those calculated from the synthesis data (
Table 2).
Figure 6c shows the concentration dependences of the saturation magnetization for soft and dense gels with different amounts of magnetic filler—a very good linear fit is evident in both cases under consideration.
Figure 6d,e show parts of M(H) hysteresis loops of soft and dense ferrogels approaching remanence: in both cases concentrations of magnetic filler were recalculated for magnetic measurement data. Vertical bars indicate the field interval of 4–11 Oe, which correspond to typical anisotropy fields of thin magnetic films used in sensor applications. Here it becomes very clear that for efficient detection the magnetic moment must be of the order of 0.025 emu/g. For a ferrogel sample with a volume of about 18 mm
3 (9 mm × 2 mm × 1 mm geometry), this means a magnetic moment of 0.0005 emu in the field near the anisotropy field.
3.5. Model for Distribution of Electromagnetic Fields in Multilayered Film with Ferrogel
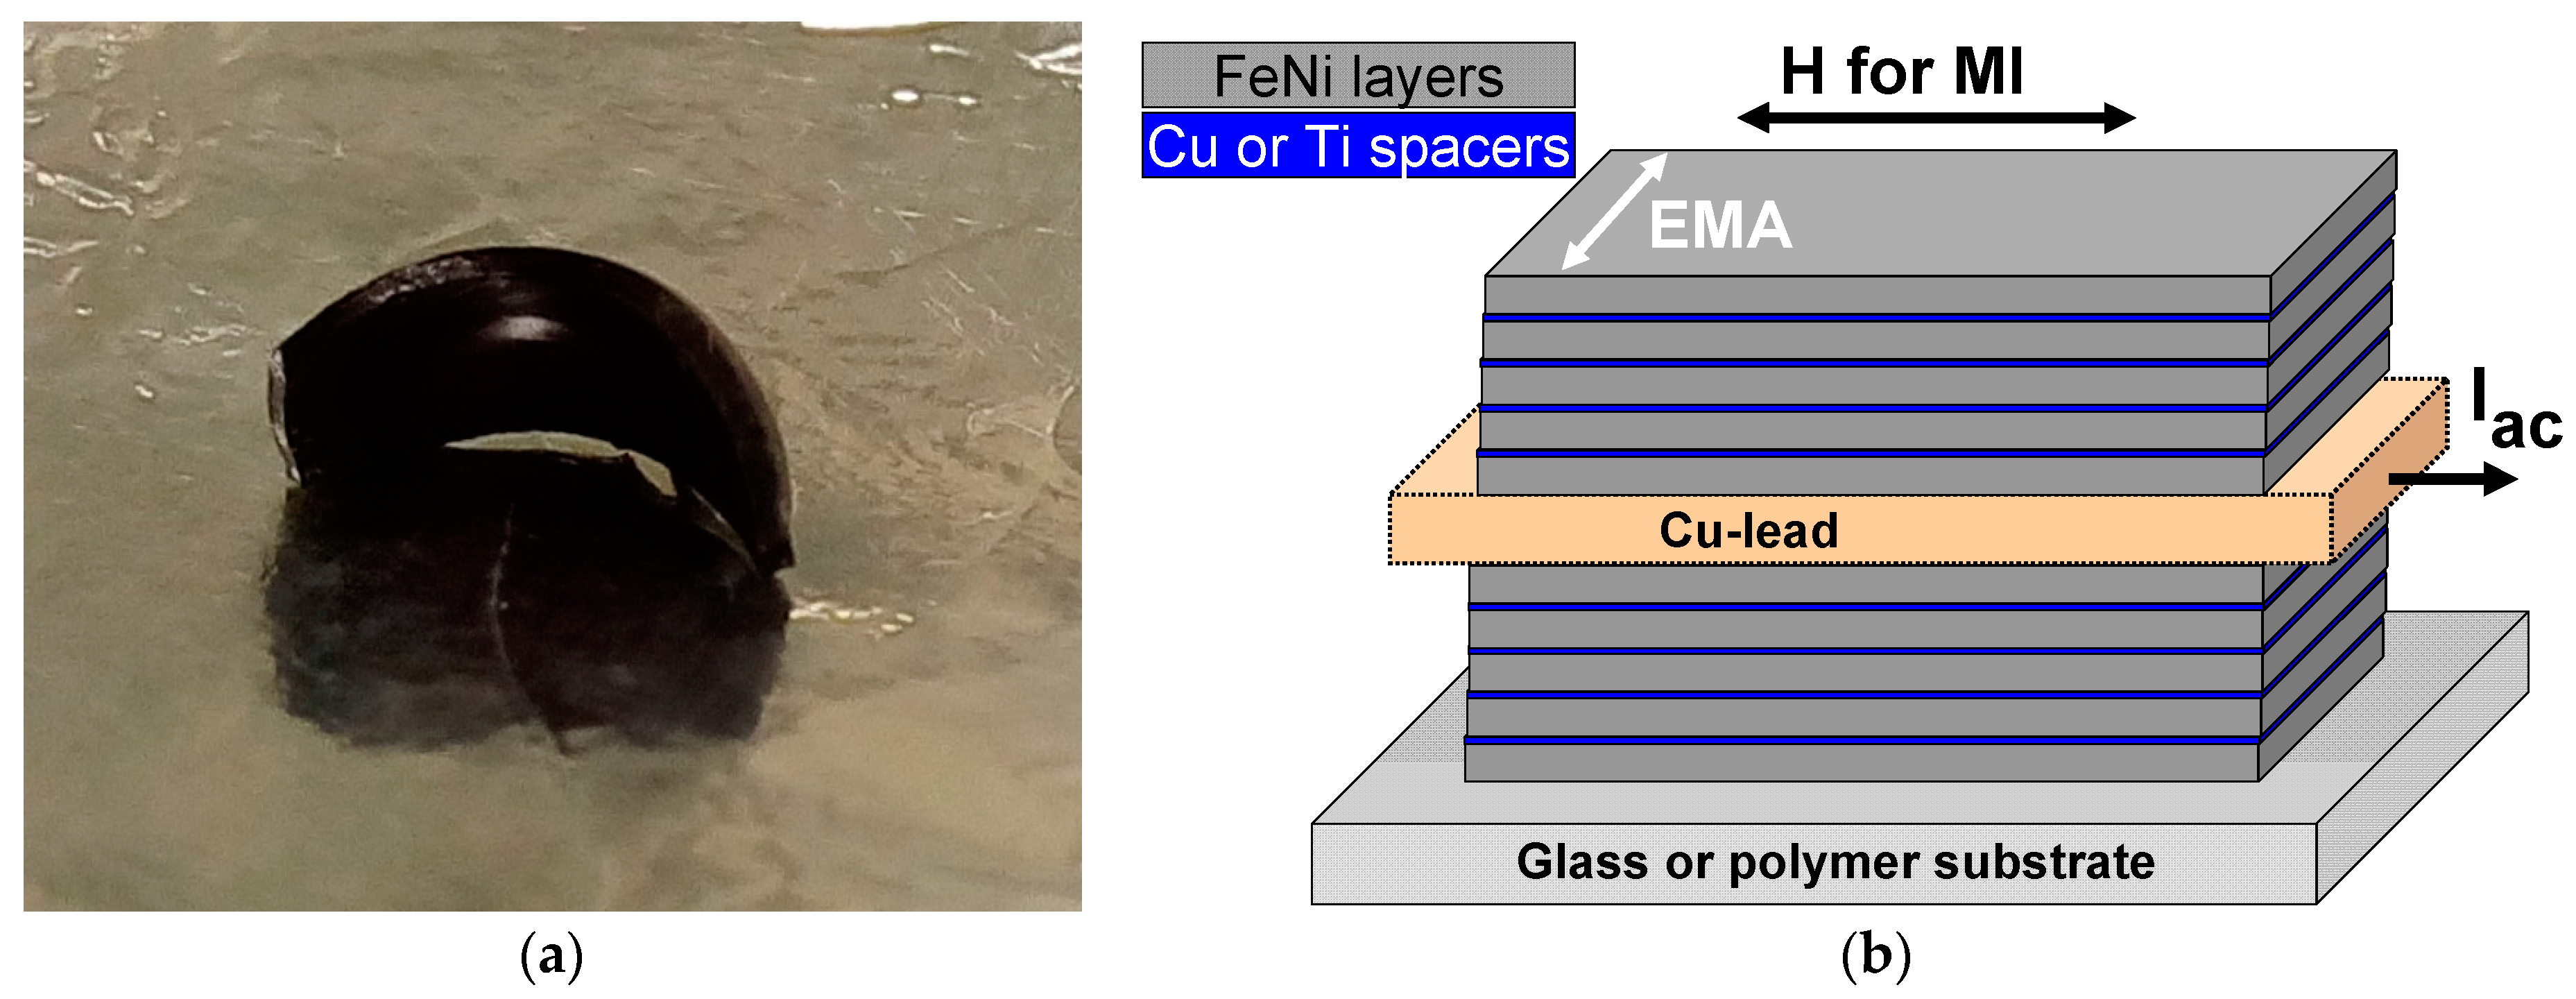
Let us consider a film structure [F/X]n/F/C/[F/X]n/F having the length l and width w < l. The film structure consists of a highly conductive central layer C of thickness 2d0 and two external magnetic multilayers consisting of soft magnetic layers F of thickness d2 and non-magnetic separating layers X of thickness d1. The total thickness 2t of the film structure is given by the following expression: 2t = 2d0 + 2nd1 + 2(n + 1)d2. It is assumed further that the material of the central layer and separating layers is the same, although the model can be extended to the case of different materials C and X. The layer of ferrogel with a thickness of d3 is placed onto the top surface of the film structure.
The driving electric field e = e0exp(−iωt) is applied to the film structure, and the external magnetic field He is parallel to the long side of the film. It is assumed that the film length and width are much higher than its thickness. Neglecting the edge effects, we consider that the electromagnetic fields depend only on the coordinate perpendicular to the film plane (z-coordinate).
In this approximation, the solution of Maxwell equations for the amplitudes of the longitudinal electric field and transverse magnetic field in the central and separating non-magnetic layers can be expressed as,
Here and are the amplitudes of the electric and magnetic field, j = 1,…, 2n + 1 is the non-magnetic layer number, and are the constants, λ1 = (1 − i)/δ1, δ1 = c/(2πωσ1)1/2 and σ1 are the skin depth and conductivity of the non-magnetic layers, respectively, and c is the velocity of light. Note that the expressions for the field amplitudes in the central layer have an asymmetric form with respect to the central plane of the structure, z = 0, due to the presence of ferrogel.
The field amplitudes
and
in the ferromagnetic layers are given by the following expressions:
Here k = 1,…, 2n + 2 is the ferromagnetic layer number, and are the constants, λ2 = (1 − i)/δ2, δ2 = c/(2πωμσ2)1/2, σ2 and μ are the skin depth, conductivity and transverse permeability of the soft magnetic layers, respectively.
The solution of Maxwell equations in the ferrogel can be presented in the form:
Here A3 and B3 are the constants, λ3 = −iωε1/2/c and ε is the permittivity of ferrogel layer.
For the external regions,
z < −
t and
z >
t +
d3, the approximate solution for the fields can be written as [
44,
45,
46],
Here m = 4 and m = 5, correspond to the bottom and top external region, respectively, Cm are the constants and R = (l 2+ w2 + 4z2)1/2. Note that expression (11) was obtained assuming that w << l and allows one to describe the distribution of the electromagnetic fields outside the film structure with ferrogel.
The constants in Equations (9)–(12) can be found from the continuity conditions for the amplitudes of the electric and magnetic fields at the interfaces between the ferromagnetic and non-magnetic layers. Furthermore, boundary conditions at the film structure surface and at the interface between the ferrogel and external region should be added.
Taking into account that the driving electric field is applied to the film structure only, the boundary conditions at the bottom surface of the film,
z = −
t, can be written in the following form:
Similar expressions can be found at the interface between the film and ferrogel,
z =
t,
The boundary conditions at the top surface of the ferrogel layer have the form:
The boundary conditions allow one to find the constants
,
,
,
,
A3,
B3,
C4 and
C5 in Equations (9)–(12) and describe completely the distribution of the electromagnetic fields. When the field distribution is obtained, the impedance
Z of the film with the ferrogel layer can be found as a ratio of the applied potential difference
le0 to the total current
I flowing through the film:
3.6. Effect of Ferrogel Layer on Film Permeability
The MI response of the multilayered film is controlled by the transverse permeability in the ferromagnetic layers. The transverse permeability depends on many factors, such as the domain structure, anisotropy axes distribution, mode of the magnetization variation, and so on. We assume that the value of the permeability in the ferromagnetic layers is governed by the magnetization rotation only. This approximation is valid at sufficiently high frequencies, when the domain-wall motion is damped [
47]. We also suppose that the ferromagnetic layers have in-plane uniaxial anisotropy, and the direction of the anisotropy axes is close to the transverse one.
The influence of ferrogel on the MI can be attributed to stray fields induced by MNPs. The stray fields change the magnetization distribution in the soft magnetic layers of the film structure, and correspondingly, affect the film permeability. In general, the spatial distribution of the stray fields from MNPs can only be found by numerical calculations.
To describe qualitatively the effect of stray fields on the MI response, let us consider the following approximate model. It is assumed that the stray fields generate an effective field Hp in the film structure. We suppose that the effective field is uniform over the film structure thickness. Note that a smooth variation of the effective field over the film thickness can be introduced in the model, with maximal value being at the top surface of the film and minimum value being at the bottom surface. Taking into account such approximate spatial distribution of the effective field results in a more complicated solution, however, it does not significantly influence the dependence of the impedances on the field and frequency.
It is assumed further that the value of
Hp is proportional to the concentration of MNPs in the ferrogel. This approximation seems to be reasonable since the magnetostatic measurements demonstrate that the ferrogel saturation magnetization increases linearly with the concentration of nanoparticles [
2,
27]. Experimental studies have shown that the ferrogels have S-shaped hysteresis loops [
2,
27,
48]. To simplify calculations, we present the hysteresis curve by the linear field dependence of the ferrogel magnetization at low external fields.
Thus, we suppose that the effective stray field
Hp acts on the ferromagnetic layers of the film. The field
Hp has the opposite direction with respect to the effective angle
of the ferrogel magnetization. The dependence of the angle
on the external field can be approximated as follows:
where
Hc is the coercivity and
H1 is the external field corresponding to the approach of the ferrogel saturation magnetization.
The magnetization distribution in the ferromagnetic layers can be found by minimizing the free energy. Taking into account the effective stray field
Hp, the minimization procedure results in the following equation for the equilibrium magnetization angle
θ:
Here Ha is the anisotropy field in the ferromagnetic layers and is the deviation angle of the anisotropy axis from the transverse direction.
The solution of the linearized Landau-Lifshitz equation leads to the following expression for the transverse permeability
μ in the ferromagnetic layers:
where
M is the saturation magnetization of the ferromagnetic layers,
γ is the gyromagnetic constant,
κ is the Gilbert damping parameter, and
Thus, the MI response in the multilayered film with a ferrogel layer can be calculated as follows. The first step is the calculation of the equilibrium magnetization angle in the ferromagnetic layers by means of Equations (17) and (18). The second step is the determination of the transverse permeability in the ferromagnetic layers by using Equations (19) and (20). Then, the corresponding values of the skin depth in the layers can be calculated, and the distribution of the fields is determined by means of Equations (9)–(12), taking into account boundary conditions. When the field distribution is found, the impedance of the film with ferrogel can be obtained by means of Equation (16).
3.7. Model Results
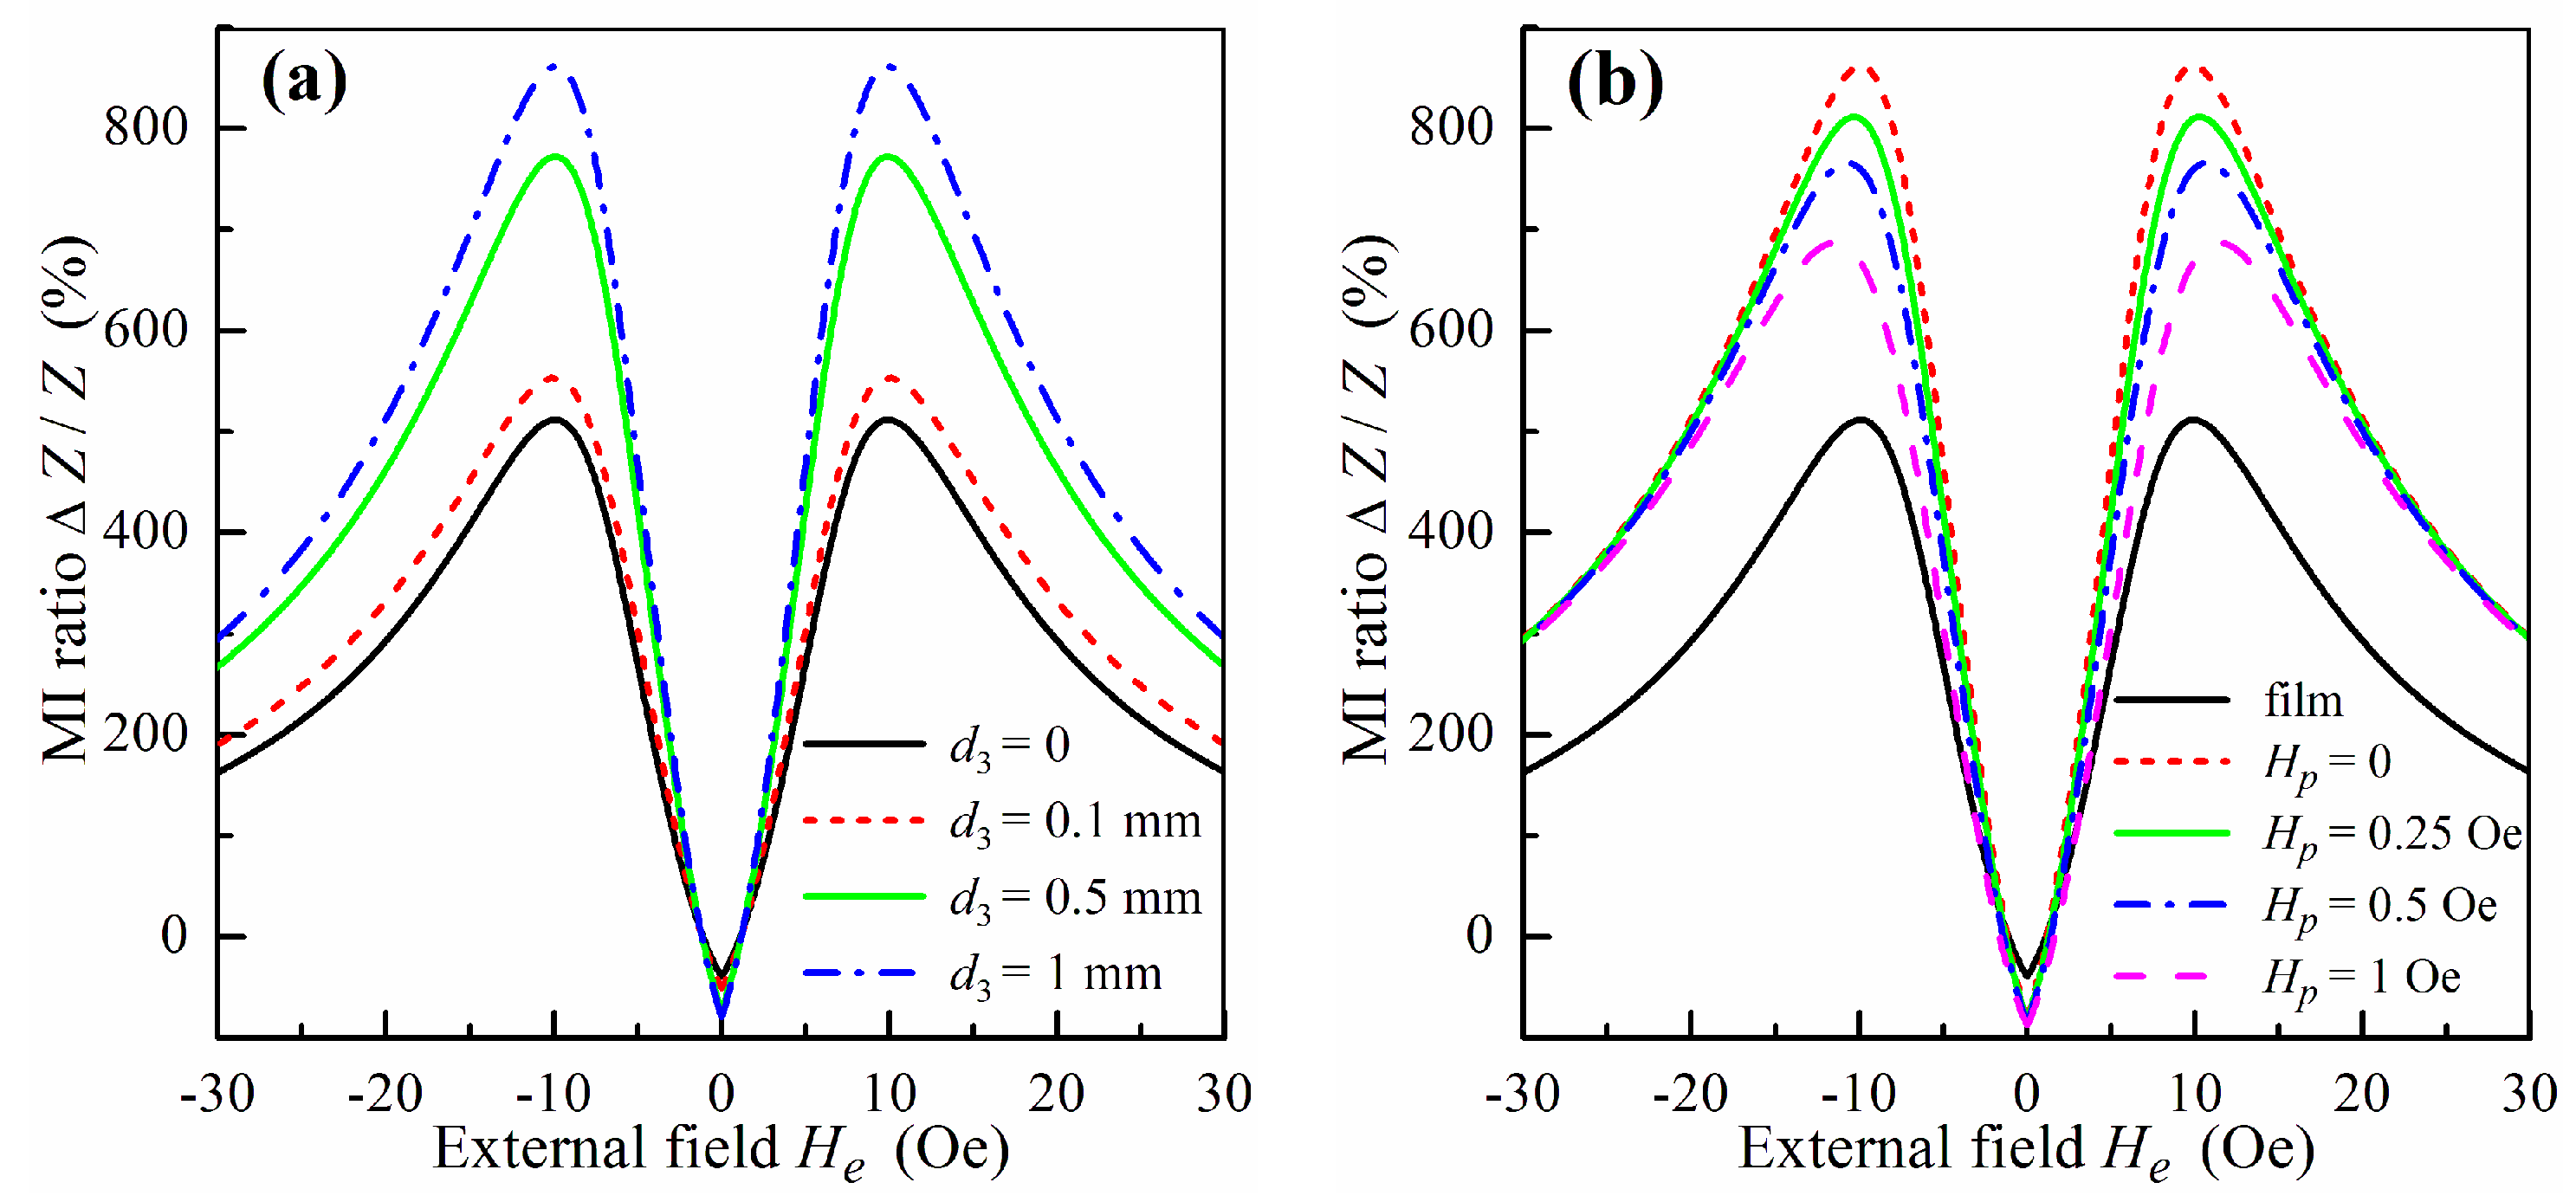
According to the model proposed, the ferrogel layer makes two contributions to the MI response. The first contribution is related to the high permittivity of the ferrogel, and the second one results from the stray fields of MNPs. Let us consider, first, the dielectric contribution of the pure gel without MNPs. In this case, the stray fields from the gel are equal to zero.
Figure 8a shows the calculated dependence of Δ
Z/
Z on the external field
He at the frequency of 100 MHz for different values of the gel layer thickness
d3. The MI field dependence of the film structure without gel exhibits the typical two-peak behavior (curve 1 in
Figure 8a). In the presence of the gel layer, the dependence has the same shape, however, the value of Δ
Z/
Z increases. This fact can be ascribed to the high permittivity of the gel, which influences the MI response of the film structure. It follows from
Figure 8a that the MI ratio increases with the thickness of the gel layer. Note that a similar significant growth of the MI ratio in the presence of pure gel has been observed previously in experimental studies [
2,
48].
To describe the field dependence of the MI ratio for the film with the ferrogel layer we take the following values of coercivity
Hc and field
H1 in Equation (17):
Hc = 4 Oe and
H1 = 750 Oe. These values of the parameters correspond to the hysteresis loops measured in [
2].
Figure 8b shows the field dependence of the MI ratio Δ
Z/
Z for the film without gel, film with pure gel and film with ferrogel at different values of the effective stray field
Hp.
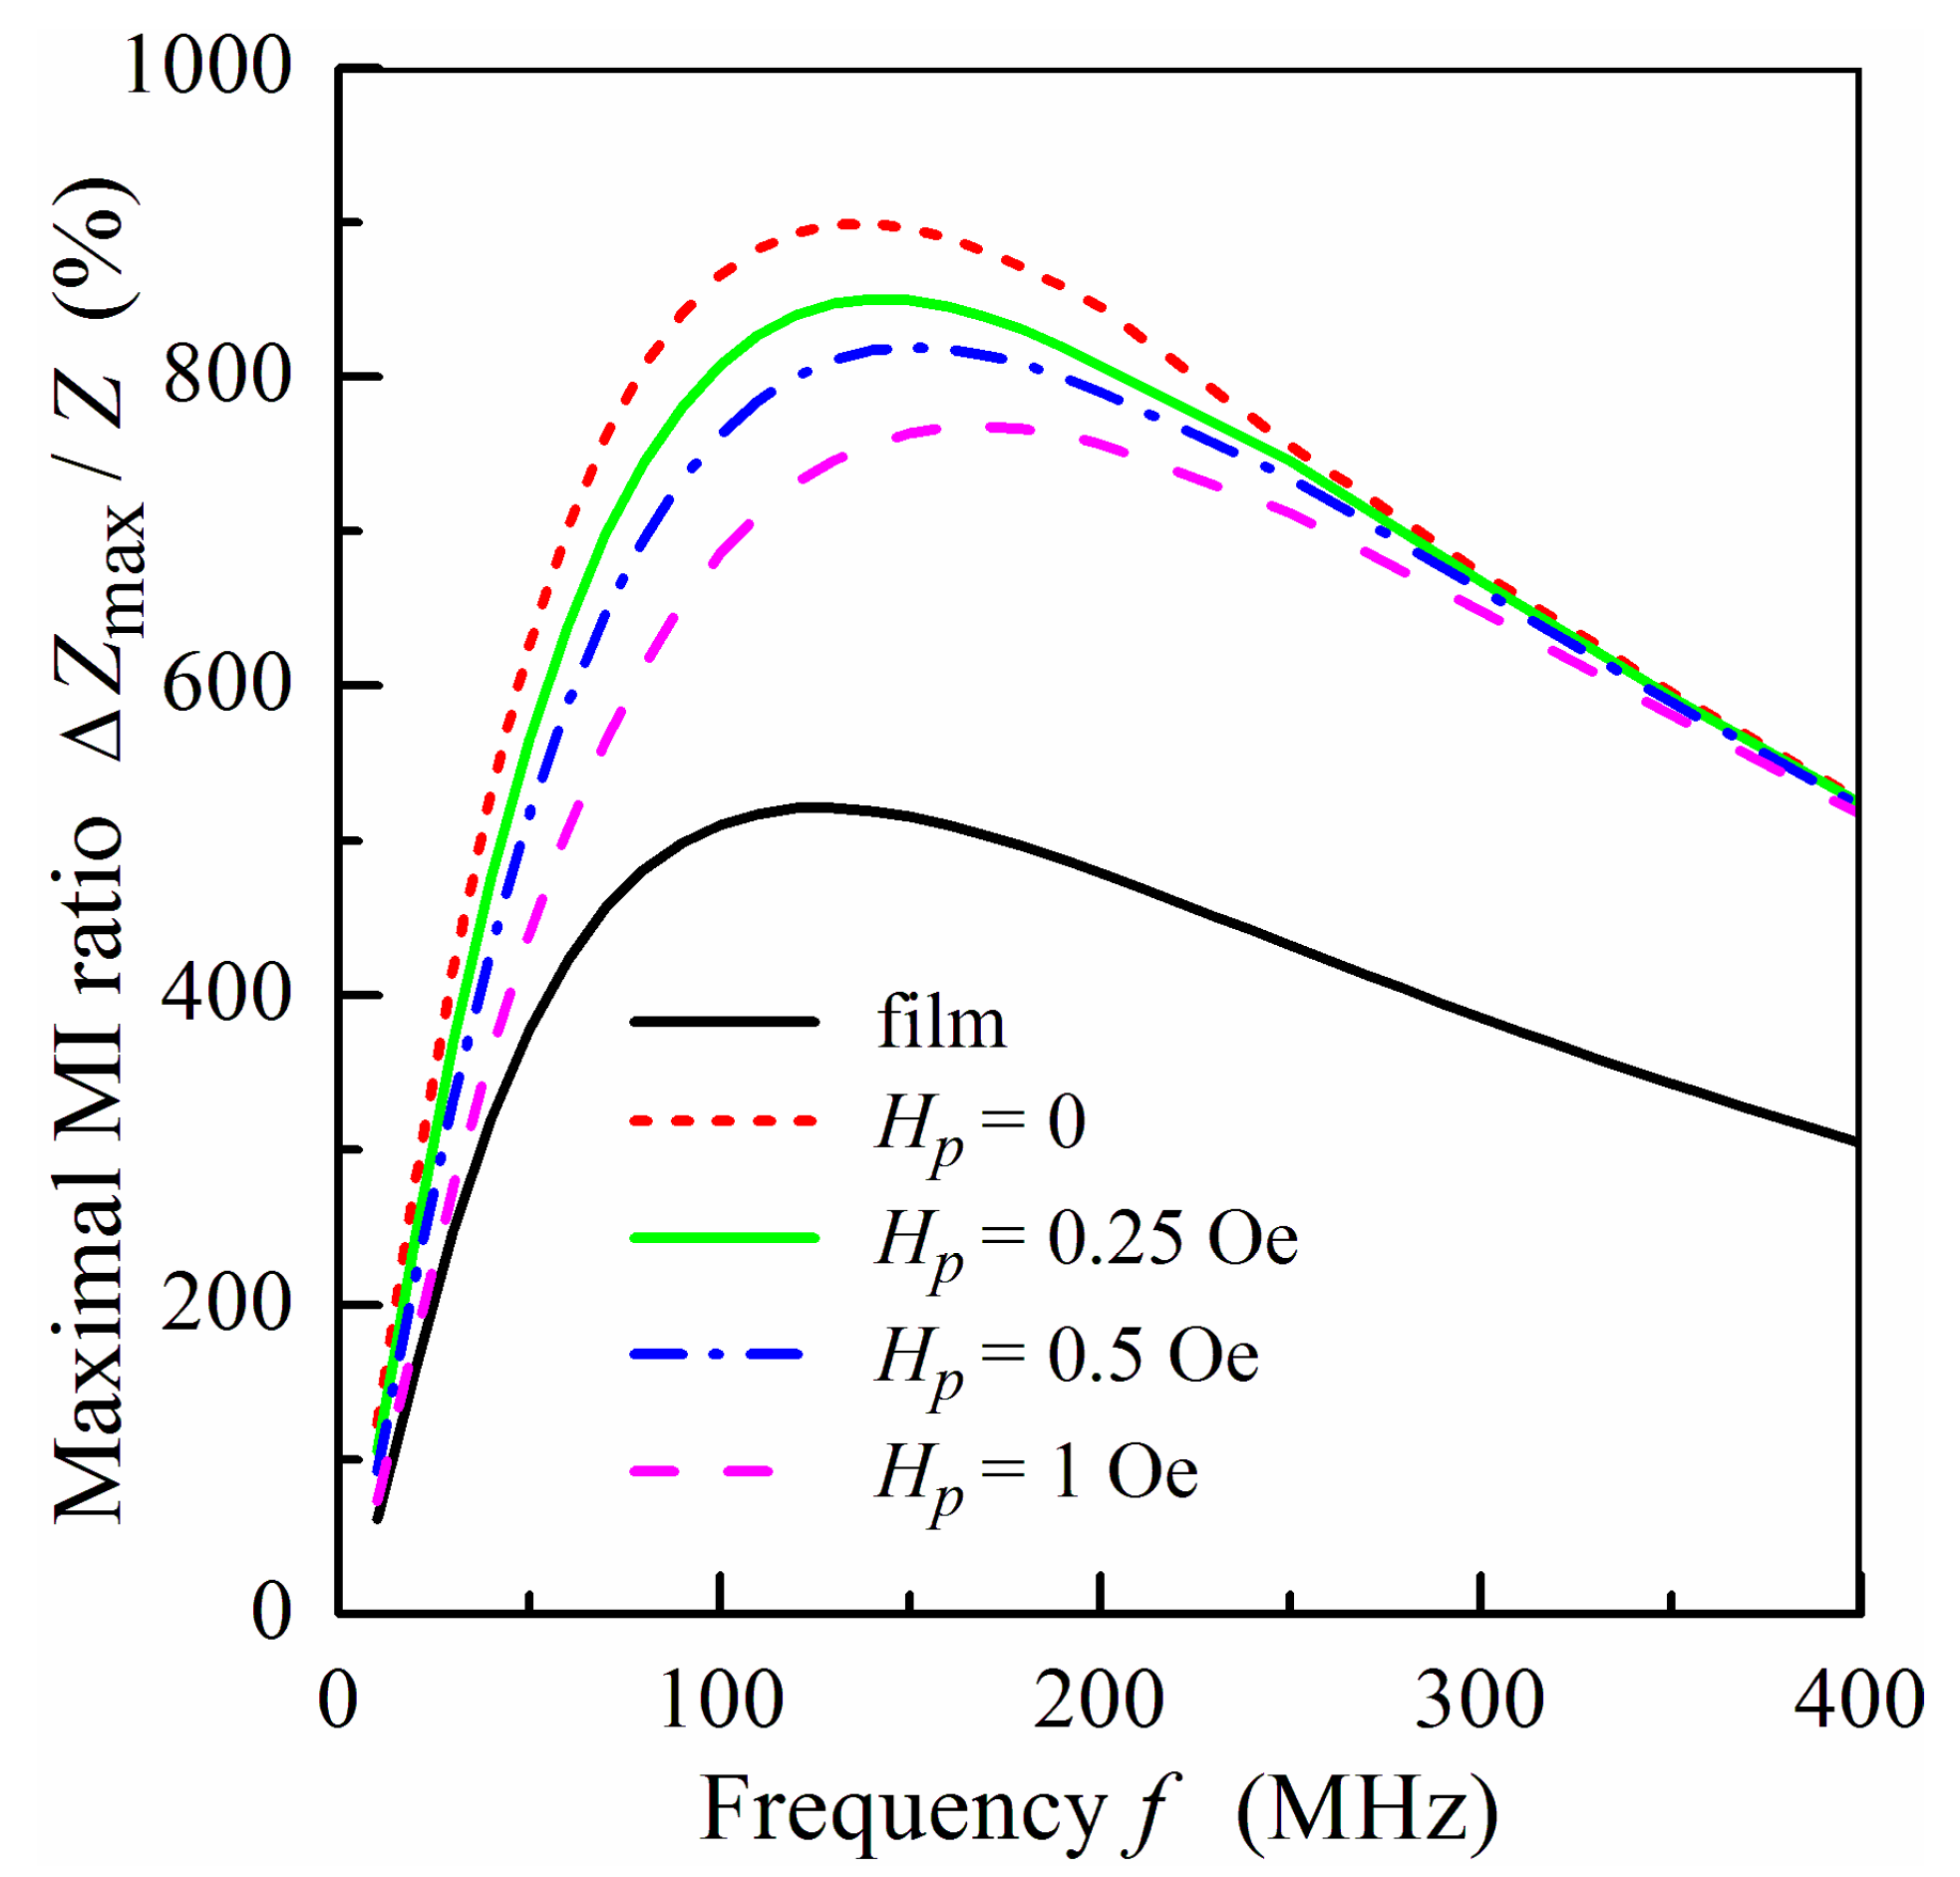
The frequency dependence of the maximum value of MI ratio Δ
Zmax/
Z for the same samples is shown in
Figure 9. An increase in the concentration of MNPs in the ferrogel leads to growth in the saturation magnetization of the ferrogel and to an enhancement of the effective stray field
Hp. As a result, the value of the MI ratio decreases with an increase in the concentration of MNPs in the ferrogel. The calculated dependences presented in
Figure 8b and
Figure 9 are in qualitative agreement with experimental results obtained in [
2,
48].
The model proposed allows one to explain qualitatively the main features of the experimental results concerning the MI response of multilayered films with a ferrogel layer [
2,
48]. It is demonstrated that high permittivity of the pure gel layer affects the MI response of the film structure, resulting in its significant enhancement. It is shown also that the contribution of the stray fields induced by MNPs in the ferrogel layer leads to a decrease in the MI ratio with an increase of the concentration of MNPs in the ferrogel. It should be noted that the model does not describe the essential shift of the maximum in the frequency dependence of Δ
Zmax/
Z to lower frequencies with an increase in the concentration of MNPs in the ferrogel [
2].
Note also, that the simplified presentation of the stray fields created by the MNPs by means of the effective field Hp qualitatively describes the effect of the ferrogel layer on the MI of the multilayered film.
However, this approximation has some restrictions. The first restriction is related to the fact that the effective stray field is assumed to be constant over the multilayered film thickness. The spatial variation of the effective stray field can be included in the model. However, this variation does not significantly affect the MI response. The second restriction is the introduction of the effective angle of the ferrogel magnetization to describe hysteresis loops of ferrogel layer at low external fields (see Equation (17)). A more general approach consists in the approximation of the experimental magnetization curves by analytical functions.
The main disadvantage of the model is as follows. It is evident that the effective stray field Hp should be proportional to the concentration of the MNPs in the ferrogel. However, the coefficient of proportionality cannot be found in the framework of the approach proposed. To estimate the value of this coefficient, an approximate distribution of the stray fields should be found by means of a numerical solution for the magnetostatic equations.
3.8. Magnetoimpedance Measurements in Configuration of Biosensor Prototype
Let us give some examples of MI responses of multilayered sensitive elements without and with ferrogels. In a previous section, comparative analysis of the MI behavior was based on our previous experimental research results and a new model approach was developed for ferrogel detection with a MI sensitive element showing good qualitative agreement with experimental data.
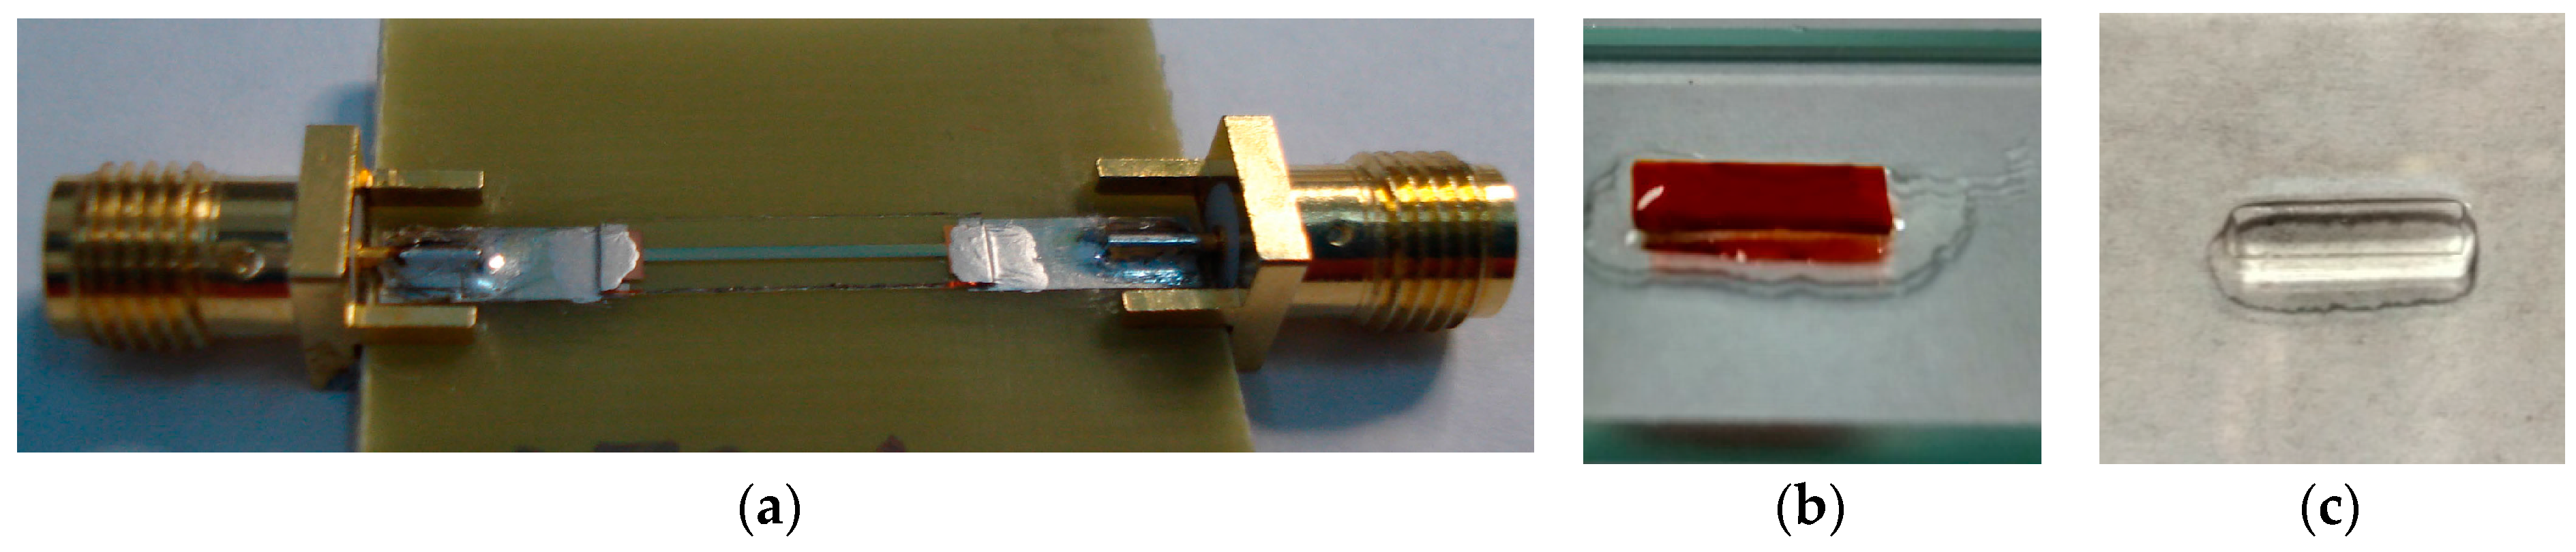
As mentioned before, in our previous works we used FeNi/Ti-based magnetic multilayers deposited onto rigid glass substrates and large gel pieces of 1.0 to 0.5 g weight having cylindrical or half cylinder shapes [
2,
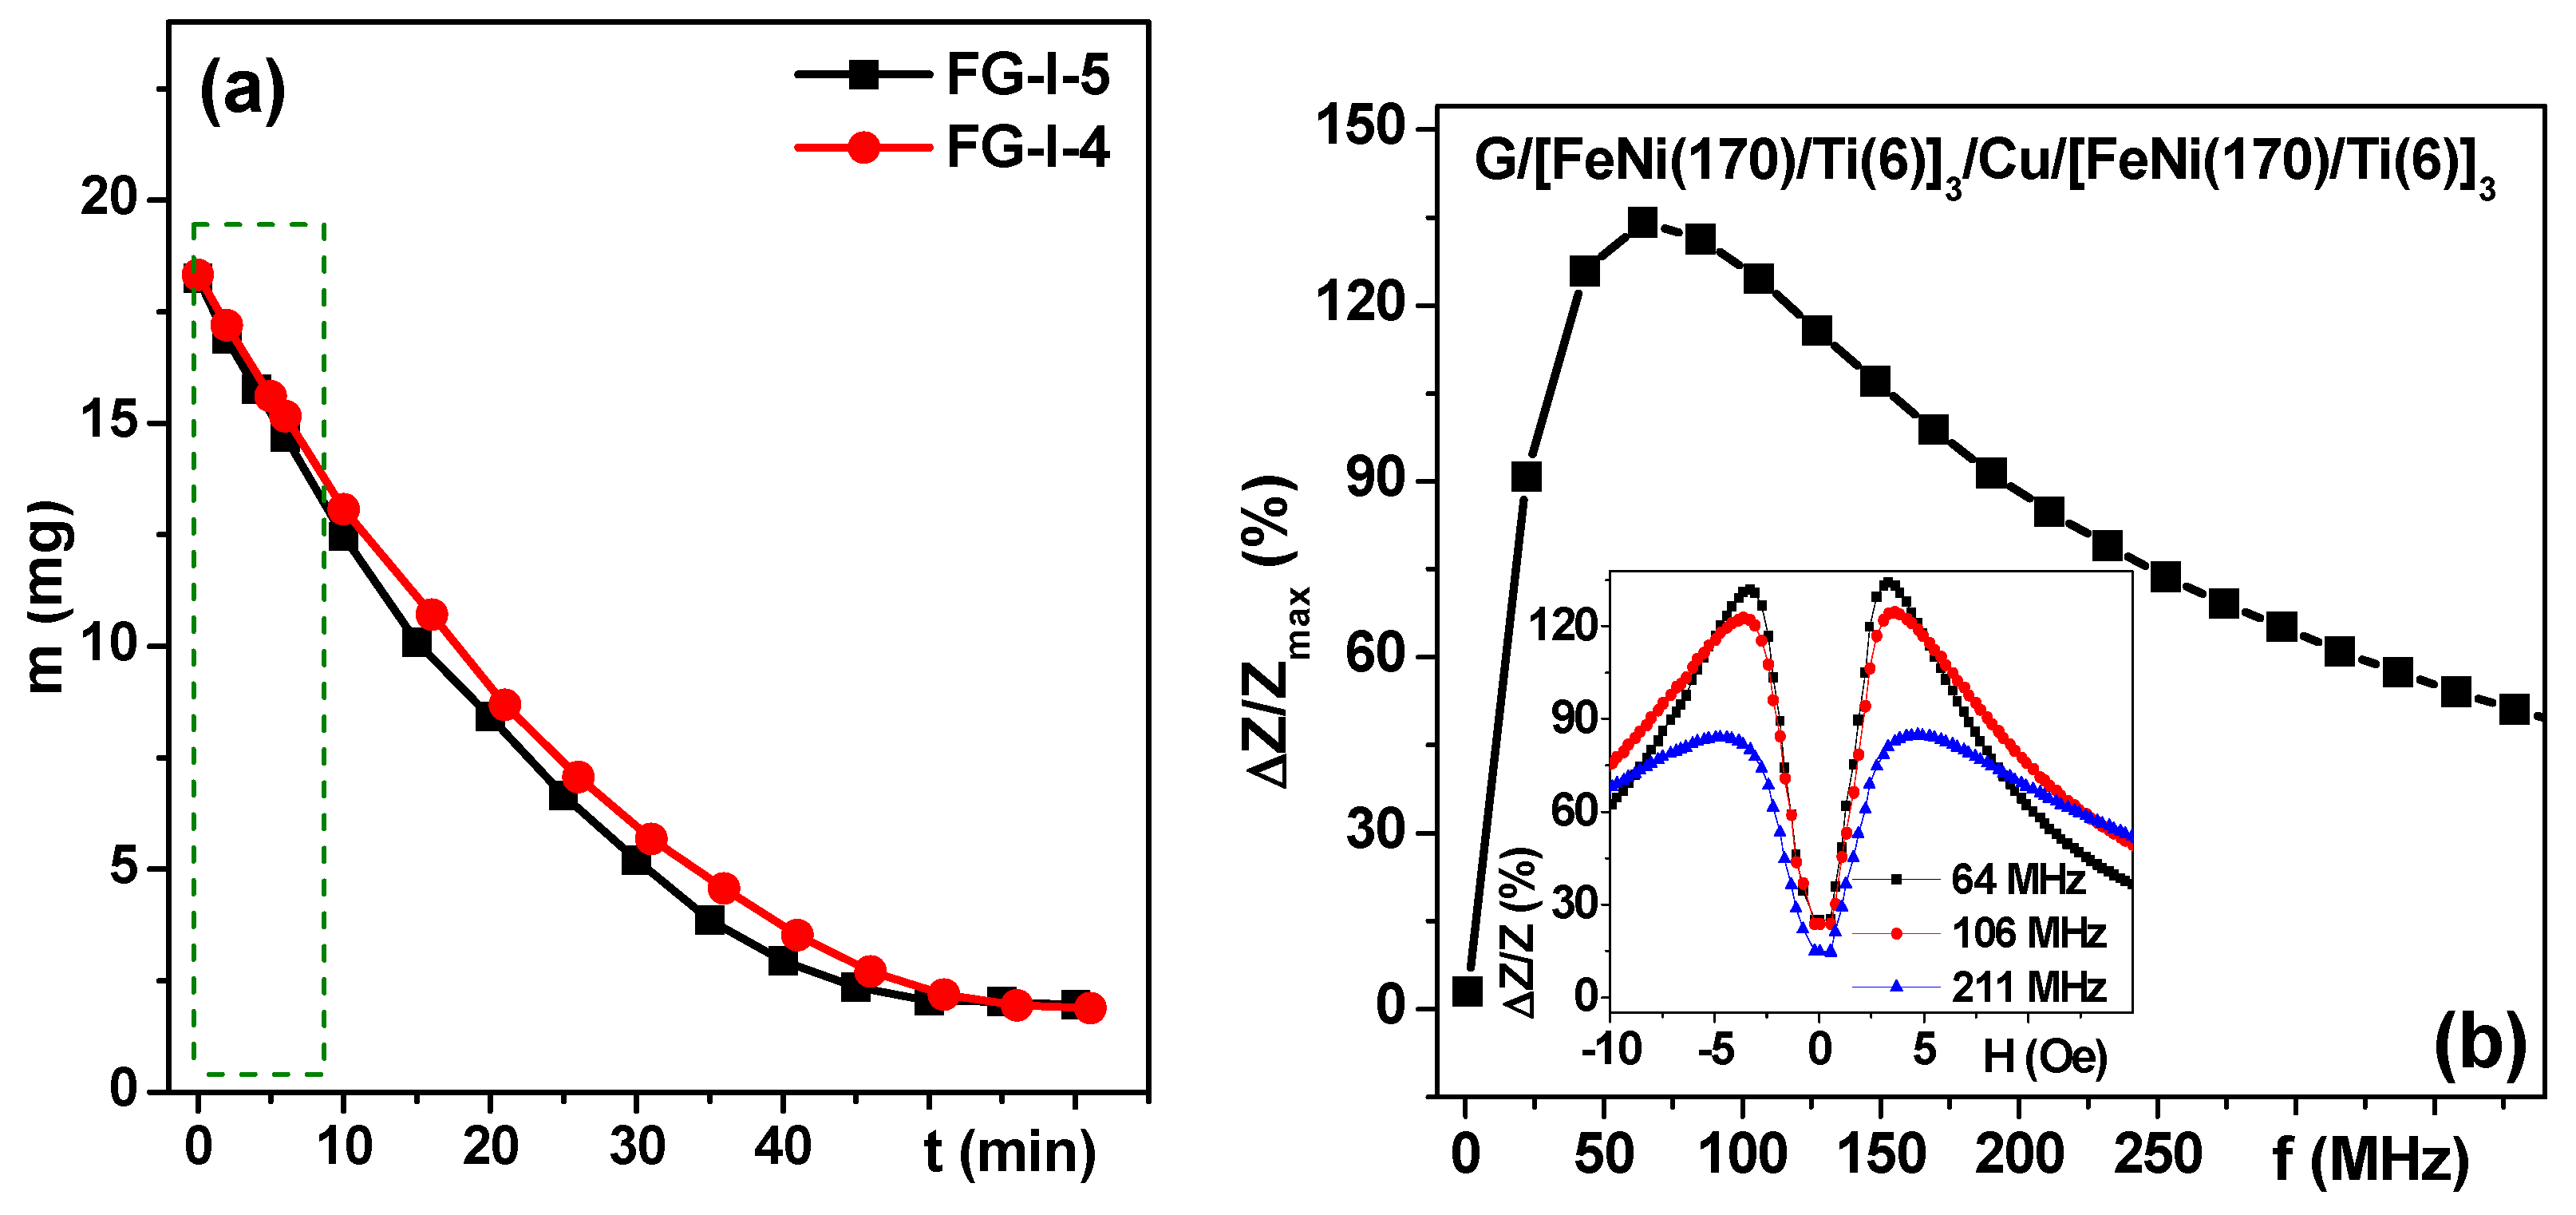
35]. The measurements were strongly conditioned by time as the mass of the gel/ferrogels changed rapidly due to water loss. In the present work, we therefore developed a special protocol for the MI measurements with gels and FG taking into account the mass loss of the piece of gel or FG of the same shape and about 18 mg mass.
Figure 10a shows an example of the mass loss for rectangular stripes of ferrogels used in MI measurements. One can see that the dependence of the mass of the sample on the time t is non-linear for a time scale of about 1 h. In a traditional regime, the complete cycle of MI measurements from magnetic saturation in a positive magnetic field to saturation in a negative magnetic field and again from magnetic saturation in a negative magnetic field to magnetic saturation in a positive magnetic field (“down” and “up” branches, accordingly [
49,
50]) are usually made with an averaging procedure and take about 30–60 min depending on the number of measured frequencies. This means that for small pieces of gel a much faster measuring protocol must be elaborated.
There are two reasons for making an attempt to detect the pieces of ferrogels of a small size. The first, is the biomedical request to detect small tumors below 1 cm in size in order to insure early stage cancer diagnostics. The second, is a purely technical issue—modeling is only possible for thin layers of gel/ferrogel due to limitations in computer capacity. We therefore elaborated a special protocol for MI measurements in order to minimize the experimental errors and to ensure reproducible procedures with minimum measurement. Instead of complete measurements of “down” and “up” branches only the first half of the “down” branch was measured: the total time of the MI measurements in a decreasing field was limited to 3 min and characterized by the linear part for a total mass loss of 10% with respect to the initial mass (see
Figure 10a). We were able to ensure repeatable way of measurements with very thin gels in order to proceed with modeling of the MI responses. The next step in this research process is to design a MI device with controlled humidity inside the measuring cell.
Figure 10b shows an example of a typical frequency dependence of a FeNi/Ti-based MI multilayered sensitive element. The inset shows the field dependence of the Δ
Z/
Z ratio for selected characteristic frequencies (near the maximum of Δ
Z/
Z ratio, and slightly and significantly above it). The two peak MI responses are very consistent with uniaxial magnetic anisotropy features evaluated from the shape of the hysteresis loops (
Figure 7). Both frequency and field dependence of the observed types are widely described in the literature and understood in the framework of classic electrodynamics [
18,
20,
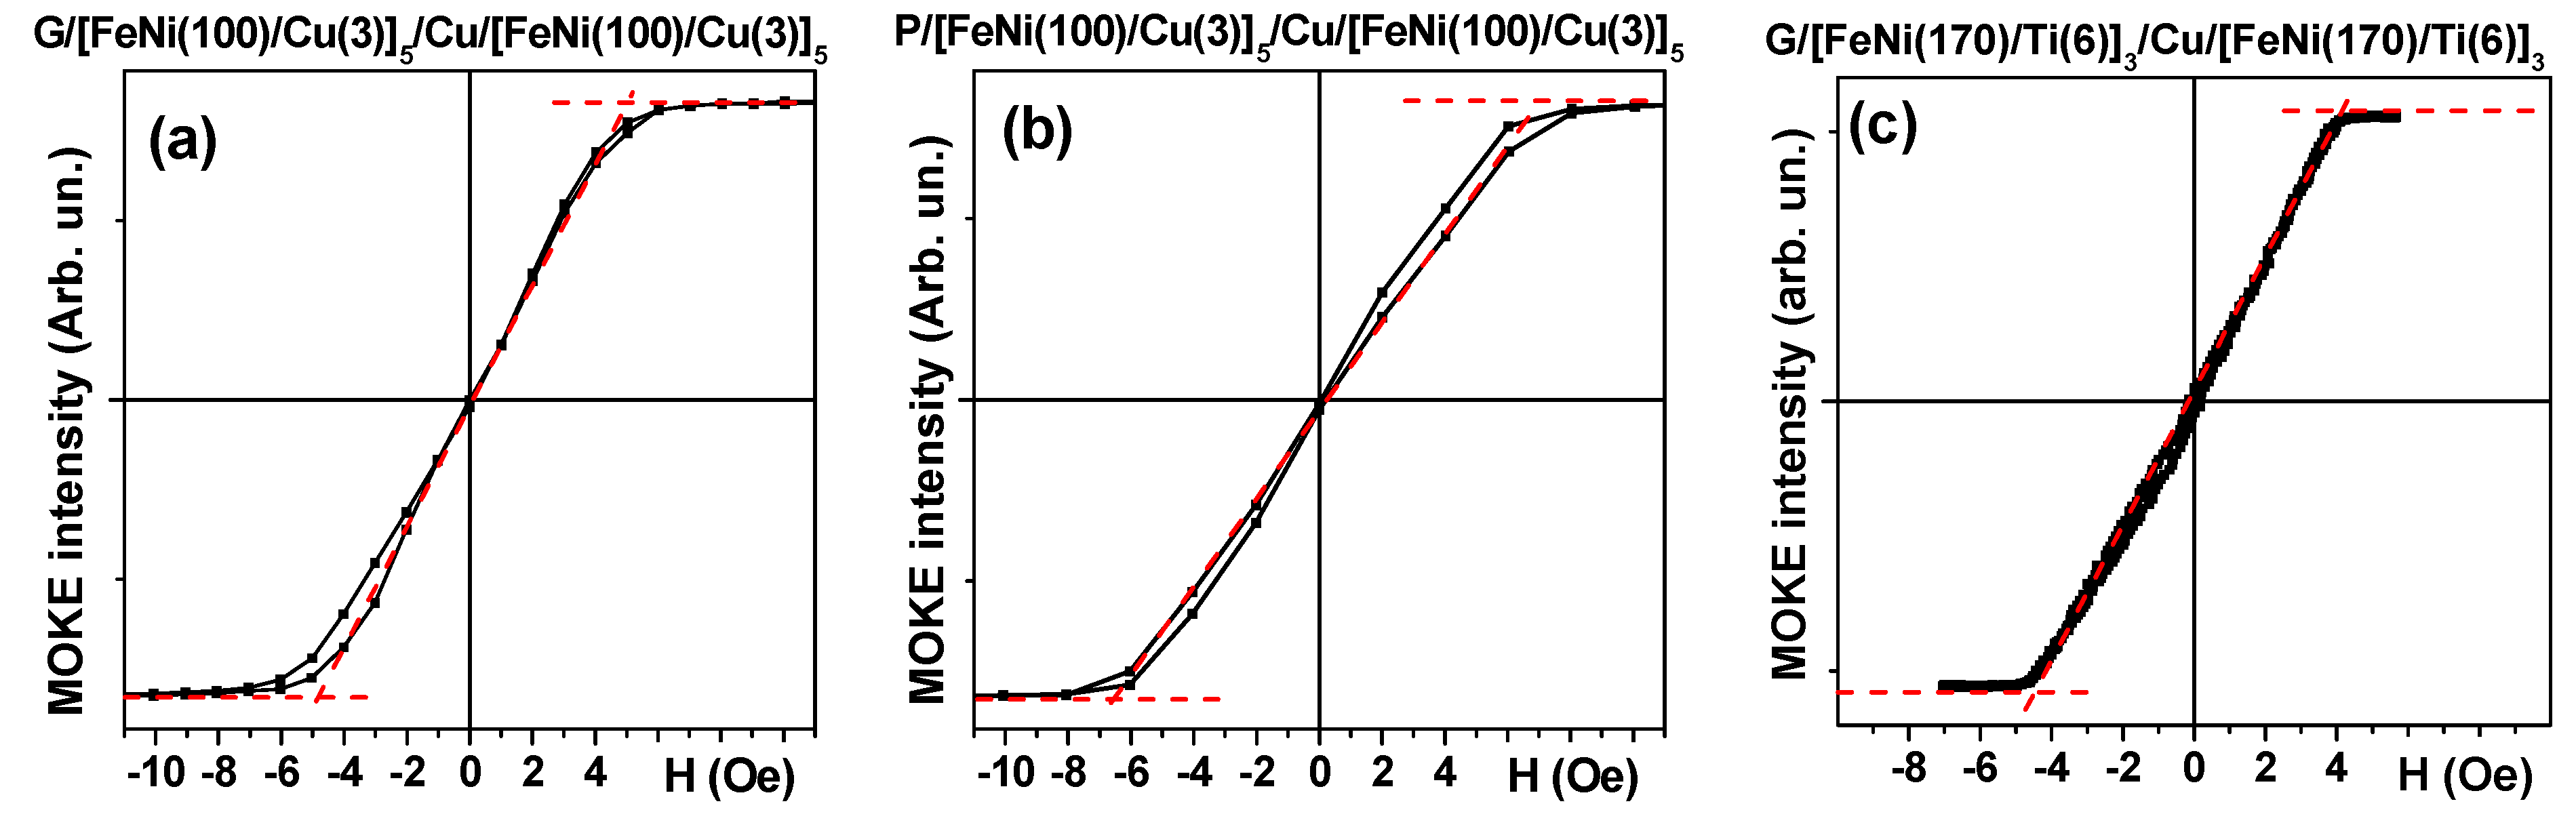
51]. For the next step, the MI FeNi/Ti-based multilayered sensitive element was measured in the same conditions without, and with gel/ferrogel with maximum available concentration of MNPs (
Figure 11a,b).
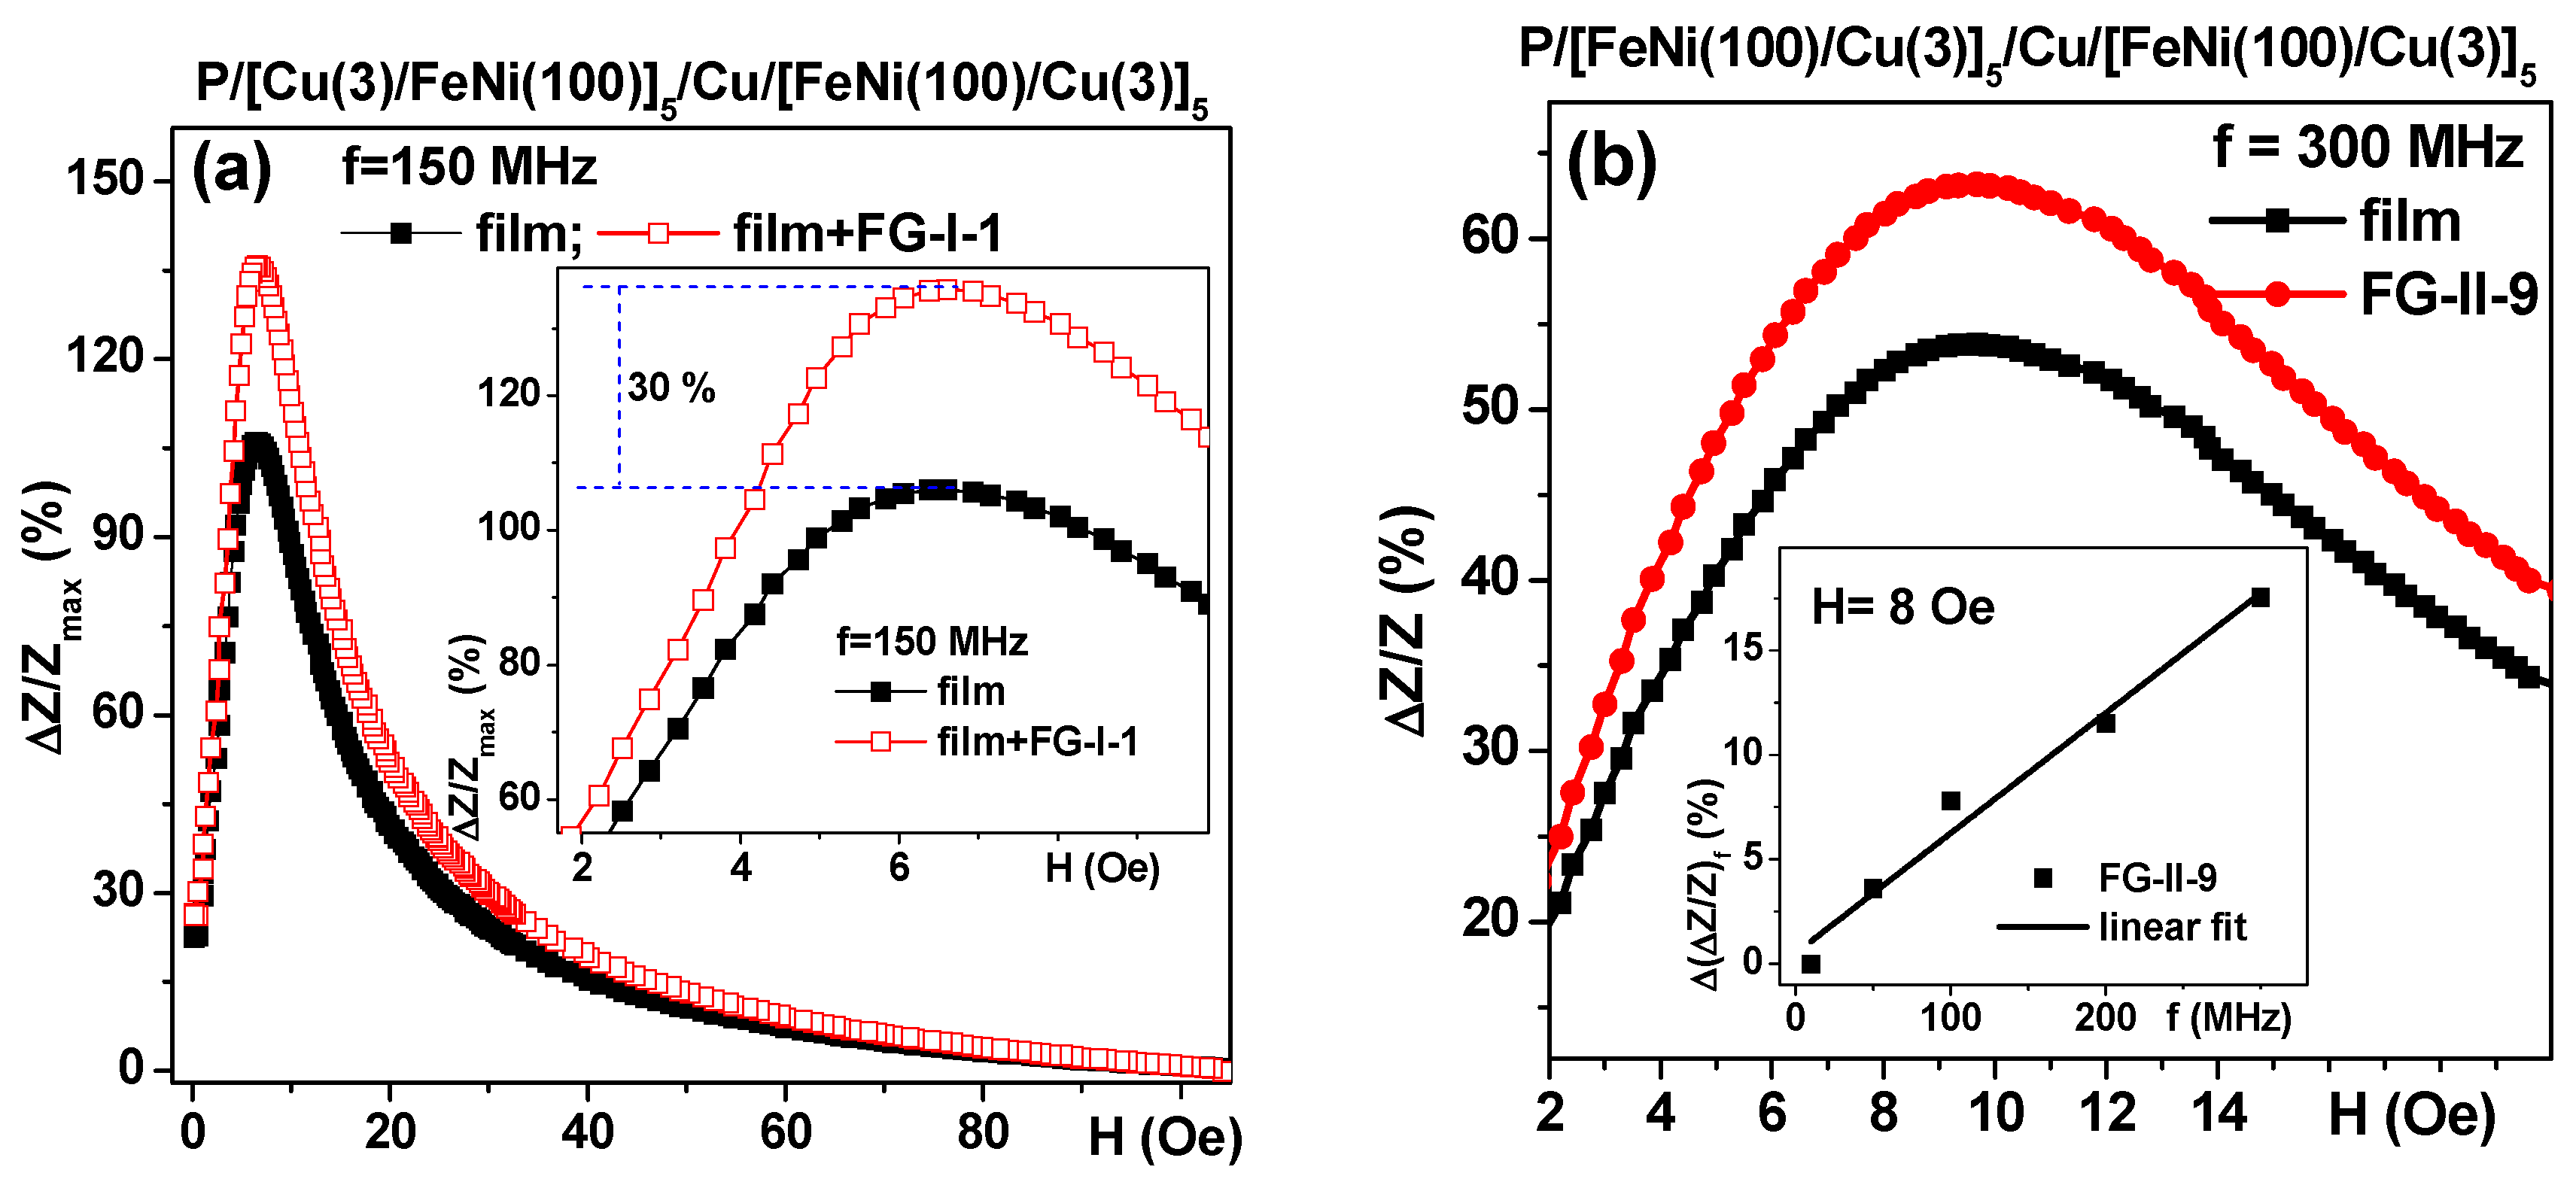
As before [
2,
35,
49] the presence of the gel resulted in a sizable increase in the Δ
Z/
Z ratio near the anisotropy field of the MI element but the presence of a ferrogel of the same mass resulted in the displacement of the Δ
Z/
Z curve in the intermediate position between the position for the MI element itself and the MI element covered by pure gel. This is exactly what was predicted by the proposed electrodynamic model (compare
Figure 8b and
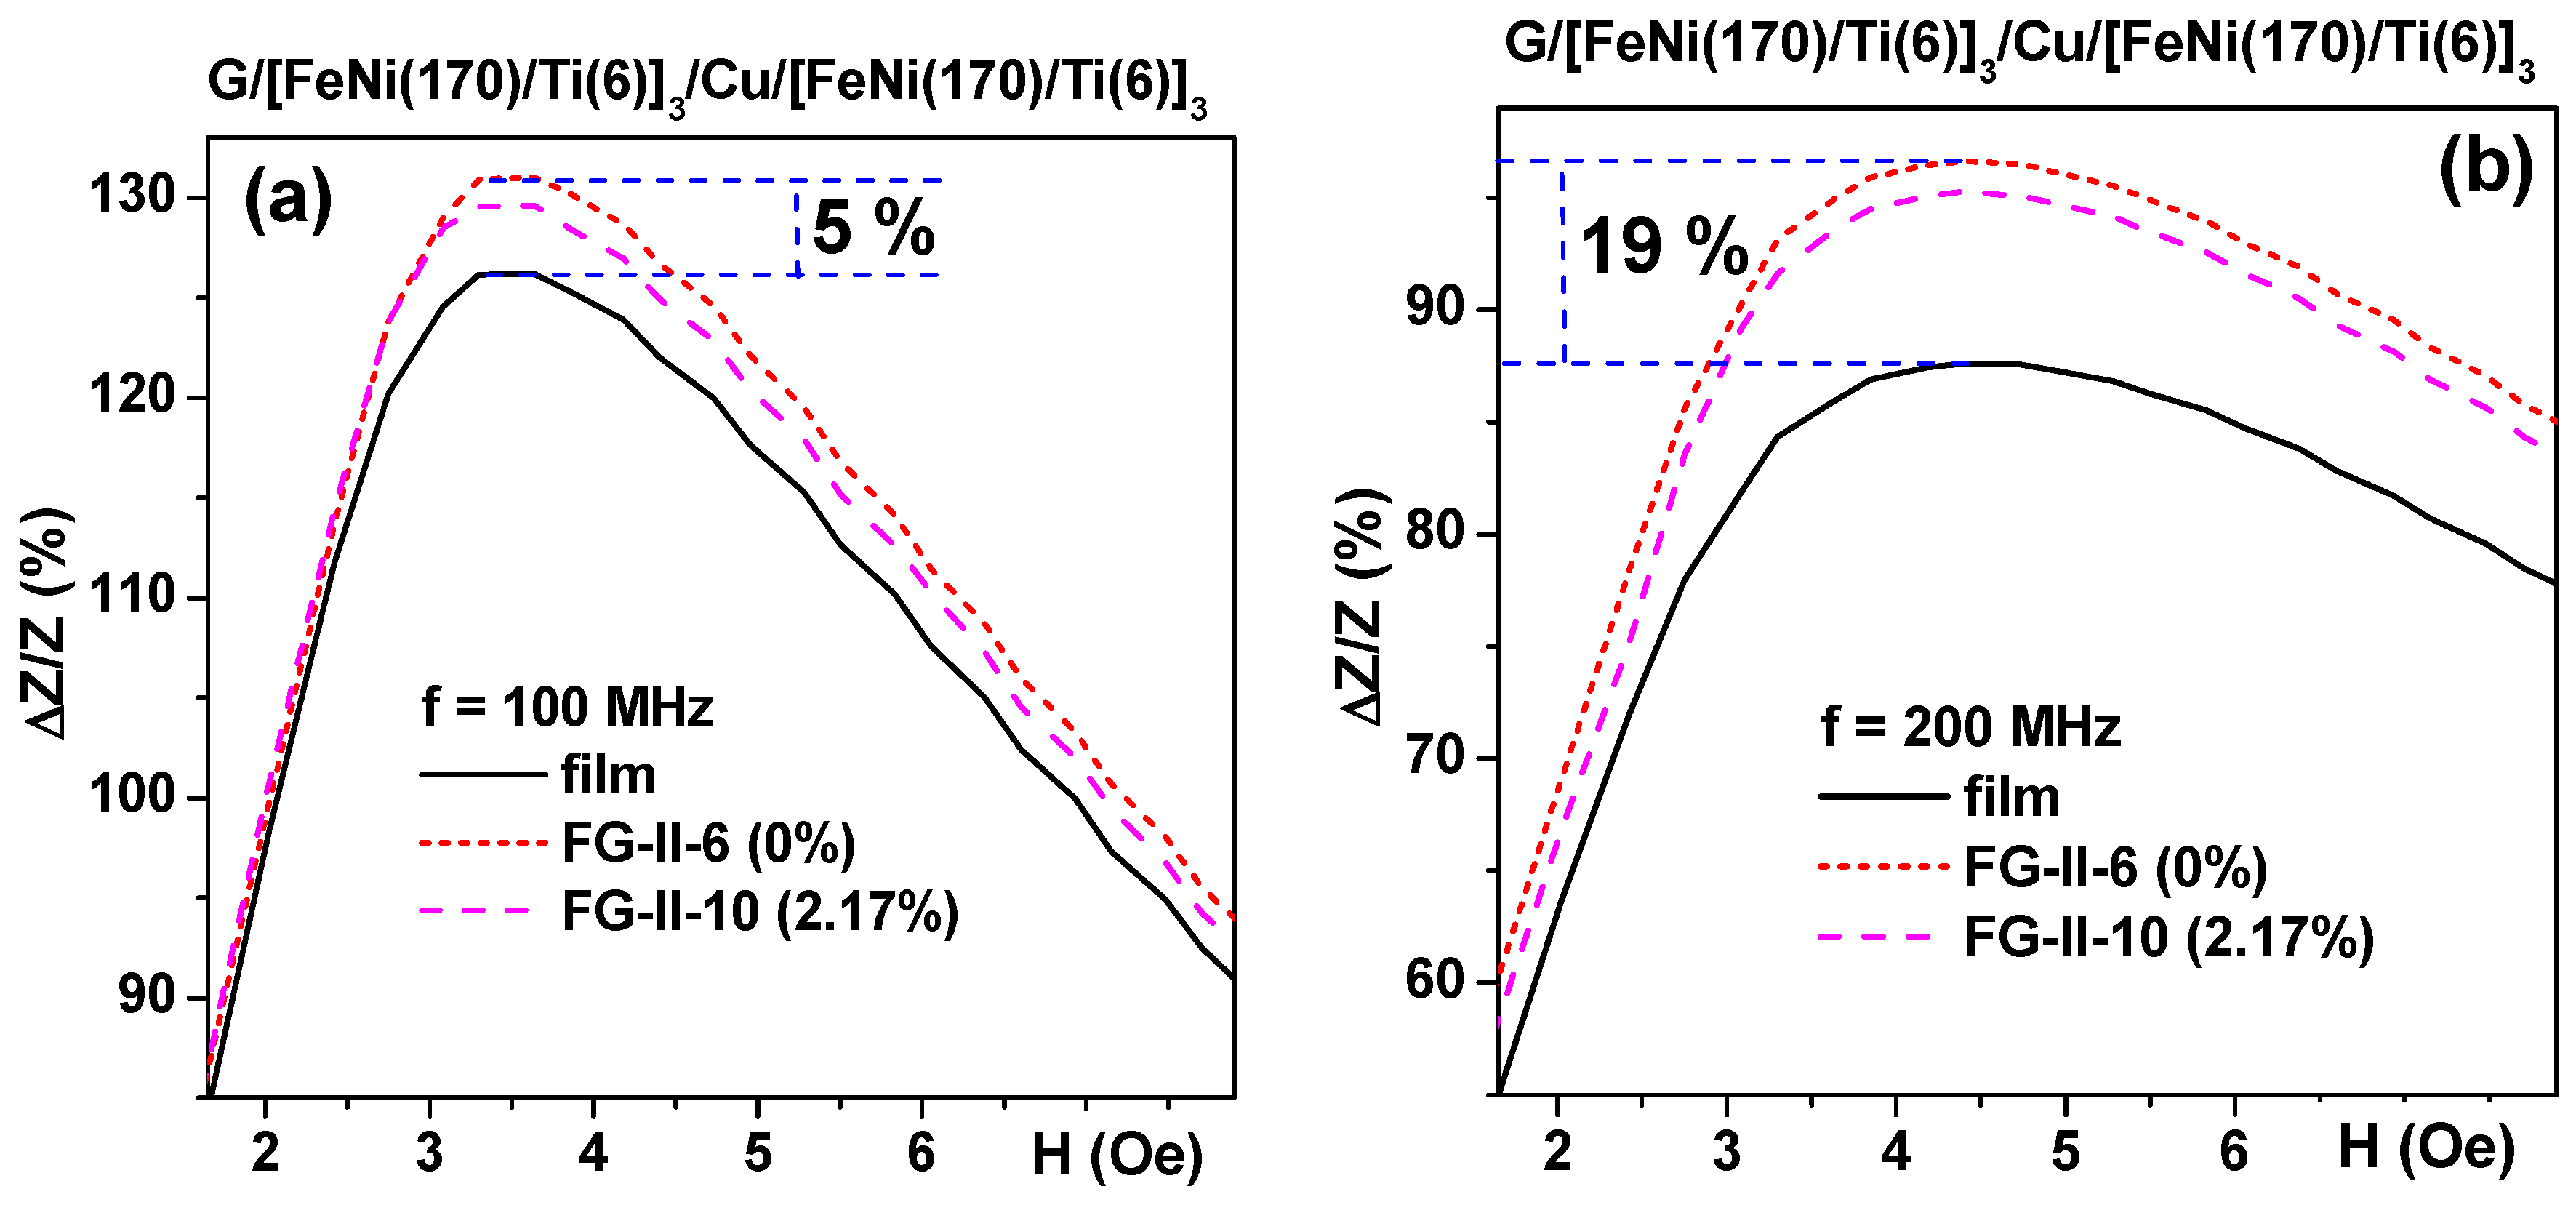
Figure 11a,b). It is also clear that the difference between the response of the MI element itself and the MI element covered by gel/ferrogel depends on the frequency of the driving current: in the case of G/[FeNi(170 nm)/Ti(6 nm)]
3/Cu(500 nm)/[FeNi(170 nm)/Ti(6 nm)]
3. Similar behavior was also observed for FeNi/Cu-based multilayered structures deposited onto flexible substrates for both kinds of gels (see also
Table 2): in all cases the presence of a thin gel/ferrogel layer on the surface of the MI multilayered element resulted in an increase in the MI response near the anisotropy field.
In order to evaluate the difference between the Δ
Z/
Z value of the uncovered and gel covered MI element according to the type of frequency, we measured it for different frequencies (
Figure 12b, Inset). For a mathematical representation the following equation was used for each one of the fixed frequencies: Δ(Δ
Z/
Z)
f = 100% × (Δ
Z/
Zfilm+FG − Δ
Z/
Zfilm)/Δ
Z/
Zfilm). One can see clearly that the Δ(Δ
Z/
Z)
f parameter increases with an increase in the driving current frequency.
Despite the fact that evident qualitative agreement between the proposed model and the experimental data was obtained, for the practical purpose of biosensor application or simple use of MI for studies of gel materials, the experimental part of the measurements with gels required special efforts. Apart from an unusual time limitation due to gel dehydration, the measurements required fabricating gel samples of exactly the same shape and mass and exactly the same placement in the measuring system. For large samples previously studied in the MI-biosensor regime, both problems were less critical. Here, the major difficulties came not from the insufficient sensitivity of MI detector but rather from the difficulties of fabricating exactly the same samples and placing them into the system in the same way. Even so, we were able to obtain concentration dependences of the maximum of Δ
Z/
Z ratio for fixed frequencies (
Figure 13) with a sensitivity of almost 2% per 1 wt % of MNPs. Here, we need to remember that all experiments were made with very diluted systems with very low concentrations of iron oxide MNPs.
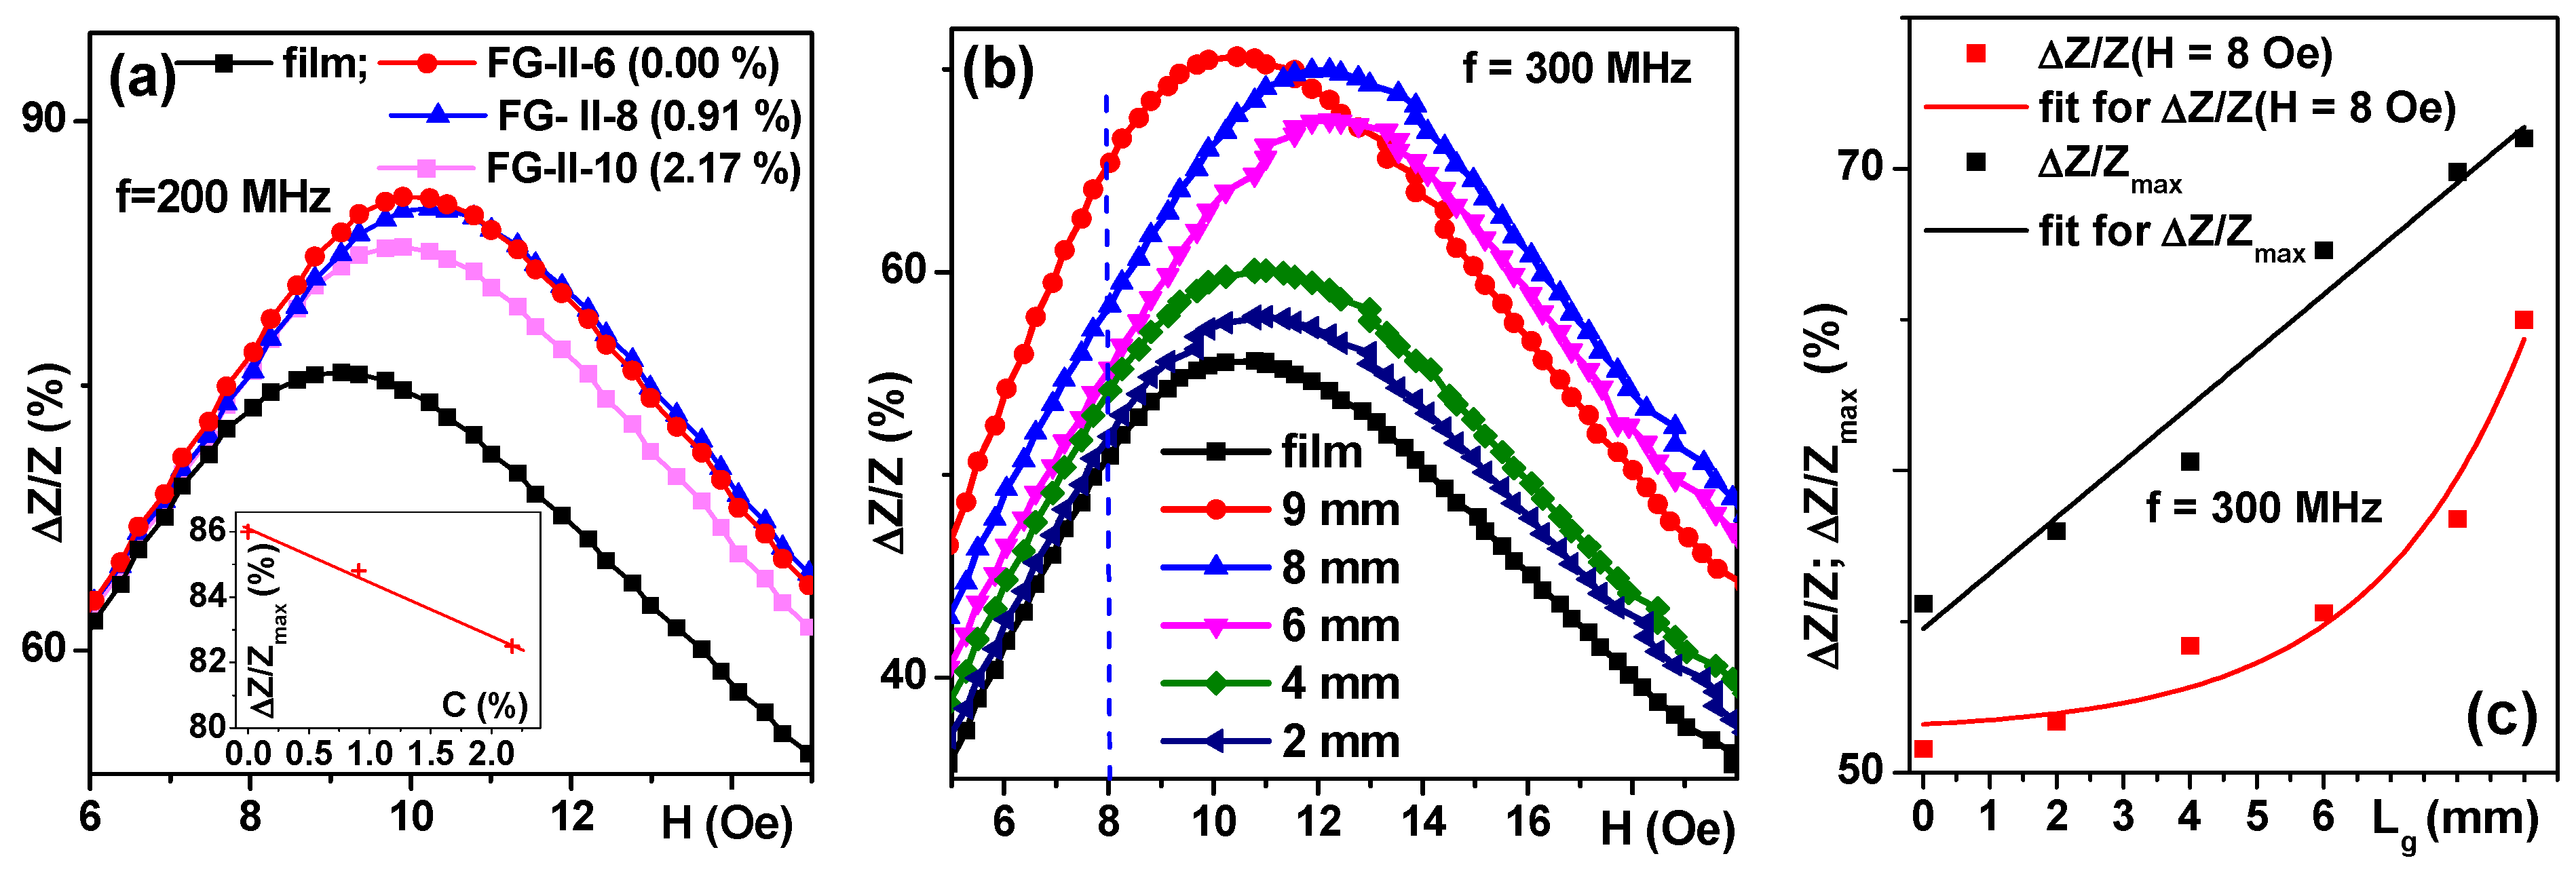
In order to show the extraordinary capacity of the MI element, we also measured the Δ
Z/
Z ratio for a fixed frequency of 300 MHz for the same ferrogel rectangular element which was cut step-by-step into shorter pieces of different length, L
g (
Figure 13b). Although the procedure was not ideal (peaks for 8 and 6 mm were displaced toward higher fields), we were able to detect a tiny piece of about 4 mg of FG-II-10 ferrogel placed symmetrically in the centre of the MI element. This means the detection of about 0.09 mg of MNPs. Different parameters can be used for such detection.
Figure 13c shows the comparison of Δ
Z/
Z(L
g) and Δ
Z/
Zmax(L
g), where Δ
Z/
Z(L
g) was taken for the external magnetic field of 8 Oe. Δ
Z/
Z(L
g) shows exponential and Δ
Z/
Zmax(L
g) shows linear dependence on the gel stripe lengths.
There have been attempts to design a MI-based biosensor with different types of sensitive elements, such as amorphous ribbons, wires, and thin films [
2,
10,
11,
12,
16,
52,
53]. They all have advantages and disadvantages, but the thin film direction seems to be the most promising. For multifunctional biosensor applications we expect the creation of a magnetic biosensor which would be capable of quantitatively monitoring living tissue functions, such as muscle contraction or evaluating a number of MNP loaded cells adhered onto the surface of a ferrogel implant near damaged tissue.
We were not able to design a biosensor prototype with controlled humidity inside the measuring chamber, but this is an urgent goal for the next study in order to avoid the limitations imposed by the short time for the measurements. Additional methodology should be elaborated to control the shape of small gel samples. Here, the biological technique of sample preparation might be useful [
22]. Meanwhile, we have completed the next step in the development of a new generation of magnetic biosensors by the development of ferrogels incorporating magnetic nanoparticles into chemically crosslinked hydrogels mimicking some properties of the living systems and showing that the giant magnetoimpedance effect is promising for magnetic biosensor prototype development.

 ,
, 


