Monitoring of Soft Deposition Layers in Liquid-Filled Tubes with Guided Acoustic Waves Excited by Clamp-on Transducers

 ,
,  and
and 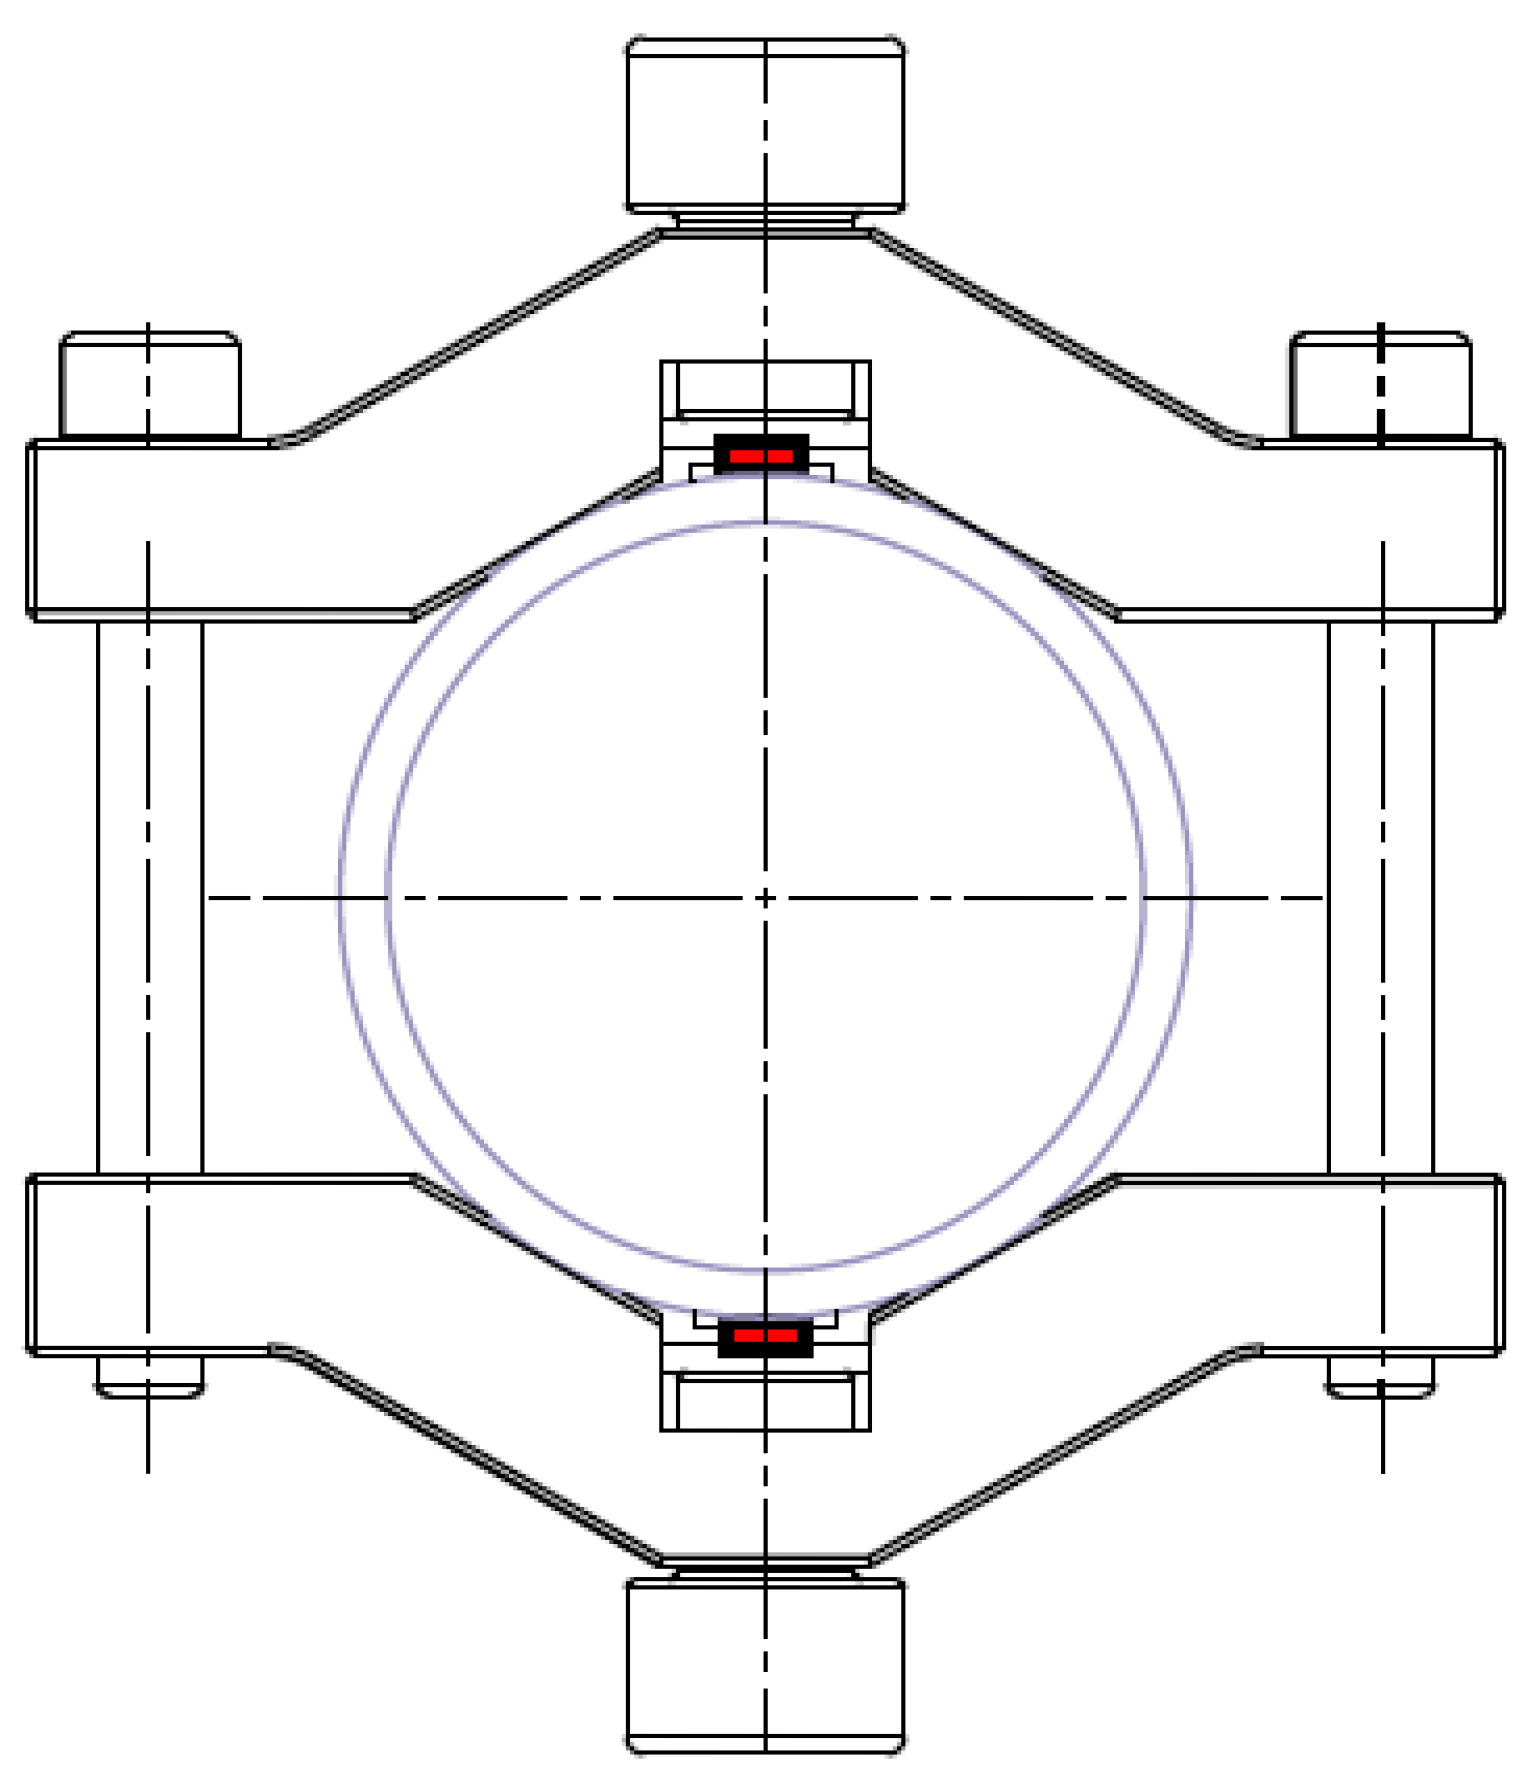
Abstract
1. Introduction
2. Materials and Methods
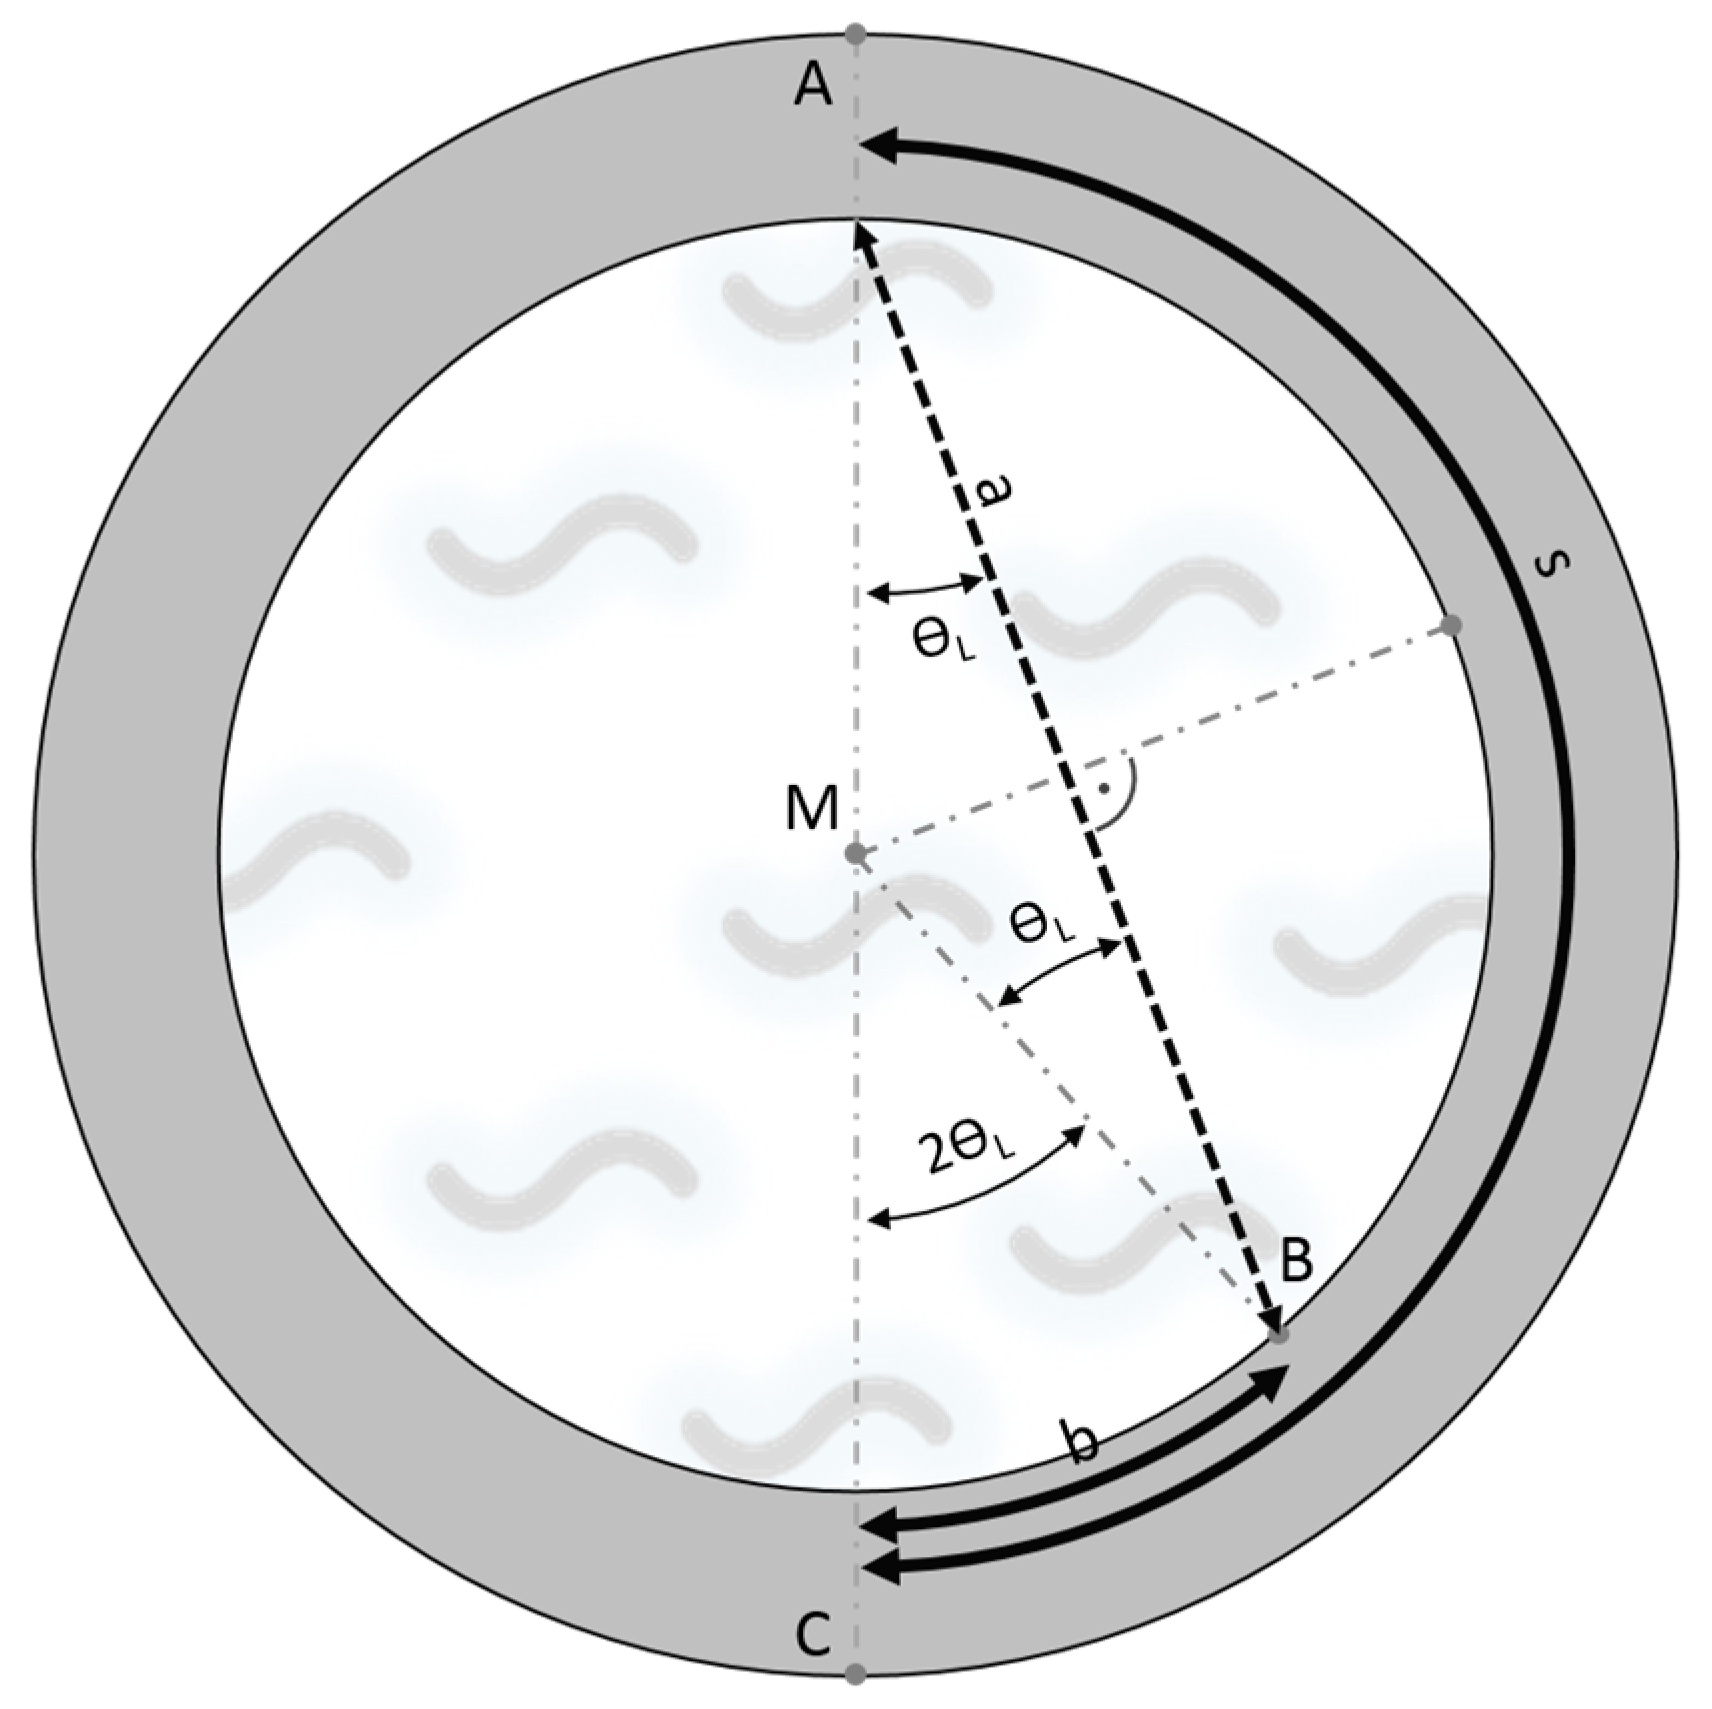
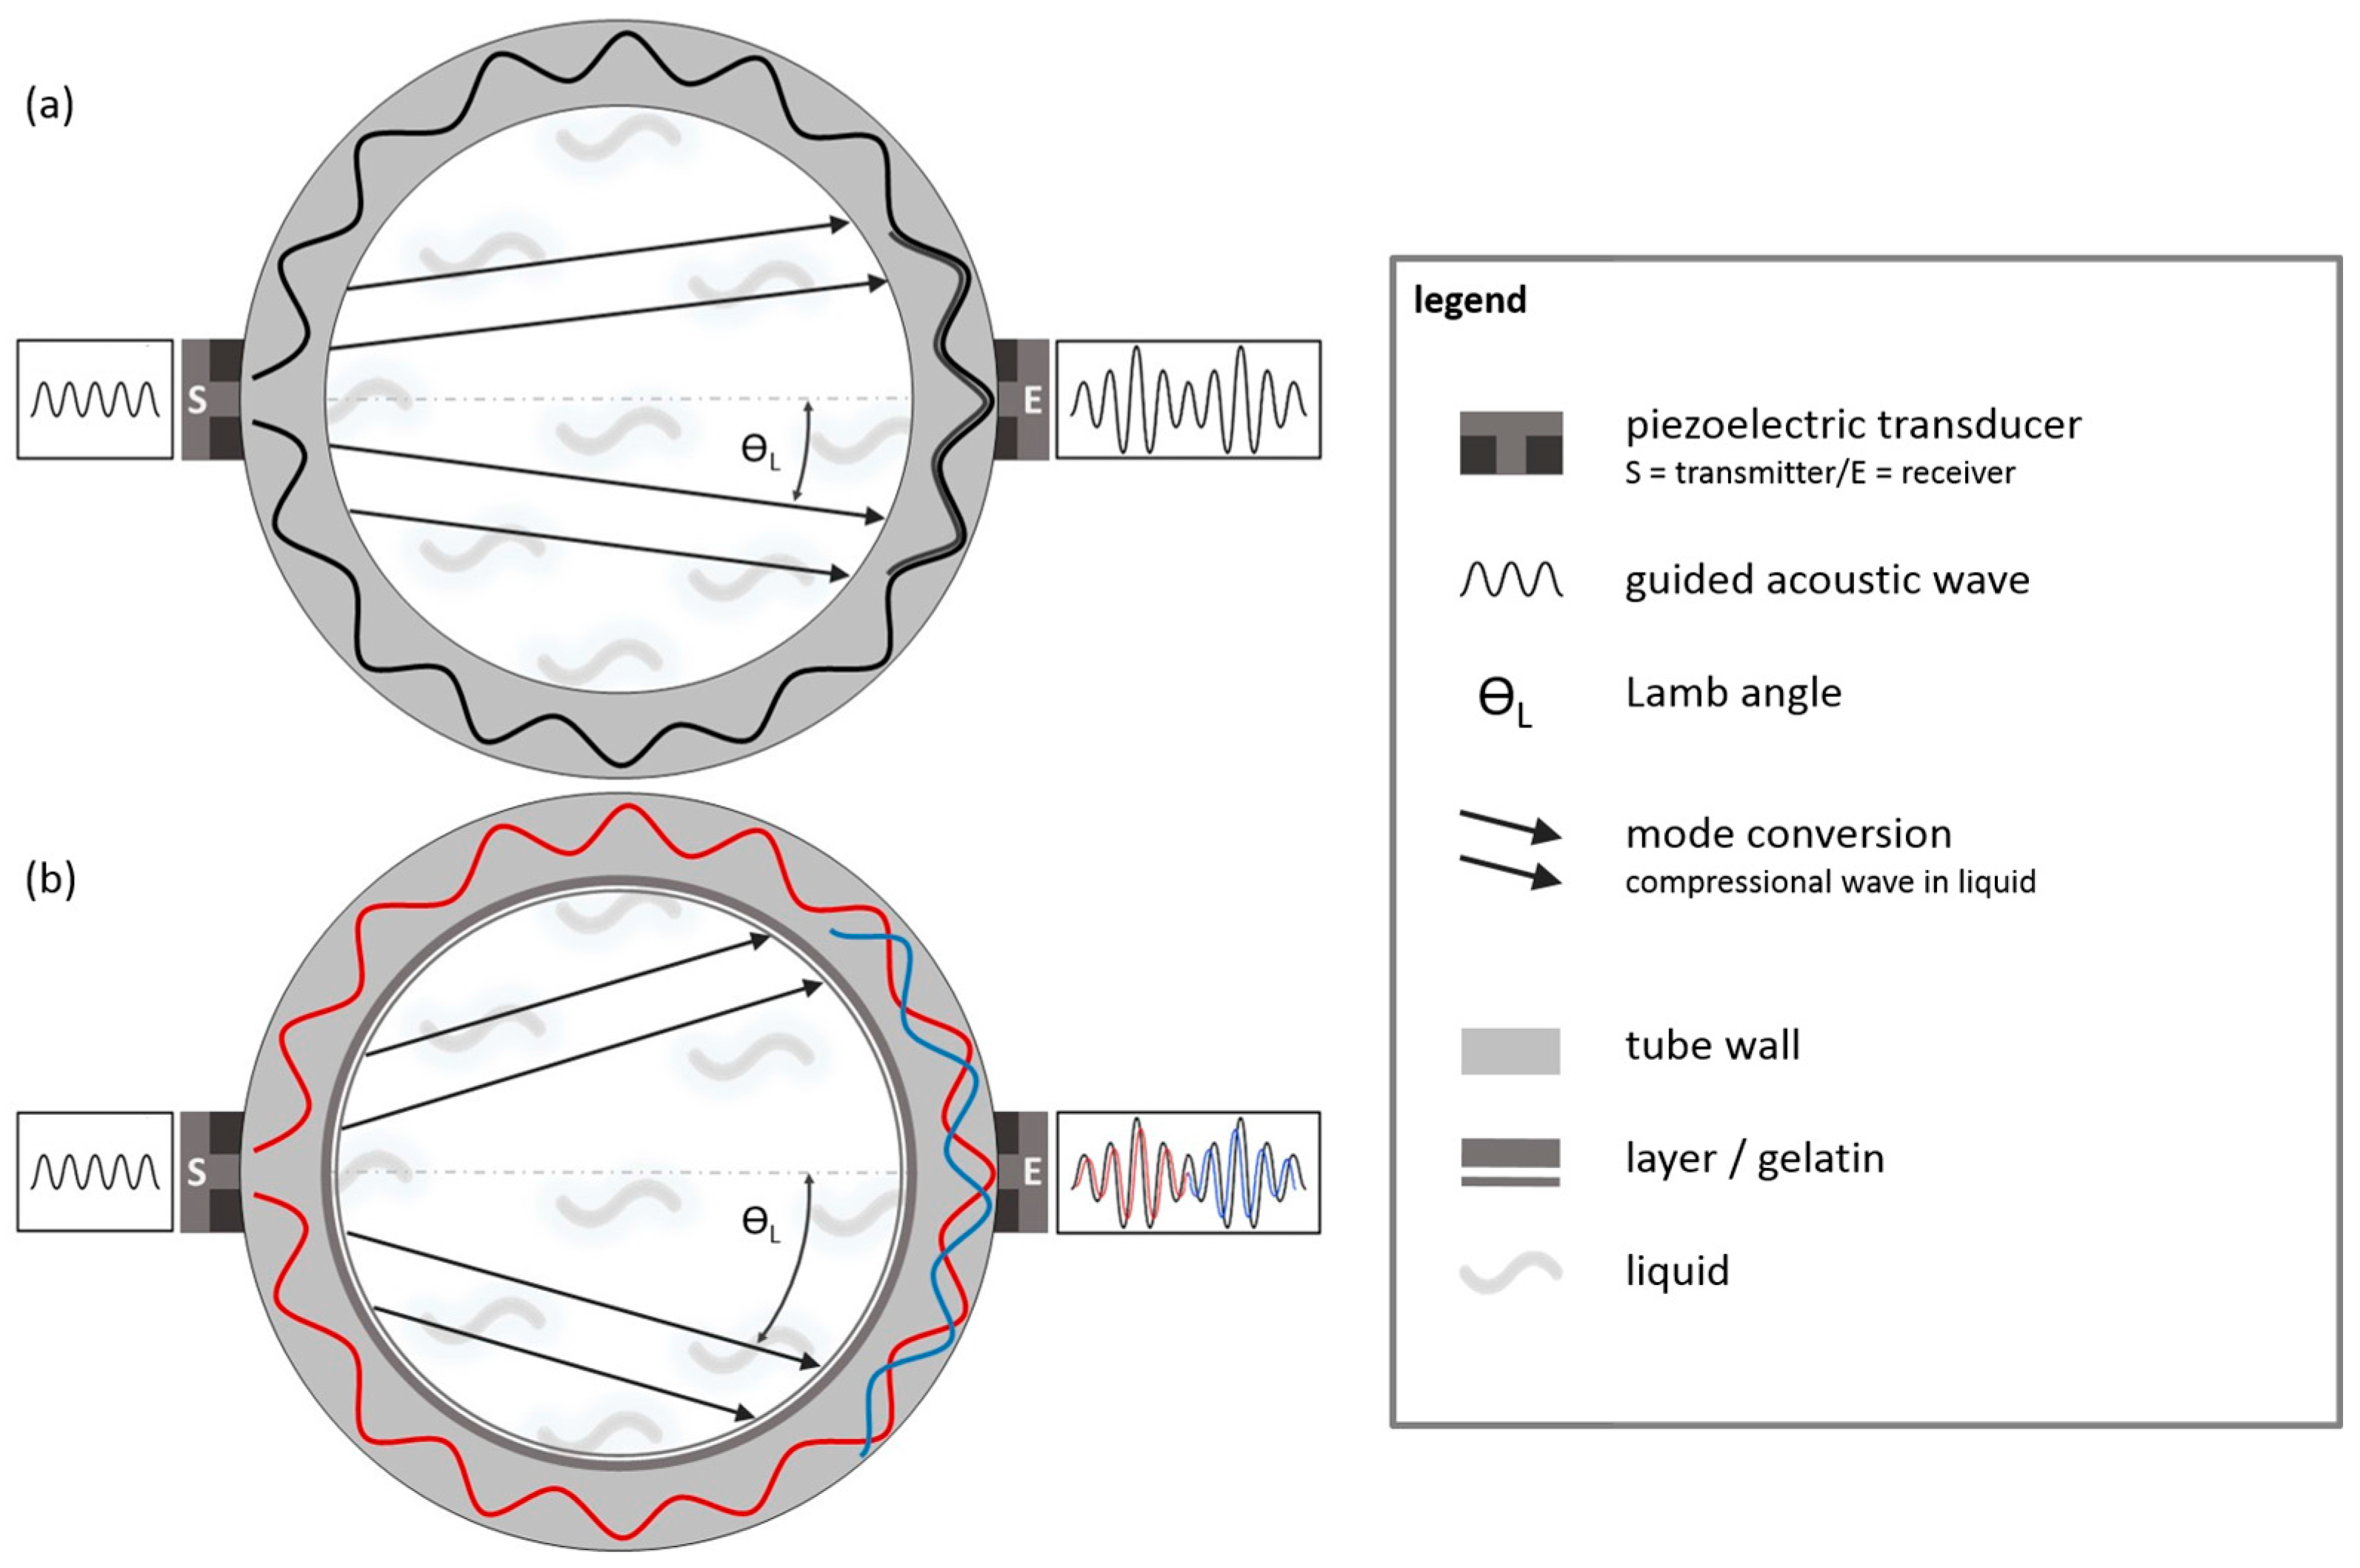
2.1. Experimental Concept
2.2. Transducer Arrangement
2.3. Sample Preparation
2.4. Measurement Devices and Procedures
3. Results
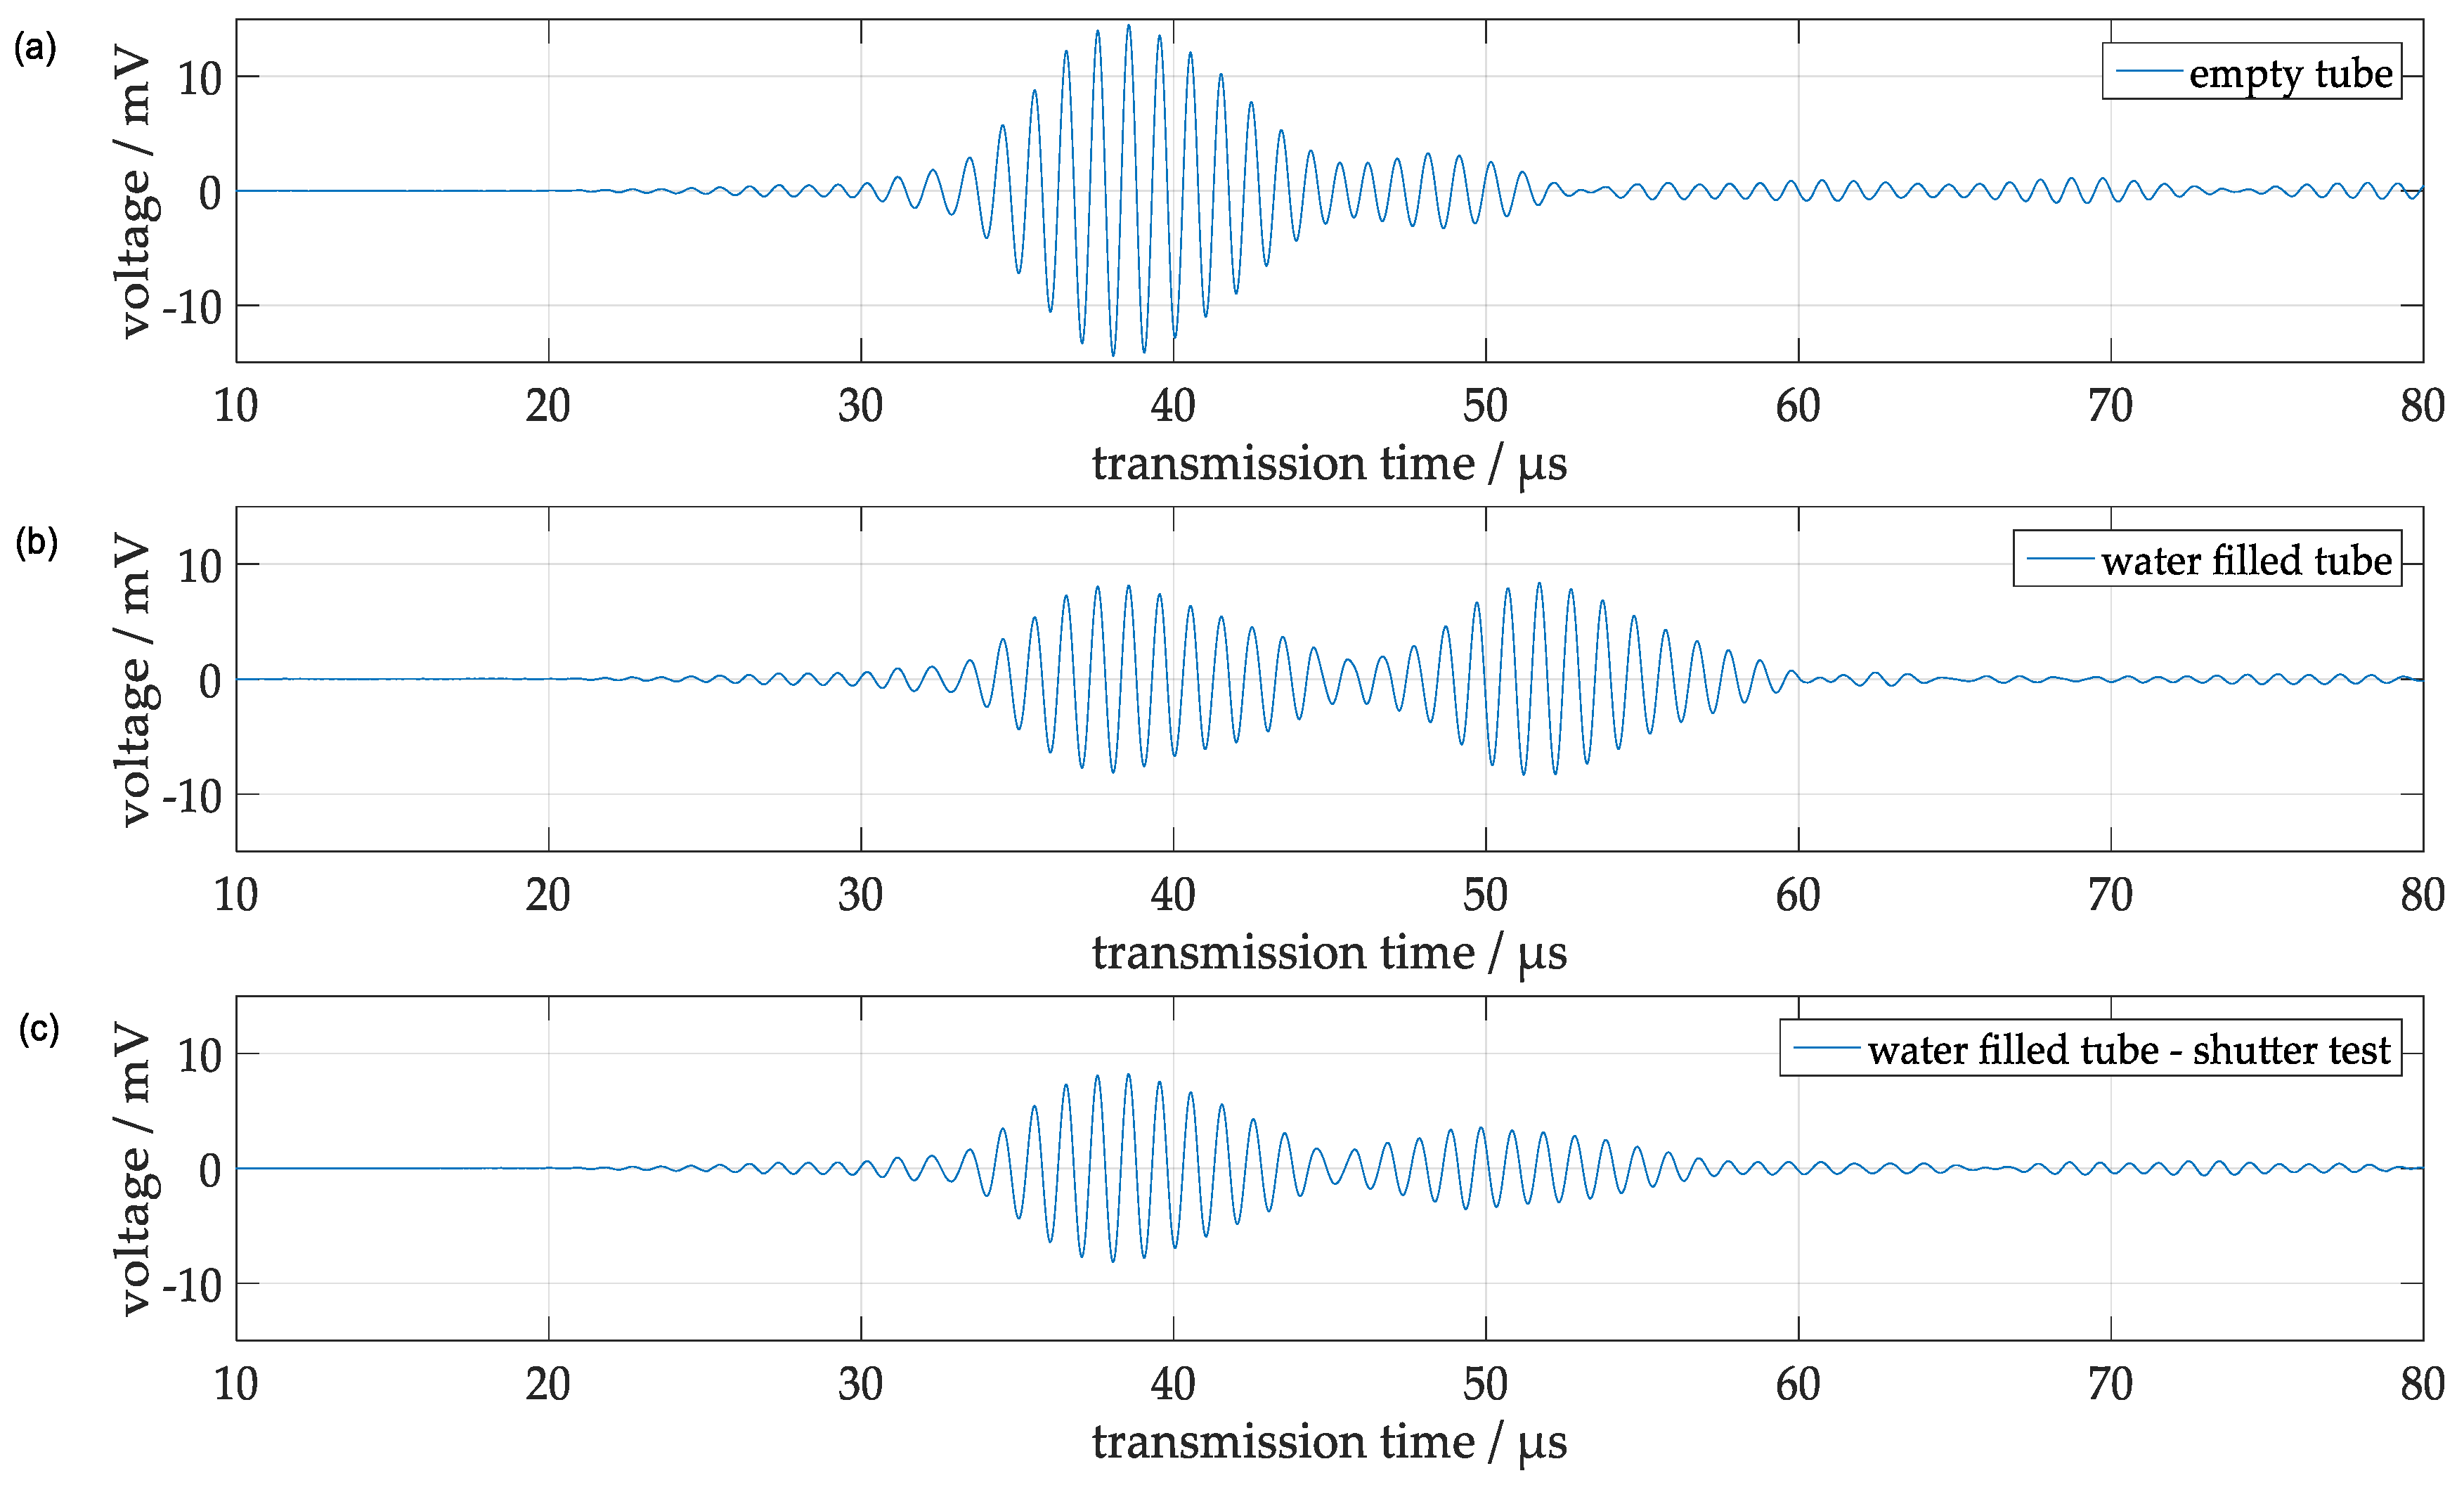
3.1. Acoustic Wave Pulse Propagation in a Water Filled Test Tube
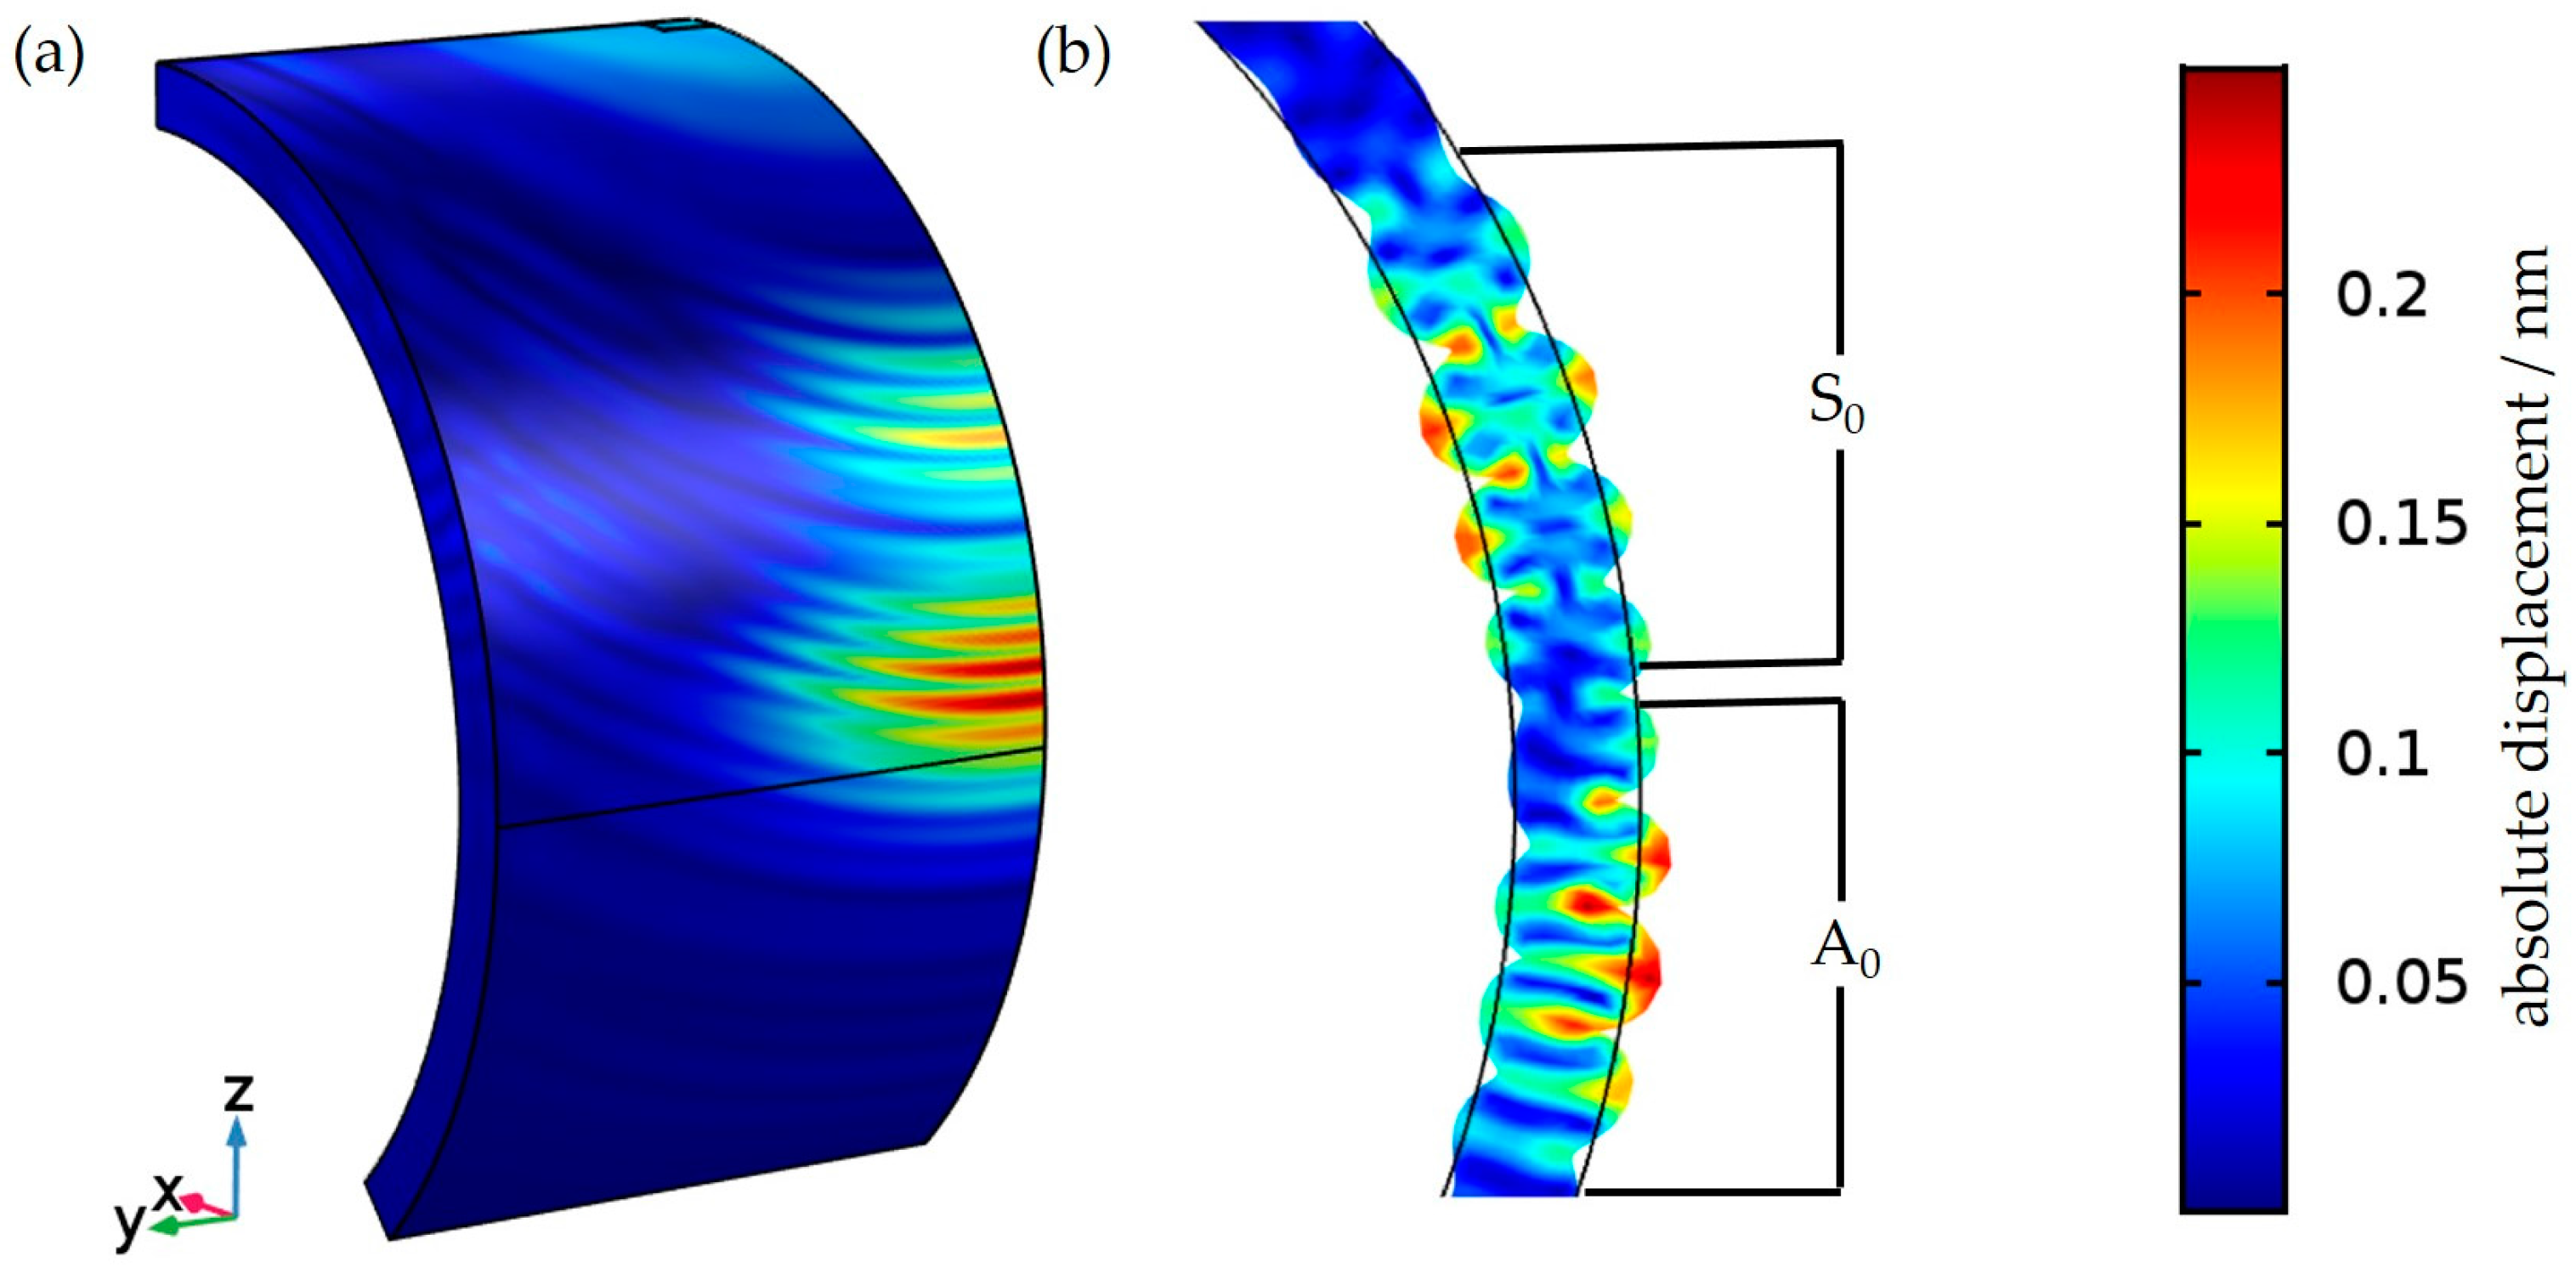
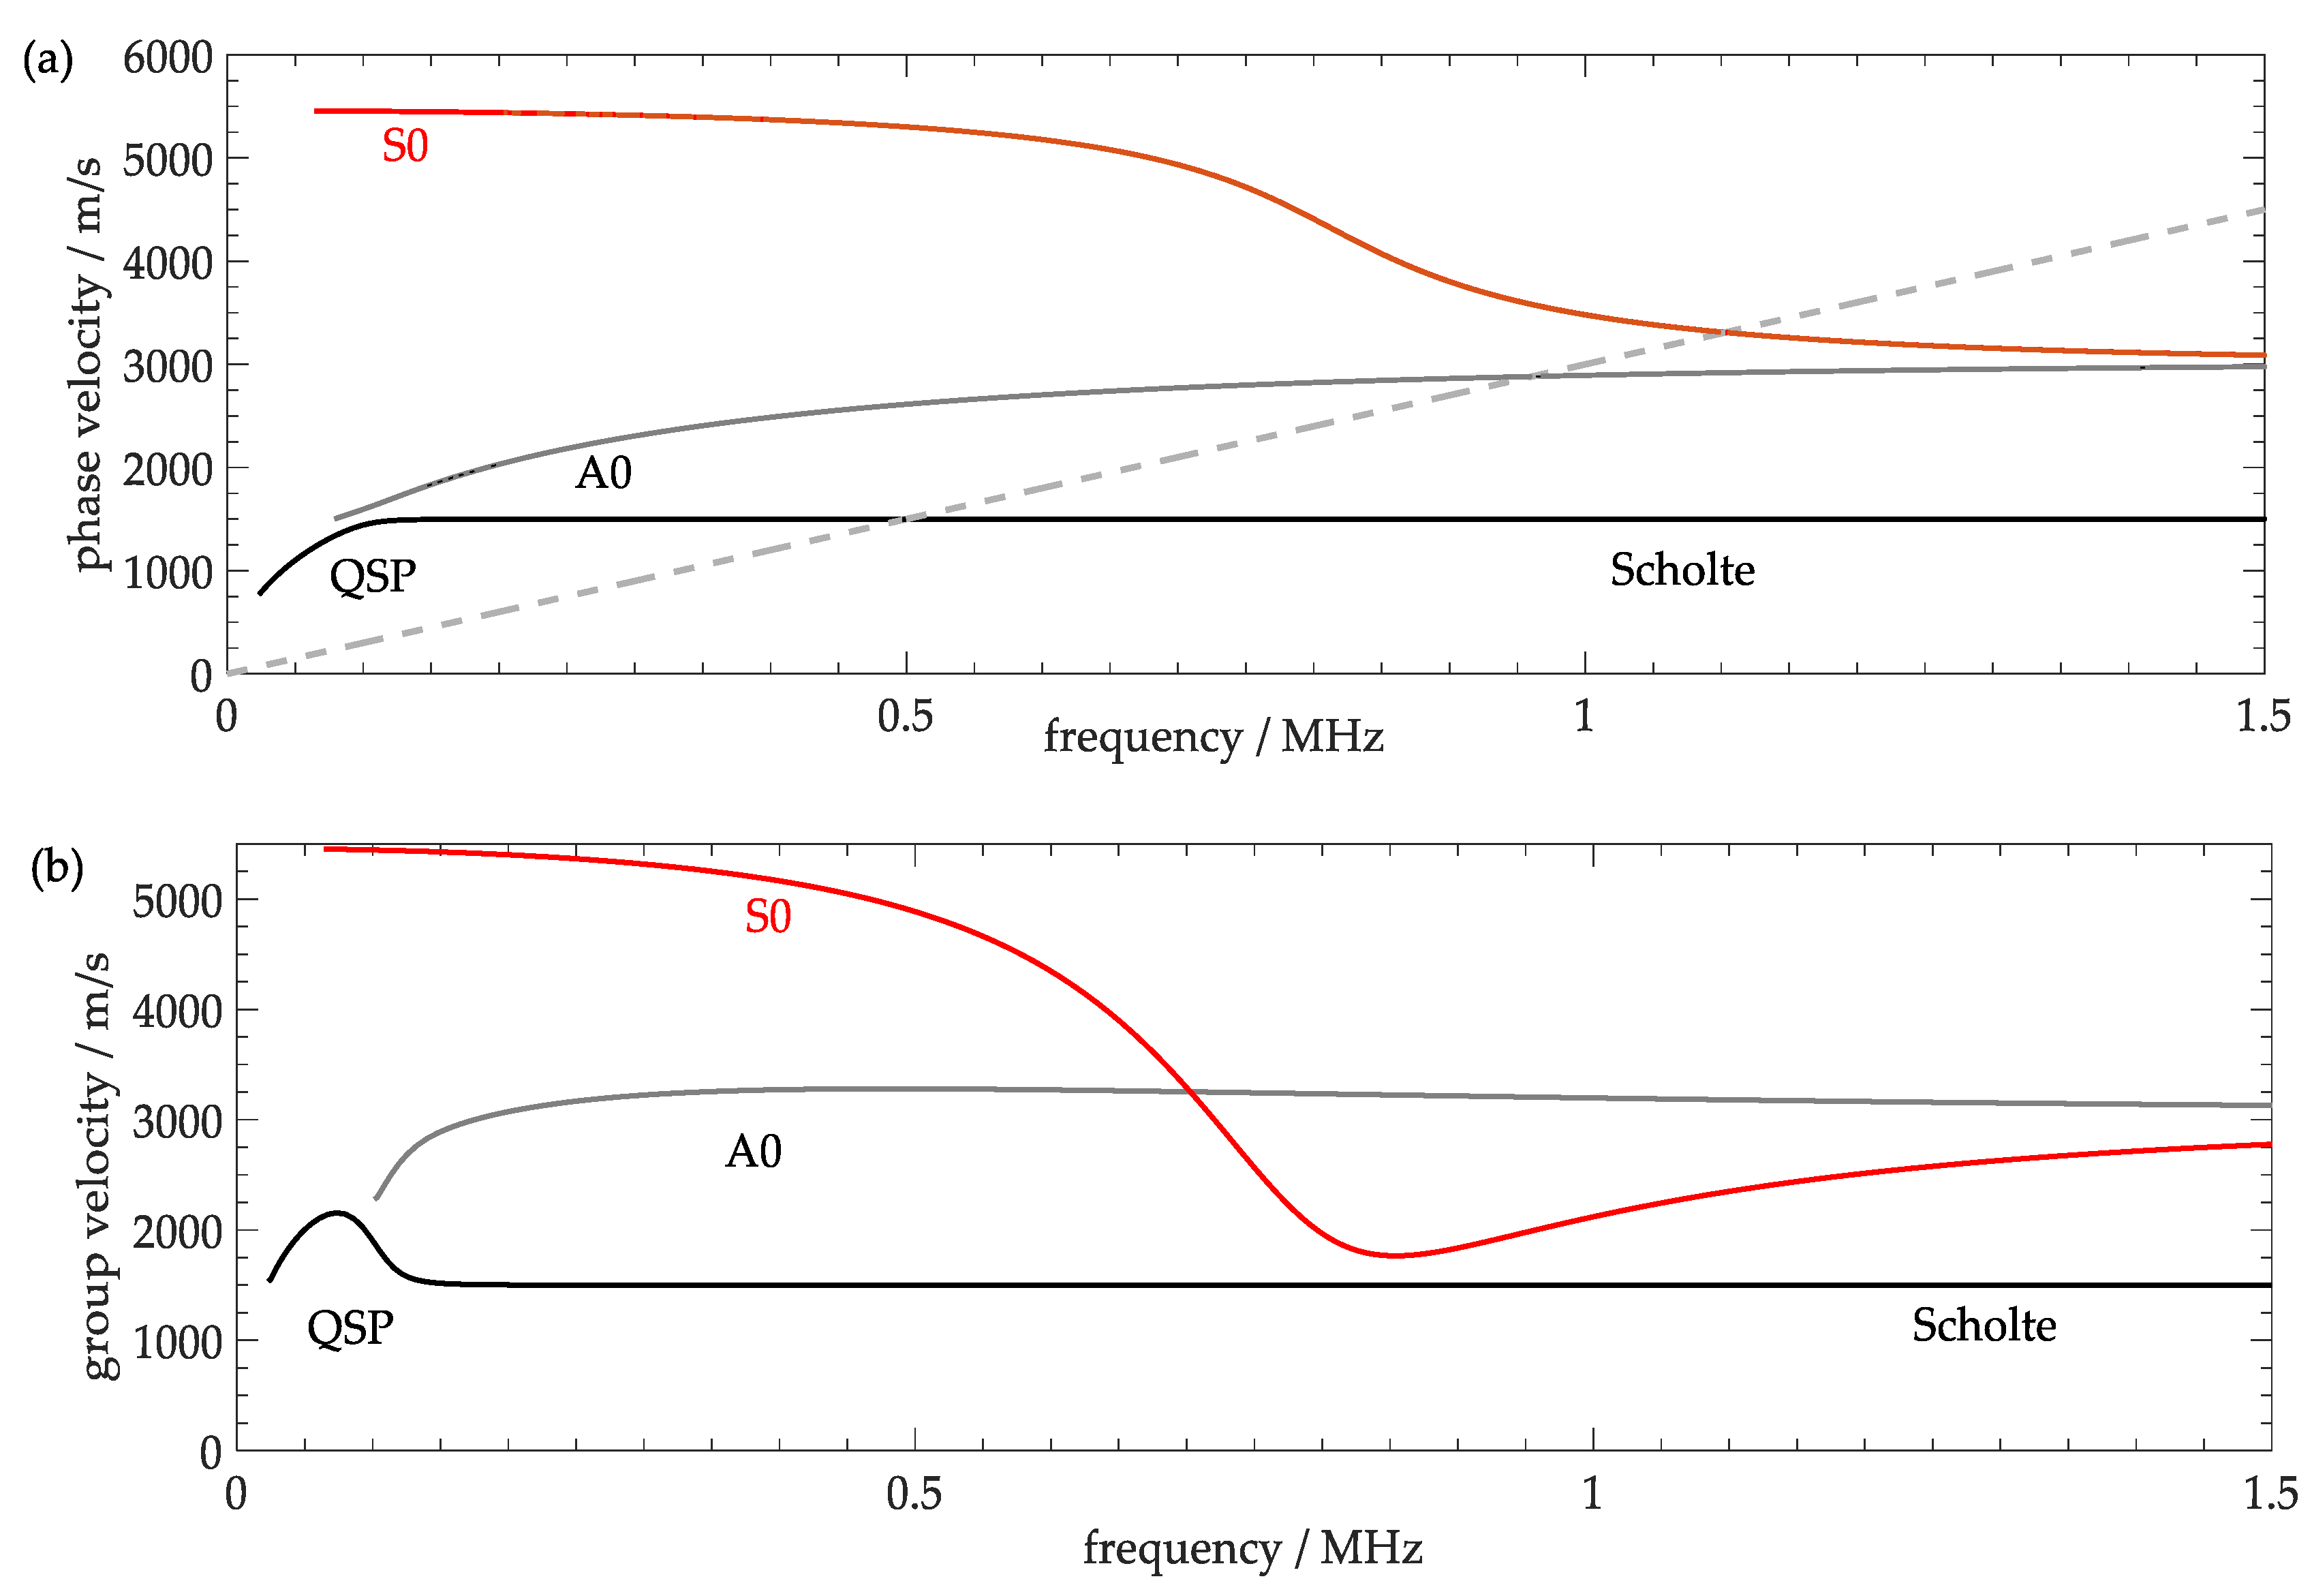
3.1.1. Numerical Simulations
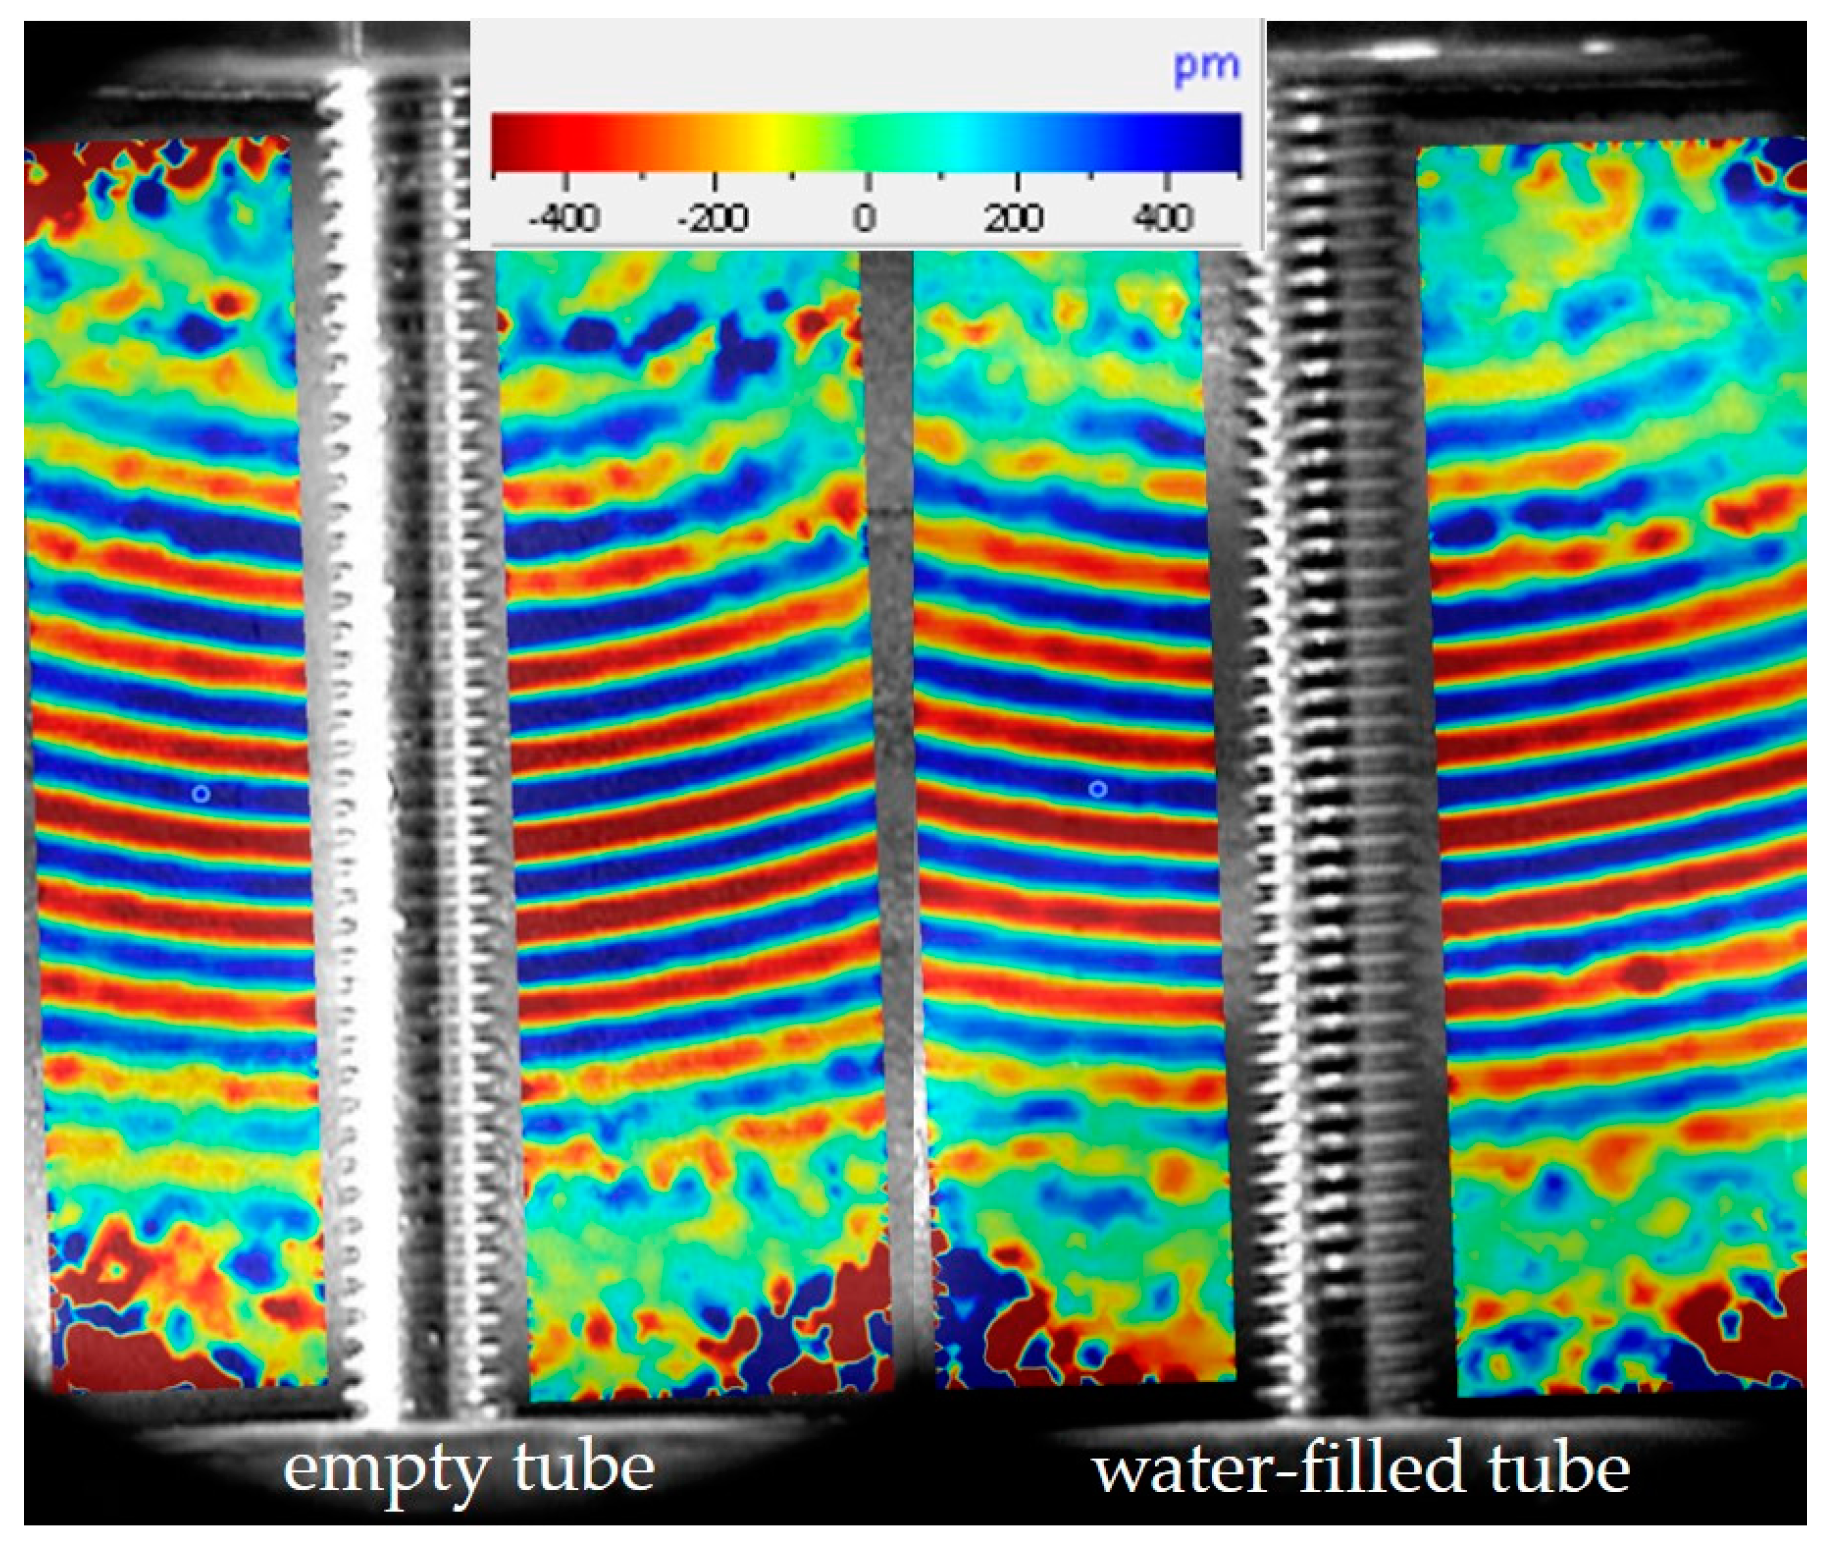
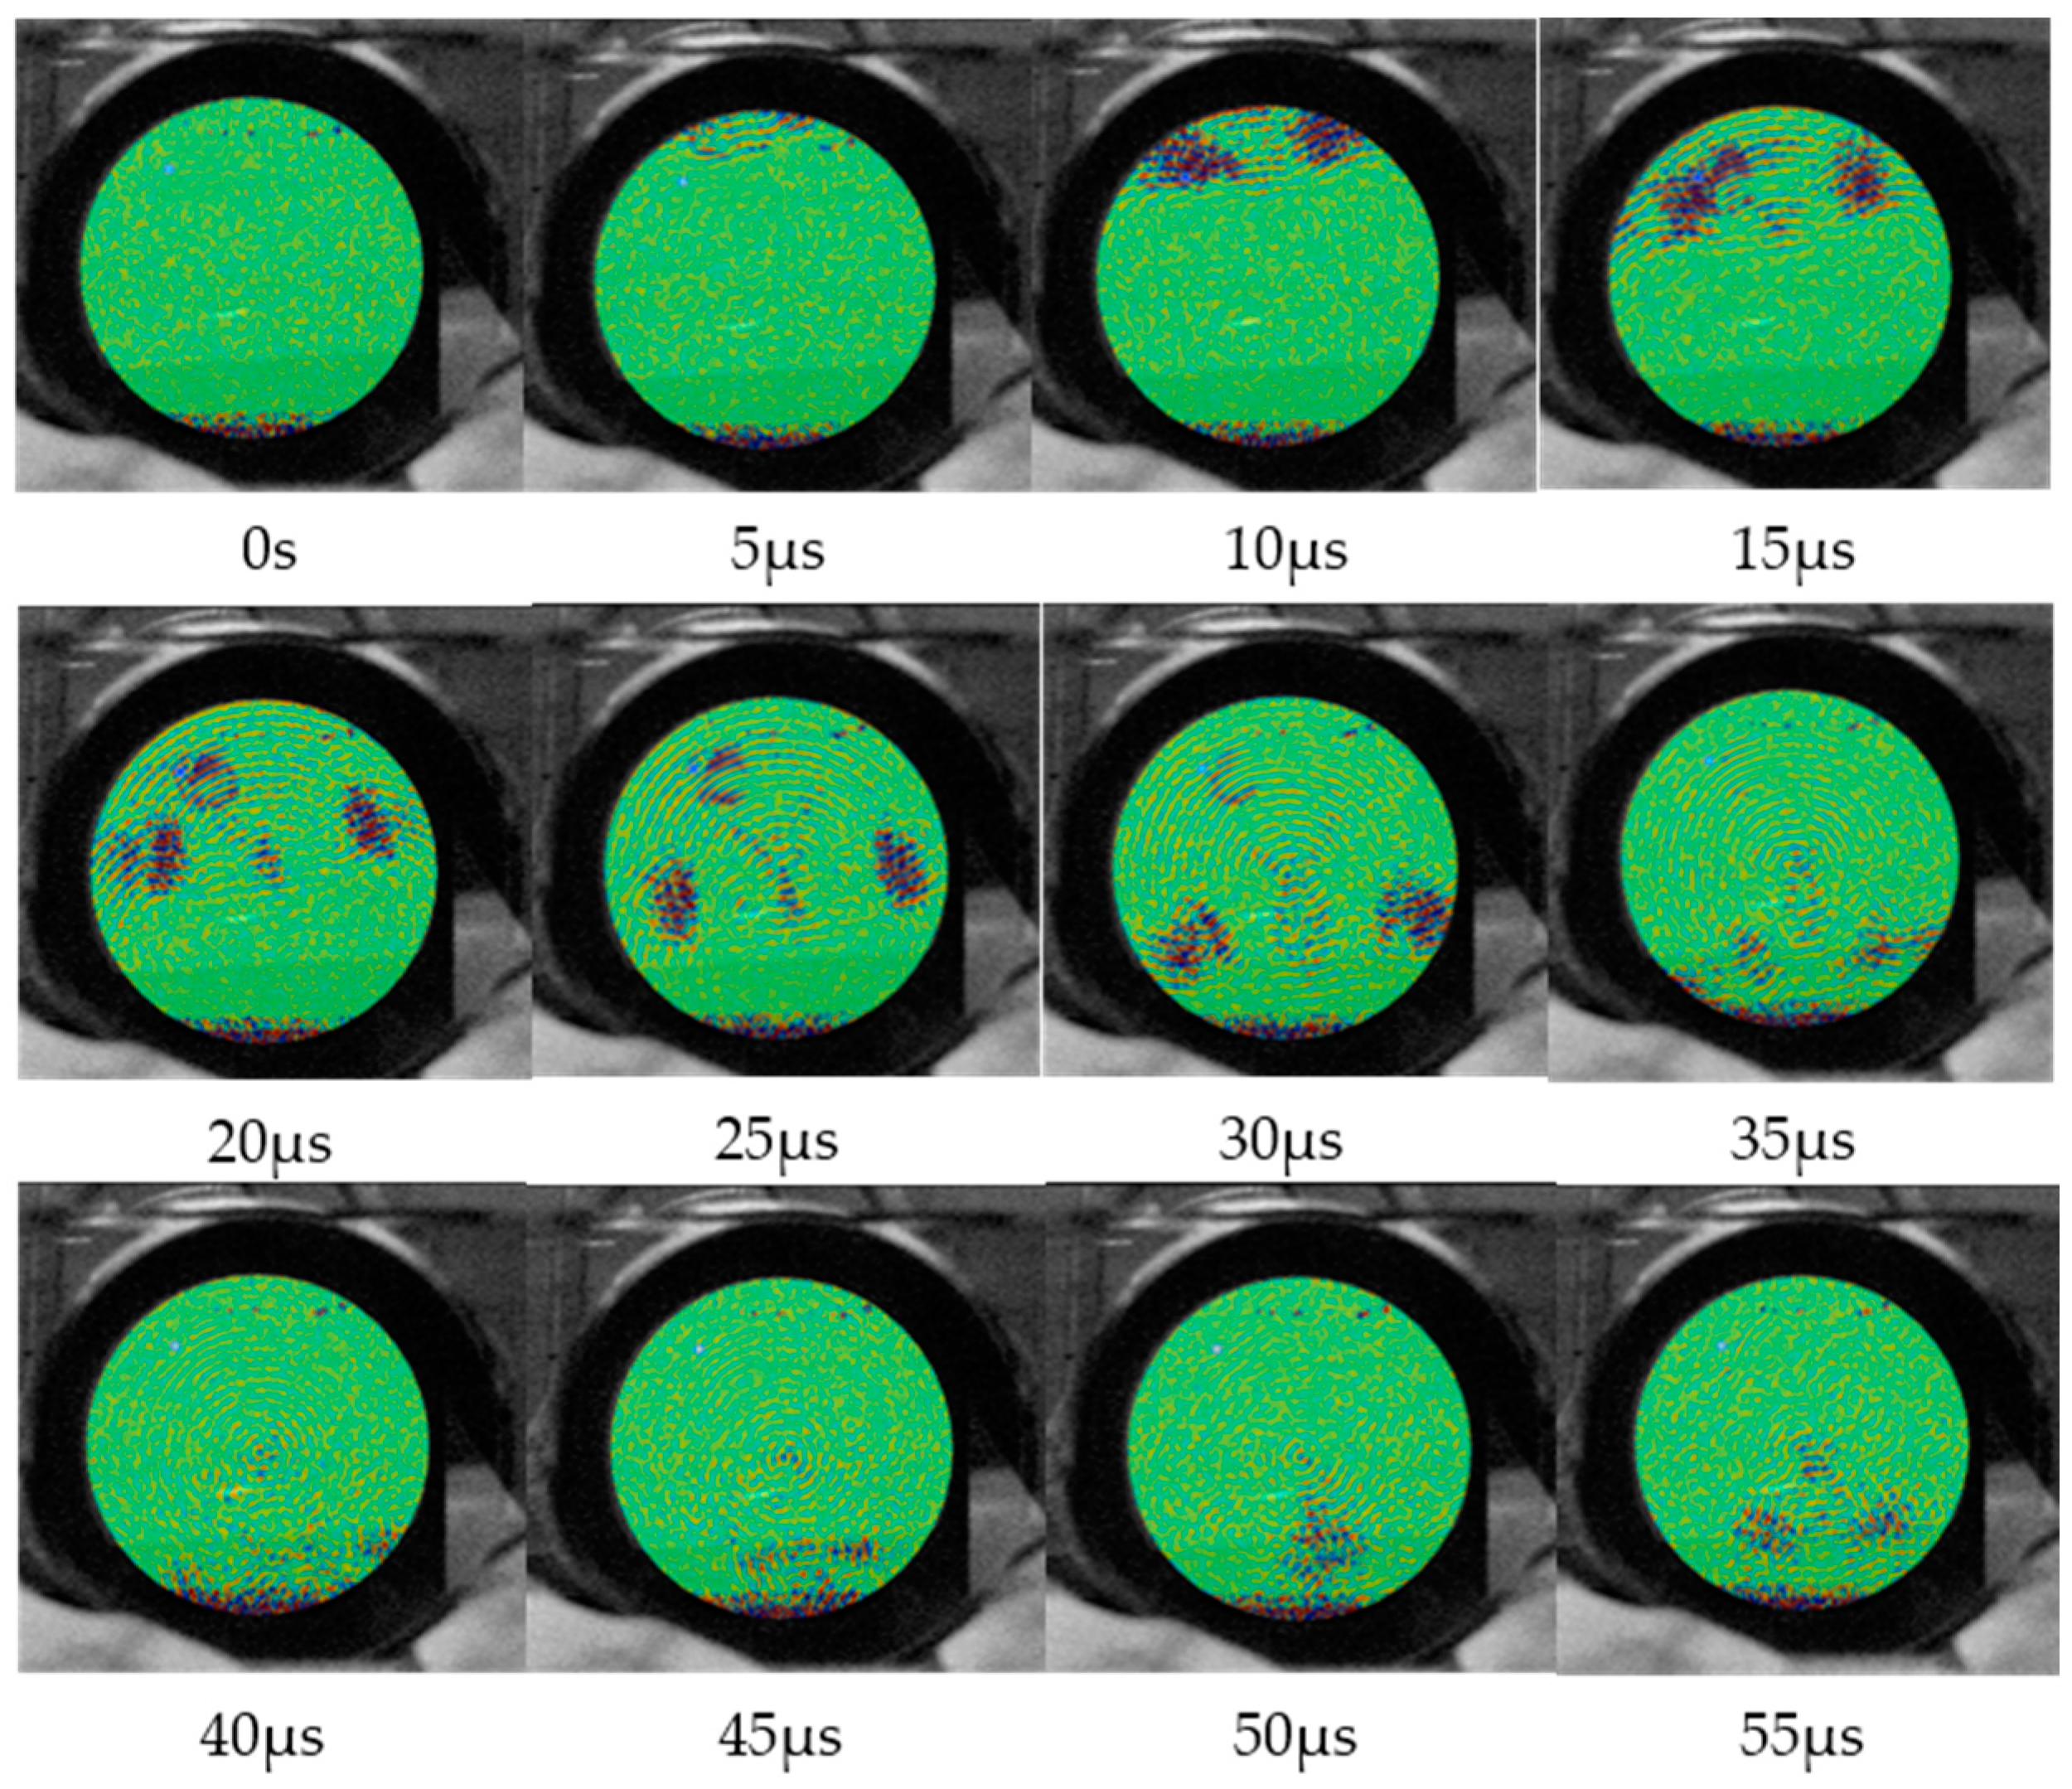
3.1.2. Visualization of the Acoustic Wave Propagation with a Scanning Laser Doppler Vibrometer
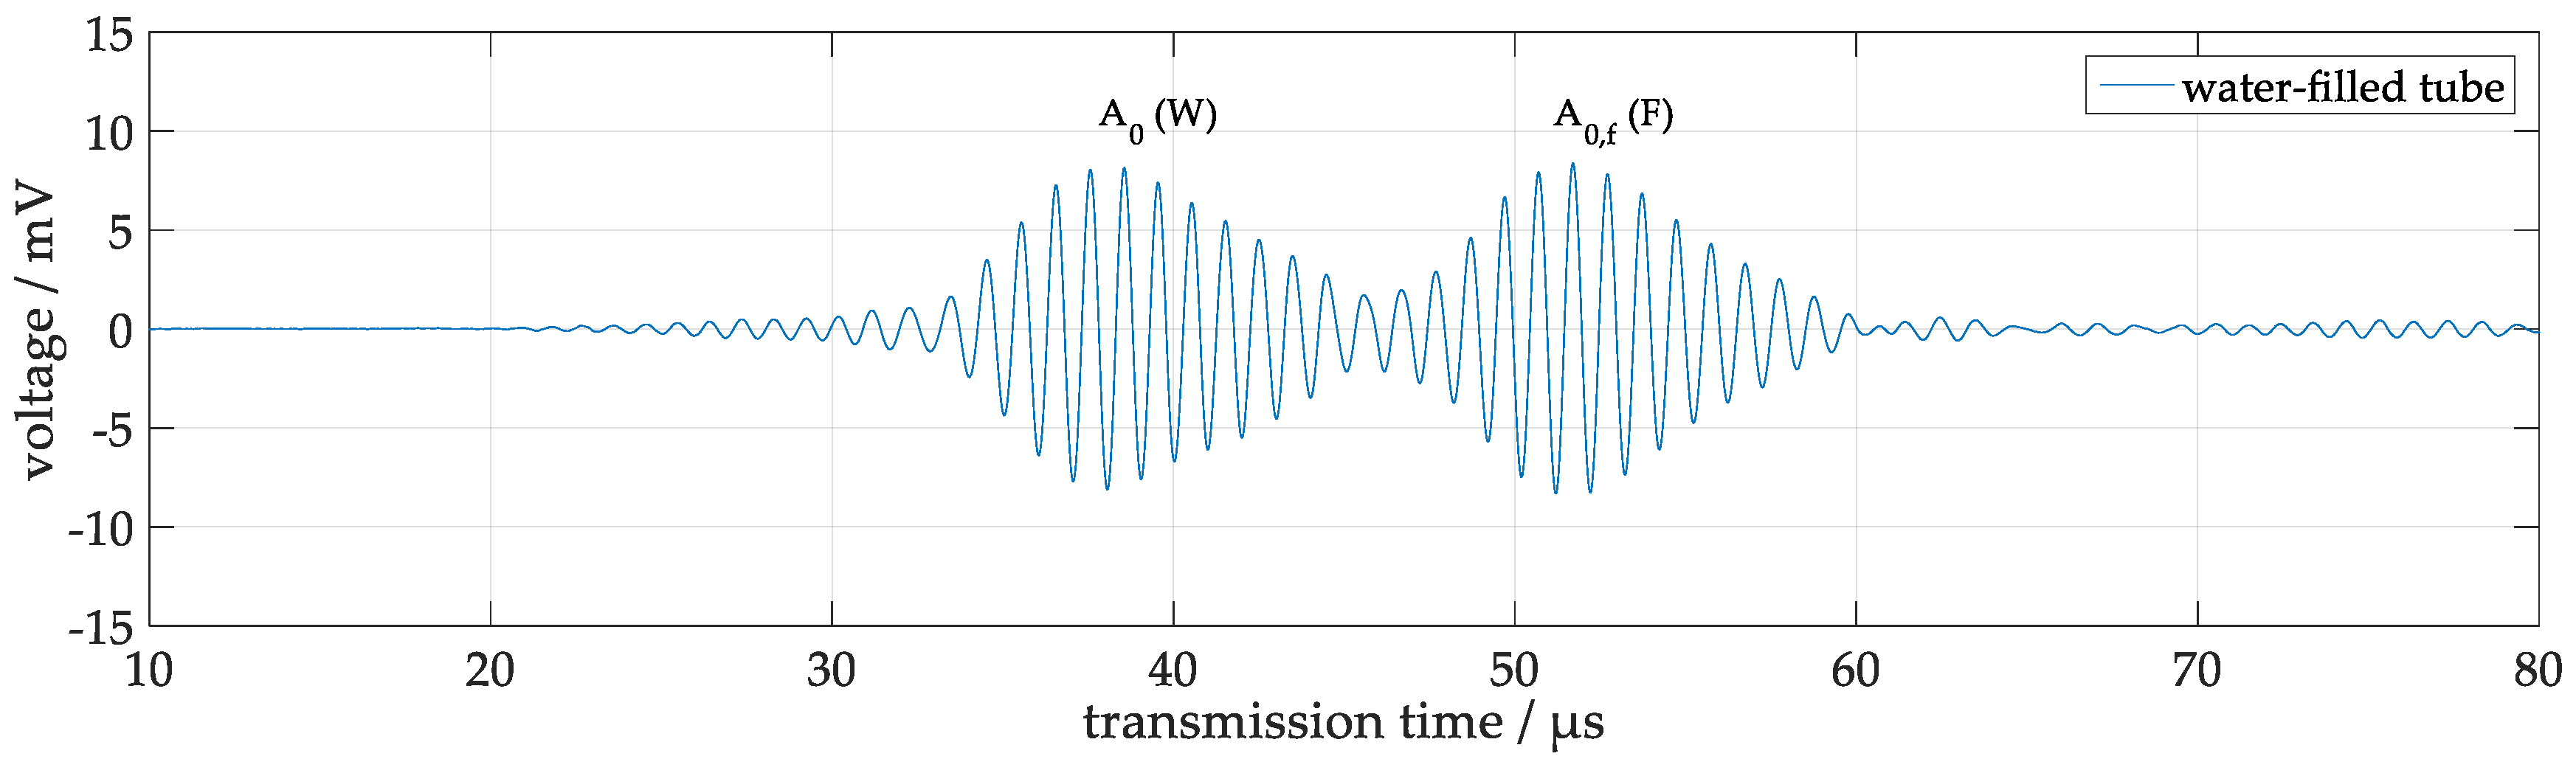
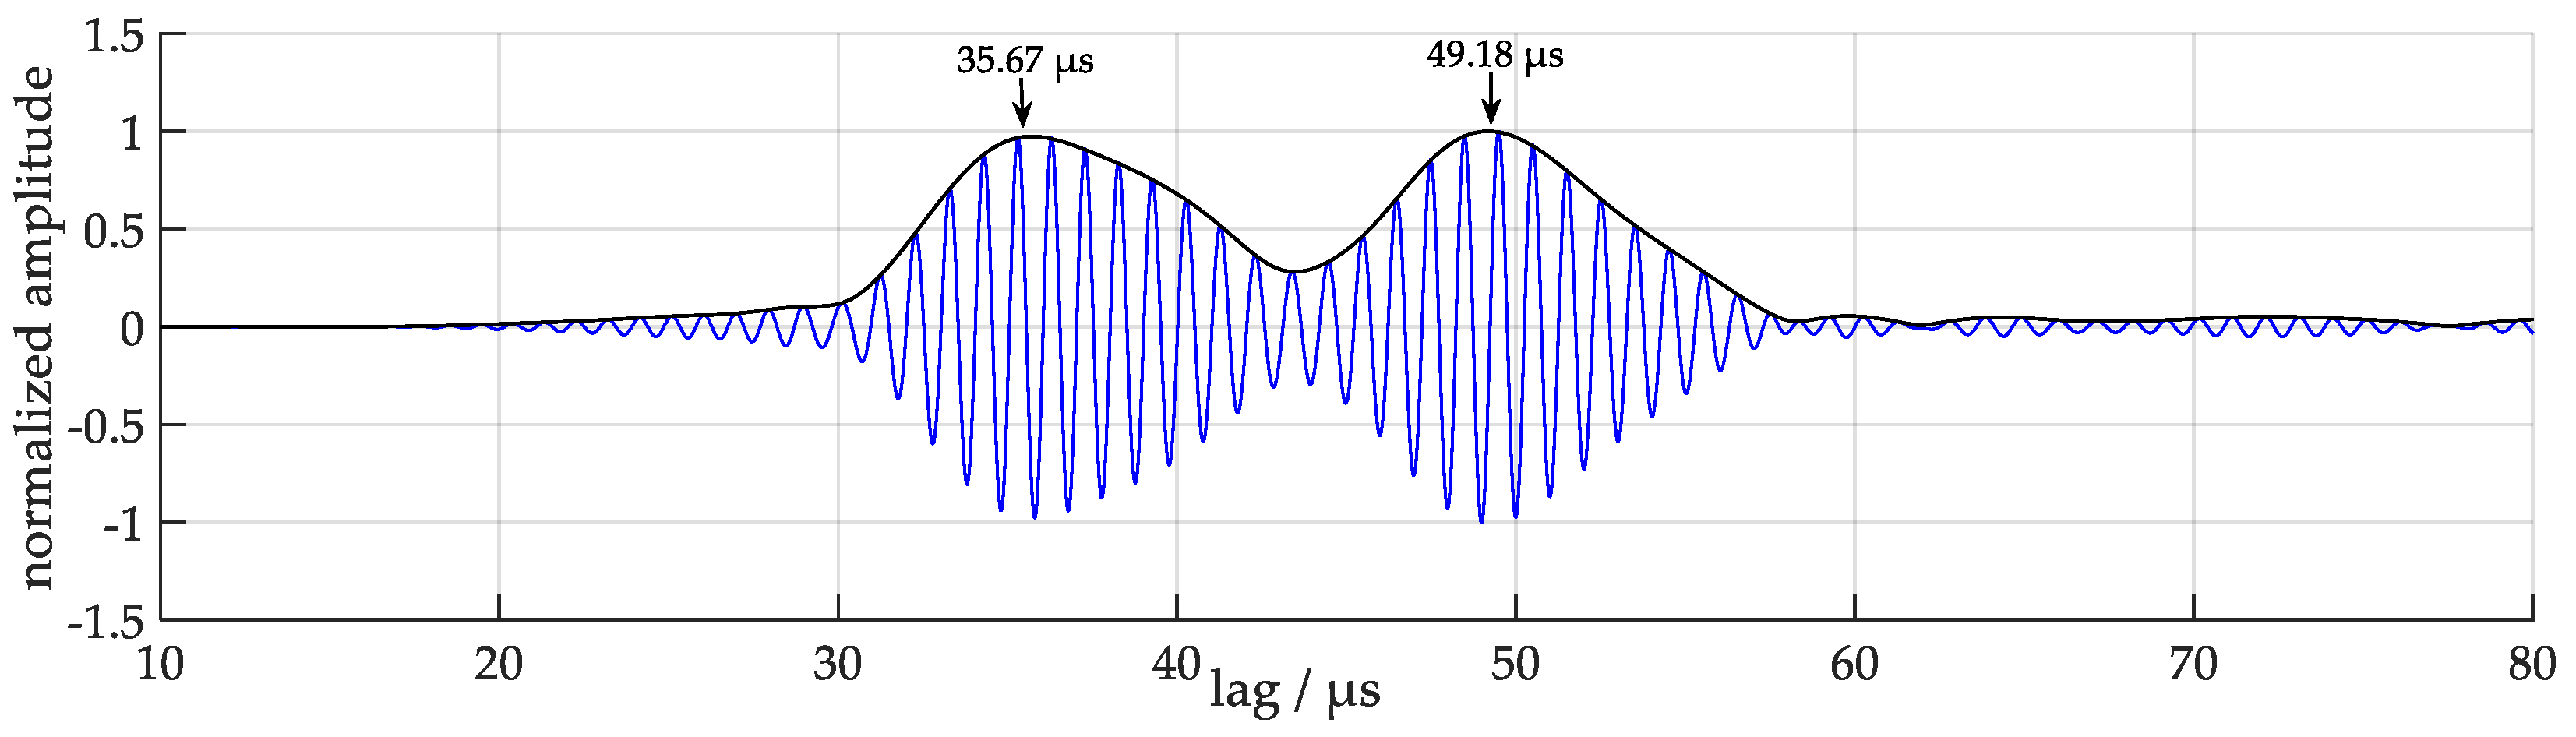
3.1.3. Analysis of Receiver Signals from Acoustic Wave Pulses Obtained at the Test Tube
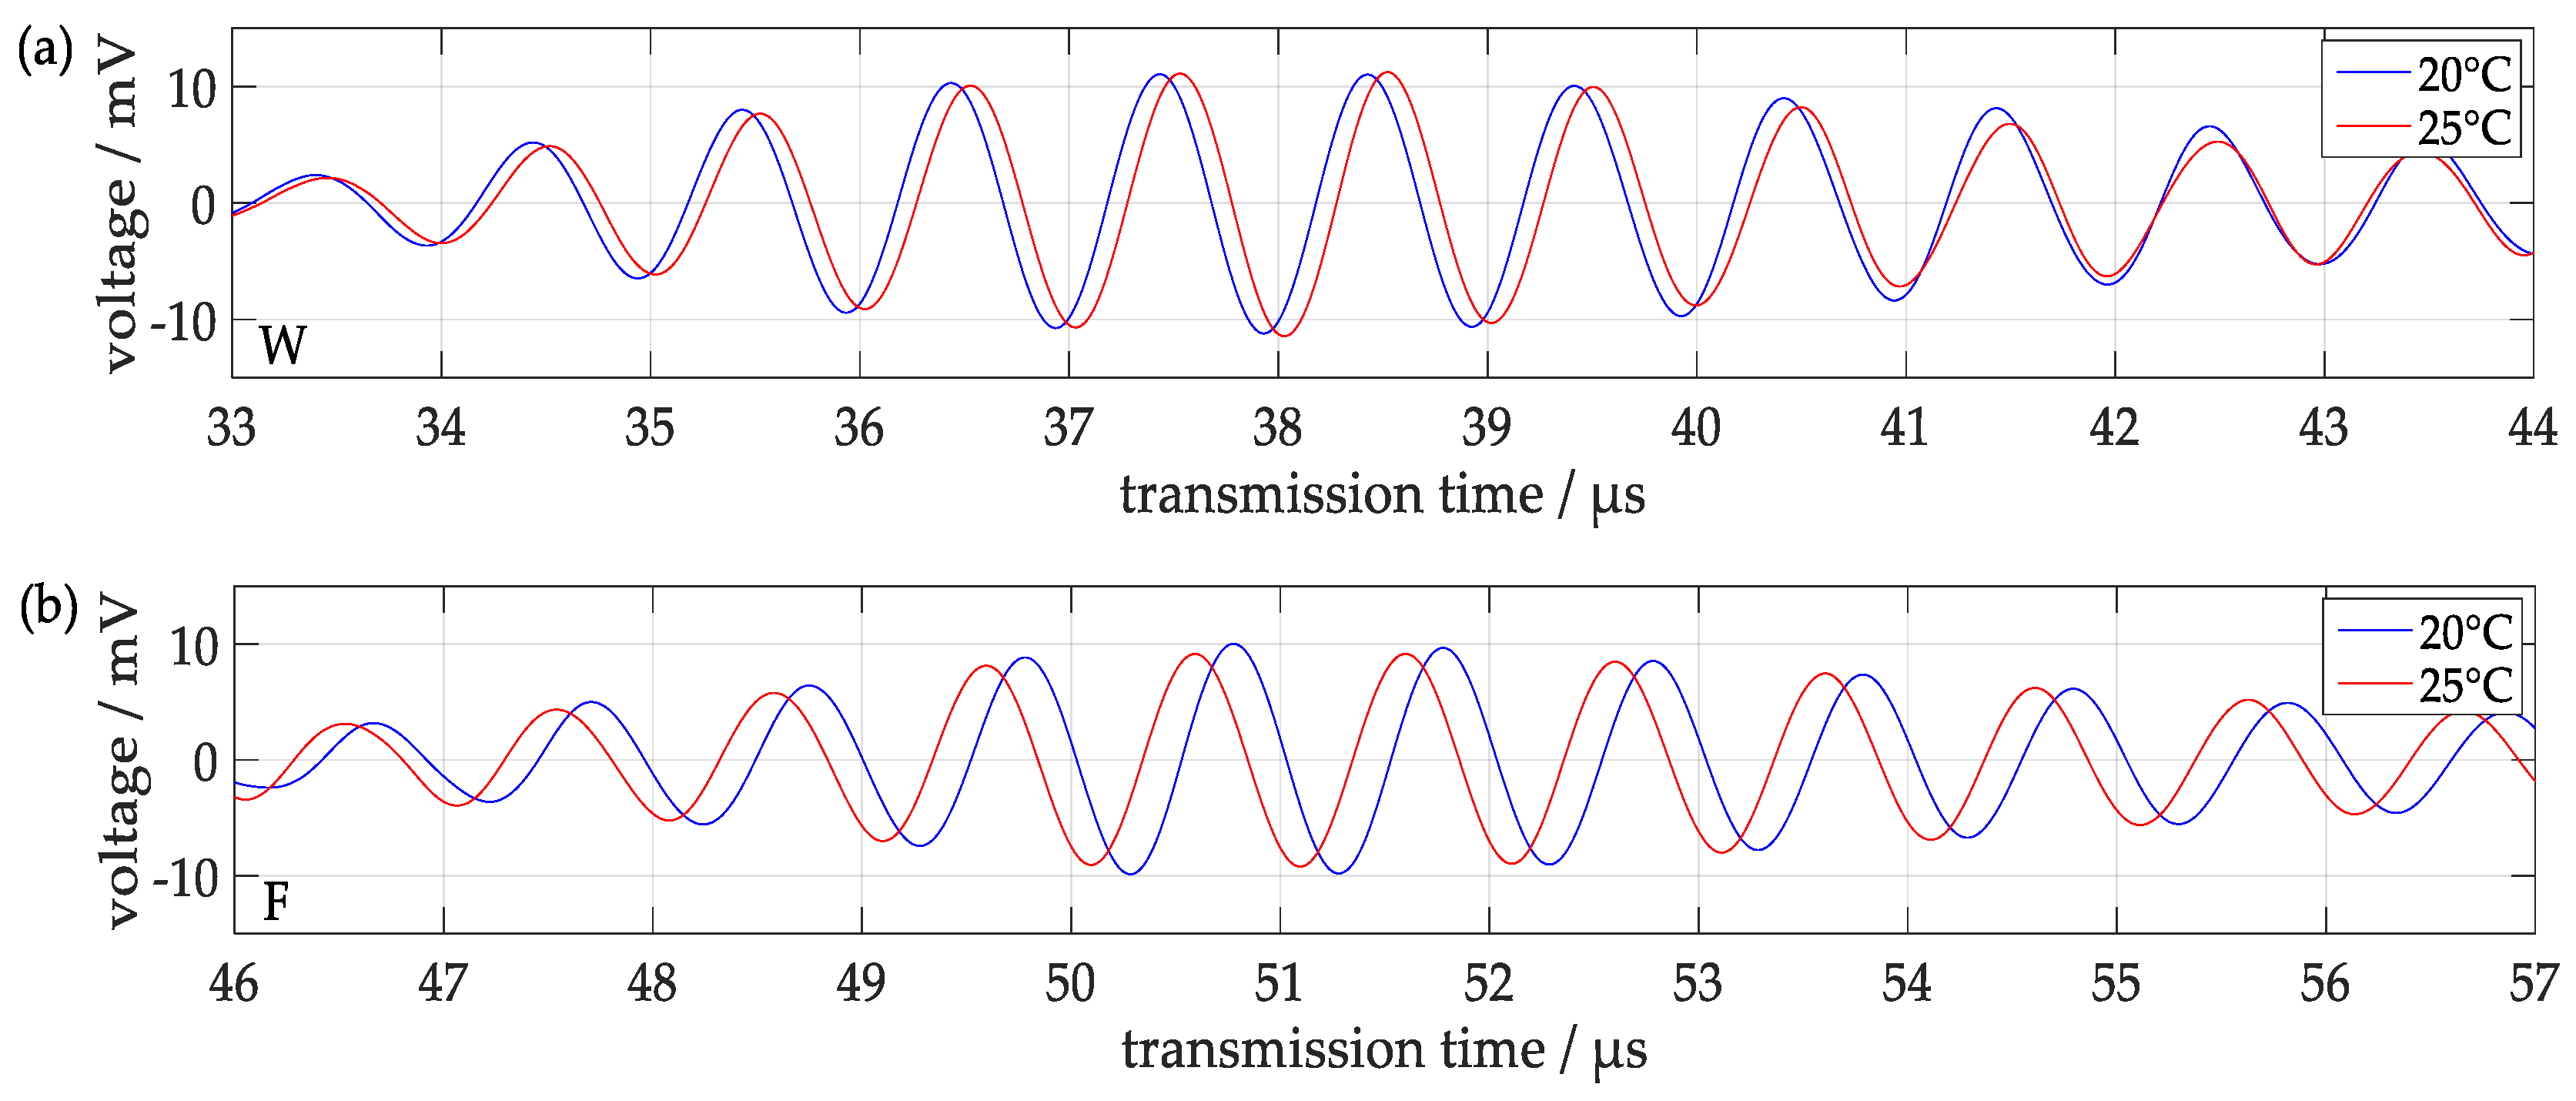
3.1.4. Influence of Temperature
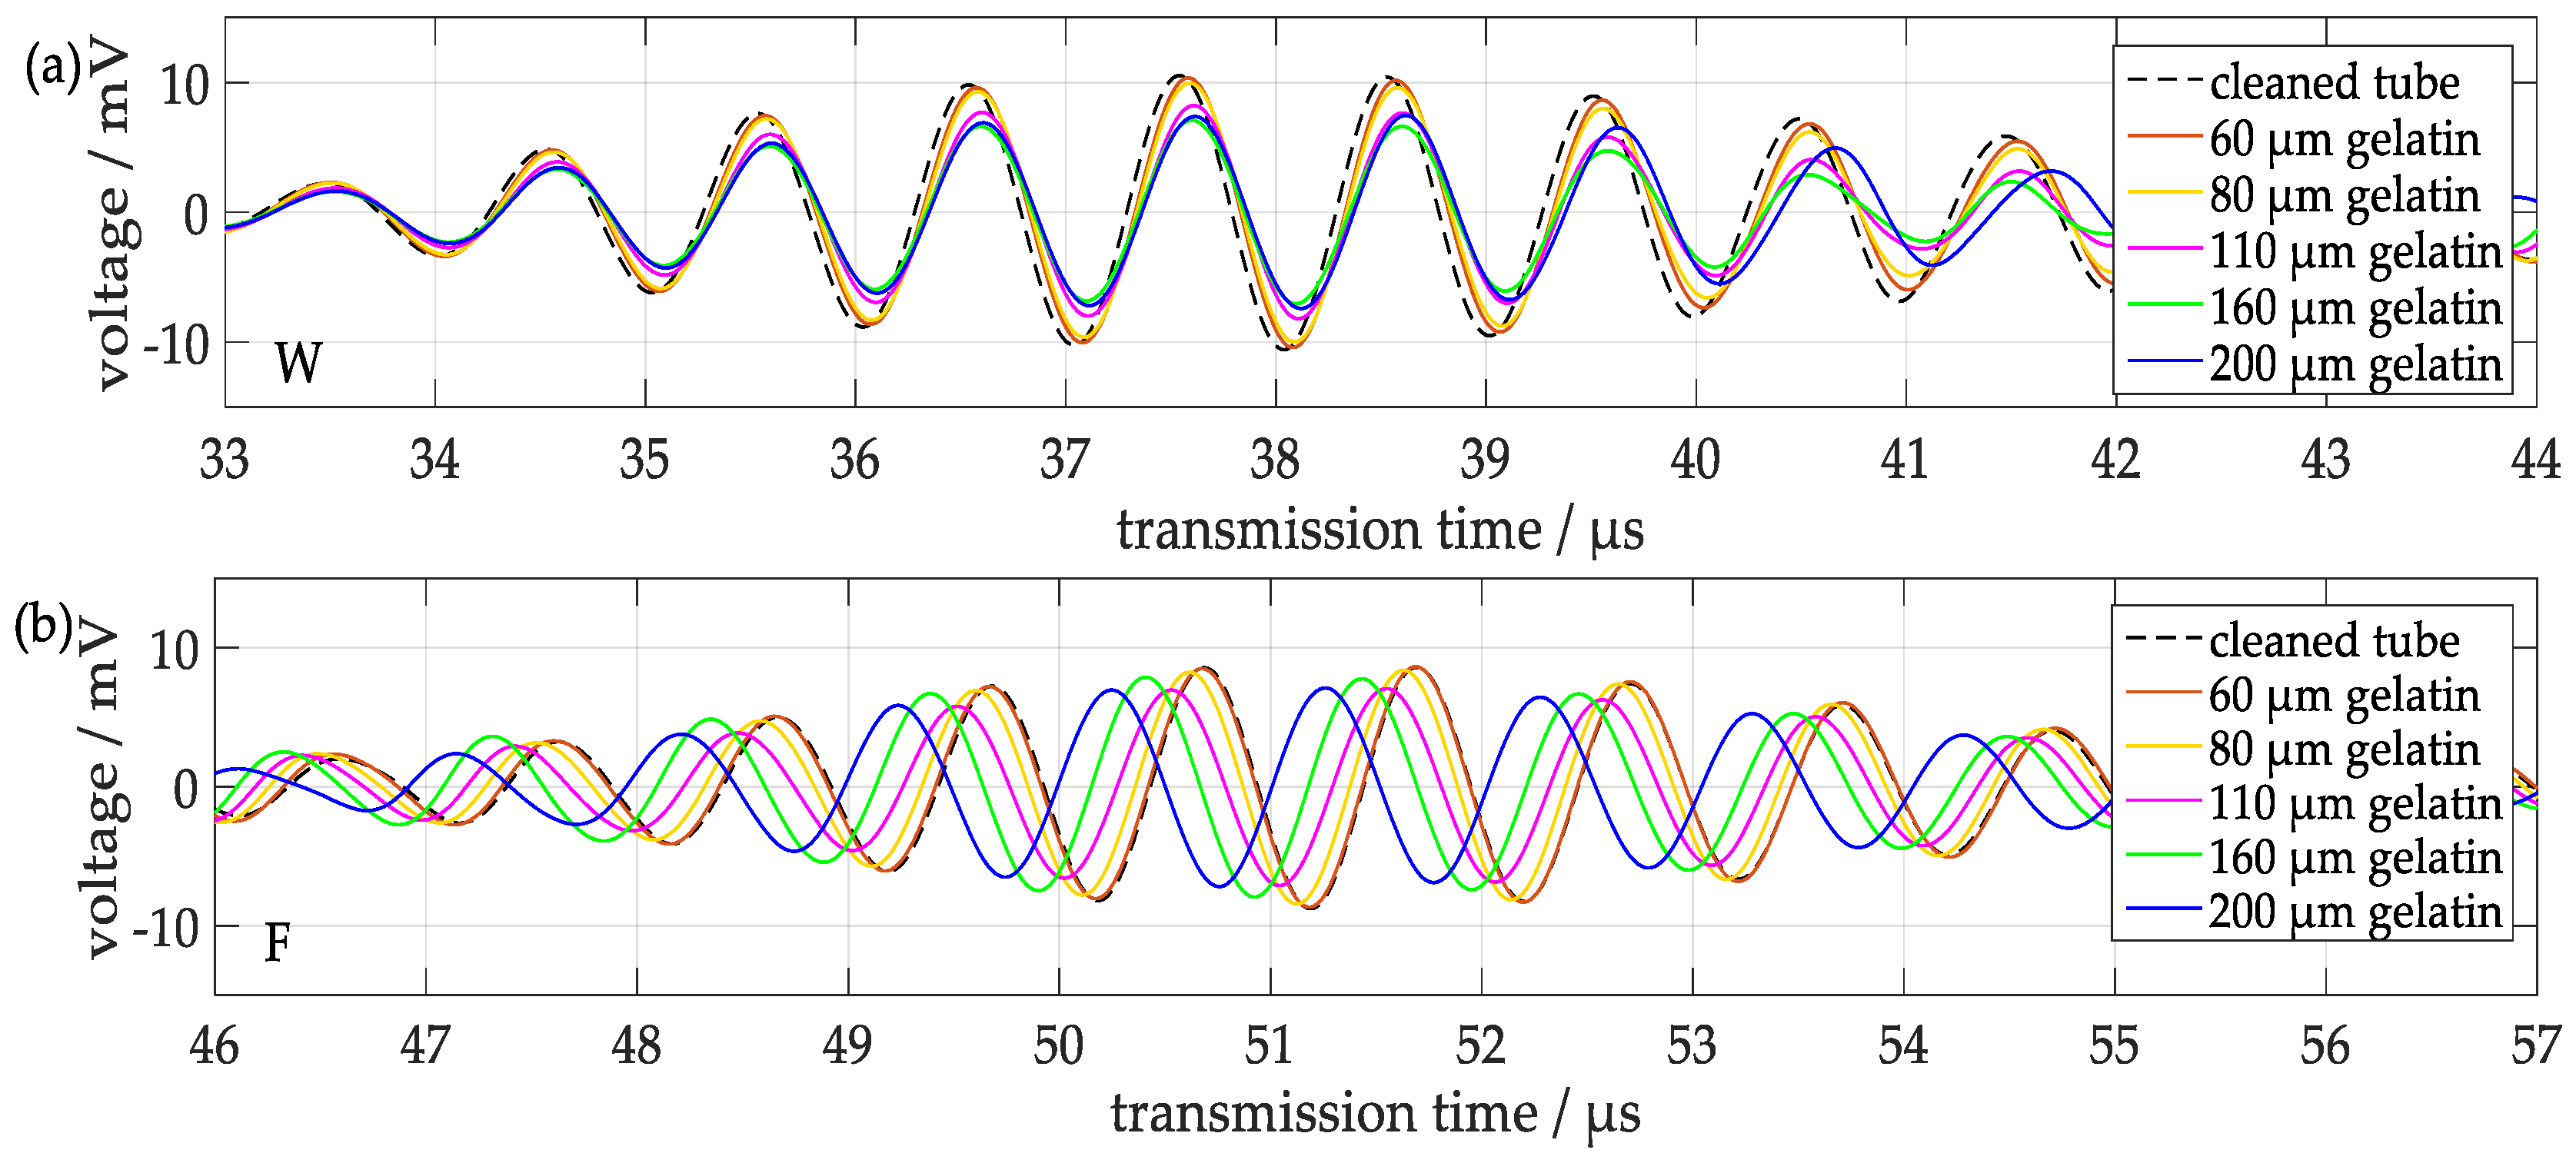
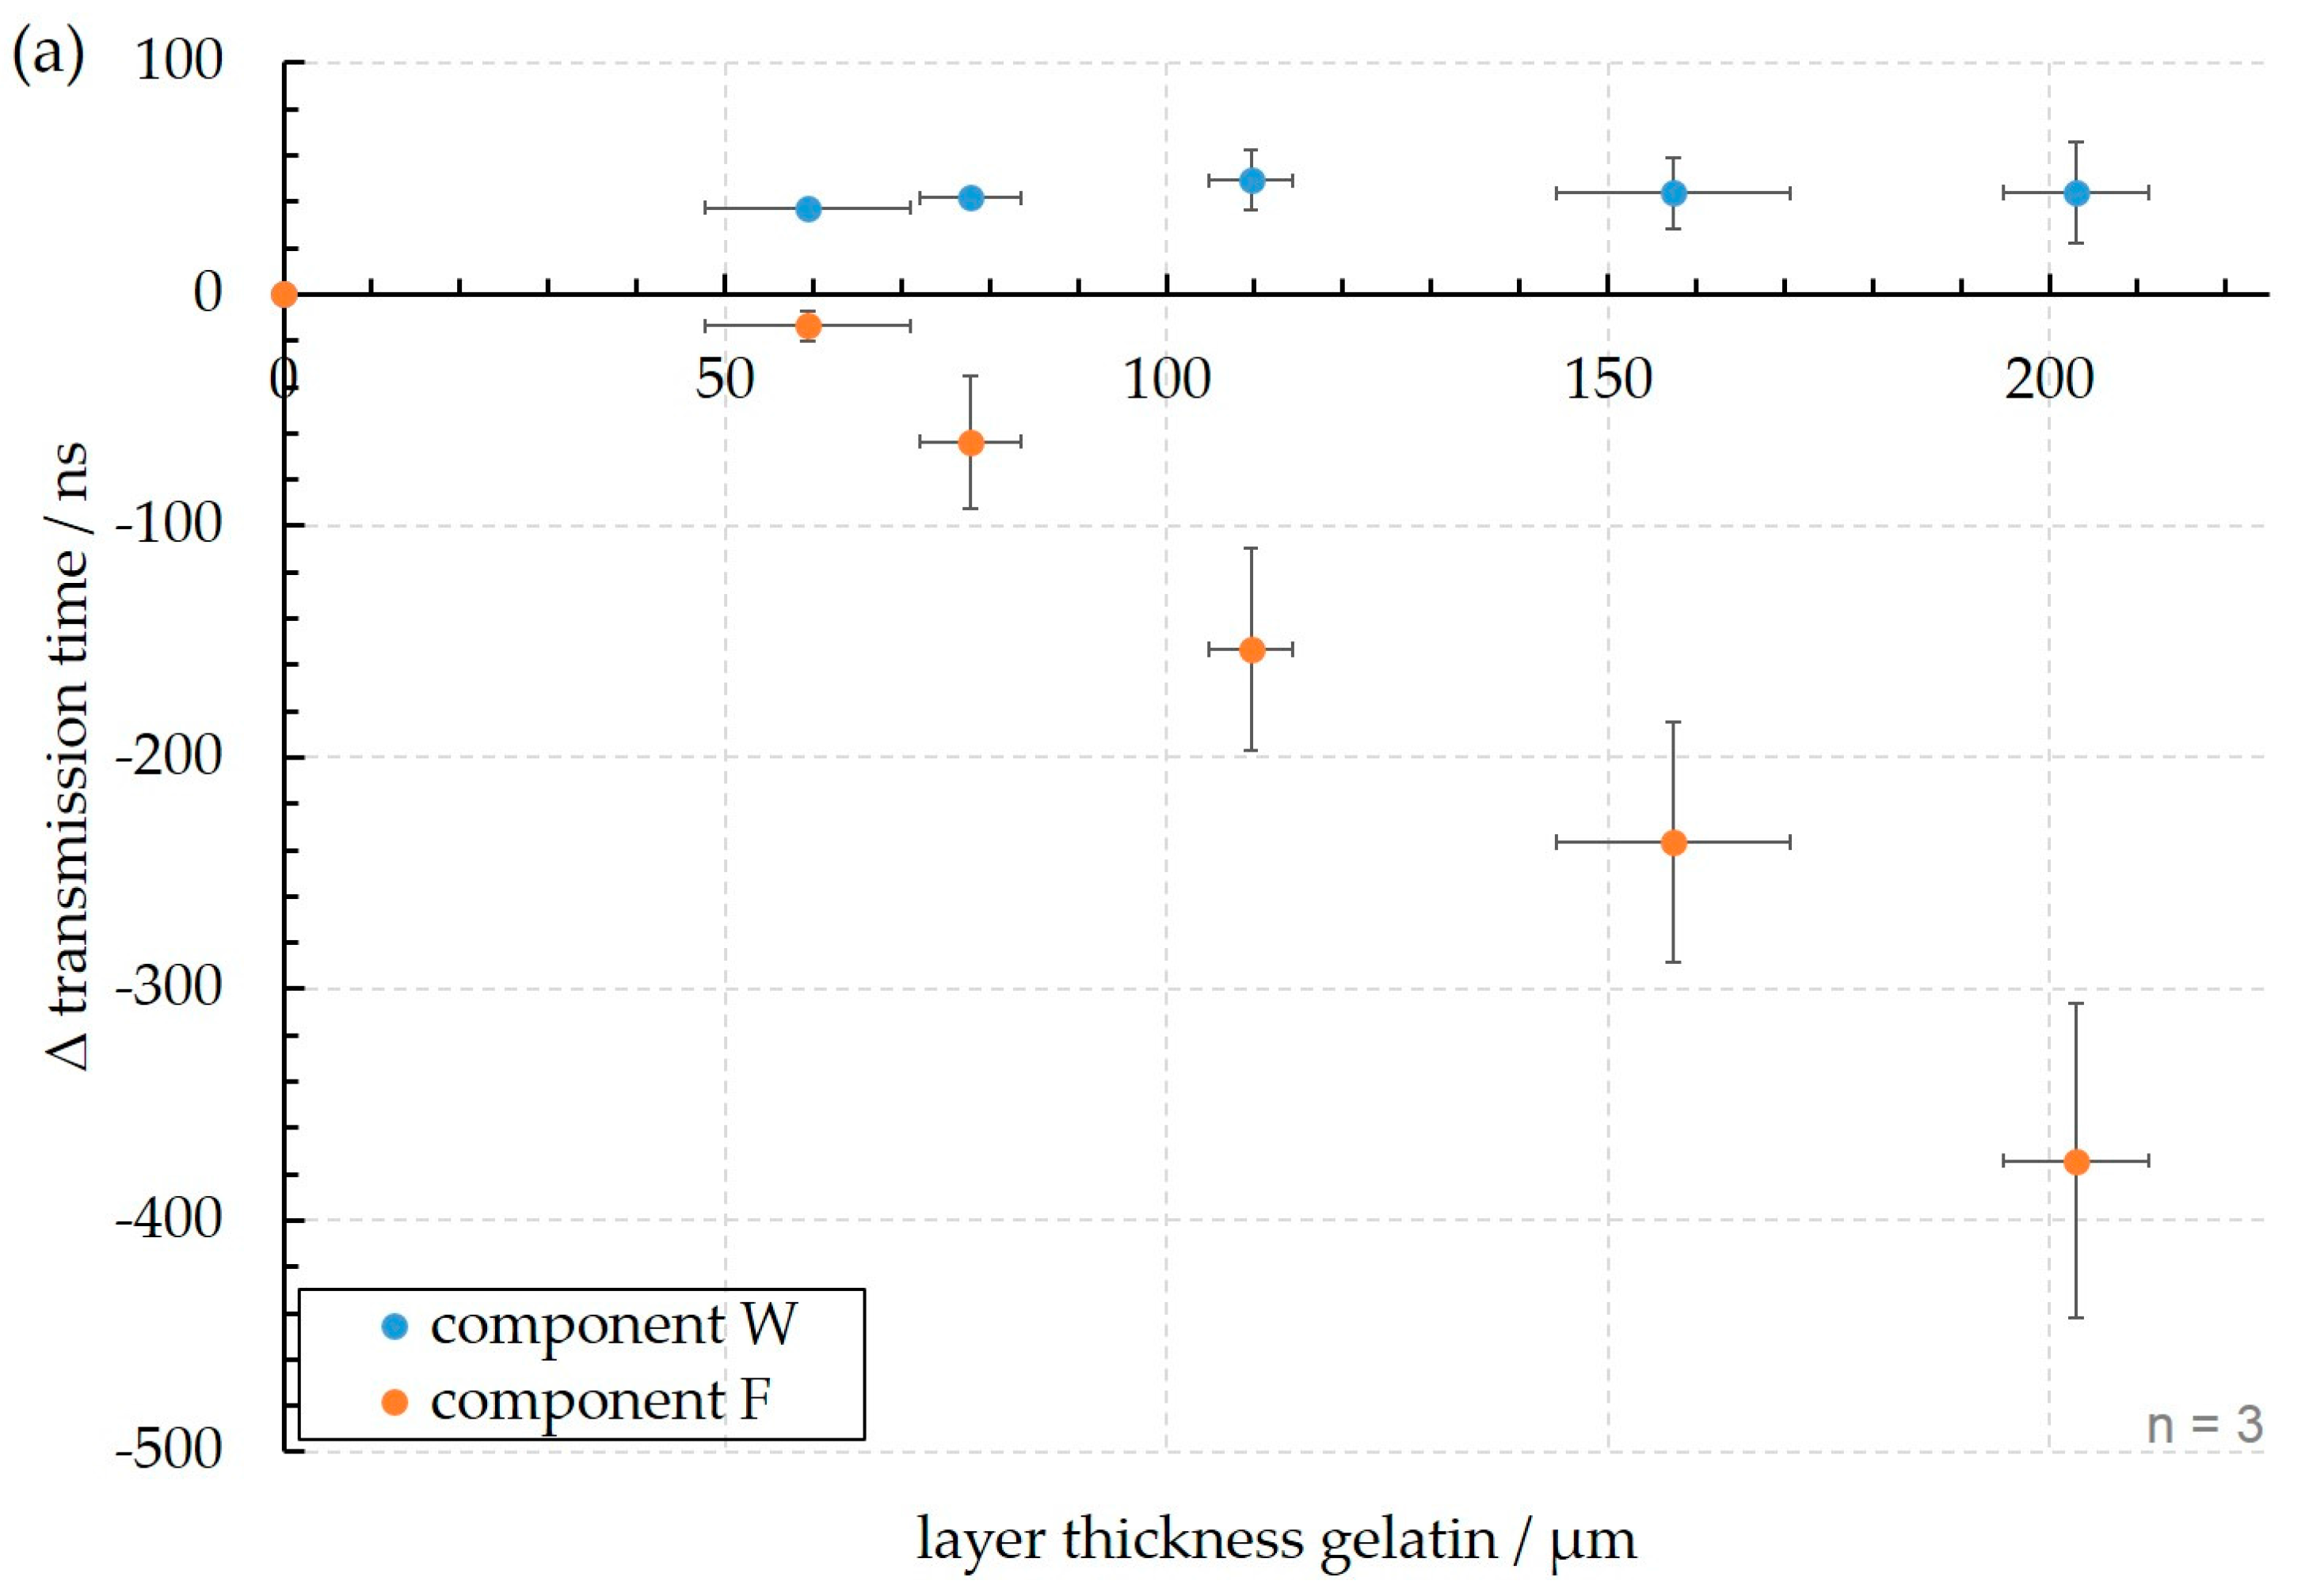
3.2. Influence of Gelatin Layers
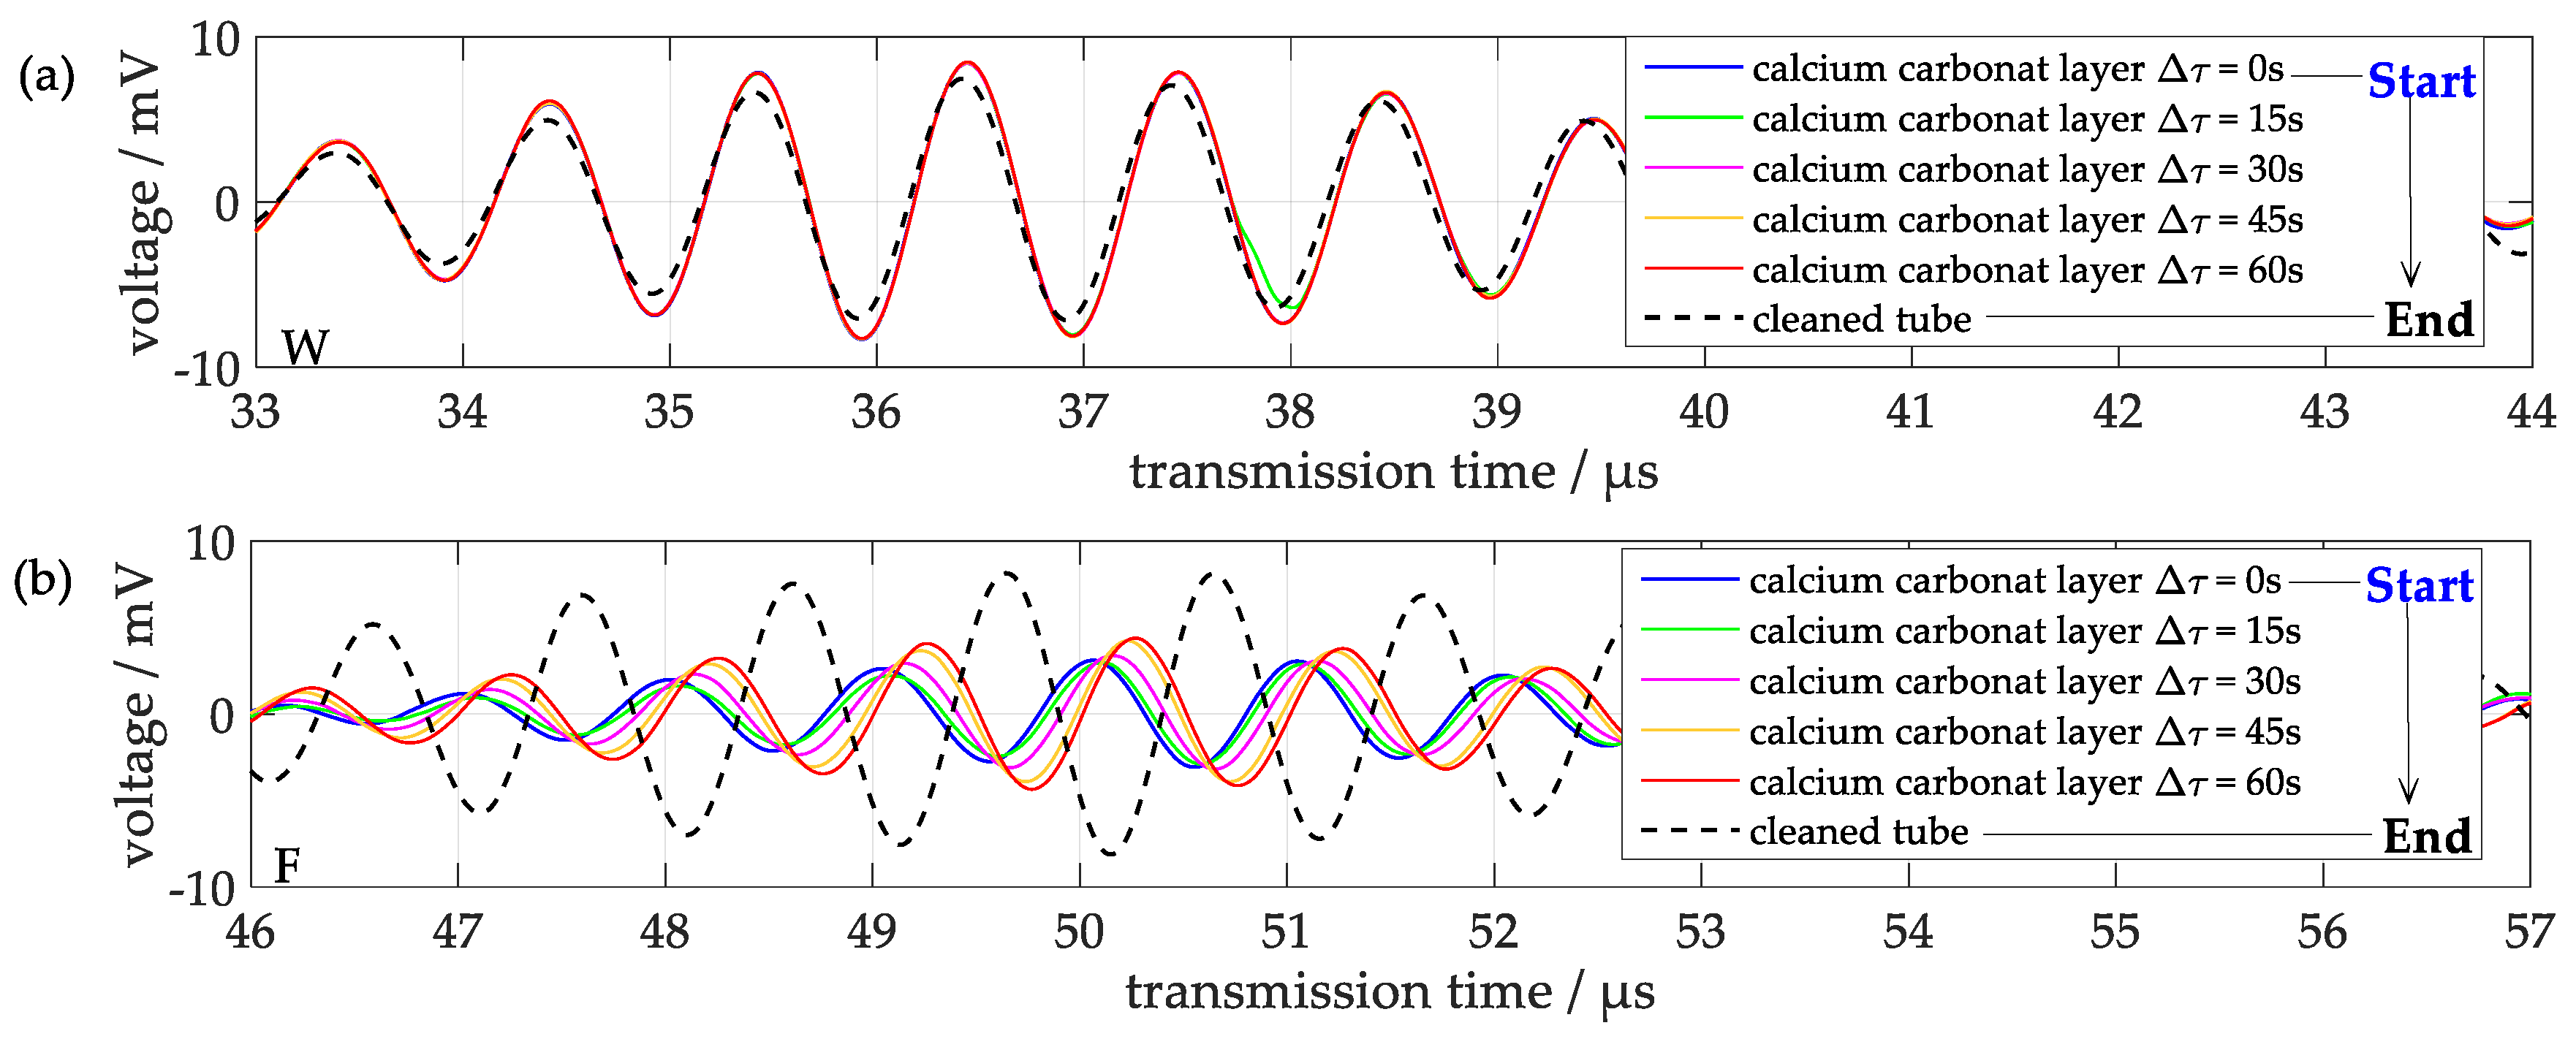
3.3. Influence of Other Deposition Layers
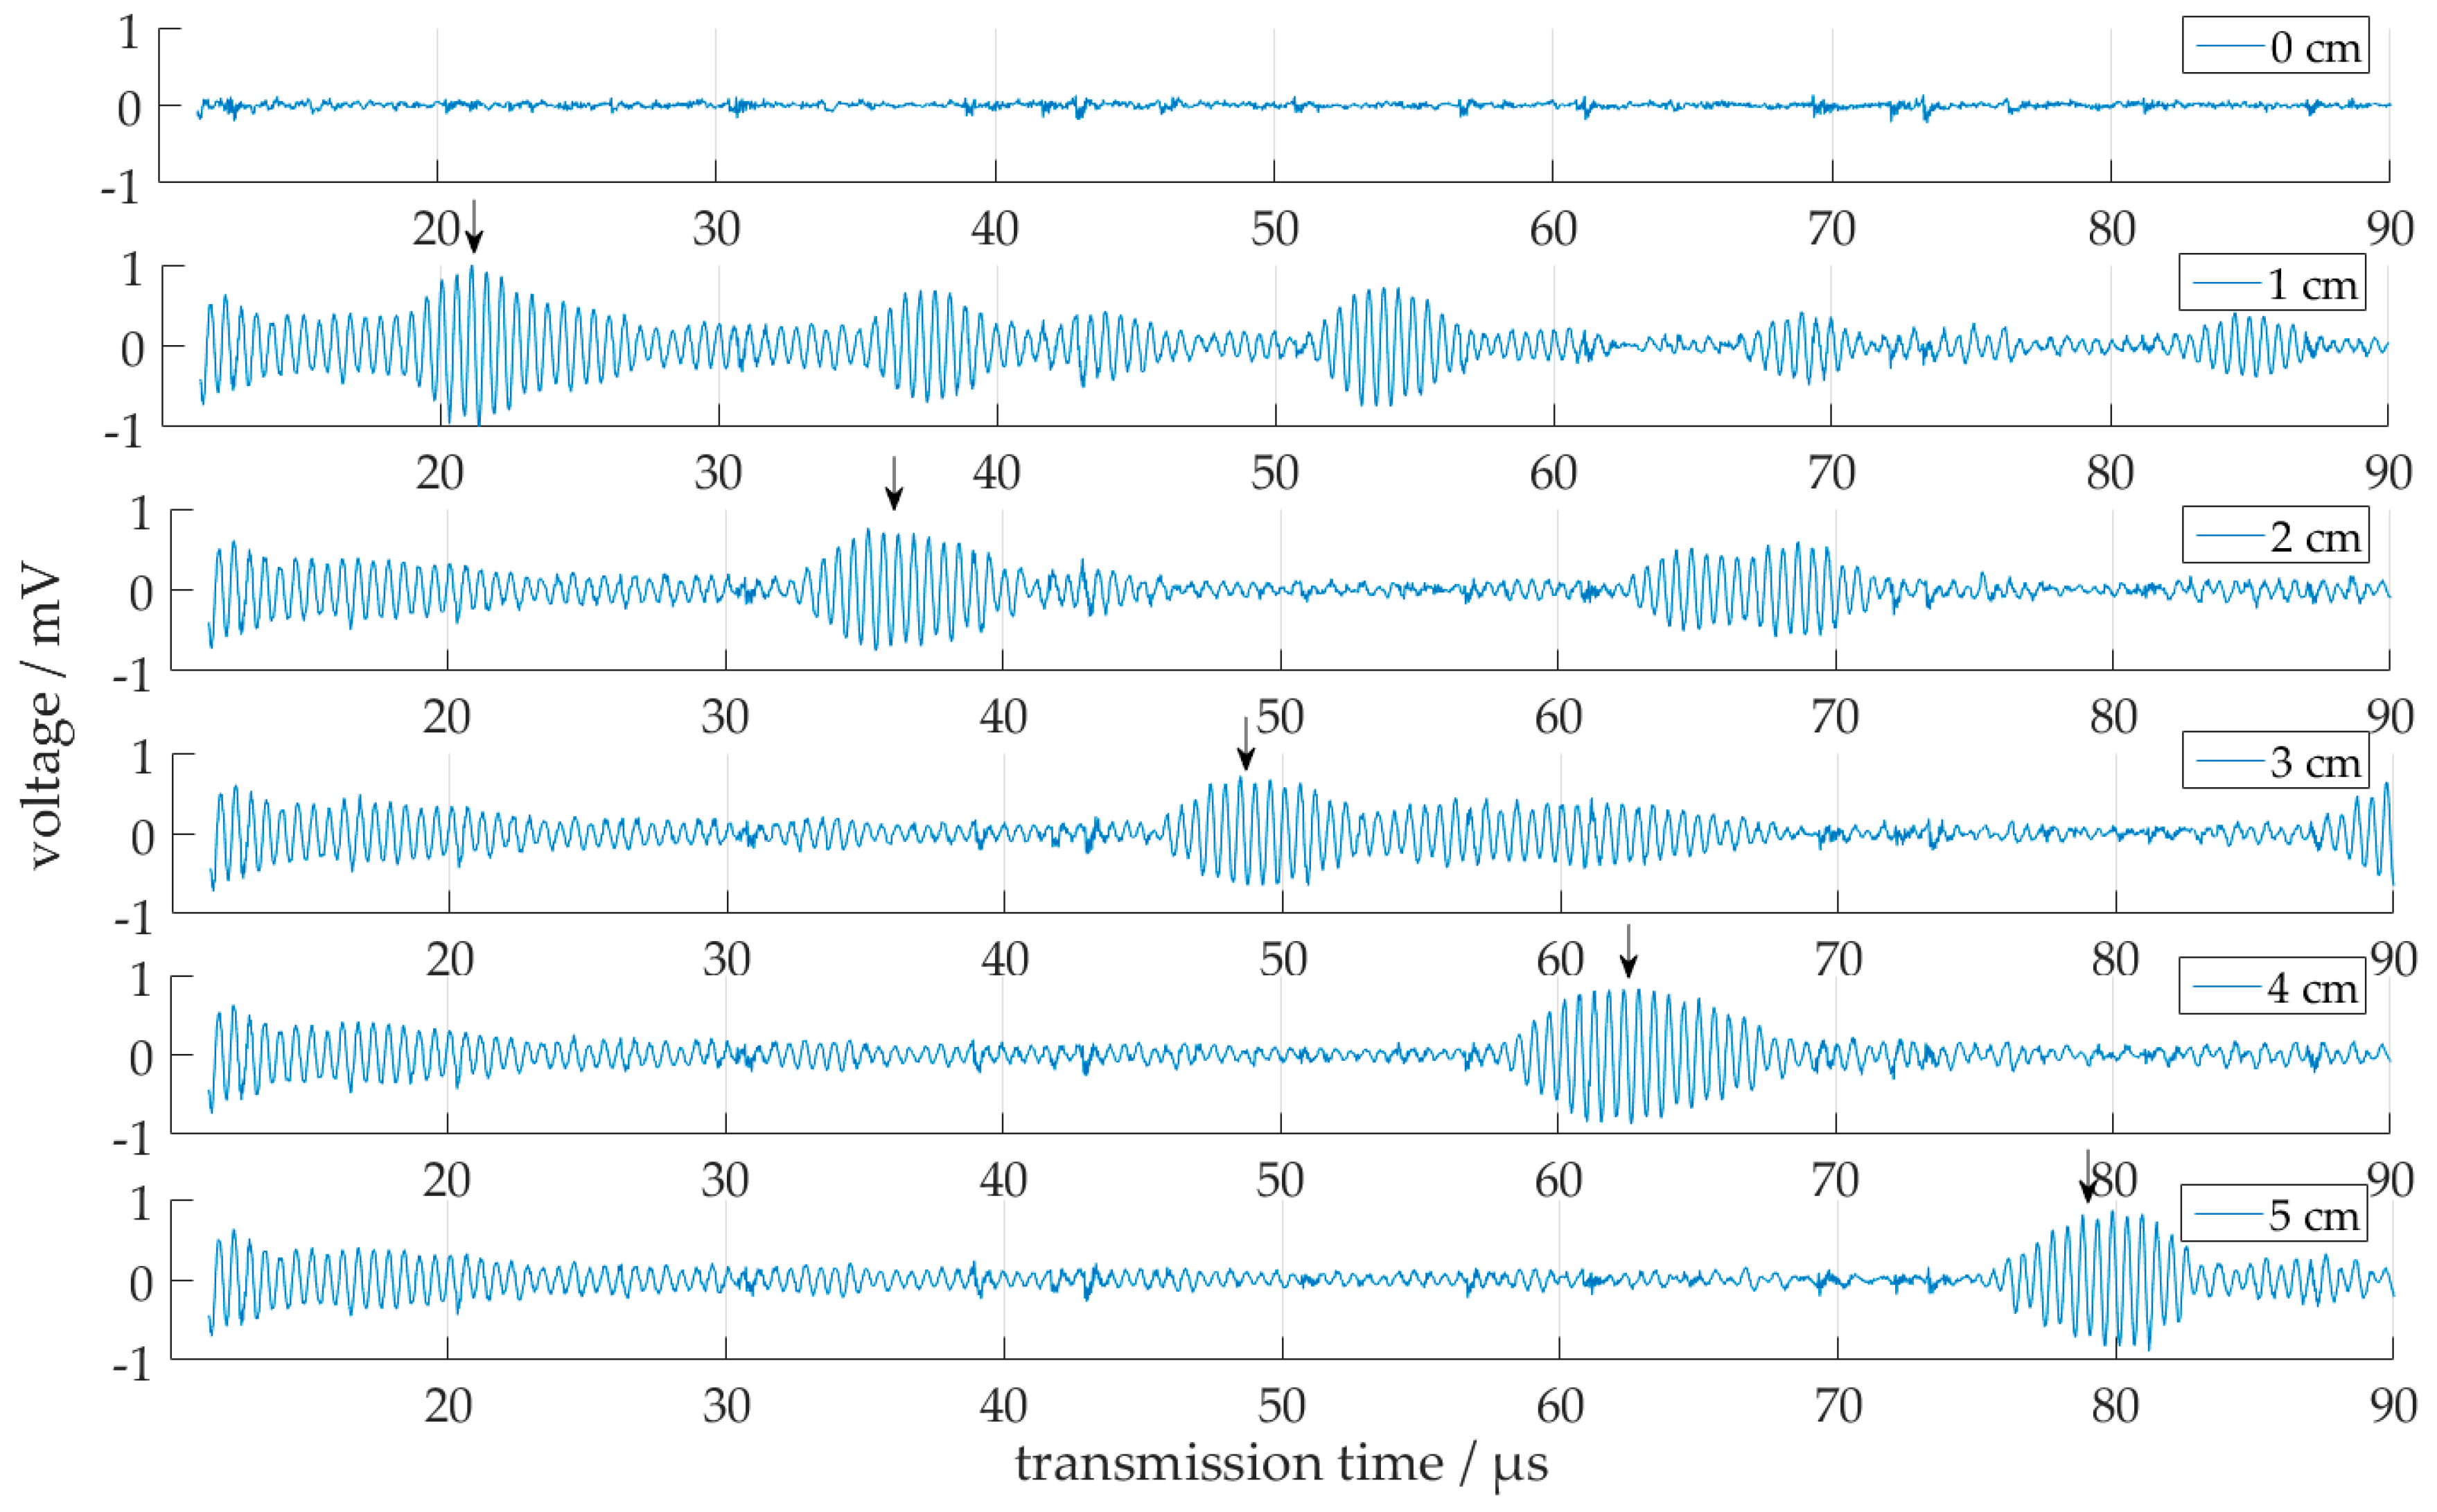
3.4. Influence of Filling Level in Horizontal Tubes
4. Discussion
4.1. Signal Changes Resulting from Gelatin Layers
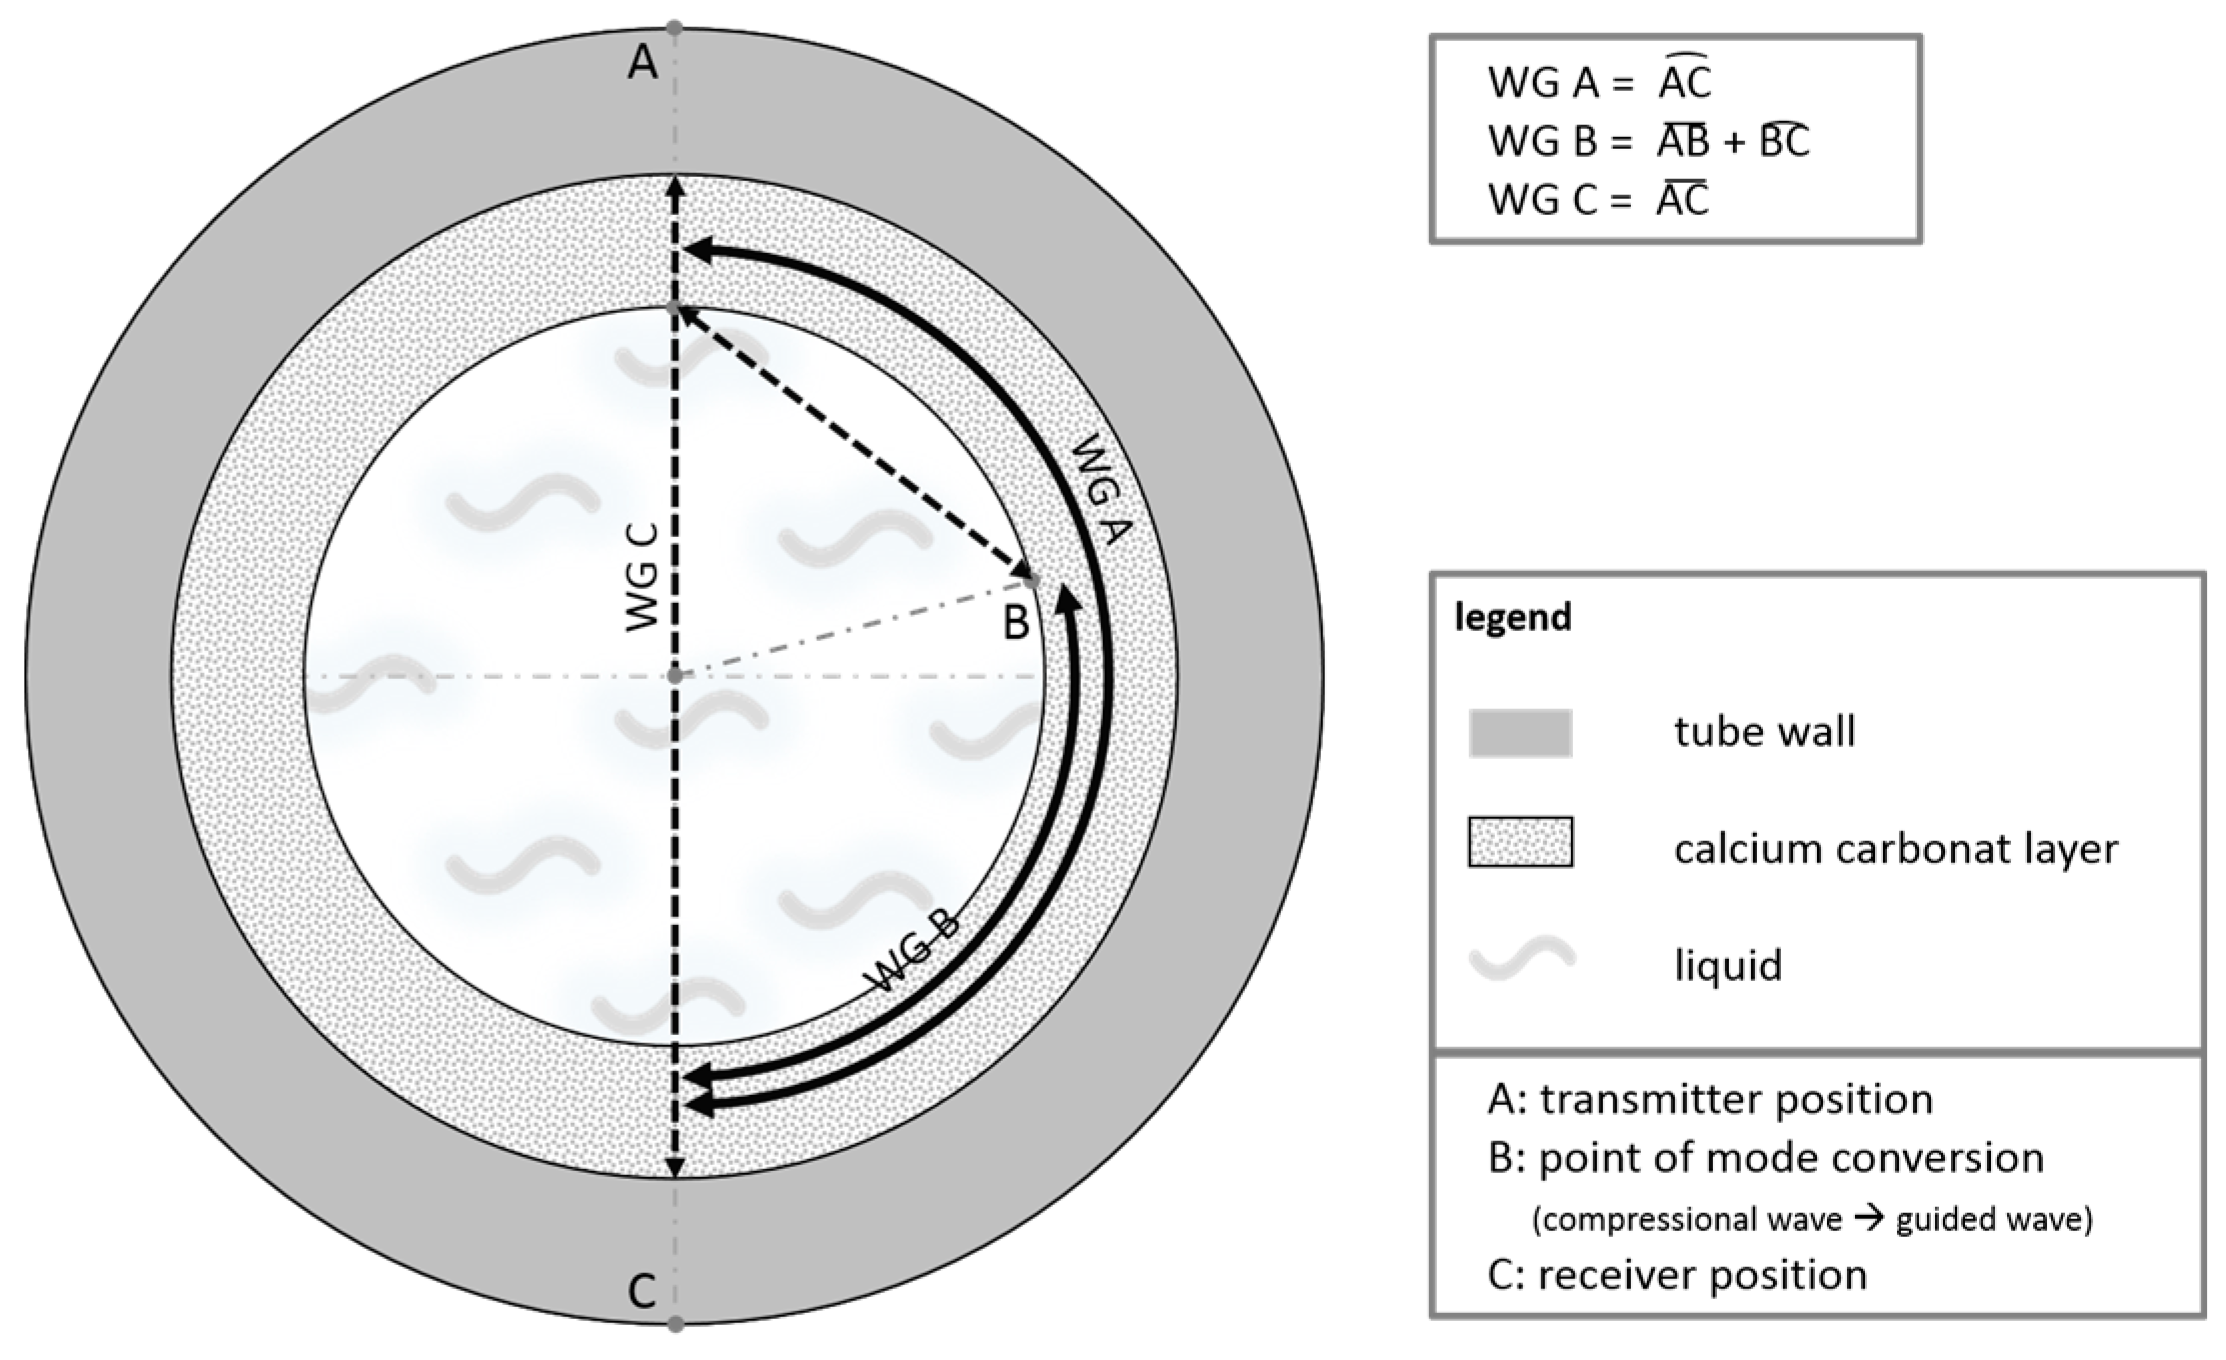
4.2. Signal Changes Resulting from Hard Deposition Layers
4.3. Filling Level Measurements in Horizontal Tubes
5. Conclusions
6. Patents
Acknowledgments
Author Contributions
Conflicts of Interest
References
- Blanco, M.A.; Negro, C.; Gaspar, I.; Tijero, J. Slime problems in the paper and board industry. Appl. Microbiol. Biotechnol. 1996, 46, 203–208. [Google Scholar] [CrossRef]
- Costerton, J.W.; Stewart, P.S.; Greenberg, E.P. Bacterial Biofilms: A Common Cause of Persistent Infections. Science 1999, 284, 1318–1322. [Google Scholar] [CrossRef] [PubMed]
- Withers, P.M. Ultrasonic, acoustic and optical techniques for the non-invasive detection of fouling in food processing equipment. Trends Food Sci. Technol. 1996, 7, 293–298. [Google Scholar] [CrossRef]
- Janknecht, P.; Melo, L.F. Online Biofilm Monitoring. Rev. Environ. Sci. Biotechnol. 2003, 2, 269–283. [Google Scholar] [CrossRef]
- Tan, S.Y.-E.; Chew, S.C.; Tan, S.Y.-Y.; Givskov, M.; Yang, L. Emerging frontiers in detection and control of bacterial biofilms. Curr. Opin. Biotechnol. 2014, 26, 1–6. [Google Scholar] [CrossRef] [PubMed]
- Mairal, A.P.; Greenberg, A.R.; Krantz, W.B.; Bond, L.J. Real-time measurement of inorganic fouling of RO desalination membranes using ultrasonic time-domain reflectometry. J. Membr. Sci. 1999, 159, 185–196. [Google Scholar] [CrossRef]
- Kujundzic, E.; Fonseca, C.A.; Evans, E.A.; Peterson, M.; Greenberg, A.R.; Hernandez, M. Ultrasonic monitoring of earlystage biofilm growth on polymeric surfaces. J. Microbiol. Methods 2007, 68, 458–467. [Google Scholar] [CrossRef] [PubMed]
- Kim, Y.W.; Sardari, S.E.; Iliadis, A.A.; Ghodssi, R. A bacterial biofilm Surface Acoustic Wave sensor for real time biofilm growth monitoring. IEEE Sens. 2010, 1568–1571. [Google Scholar] [CrossRef]
- Kim, Y.W.; Sardari, S.E.; Meyer, M.T.; Iliadis, A.A.; Wu, H.C.; Bentley, W.E.; Ghodssi, R. An ALD aluminum oxide passivated Surface Acoustic Wave sensor for early biofilm detection. Sens. Actuators B Chem. 2012, 163, 136–145. [Google Scholar] [CrossRef]
- Lohr, K.R.; Rose, J.L. Ultrasonic guided wave and acoustic impact methods for pipe fouling detection. J. Food Eng. 2003, 56, 315–324. [Google Scholar] [CrossRef]
- Barshinger, J.N.; Rose, J.L. Guided wave propagation in an elastic hollow cylinder coated with a viscoelastic material. IEEE Trans. Ultrason. Ferroelectr. Freq. Control 2004, 51, 1547–1556. [Google Scholar] [CrossRef] [PubMed]
- Lindner, G.; Schmitt, M.; Schmidt, K.; Faustmann, H.; Krempel, S.; Schubert, J. Detection of coatings and measurement of coating thickness on technical substrates using surface acoustic waves in a waveguide configuration. In Proceedings of the SENSOR+TEST Conferences, Congress Center, Nürnberg, Germany, 26–28 May 2009; pp. 35–40. [Google Scholar] [CrossRef]
- Schmitt, M.; Schmidt, K.; Olfert, S.; Rautenberg, J.; Lindner, G.; Henning, B.; Reindl, L.M. Detection of coatings within liquid-filled tubes and containers by mode conversion of leaky Lamb waves. J. Sens. Sens. Syst. 2013, 2, 73–84. [Google Scholar] [CrossRef]
- Coburg University of Applied Sciences and Arts. Method for Investigating a Structure and Structure for Receiving and/or Conducting a Liquid or Soft Medium. U.S. Patent 8661904 B2, 4 March 2014. EP 2335062 B1, 14 December 2016; ZL 200980137101.0, 20 June 2017. [Google Scholar]
- Chimenti, D.E. Leaky Rayleigh waves on a layered halfspace. J. Appl. Phys. 1982, 53, 170–176. [Google Scholar] [CrossRef]
- Deighton, M.O.; Gillespie, A.B.; Pike, R.B.; Watkins, R. Mode conversion of Rayleigh and Lamb waves to compression waves at a metal-liquid interface. Ultrasonics 1981, 19, 249–258. [Google Scholar] [CrossRef]
- Rose, J.L. Ultrasonic Guided Waves in Solid Media; Cambridge University Press: New York, NY, USA, 2014; ISBN 978-1-107-04895-9. [Google Scholar]
- Liang, W.; Lindner, G. Investigations of droplet movement excited by Lamb waves on a non-piezoelectric substrate. J. Appl. Phys. 2013, 114, 44501. [Google Scholar] [CrossRef]
- Qu, J.; Berthelot, Y.; Li, Z. Dispersion of Guided Circumferential Waves in a Circular Annulus. In Rview of Progress in Quantitative Nondestrutive Evaluation; Thompson, D.O., Chimenti, D.E., Eds.; Springer: Boston, MA, USA, 1996; pp. 169–176. [Google Scholar] [CrossRef]
- Liu, G.; Qu, J. Guided Circumferential Waves in a Circular Annulus. J. Appl. Mech. 1998, 65, 424–430. [Google Scholar] [CrossRef]
- Towfighi, S.; Kundu, T.; Ehsani, M. Elastic Wave Propagation in Circumferential Direction in Anisotropic Cylindrical Curved Plates. J. Appl. Mech. 2002, 69, 283. [Google Scholar] [CrossRef]
- Choi, M.S.; Yang, M.S.; Kim, H.C. Detection of leak-defective fuel rods using the circumferential Lamb waves excited by the resonance backscattering of ultrasonic pulses. Ultrasonics 1992, 30, 221–223. [Google Scholar] [CrossRef]
- Cheeke, J.; Shannon, K.; Wang, Z. Loading effects on A0 Lamb-like waves in full and partially filled thin-walled tubes. Sens. Actuators B Chem. 1999, 59, 180–183. [Google Scholar] [CrossRef]
- Bilaniuk, N.; Wong, G.S.K. Speed of sound in pure water as a function of temperature. J. Acoust. Soc. Am. 1993, 93, 1609–1612. [Google Scholar] [CrossRef]
- Lobkis, O.; Larsen, C.; Roth, R., II. Separation of applied stress and temperature effects on ultrasonic guided wave phase. AIP Conf. Proc. 2015, 1650, 211–220. [Google Scholar] [CrossRef]
- Simonetti, F. Lamb wave propagation in elastic plates coated with viscoelastic materials. J. Acoust. Soc. Am 2004, 115, 2041. [Google Scholar] [CrossRef]
- Simonetti, F.; Cawley, P. On the nature of shear horizontal wave propagation in elastic plates coated with viscoelastic materials. Proc. R. Soc. A Math. Phys. Eng. Sci. 2004, 460, 2197–2221. [Google Scholar] [CrossRef]
- Costello, B.J.; Wenzel, S.; Wang, A.; White, R. Gel-coated Lamb wave sensors: Ultrasonics Symposium. In Proceedings of the IEEE Ultrasonics Symposium, Honolulu, HI, USA, 4–7 December 1990; pp. 279–283. [Google Scholar] [CrossRef]
- Vellekoop, M.J. Acoustic wave sensors and their technology. Ultrasonics 1998, 36, 7–14. [Google Scholar] [CrossRef]
- Parker, N.G.; Povey, M. Ultrasonic study of the gelation of gelatin: Phase diagram, hysteresis and kinetics. Food Hydrocoll. 2012, 26, 99–107. [Google Scholar] [CrossRef]
- Lynnworth, L.C. Ultrasonic Measurement for Process Control; Academic Press: Boston, MA, USA, 1989; ISBN 978-0124605855. [Google Scholar]
- Coburg University of Applied Sciences and Arts. Device and Method for Detecting Deposition Layers in a Conduit Conducting a Liquid or a Soft Medium and/or for Level Detection. EP 17202318.6, 17 November 2017. application submitted. [Google Scholar]


© 2018 by the authors. Licensee MDPI, Basel, Switzerland. This article is an open access article distributed under the terms and conditions of the Creative Commons Attribution (CC BY) license (http://creativecommons.org/licenses/by/4.0/).
Share and Cite
Tietze, S.; Singer, F.; Lasota, S.; Ebert, S.; Landskron, J.; Schwuchow, K.; Drese, K.S.; Lindner, G. Monitoring of Soft Deposition Layers in Liquid-Filled Tubes with Guided Acoustic Waves Excited by Clamp-on Transducers. Sensors 2018, 18, 526. https://doi.org/10.3390/s18020526
Tietze S, Singer F, Lasota S, Ebert S, Landskron J, Schwuchow K, Drese KS, Lindner G. Monitoring of Soft Deposition Layers in Liquid-Filled Tubes with Guided Acoustic Waves Excited by Clamp-on Transducers. Sensors. 2018; 18(2):526. https://doi.org/10.3390/s18020526
Chicago/Turabian StyleTietze, Sabrina, Ferdinand Singer, Sandra Lasota, Sandra Ebert, Johannes Landskron, Katrin Schwuchow, Klaus Stefan Drese, and Gerhard Lindner. 2018. "Monitoring of Soft Deposition Layers in Liquid-Filled Tubes with Guided Acoustic Waves Excited by Clamp-on Transducers" Sensors 18, no. 2: 526. https://doi.org/10.3390/s18020526
APA StyleTietze, S., Singer, F., Lasota, S., Ebert, S., Landskron, J., Schwuchow, K., Drese, K. S., & Lindner, G. (2018). Monitoring of Soft Deposition Layers in Liquid-Filled Tubes with Guided Acoustic Waves Excited by Clamp-on Transducers. Sensors, 18(2), 526. https://doi.org/10.3390/s18020526