The Use of Tactile Sensors and PIV Analysis for Understanding the Bearing Mechanism of Pile Groups


Abstract
:1. Introduction
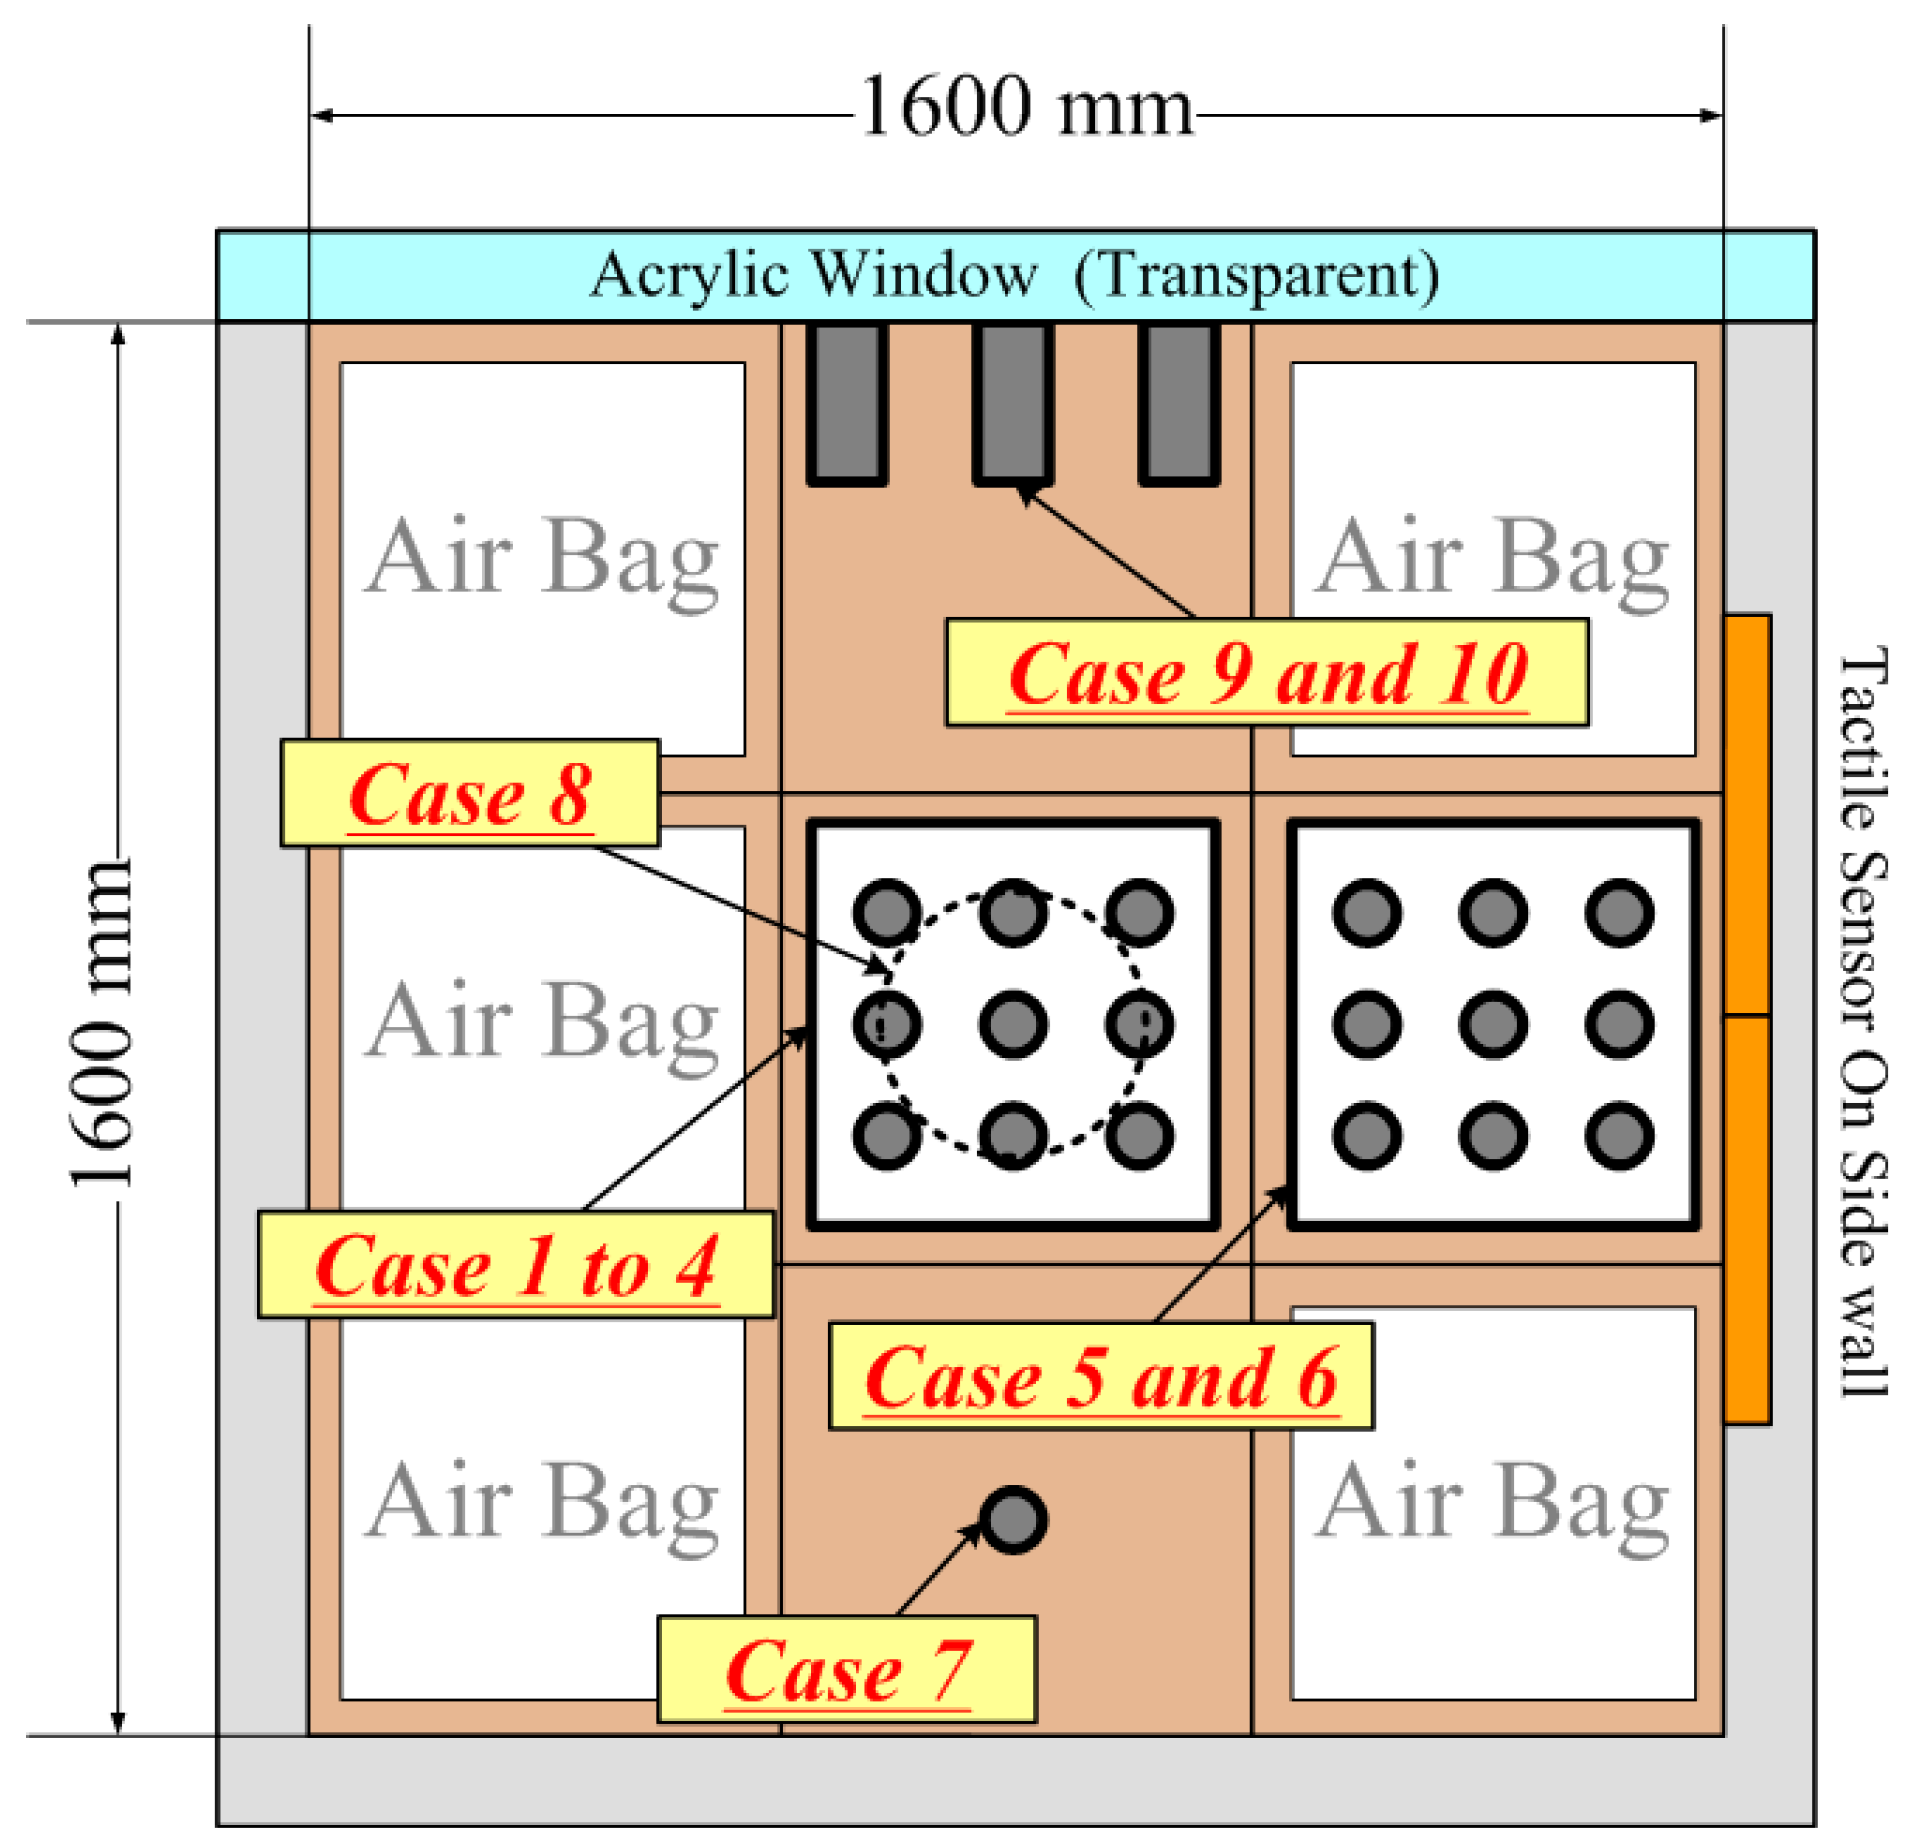
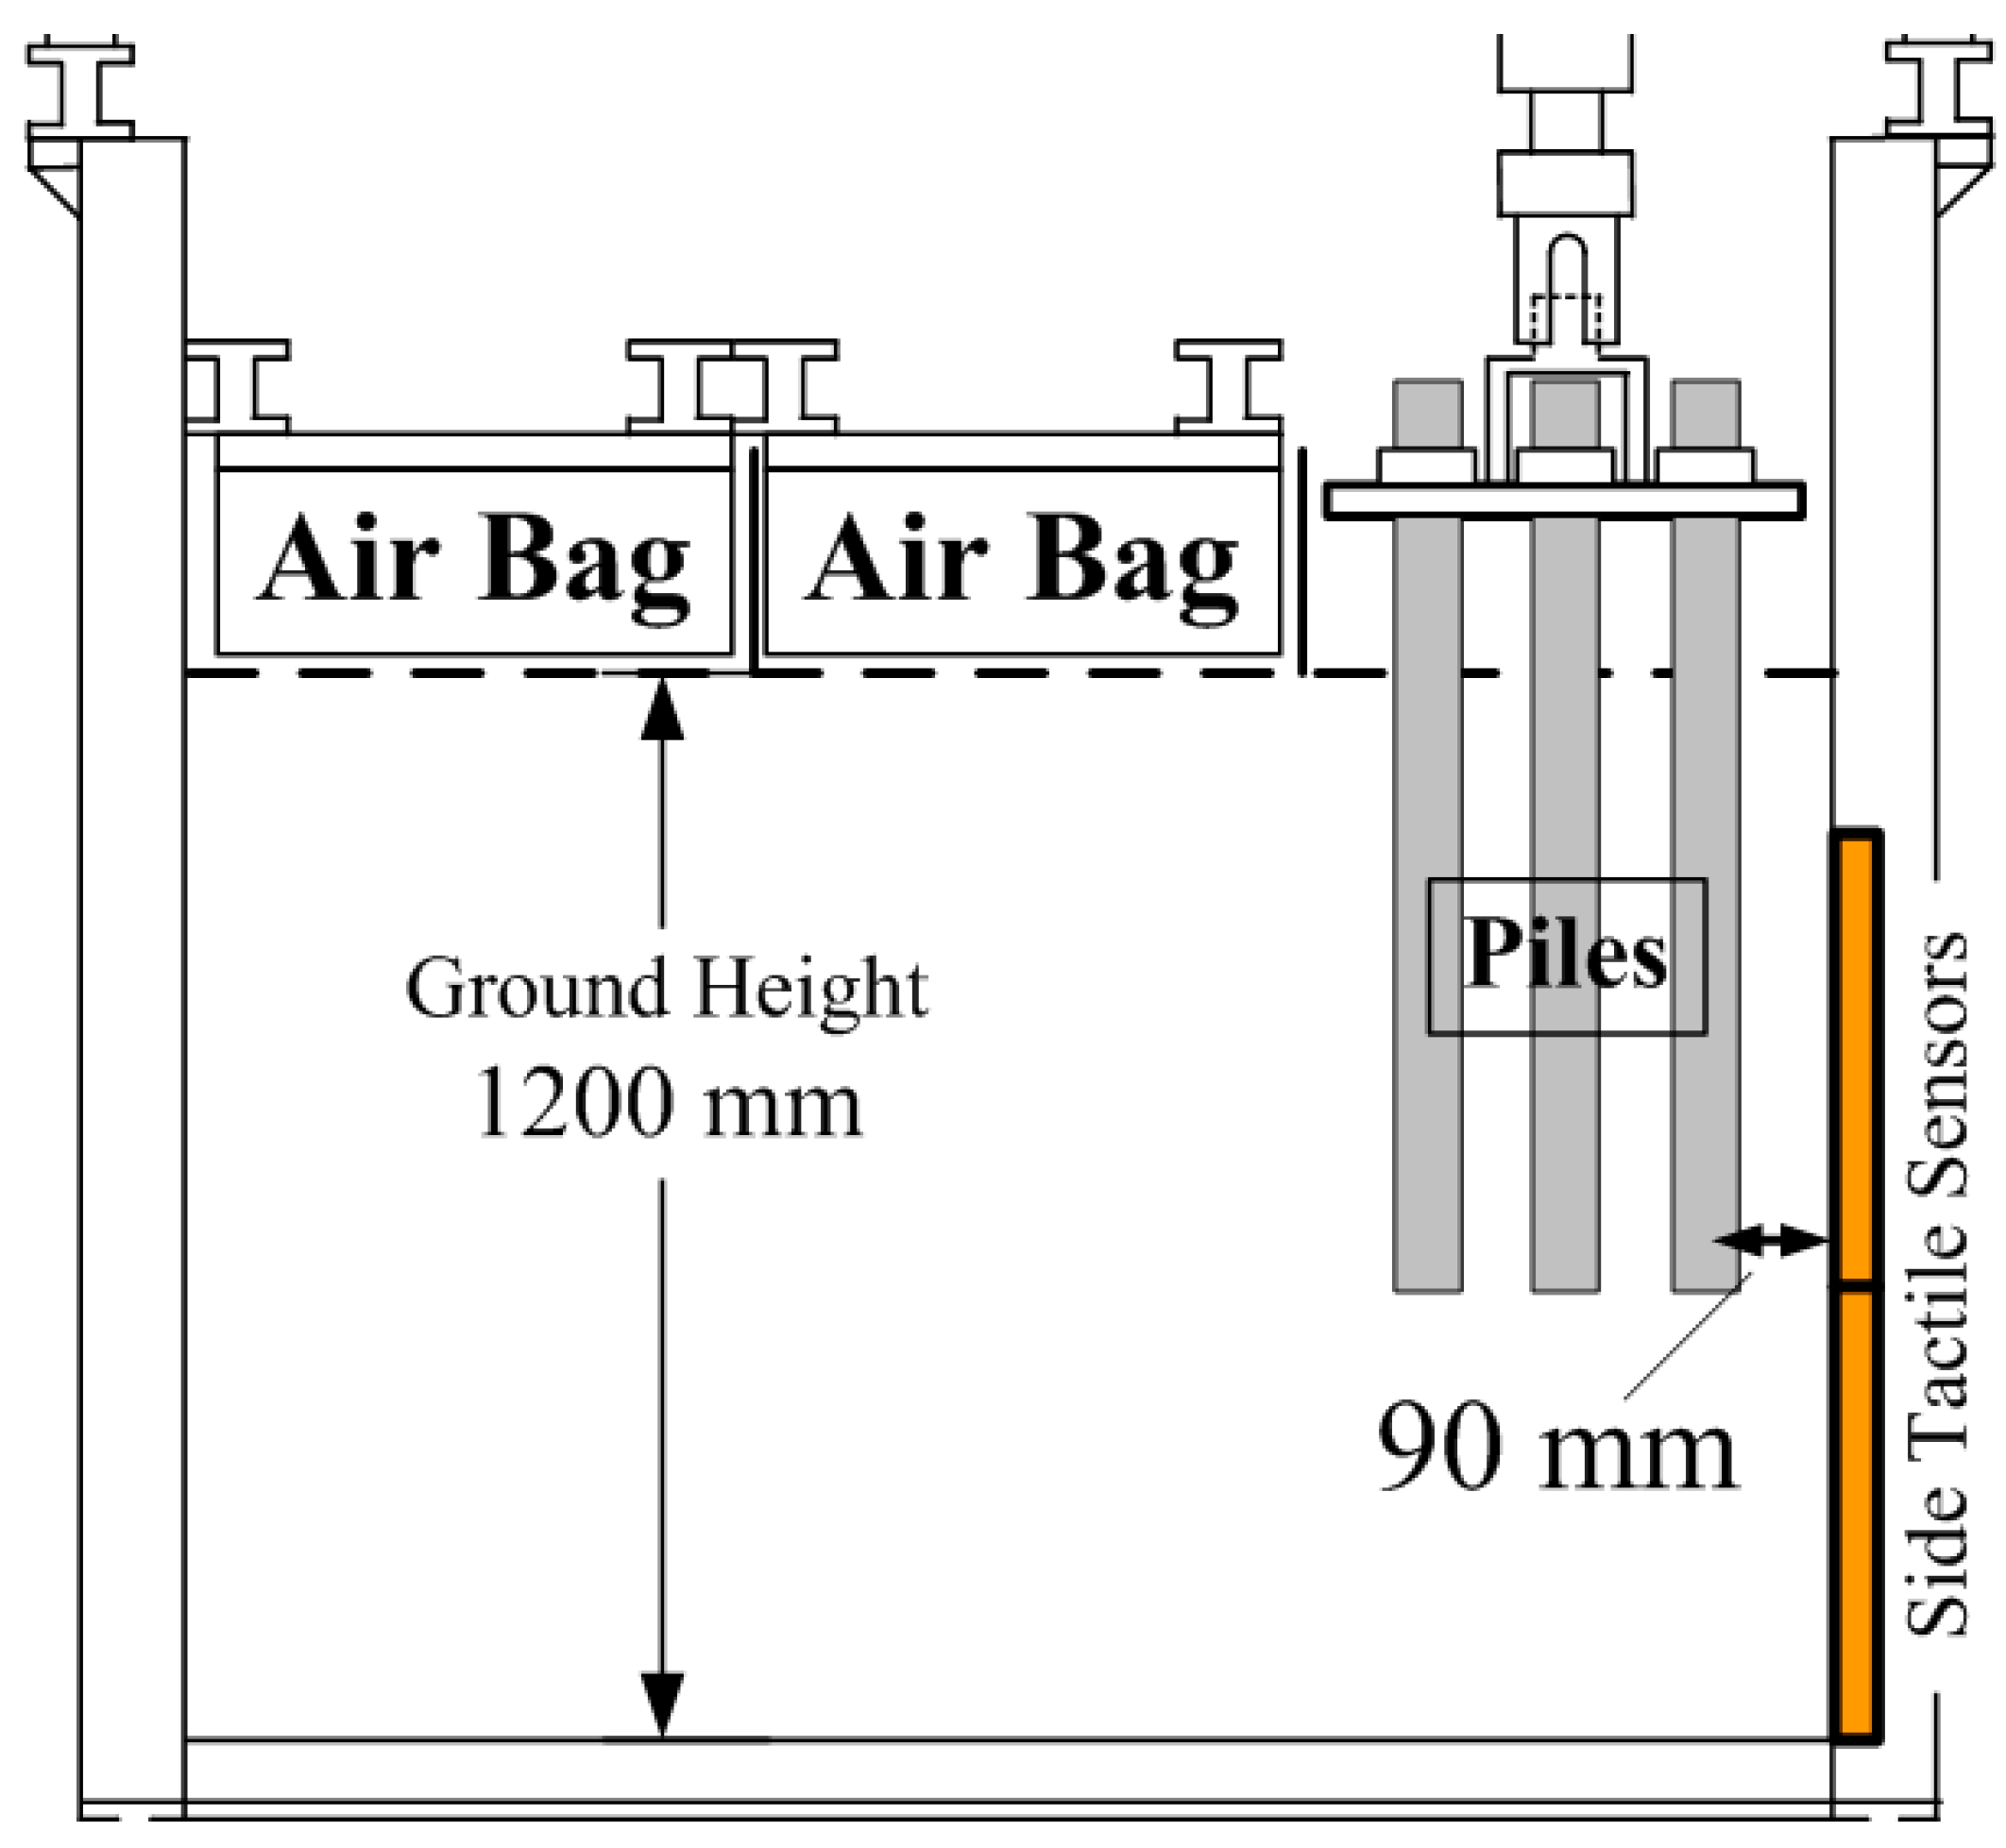
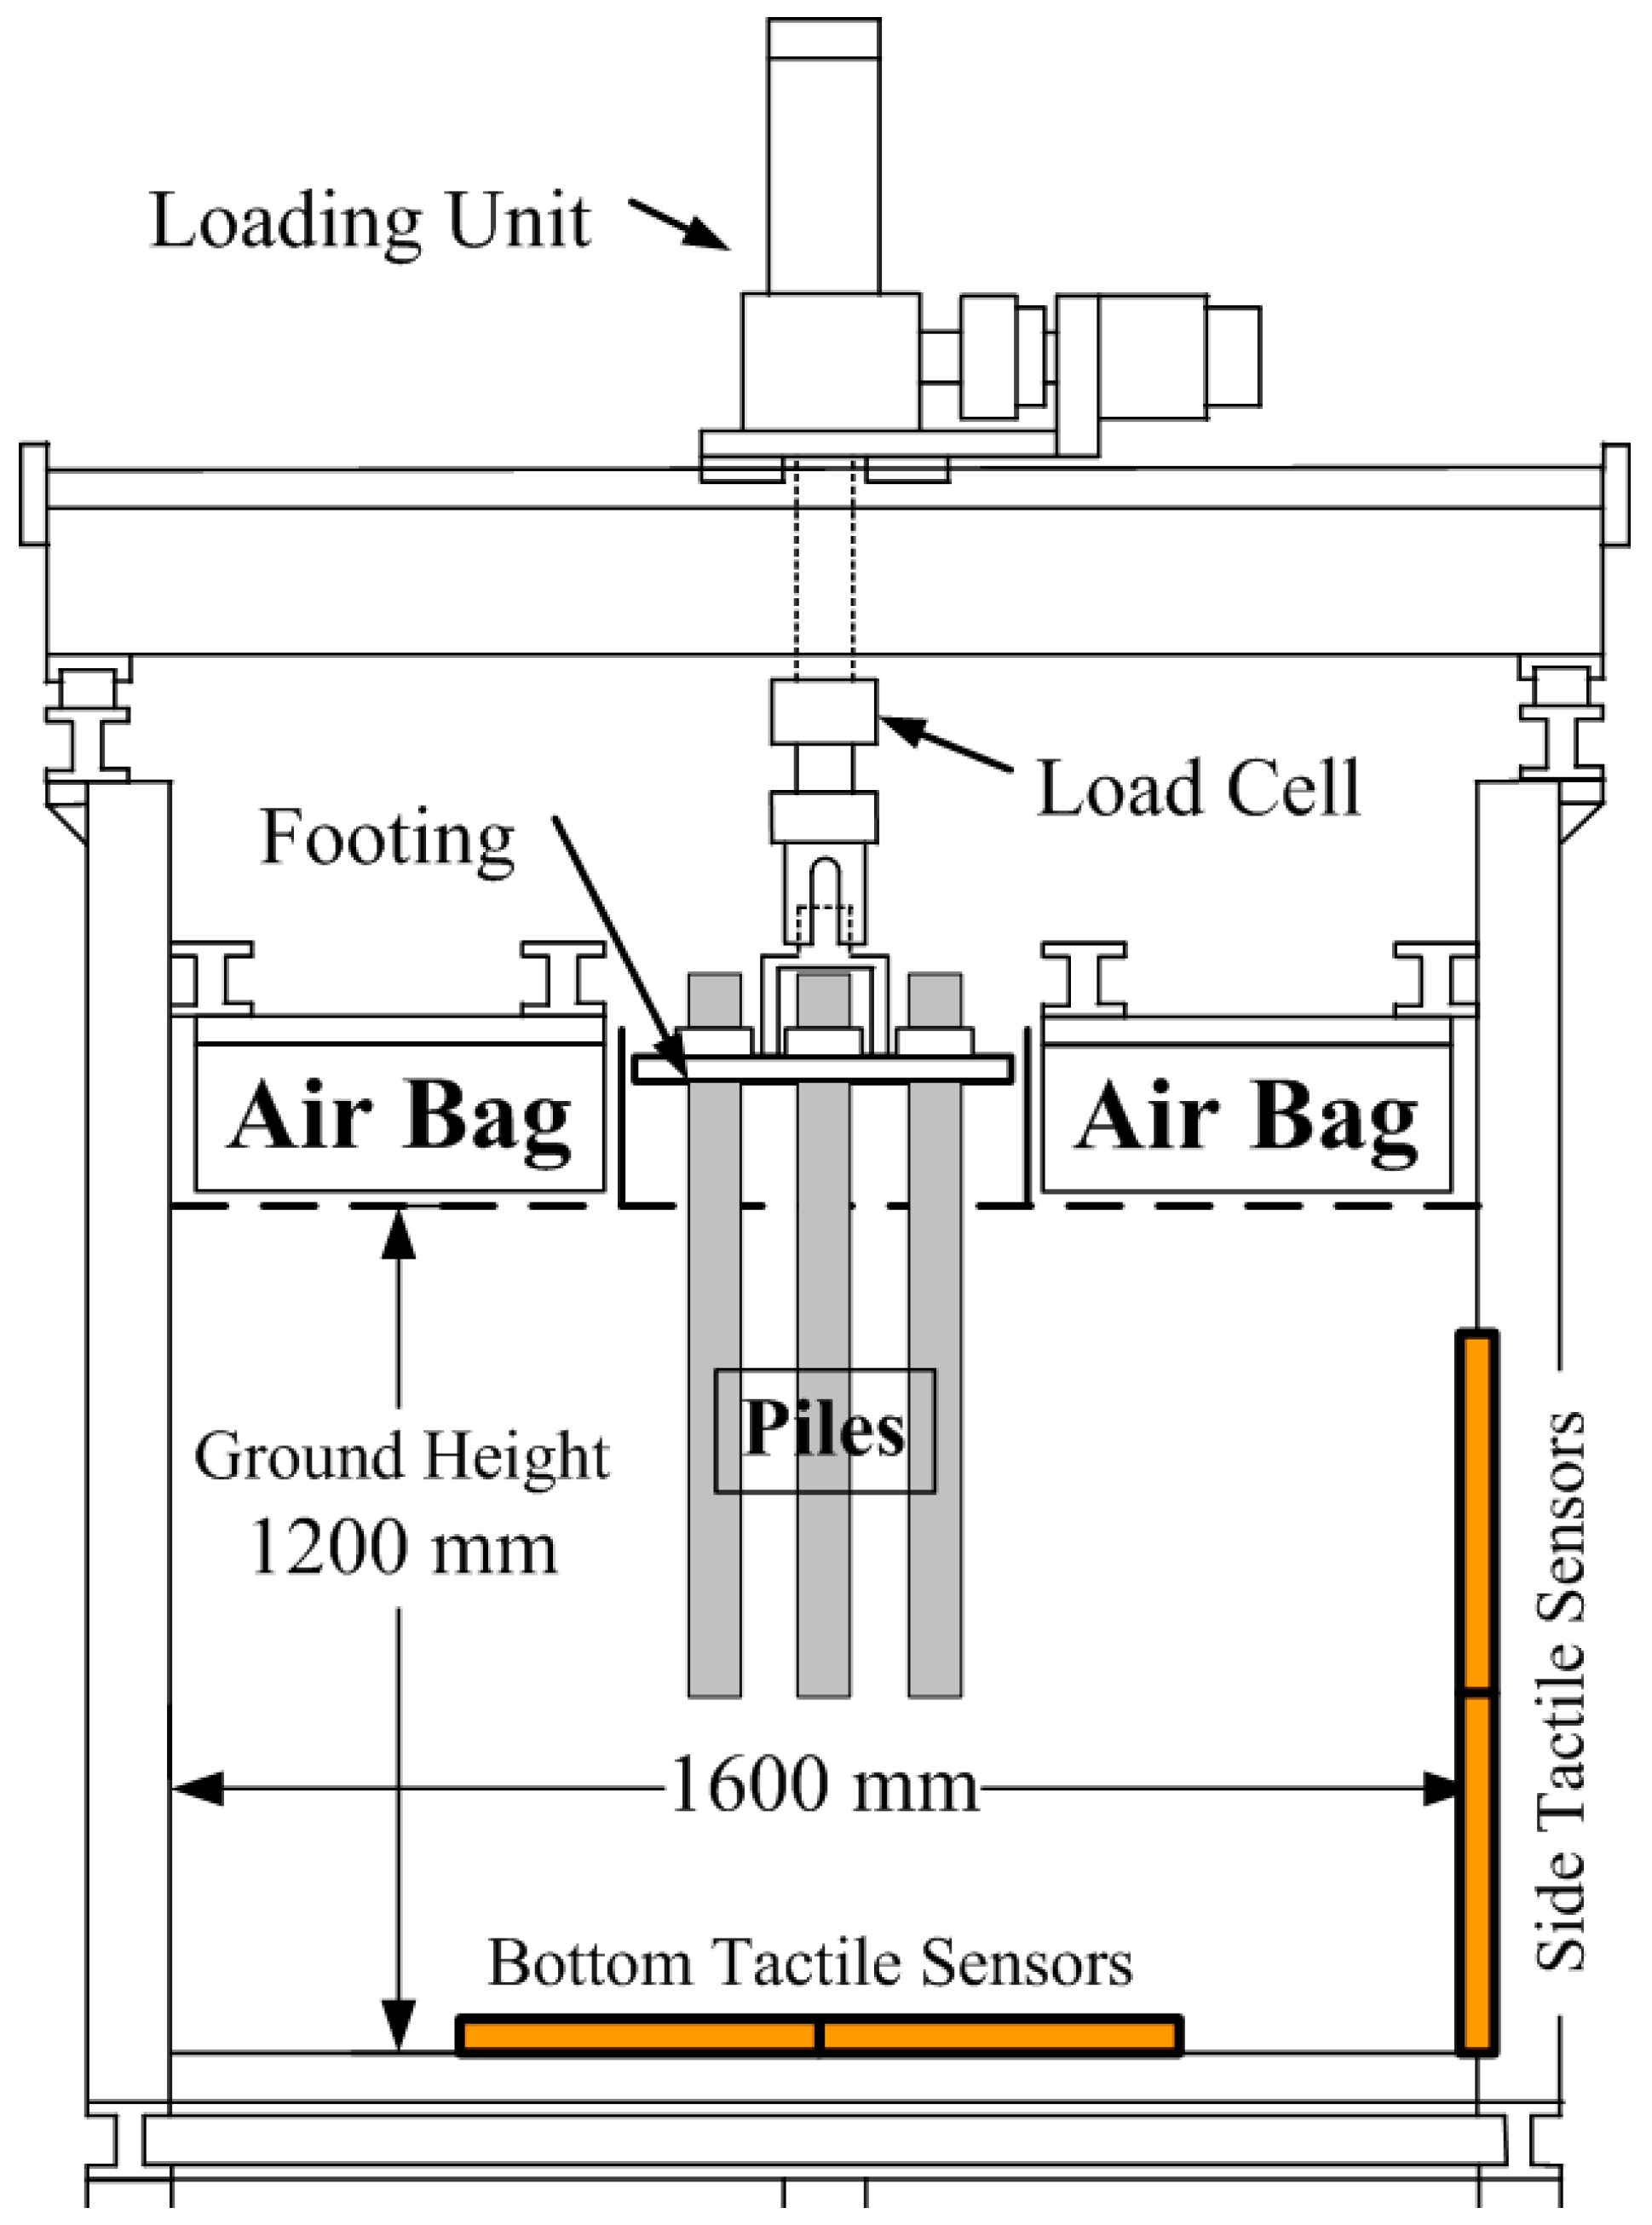
2. Test Apparatus and Test Procedure
3. Behavior of Piles under the Group Pile Loading Test
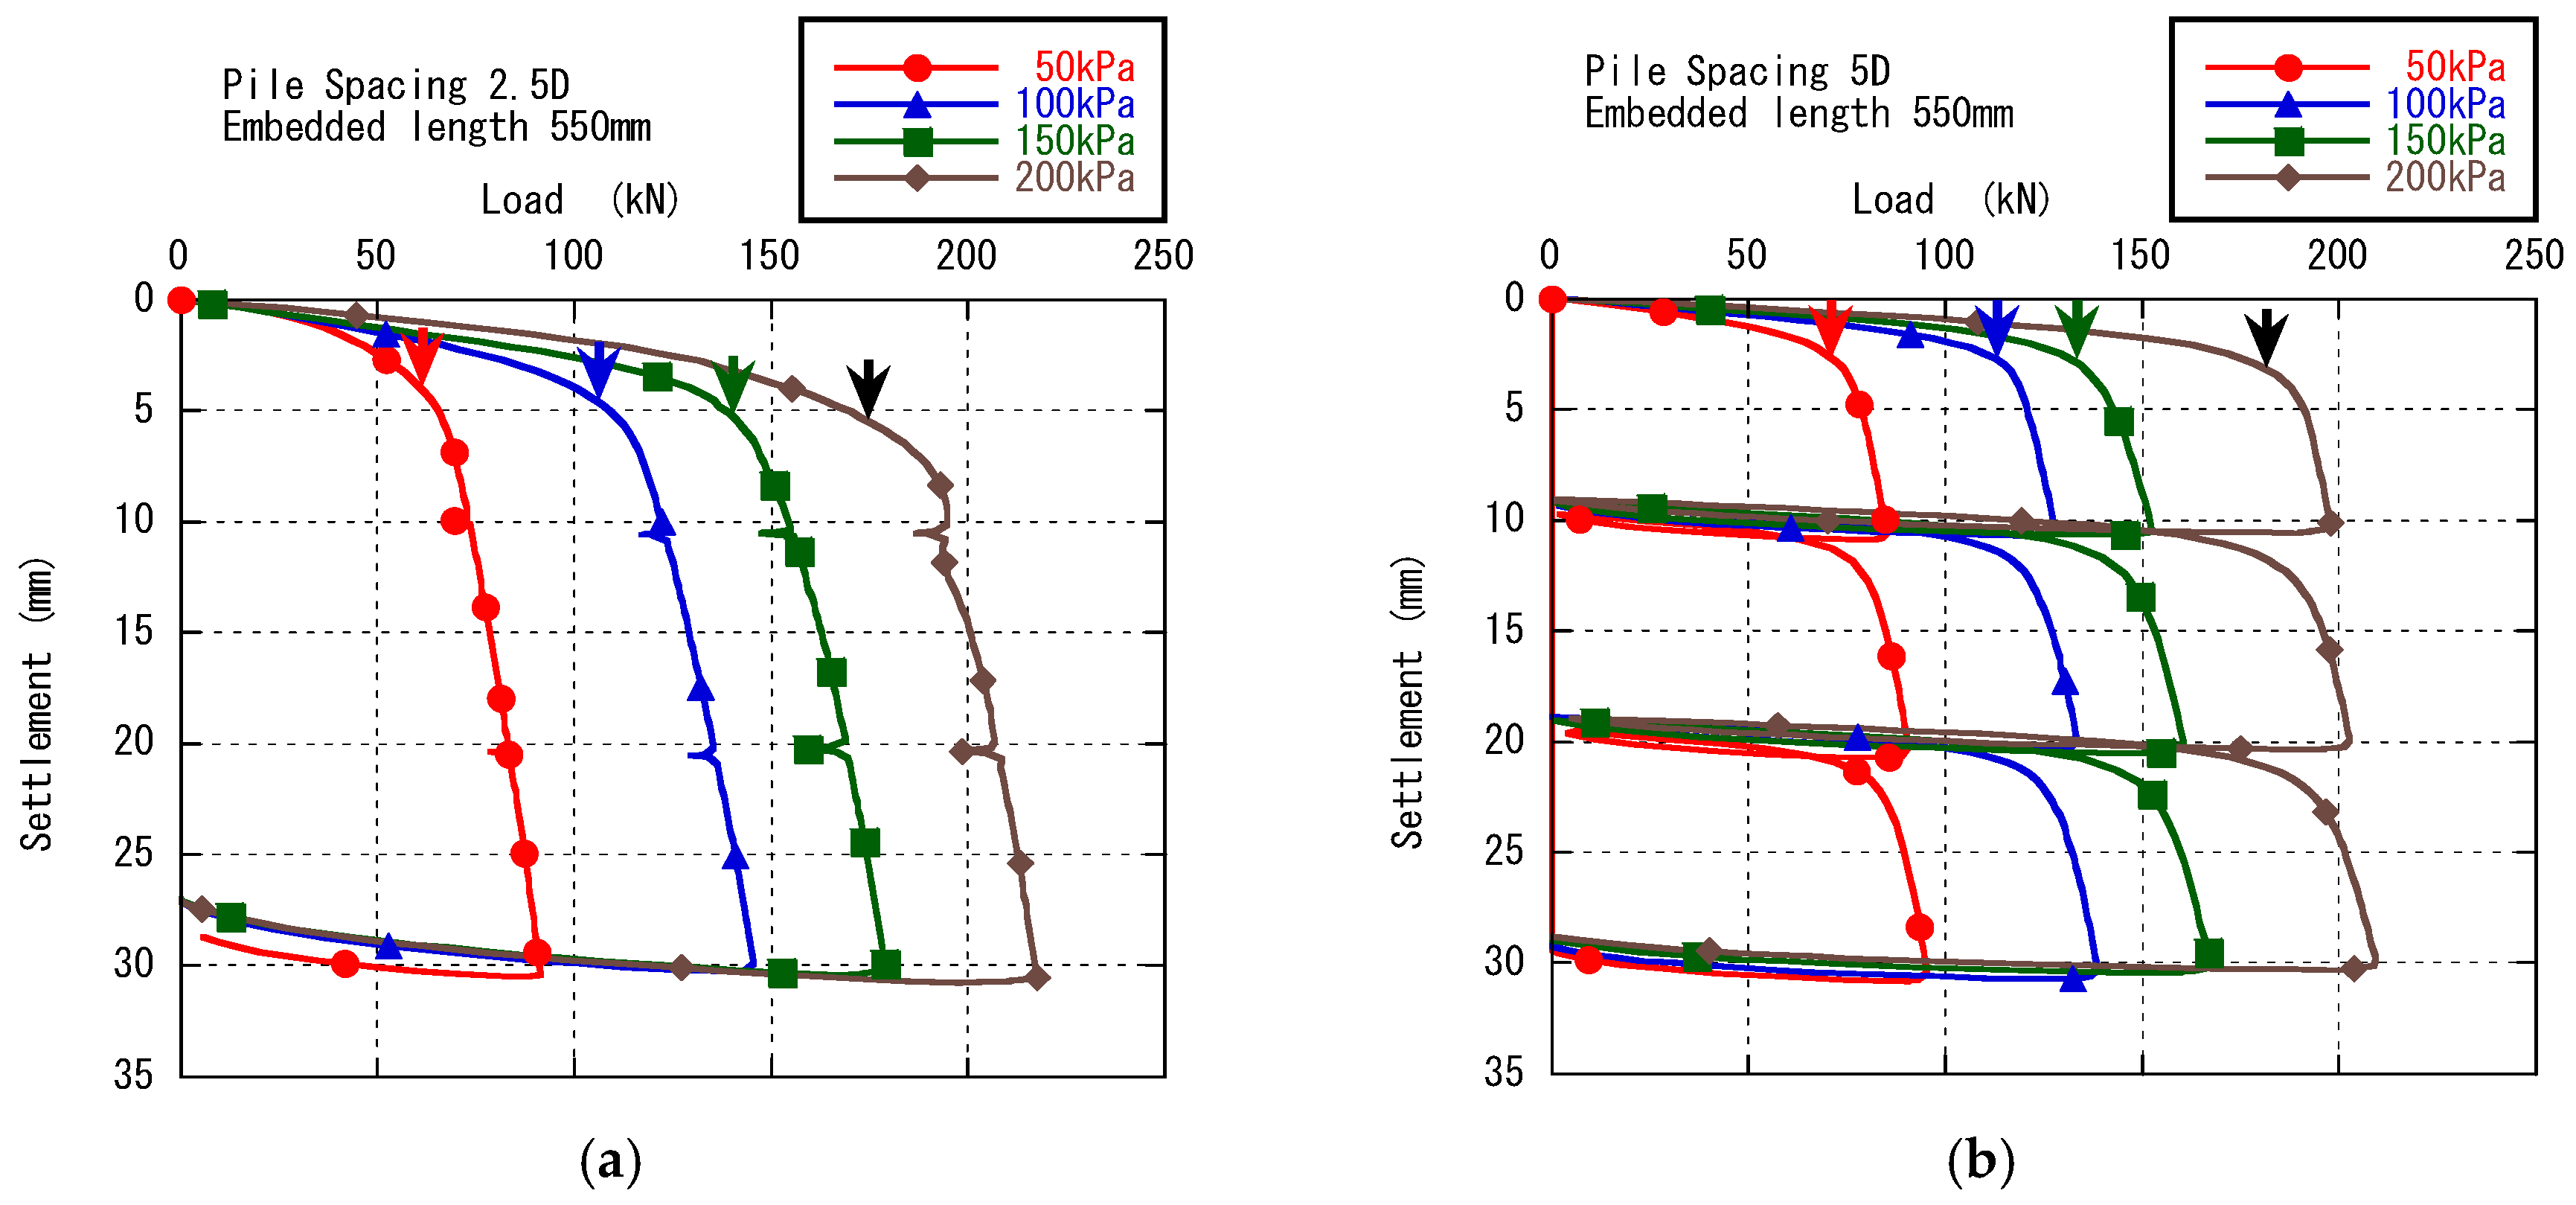
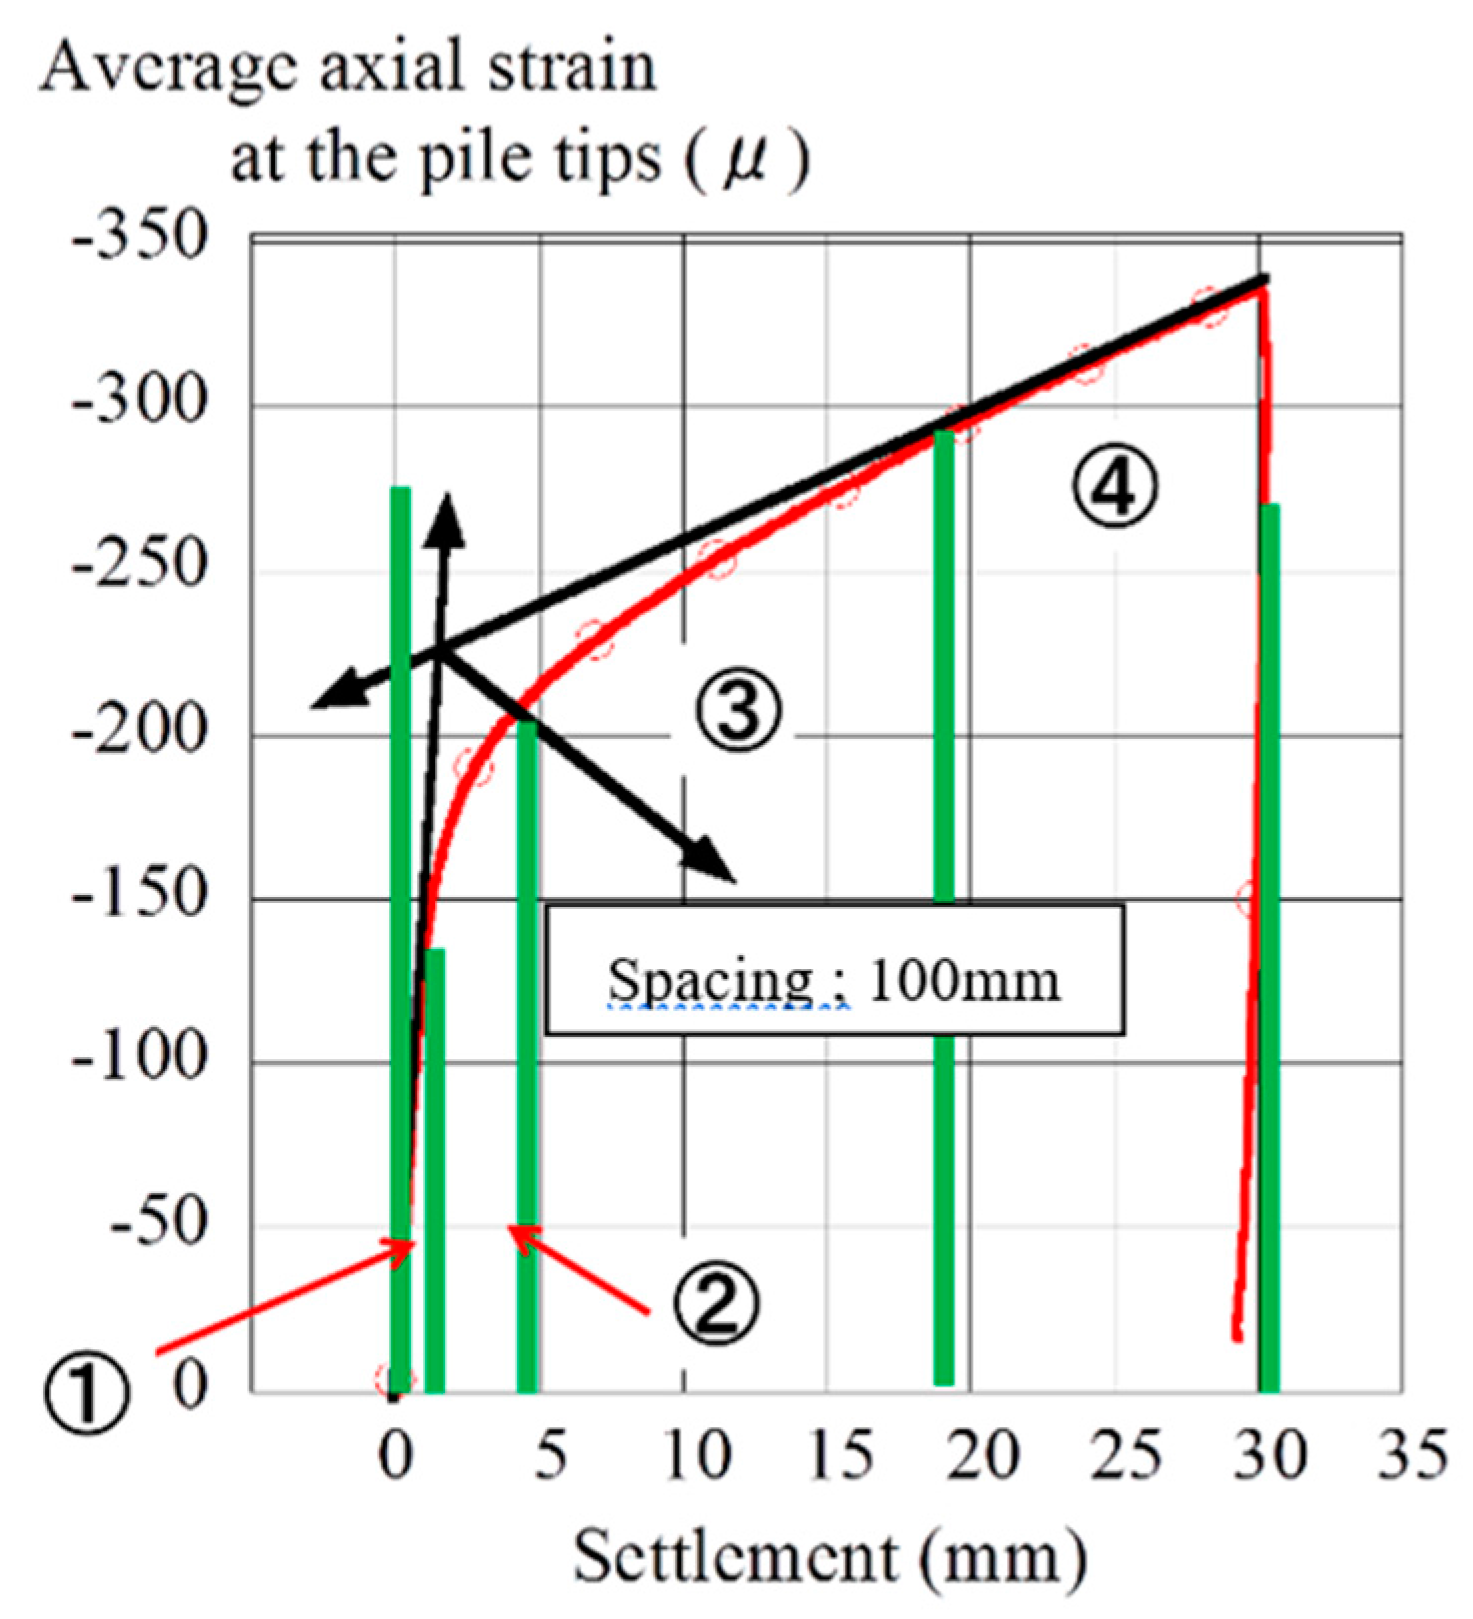
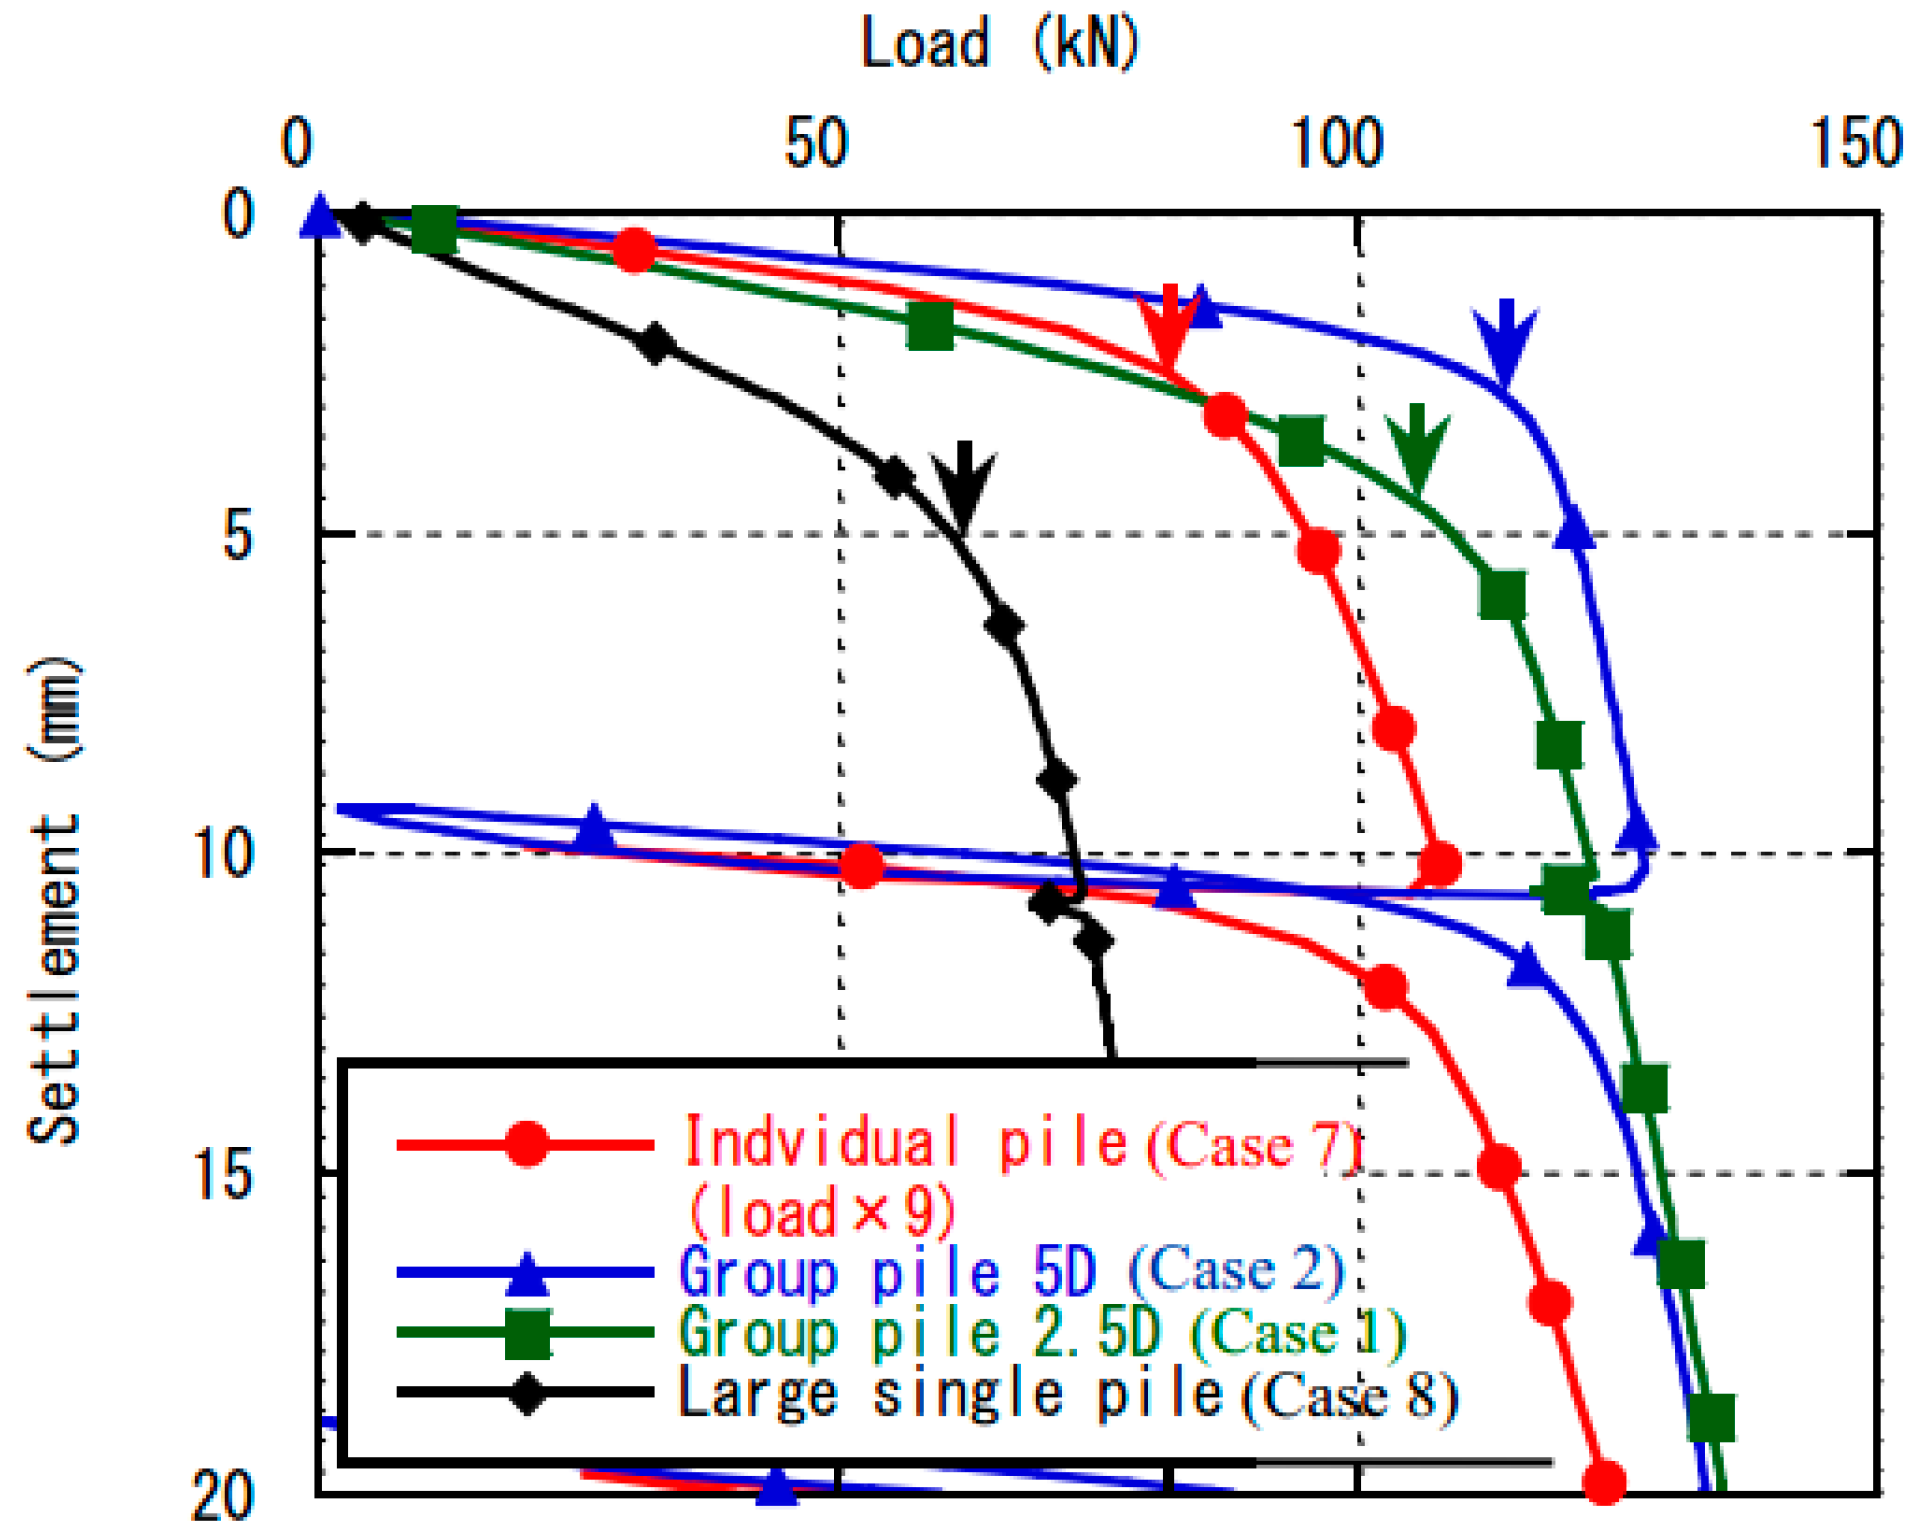
3.1. Yielding Point of the Bearing Load
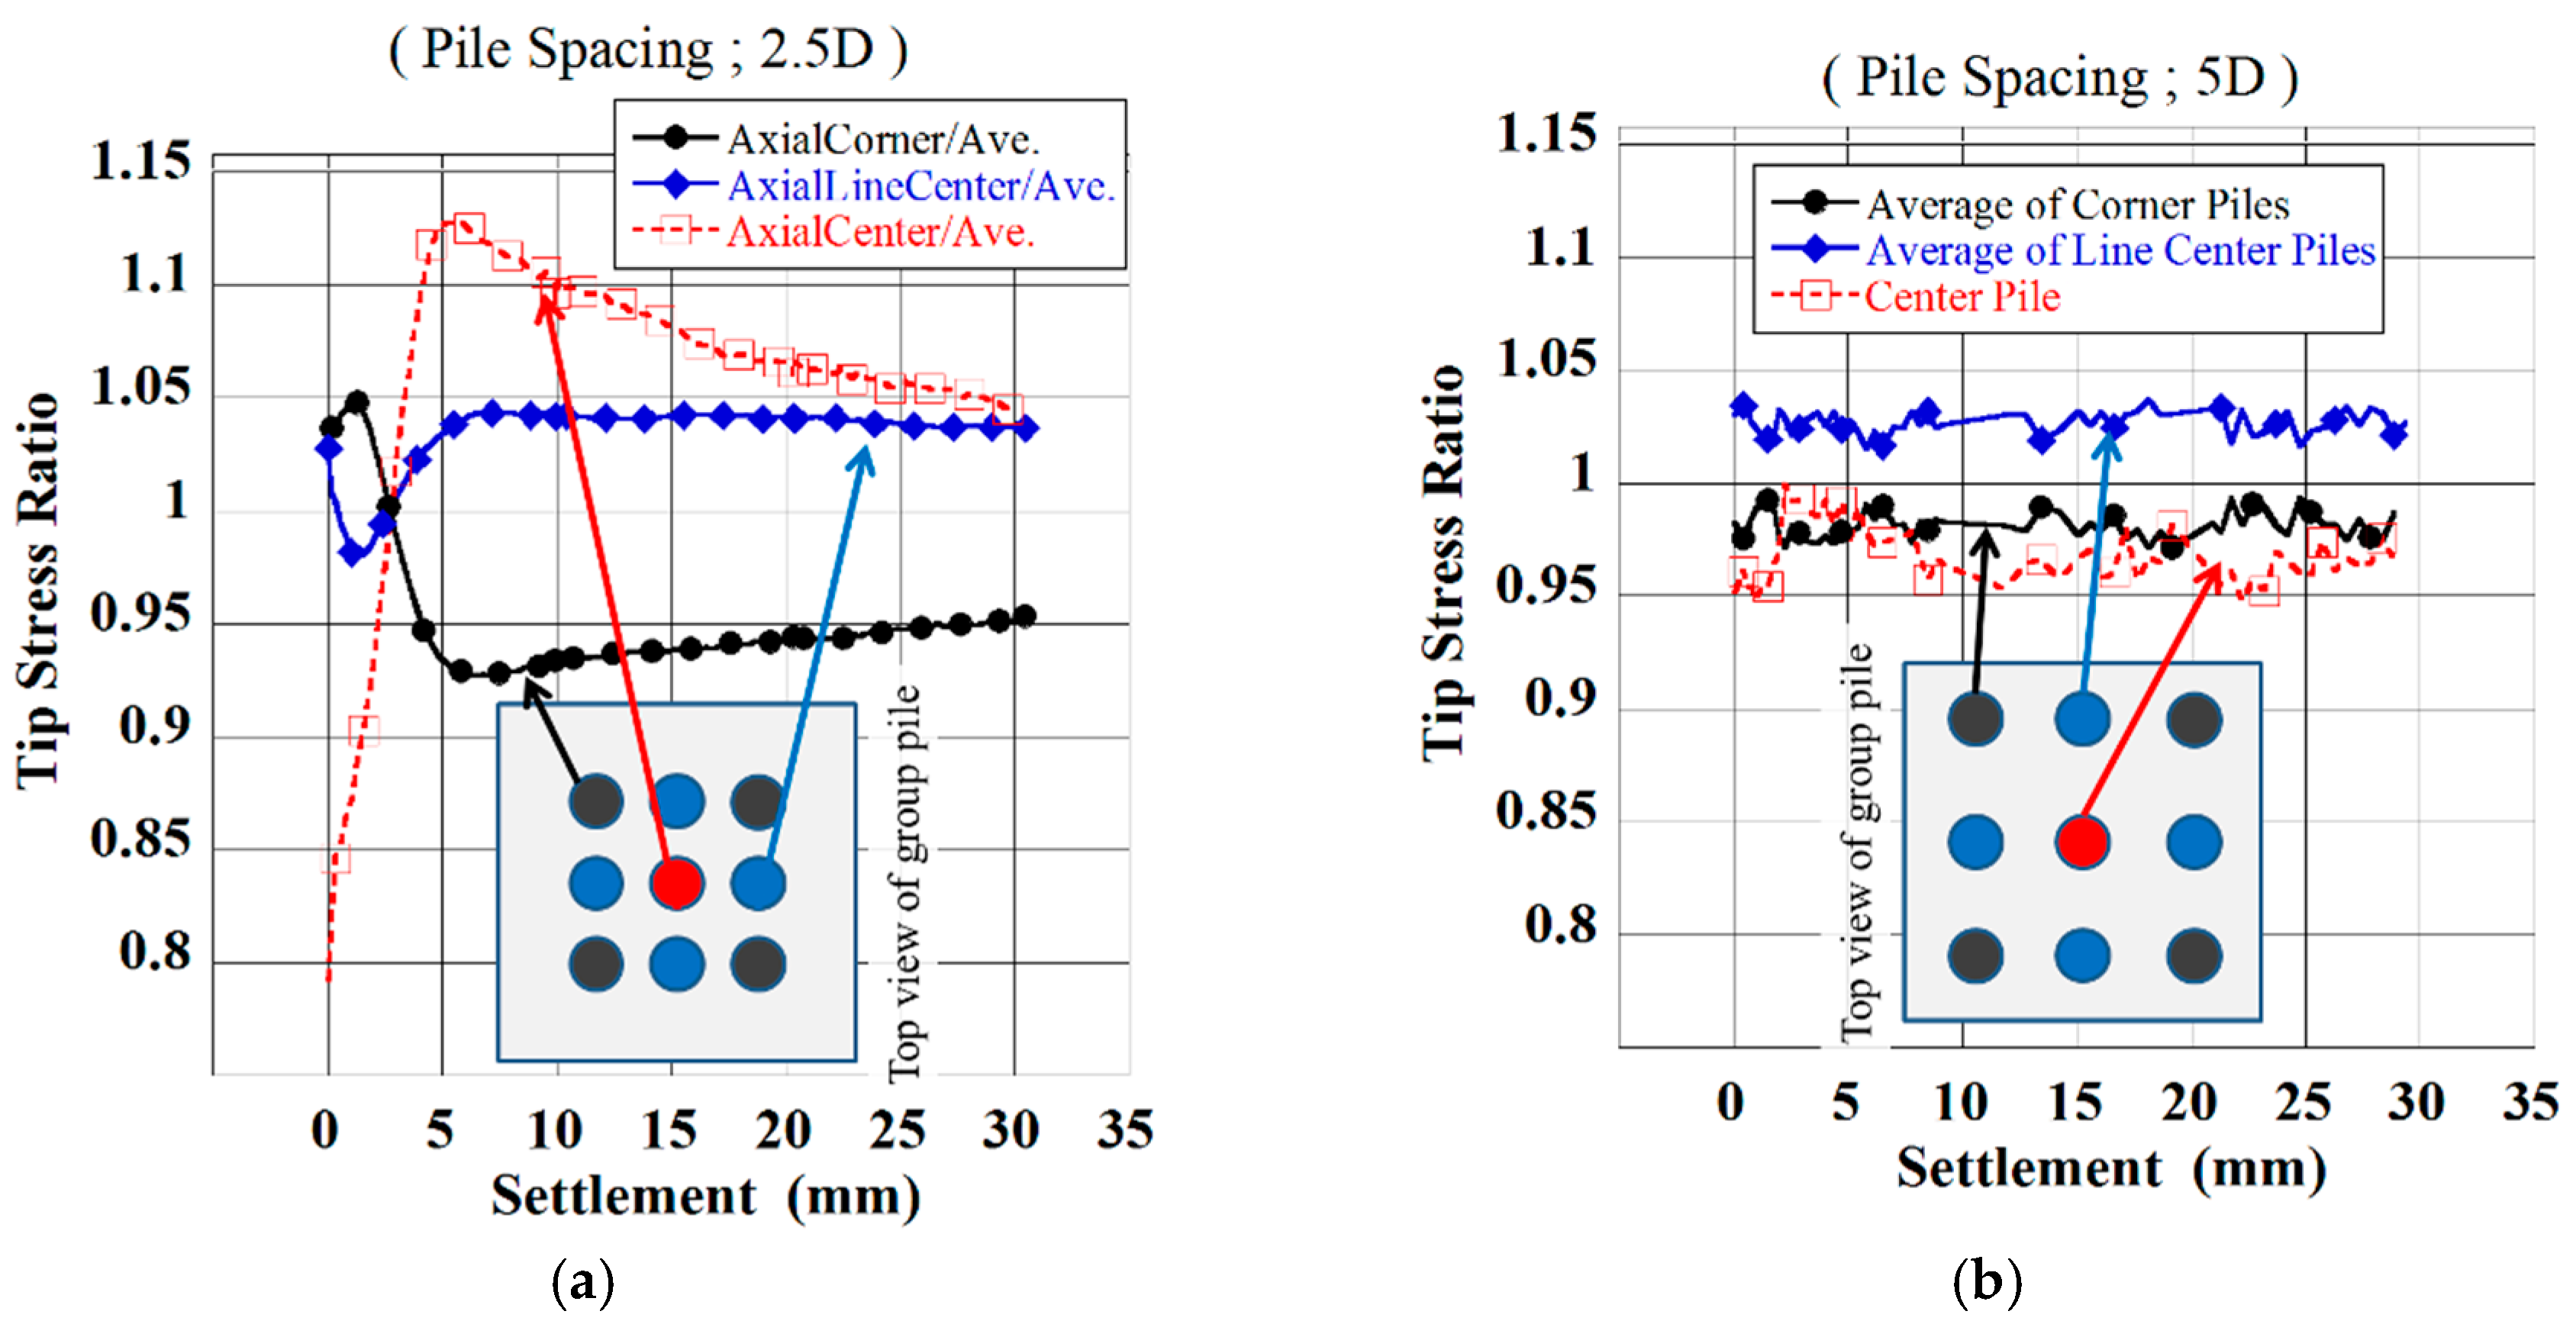
3.2. Load Distribution between Each Pile
4. Application of Advanced Sensors
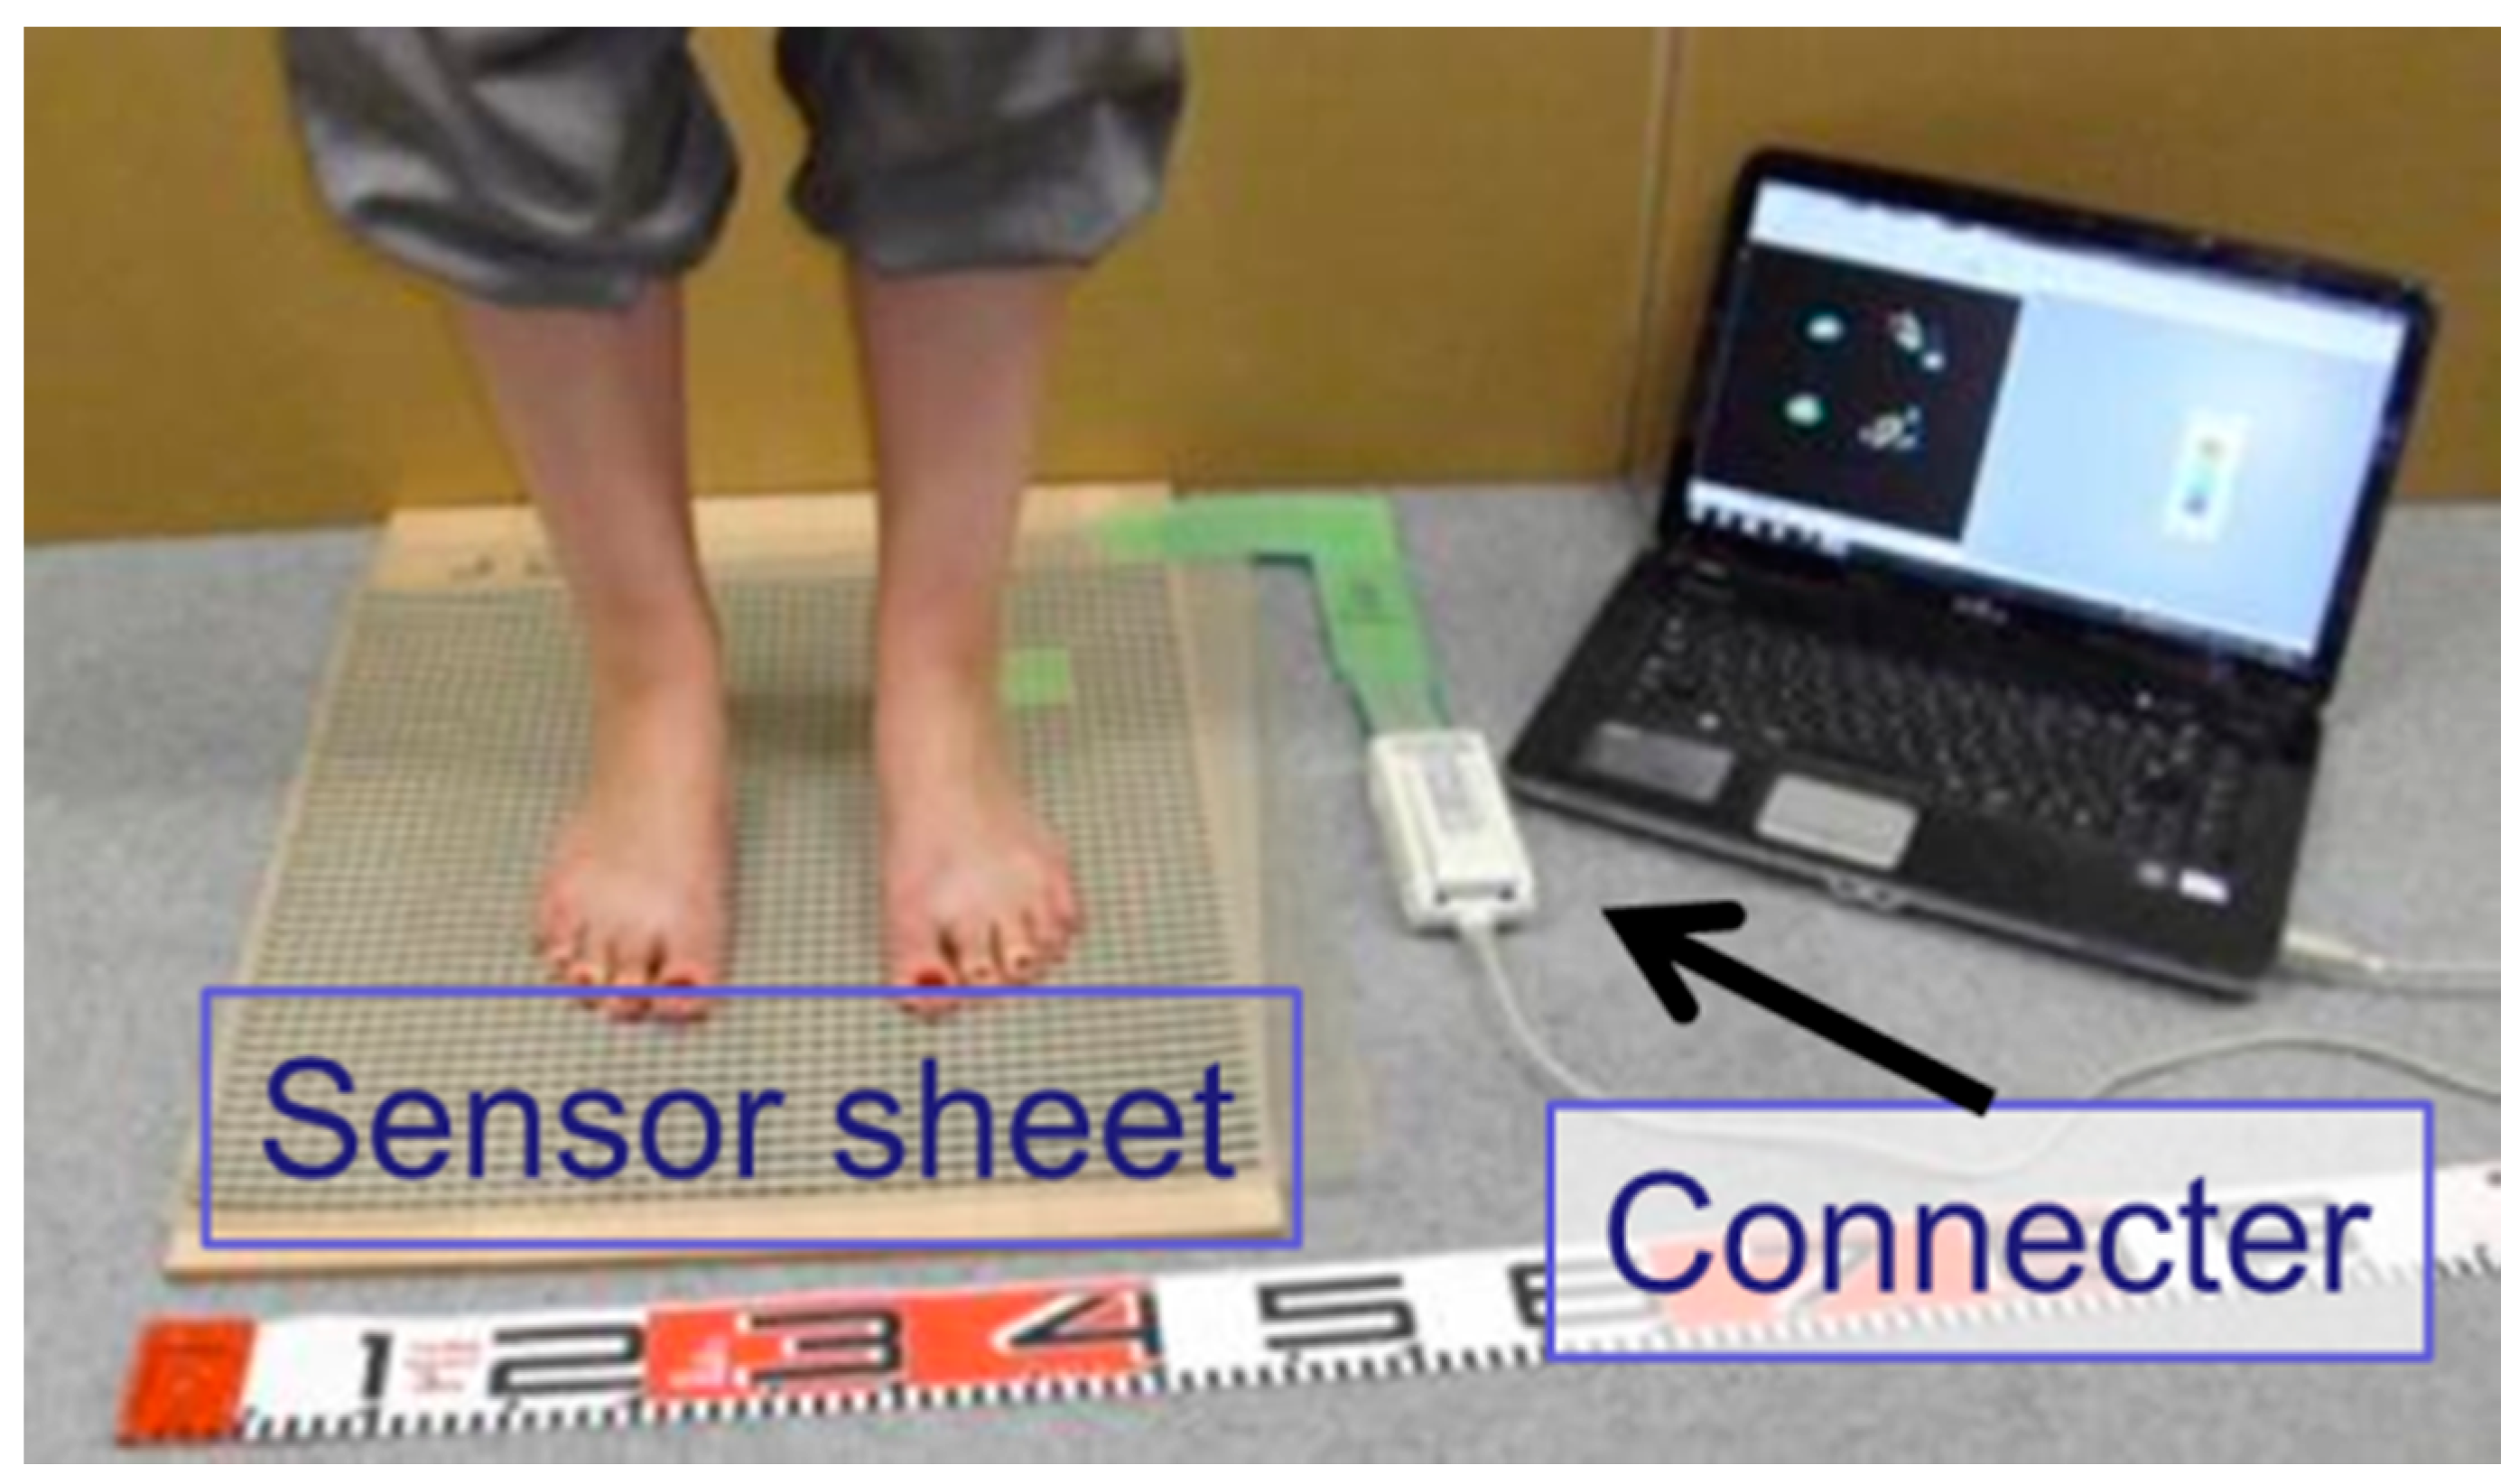
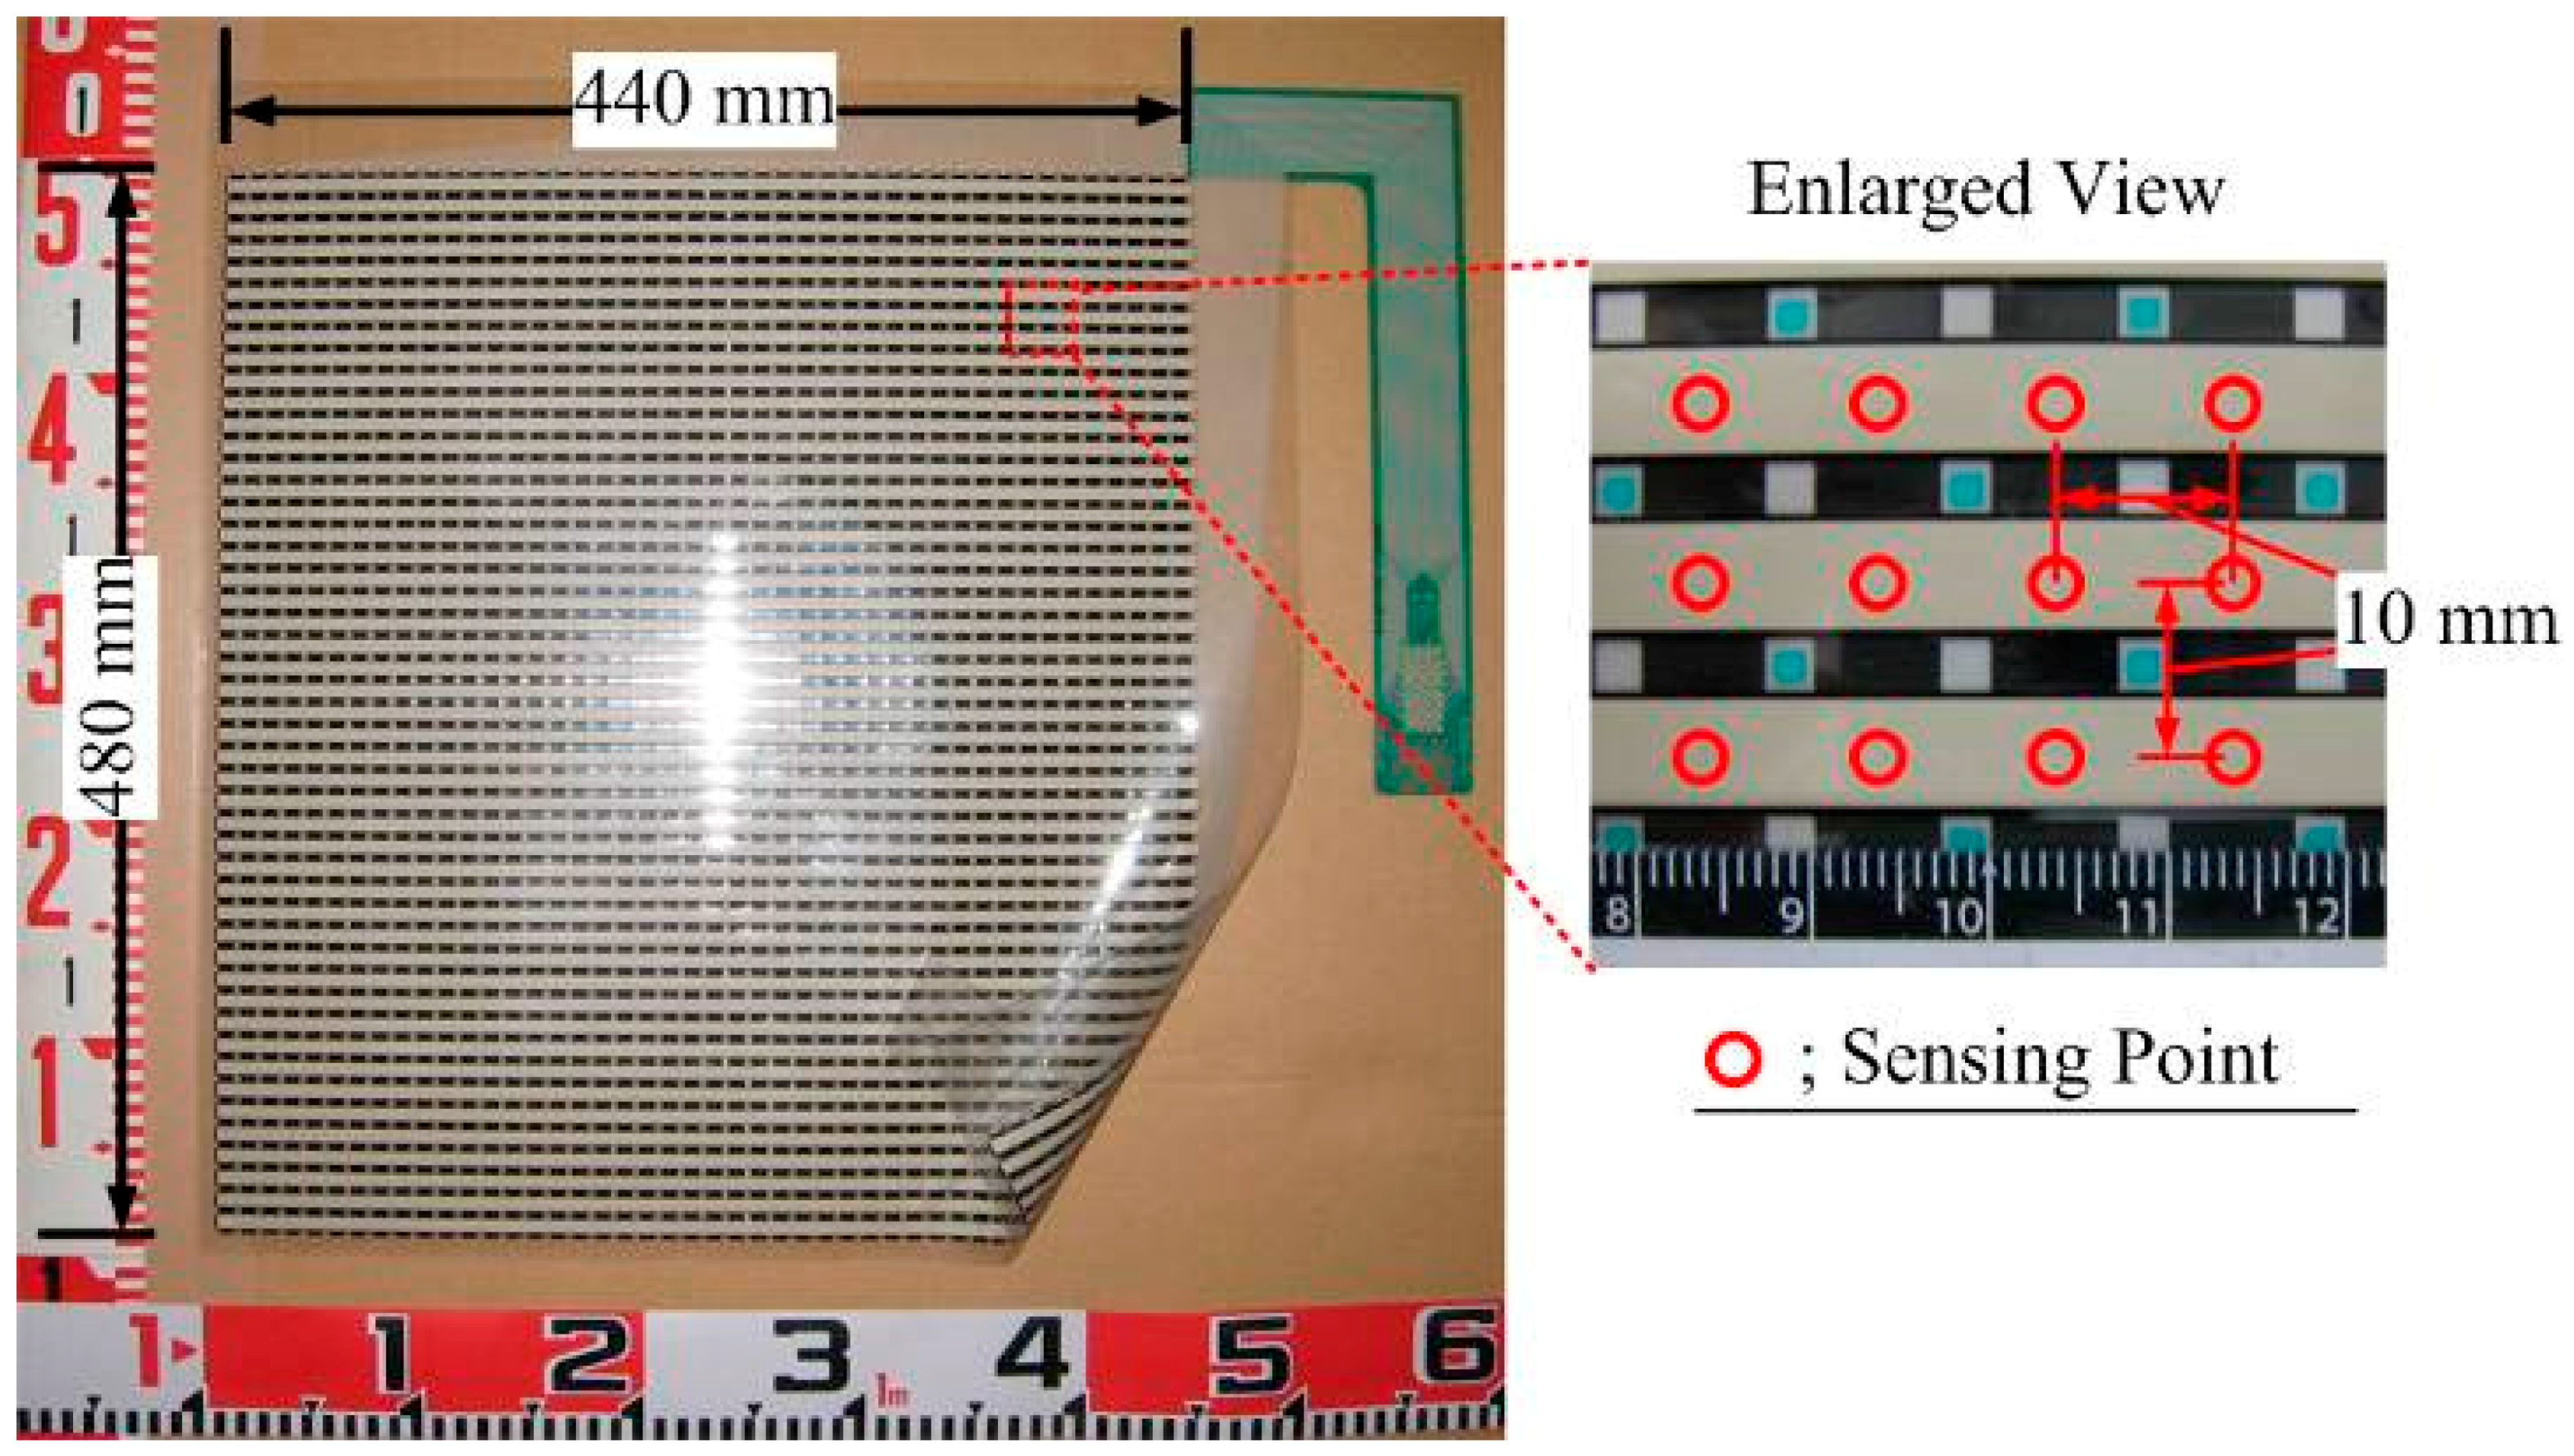
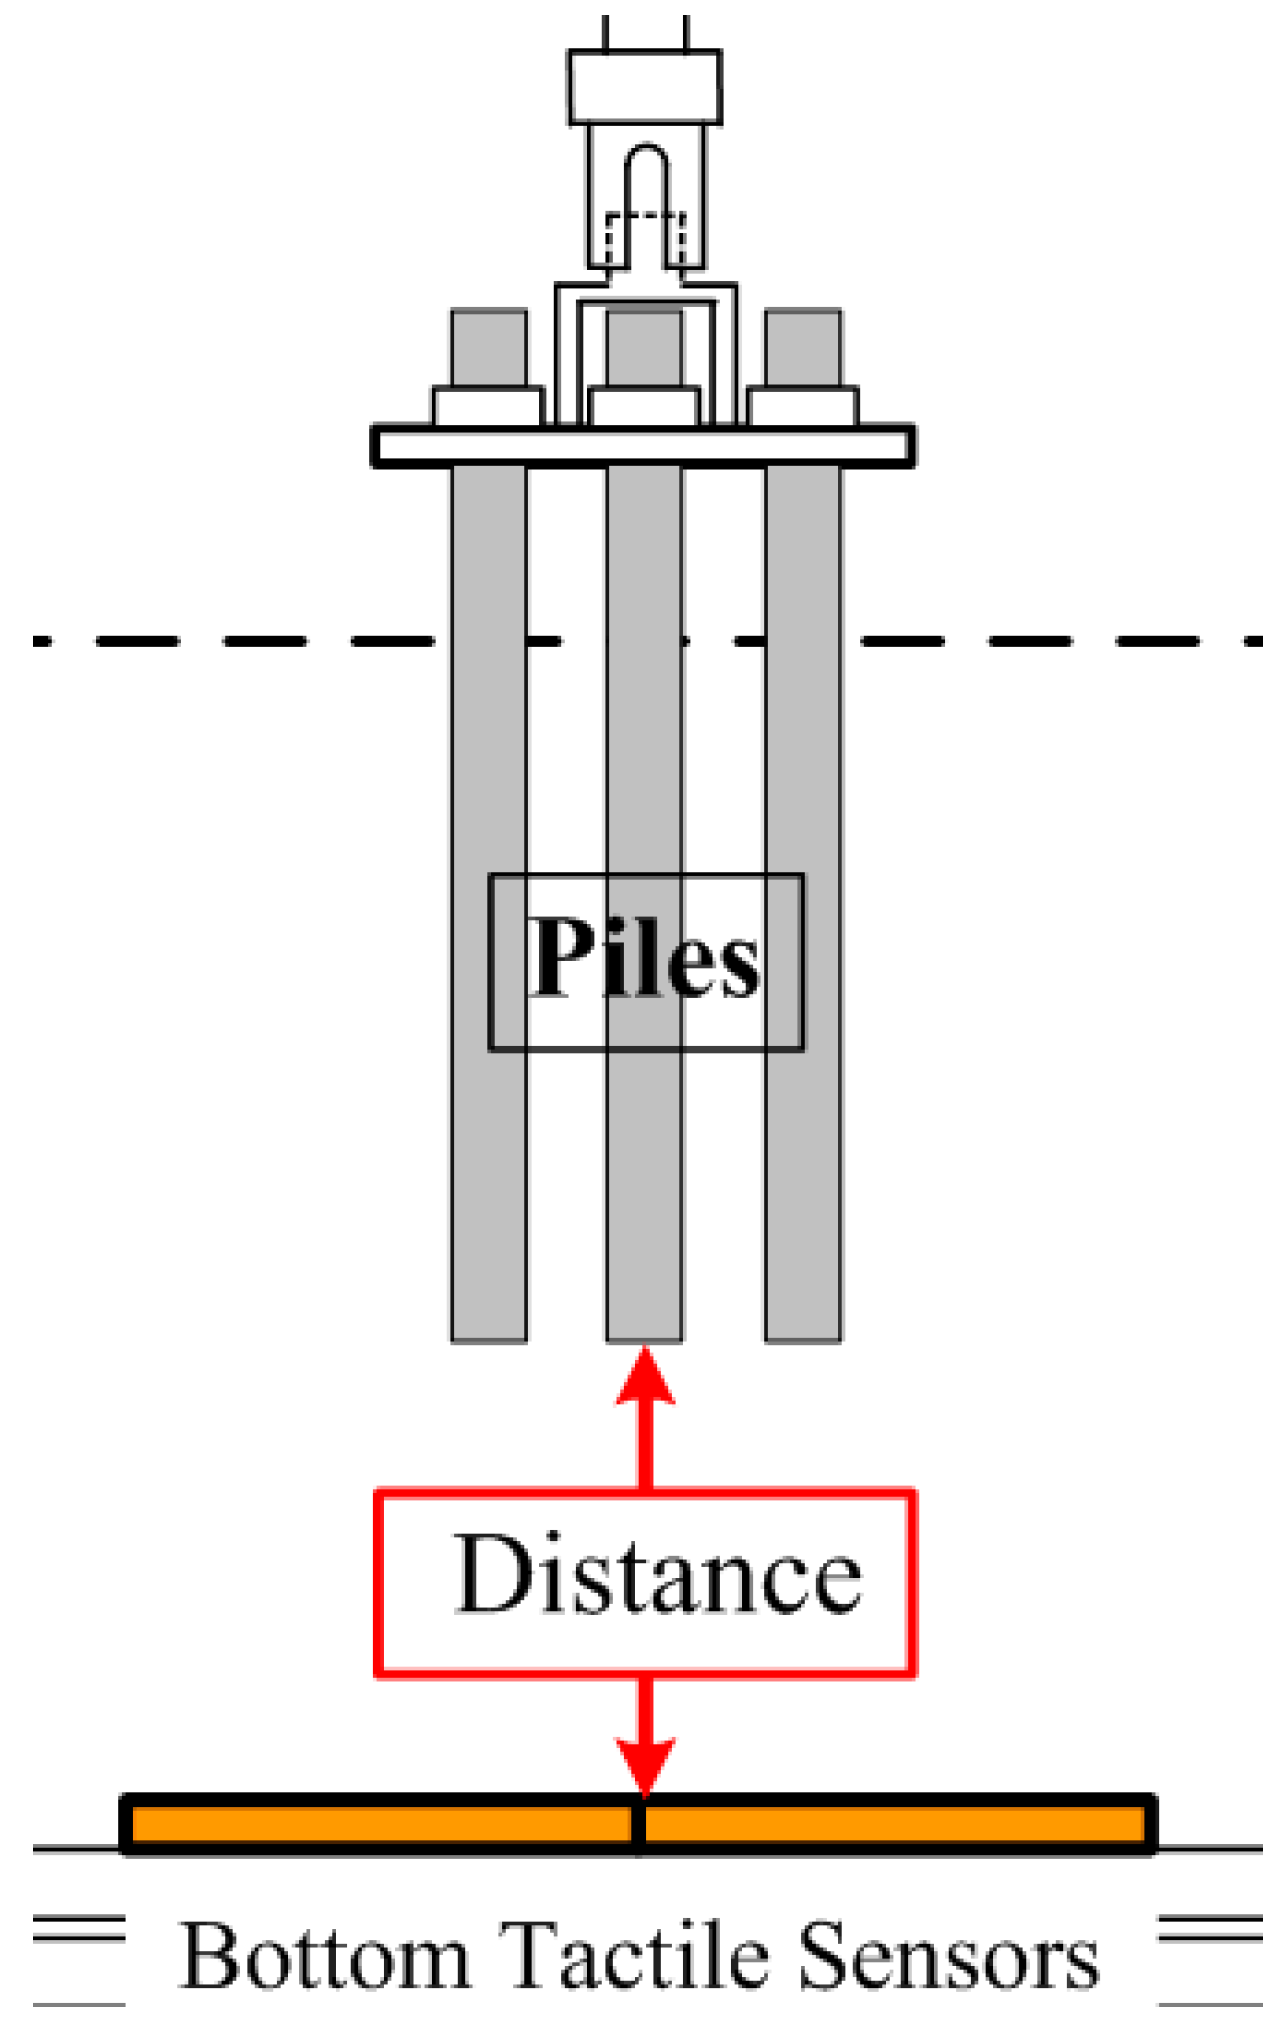
4.1. Tactile Sensors
4.1.1. Tactile Sensors Description
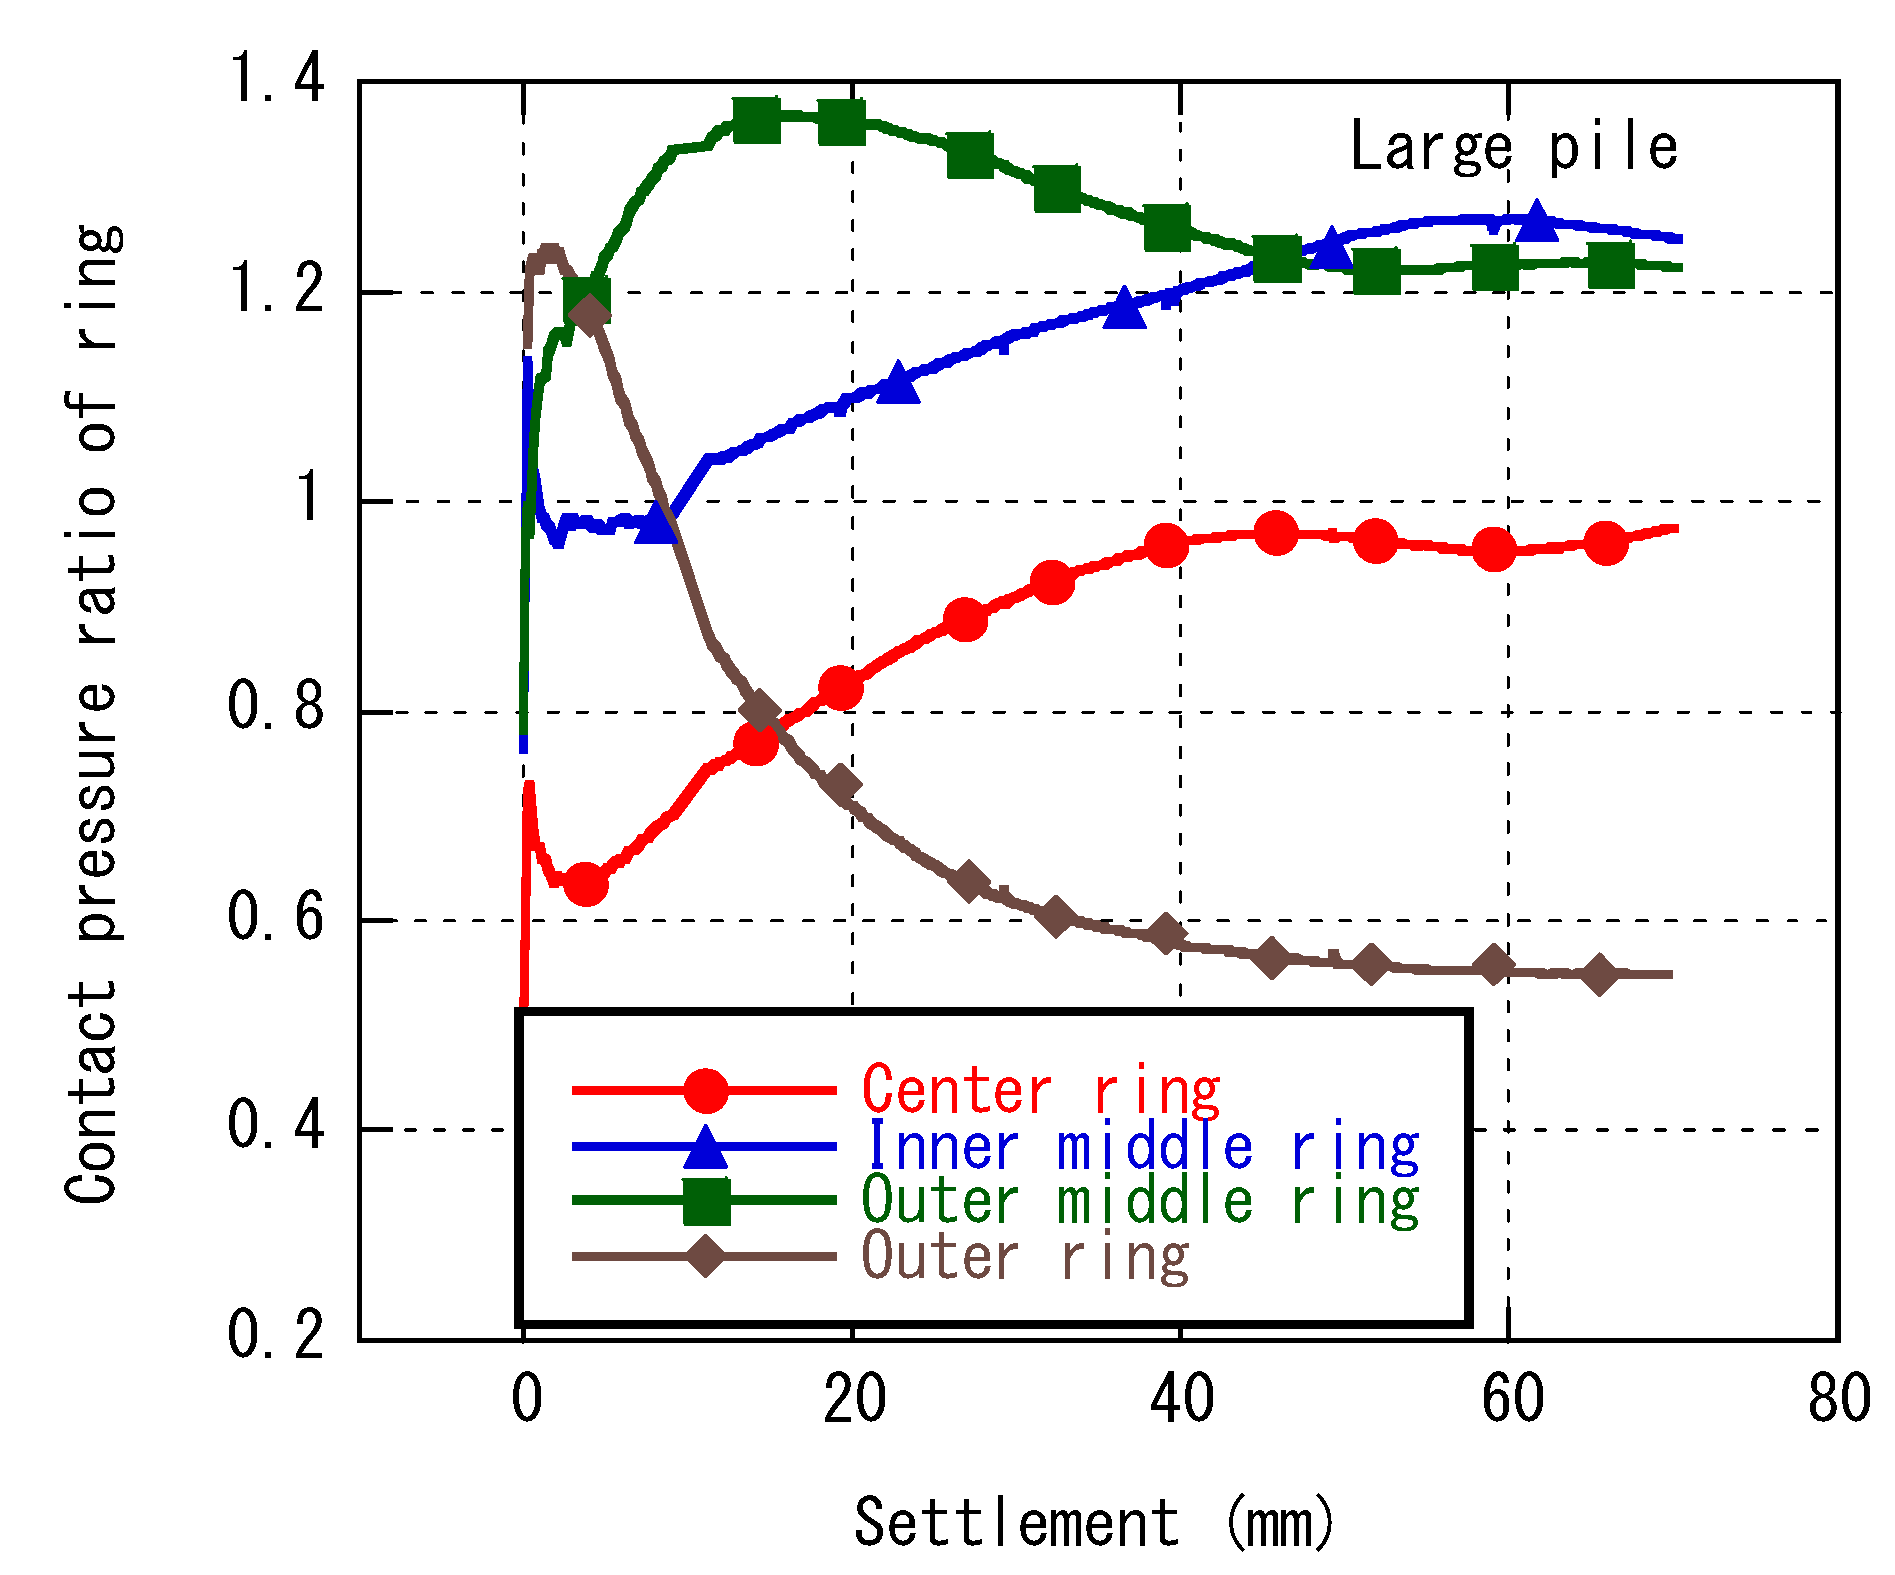
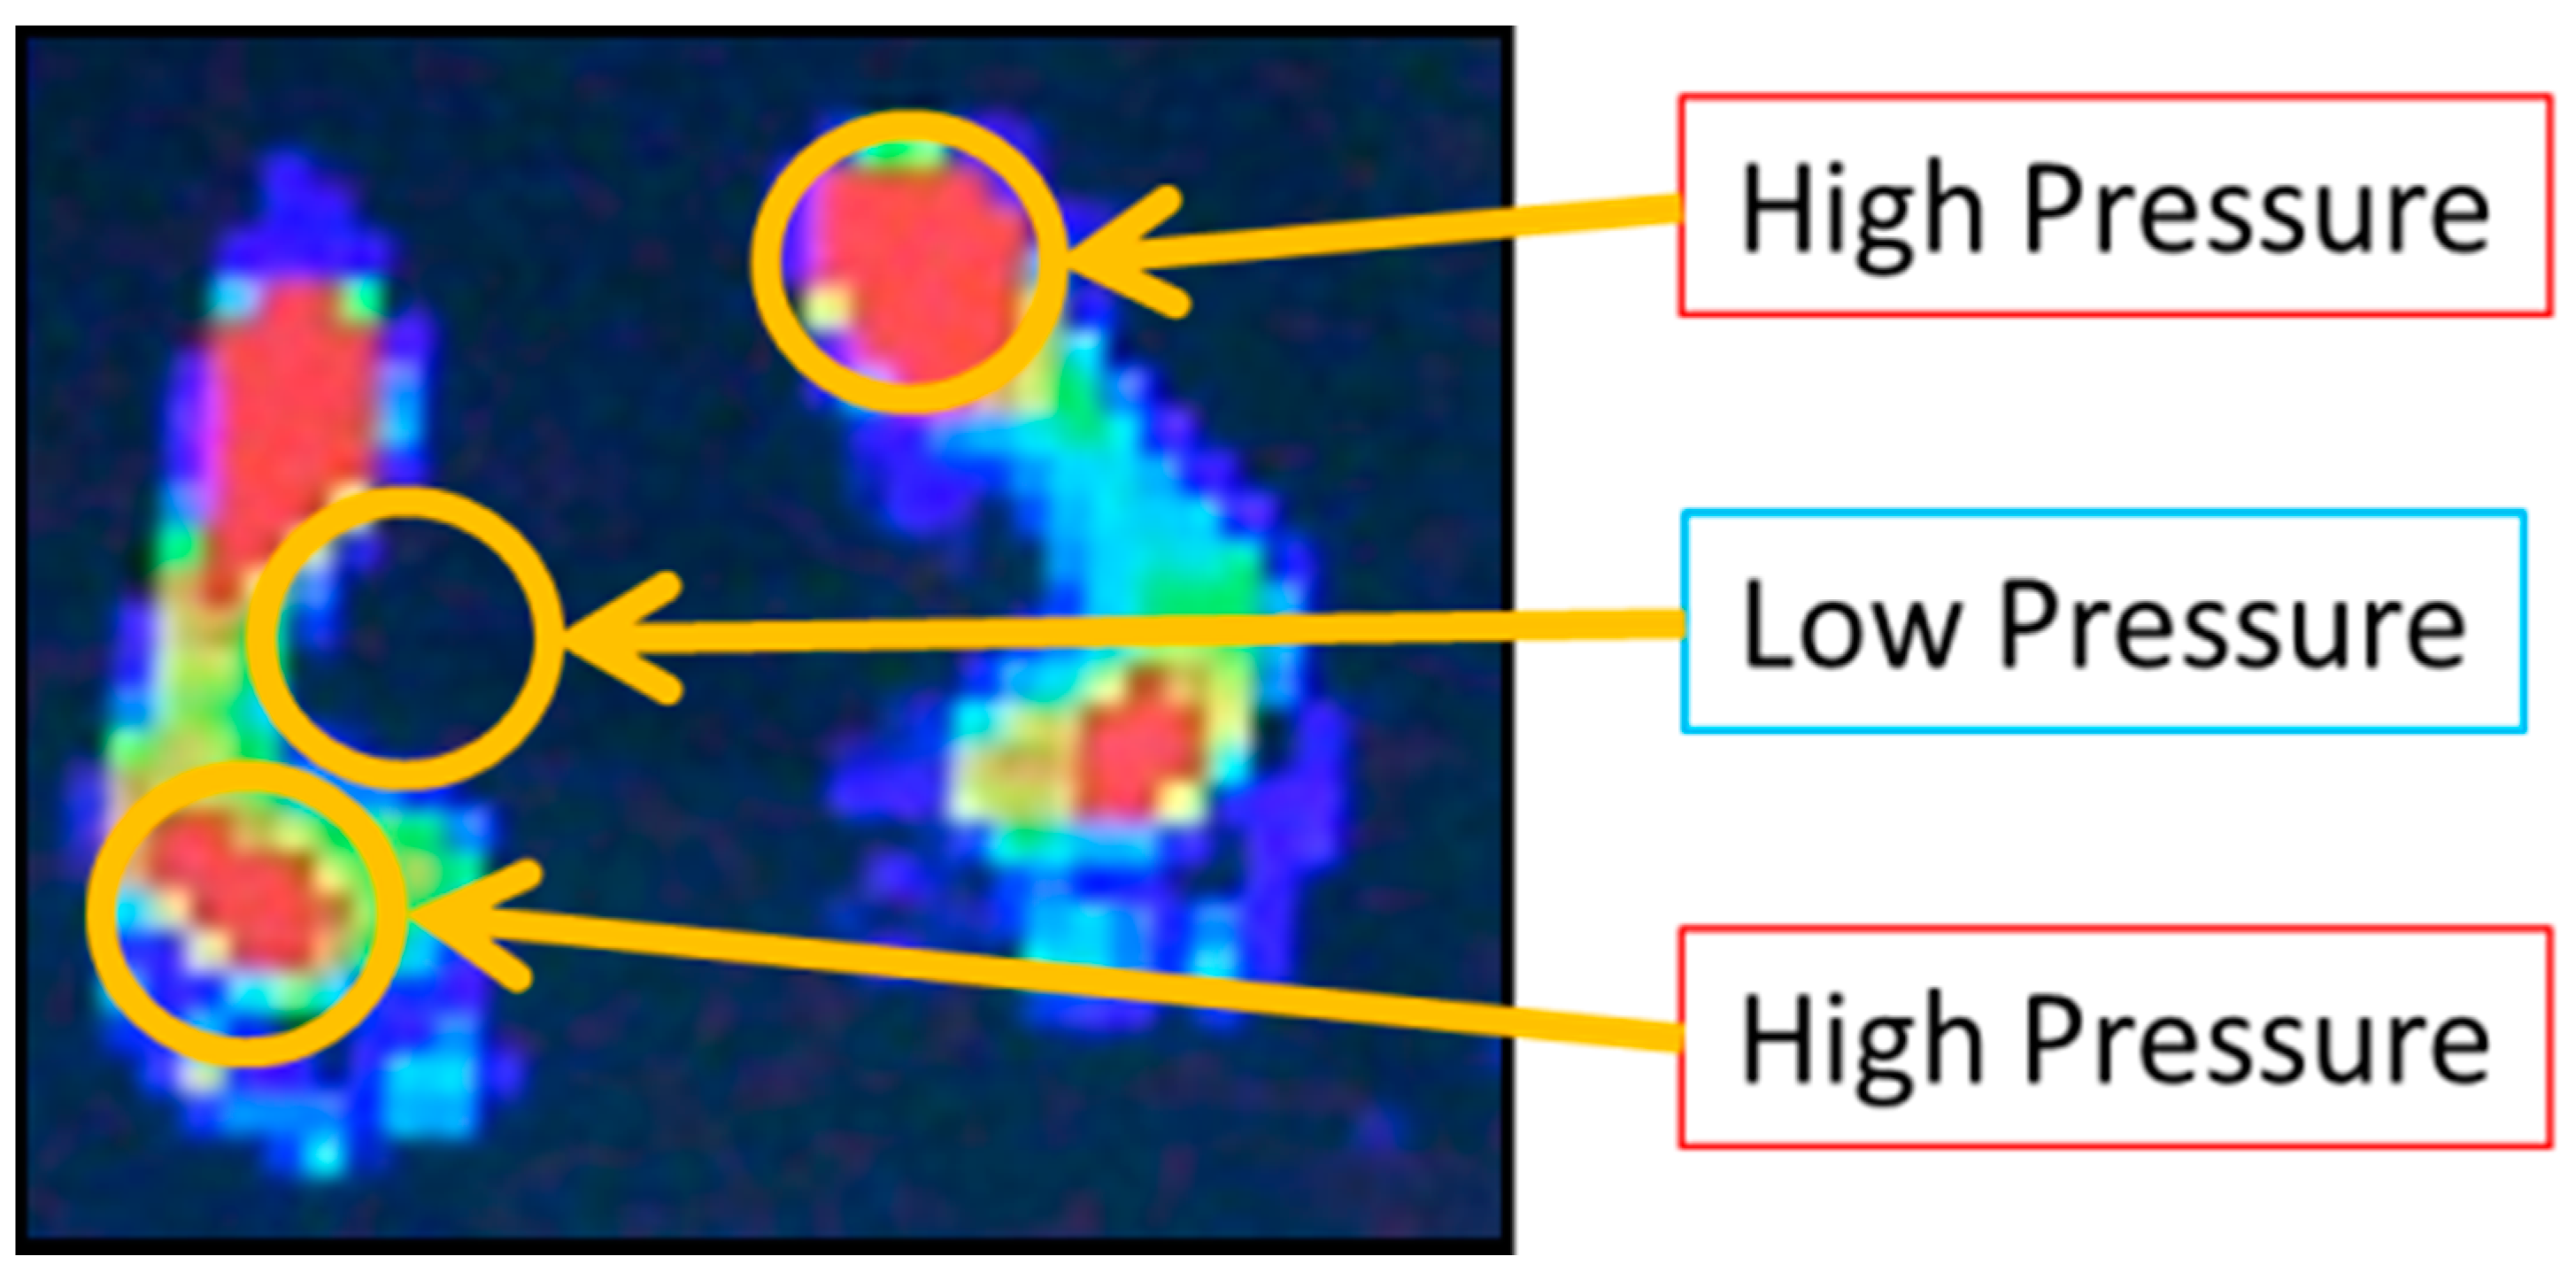
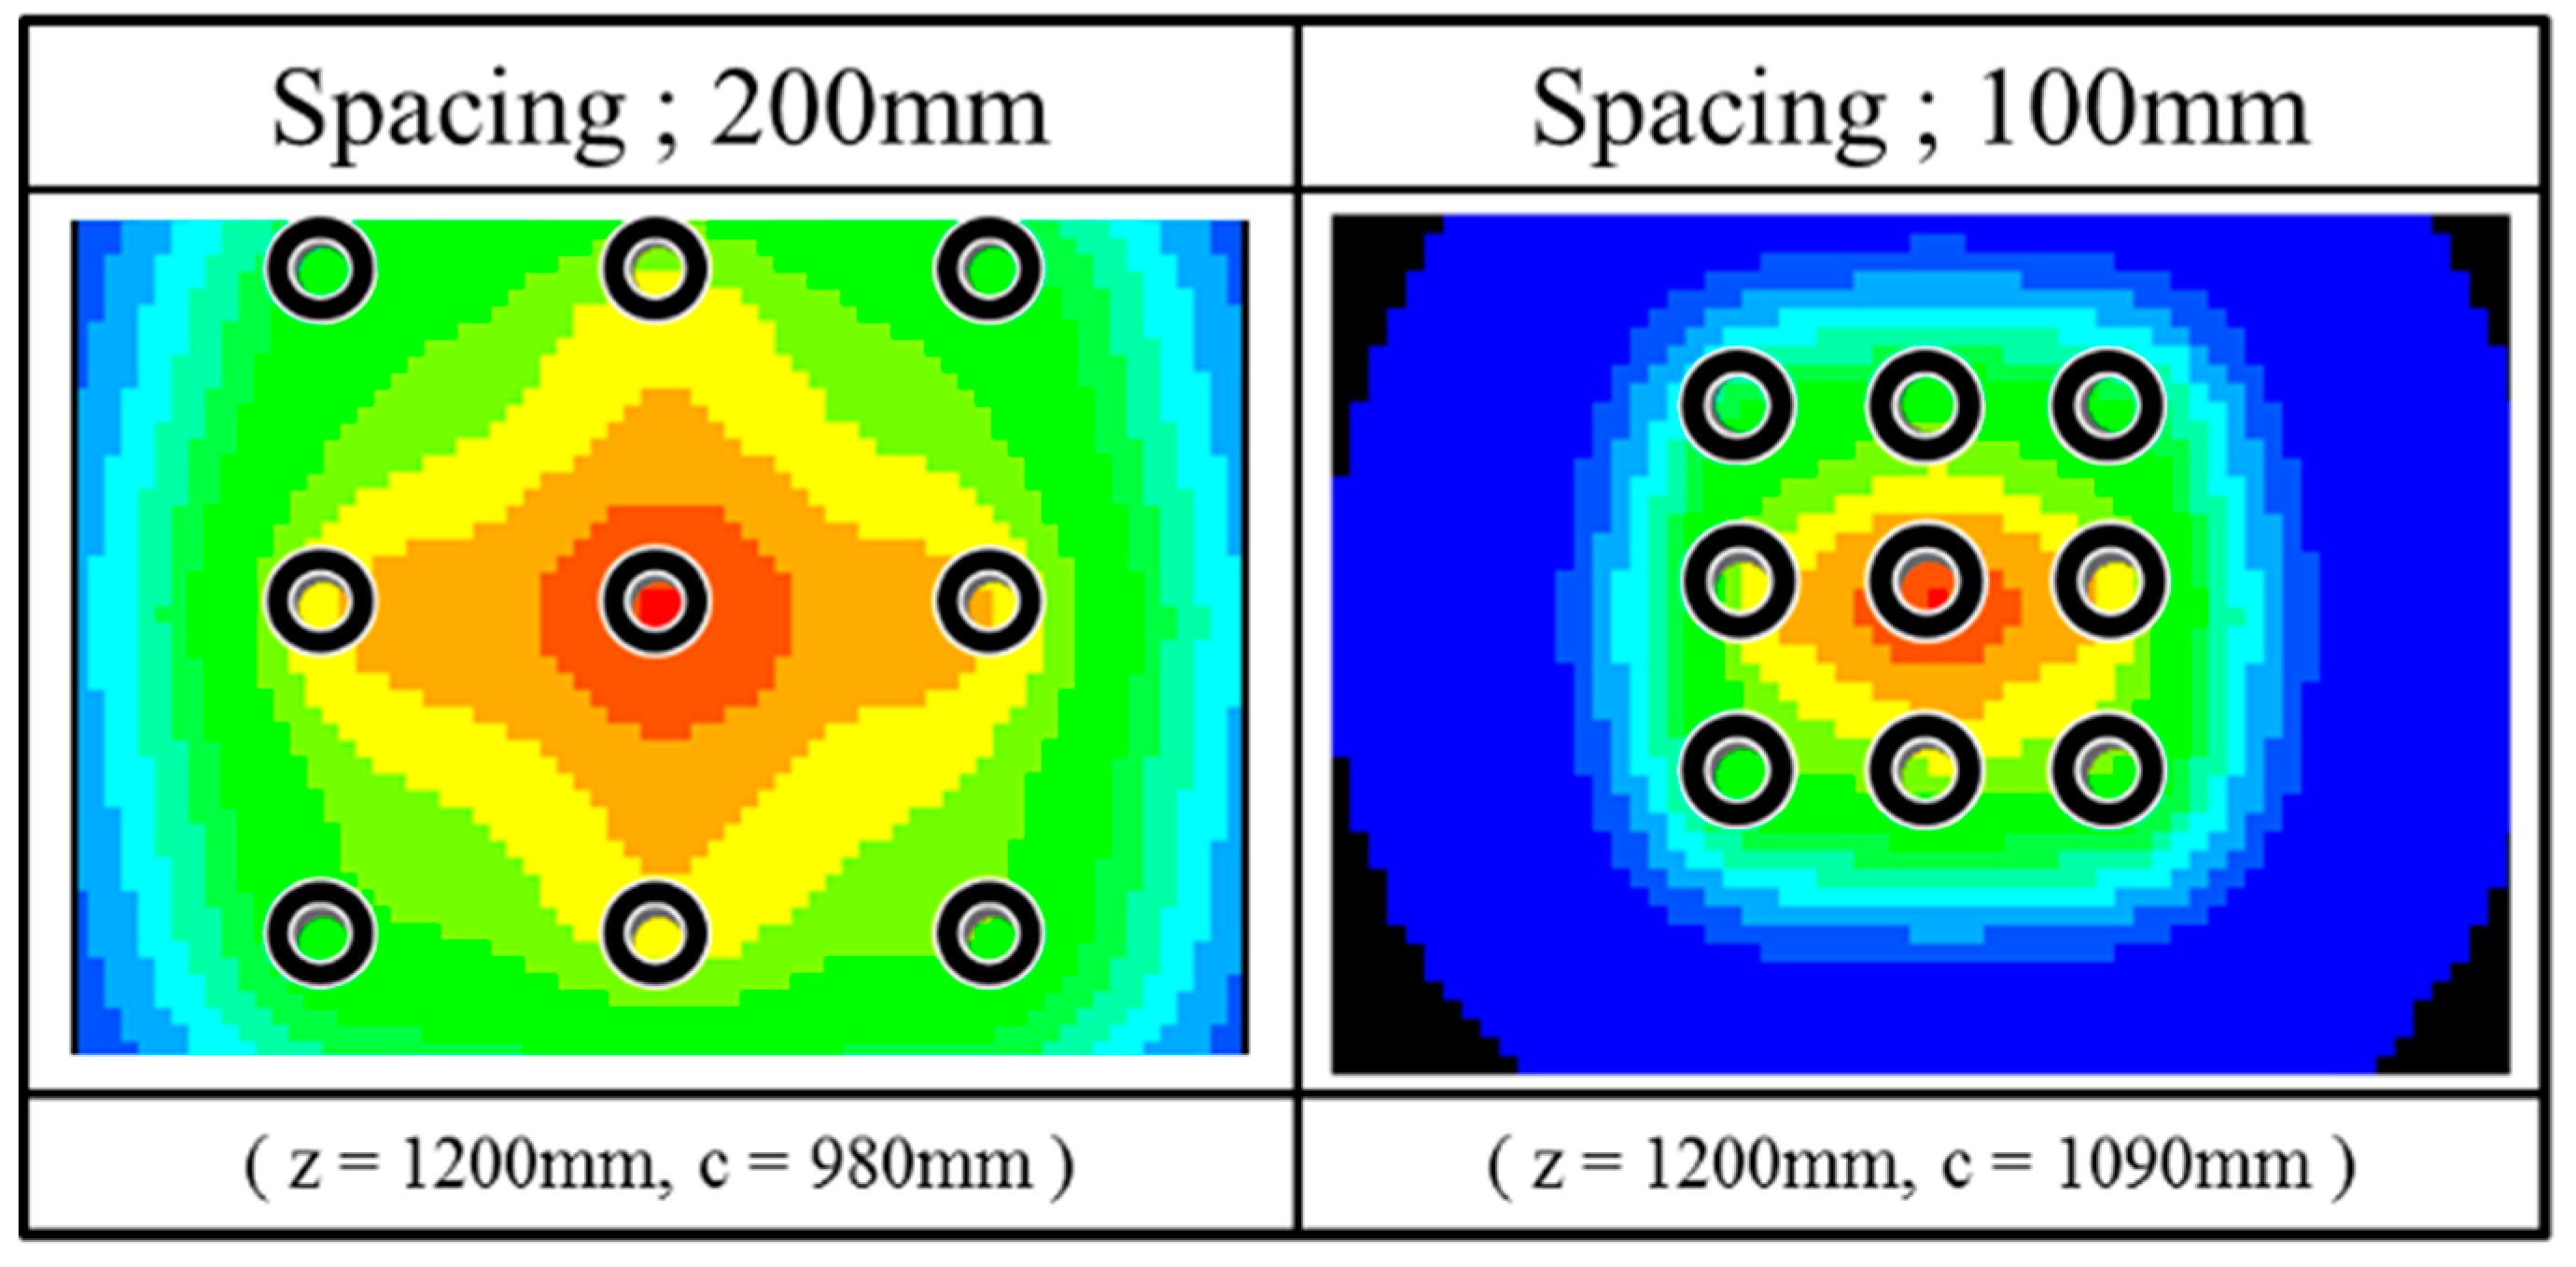
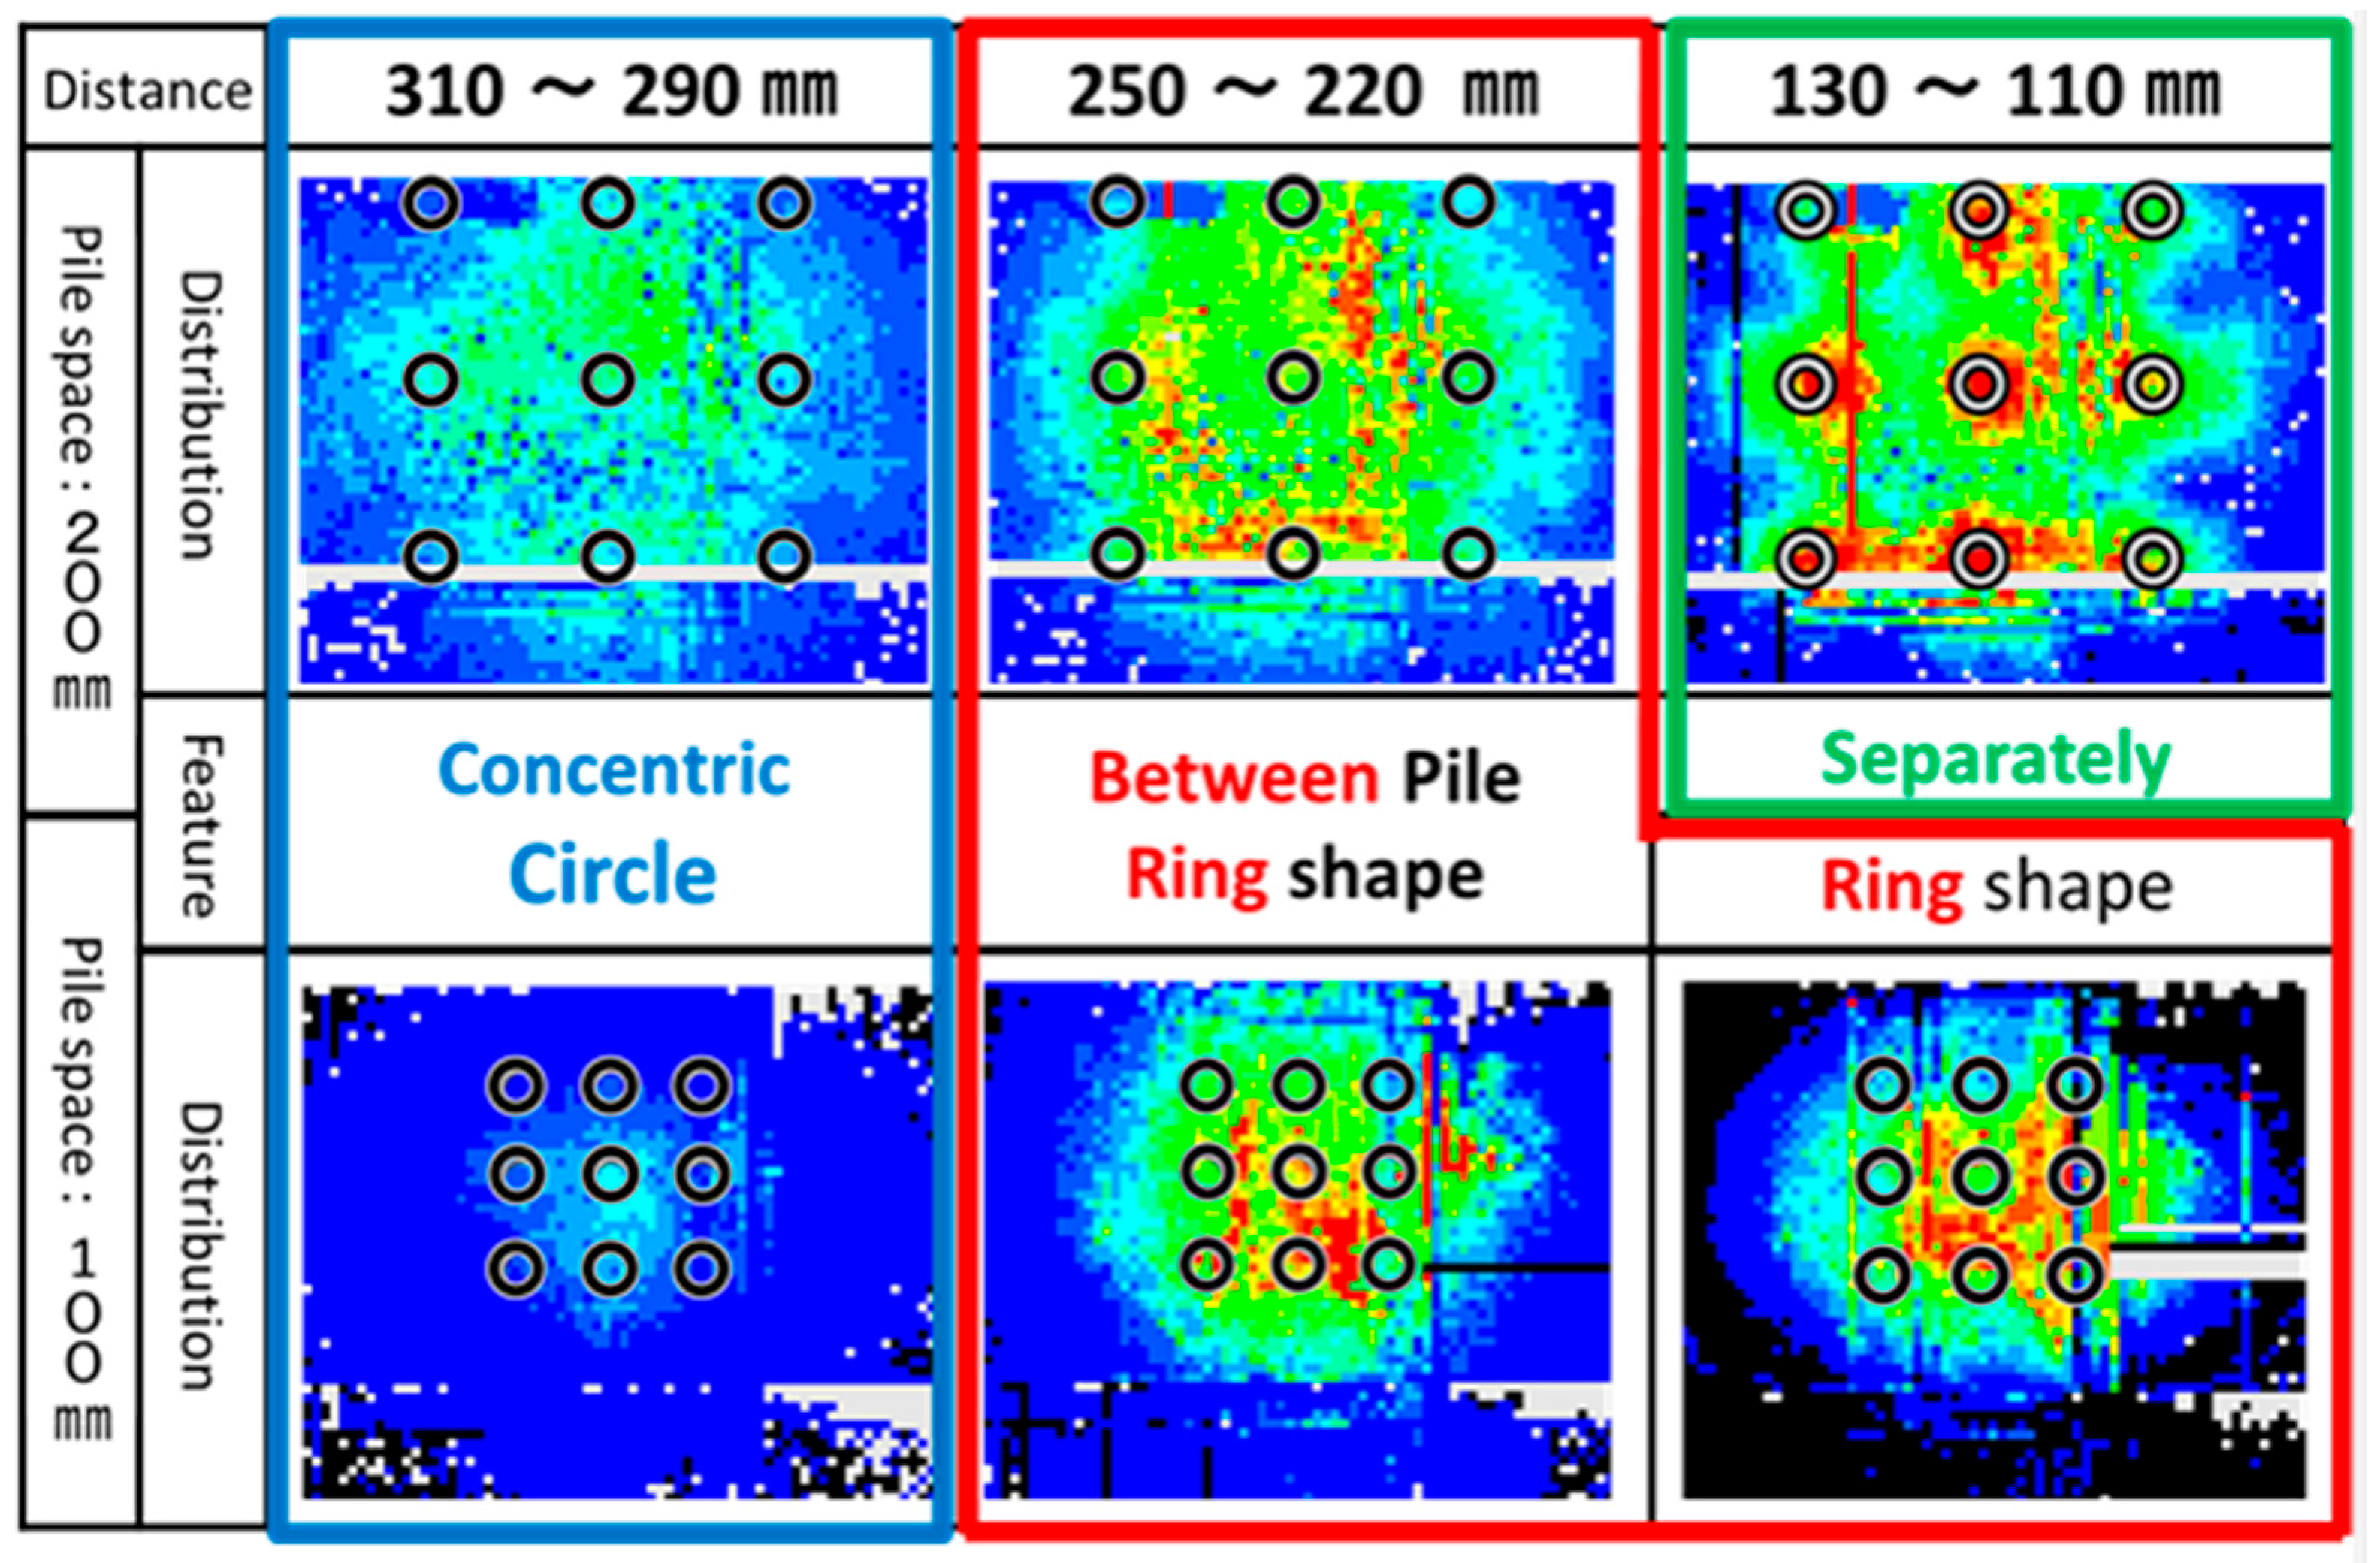
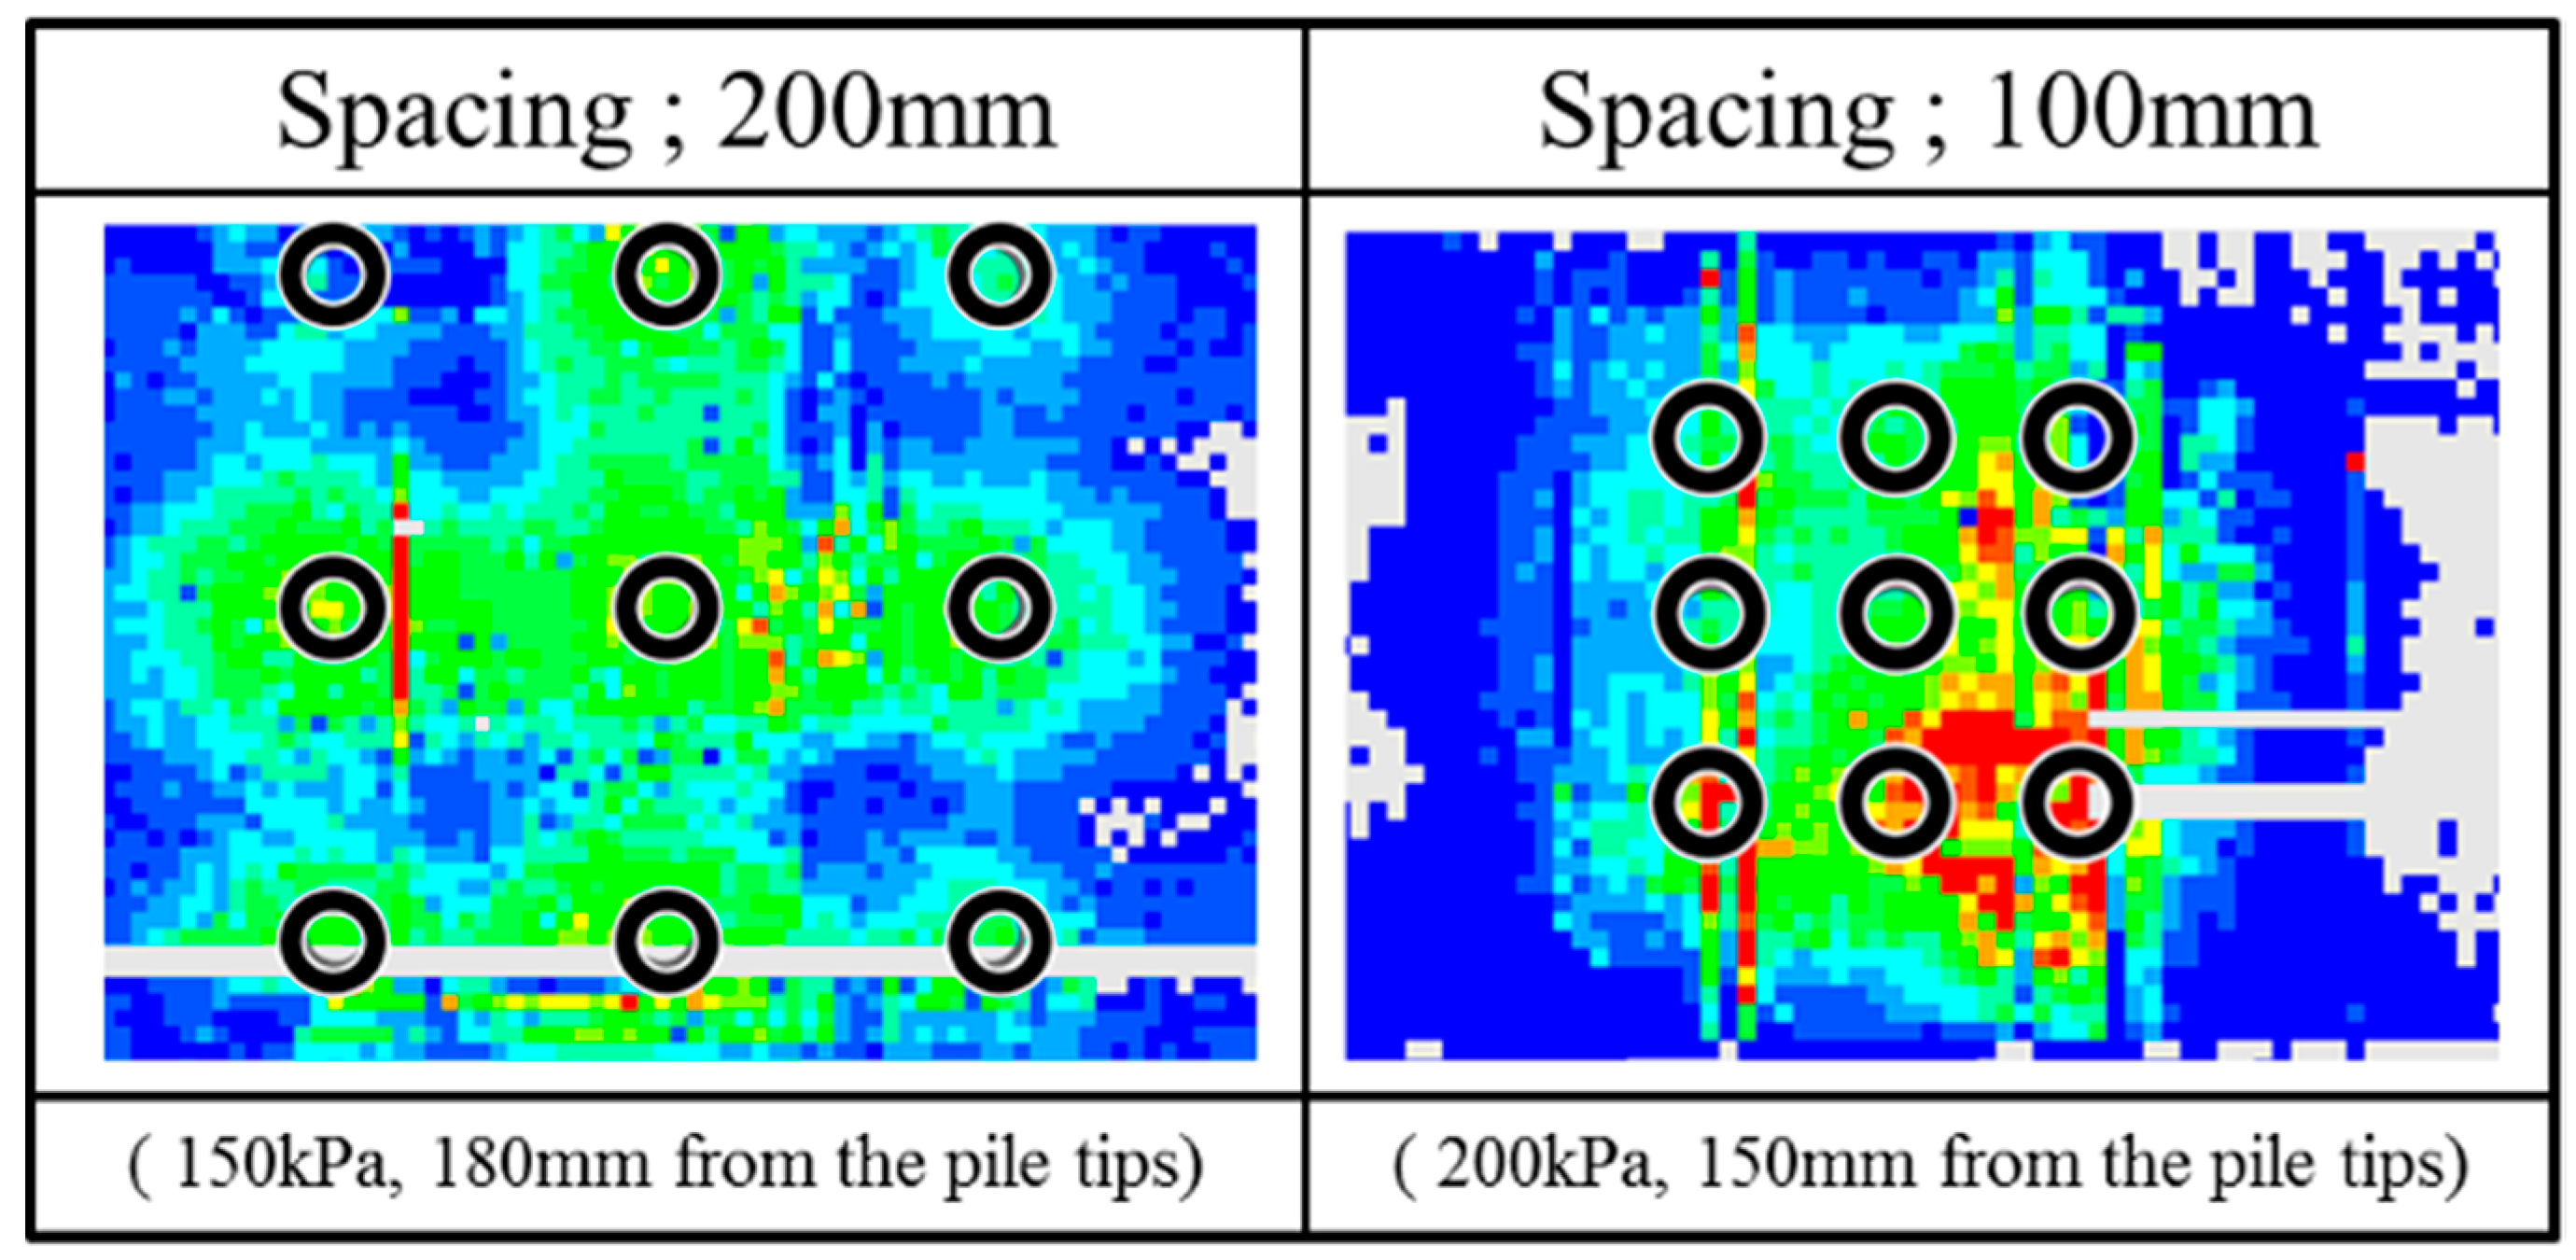
4.1.2. Vertical Pressure Distributions
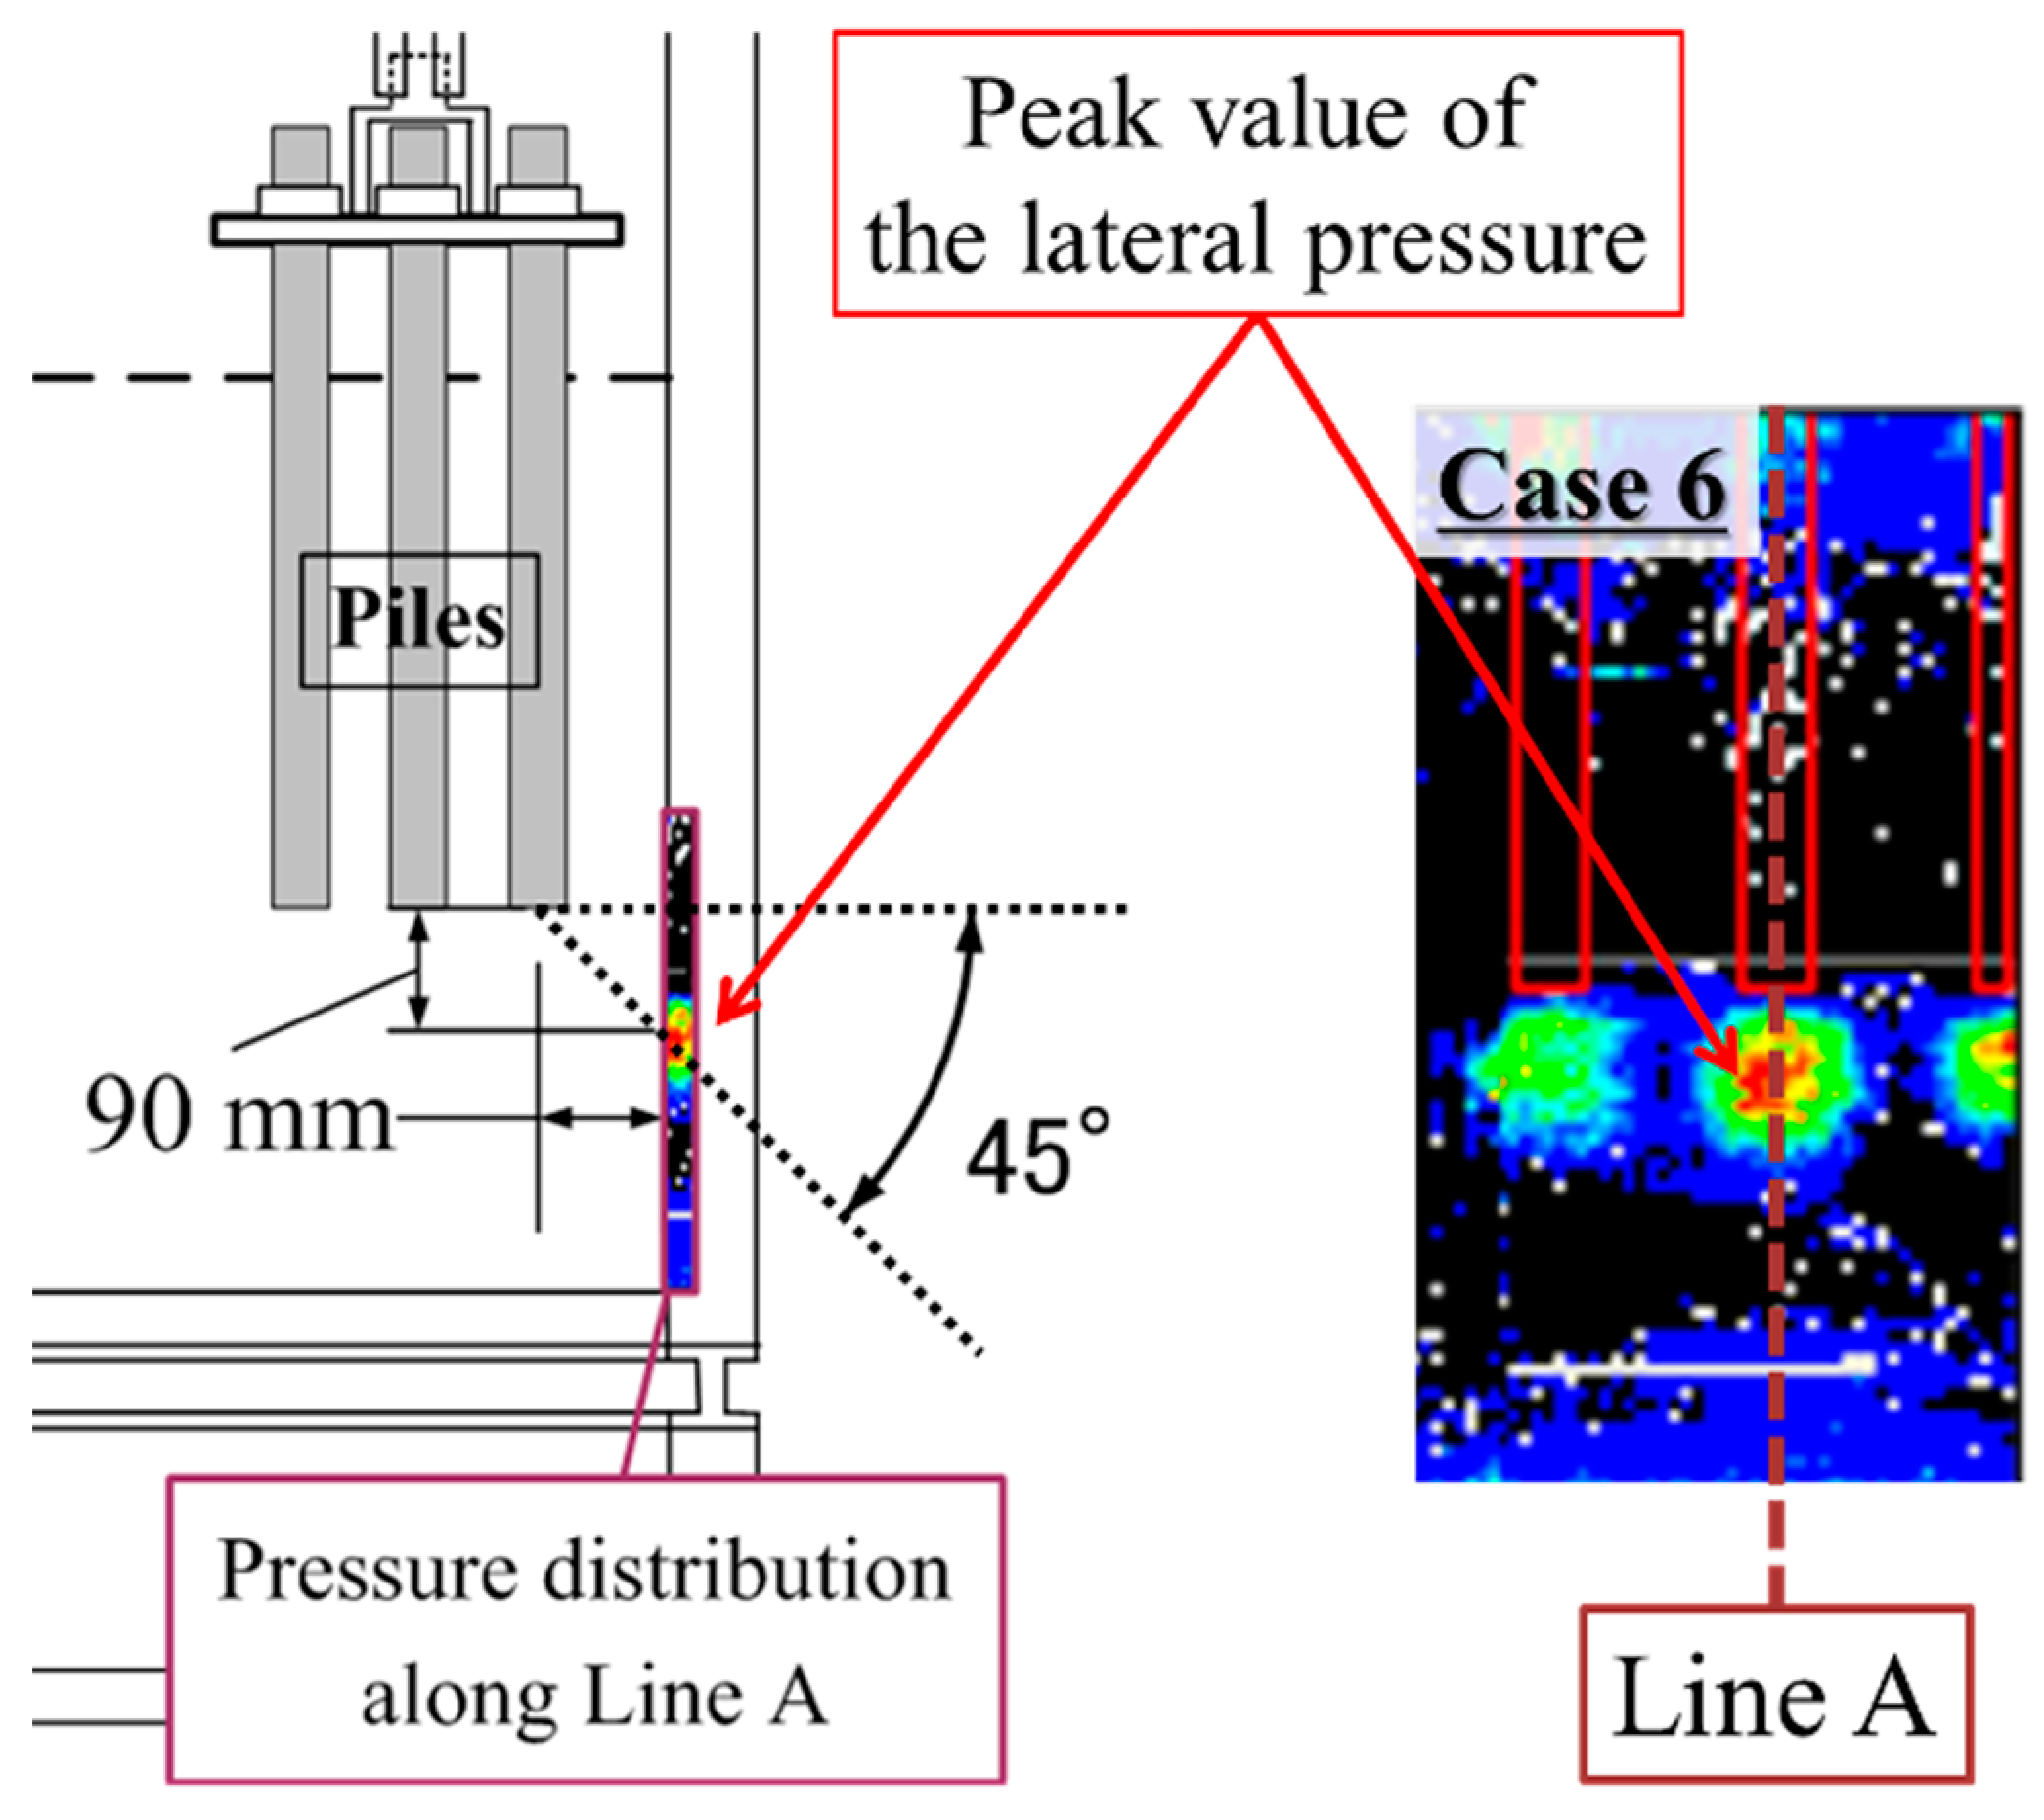
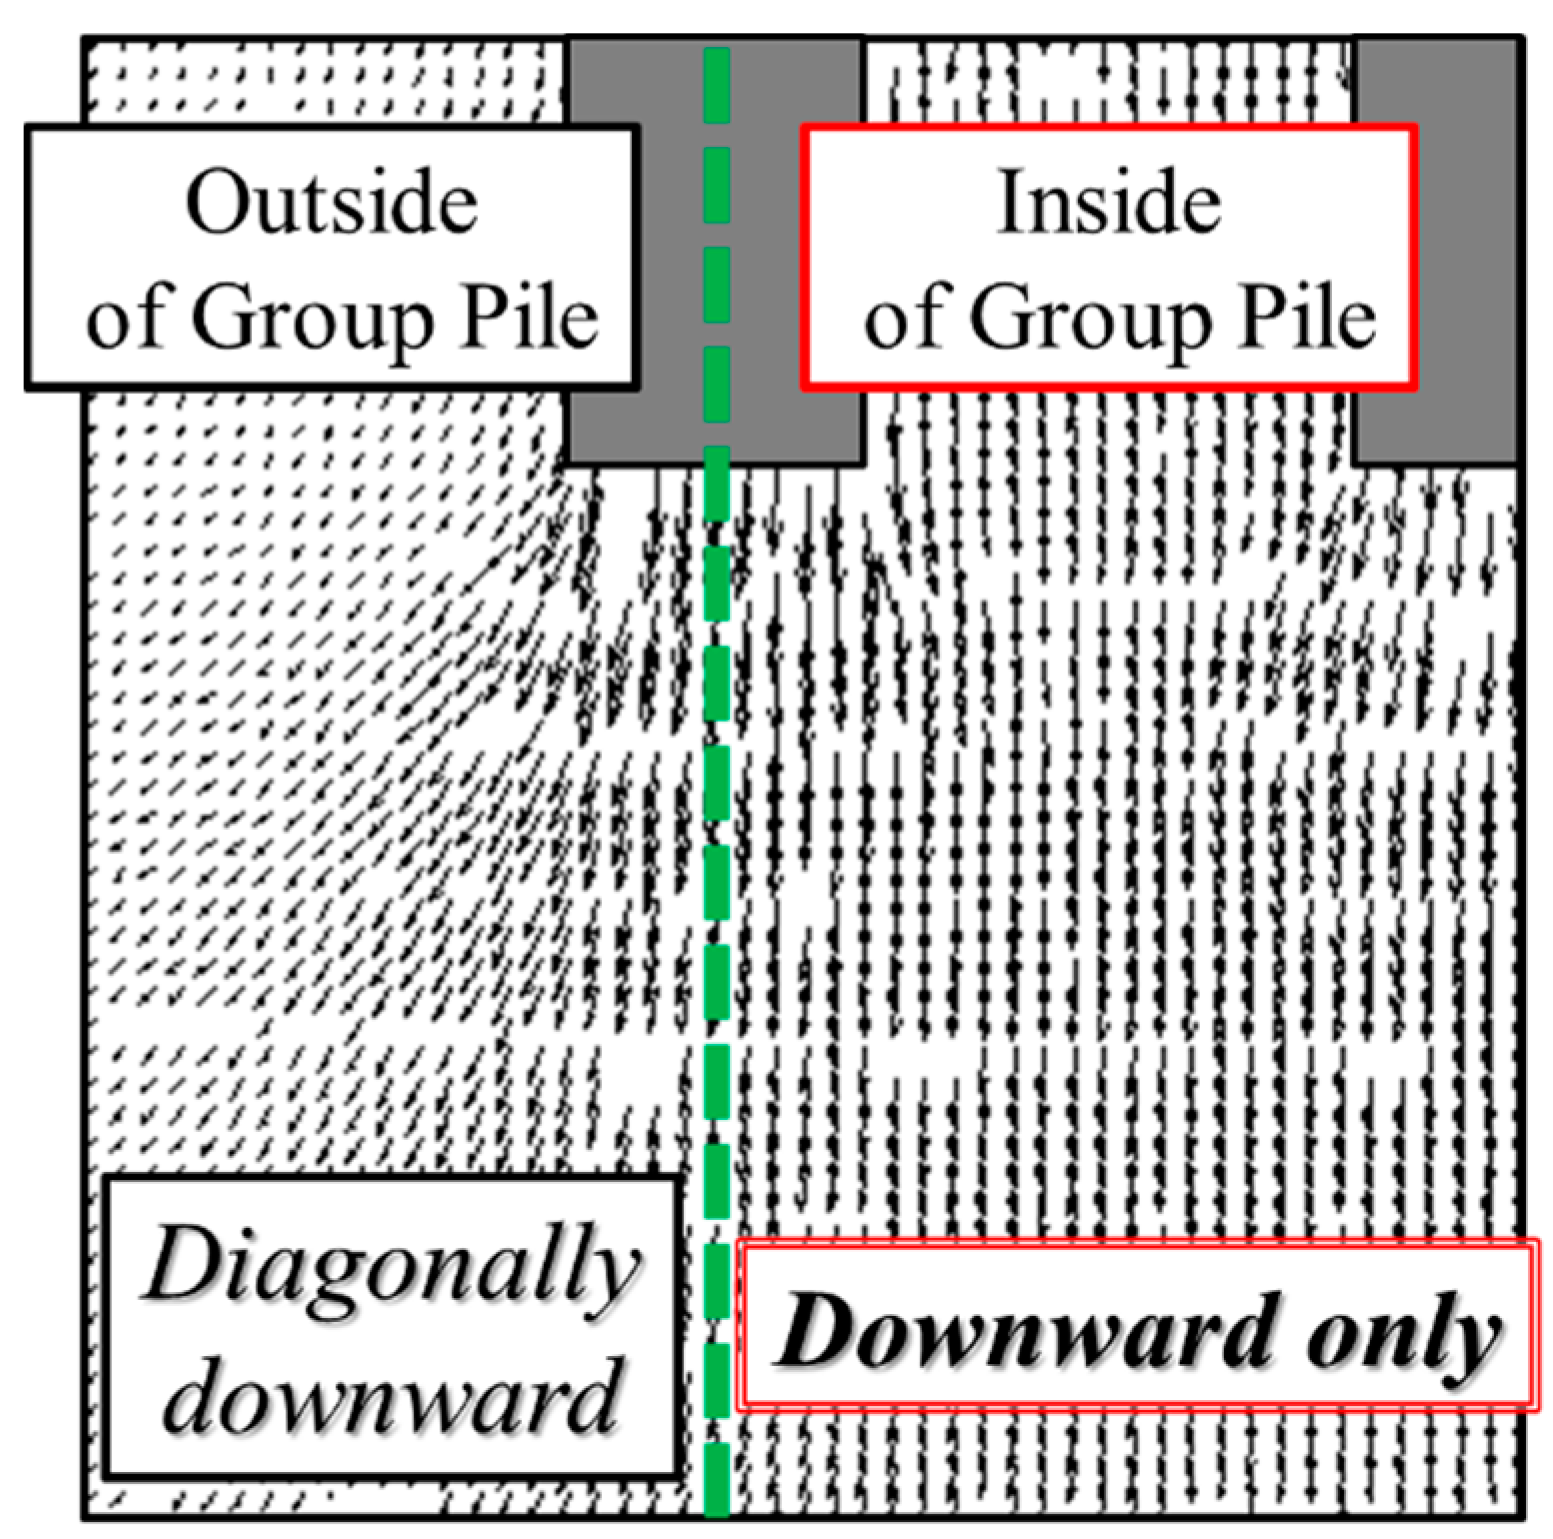
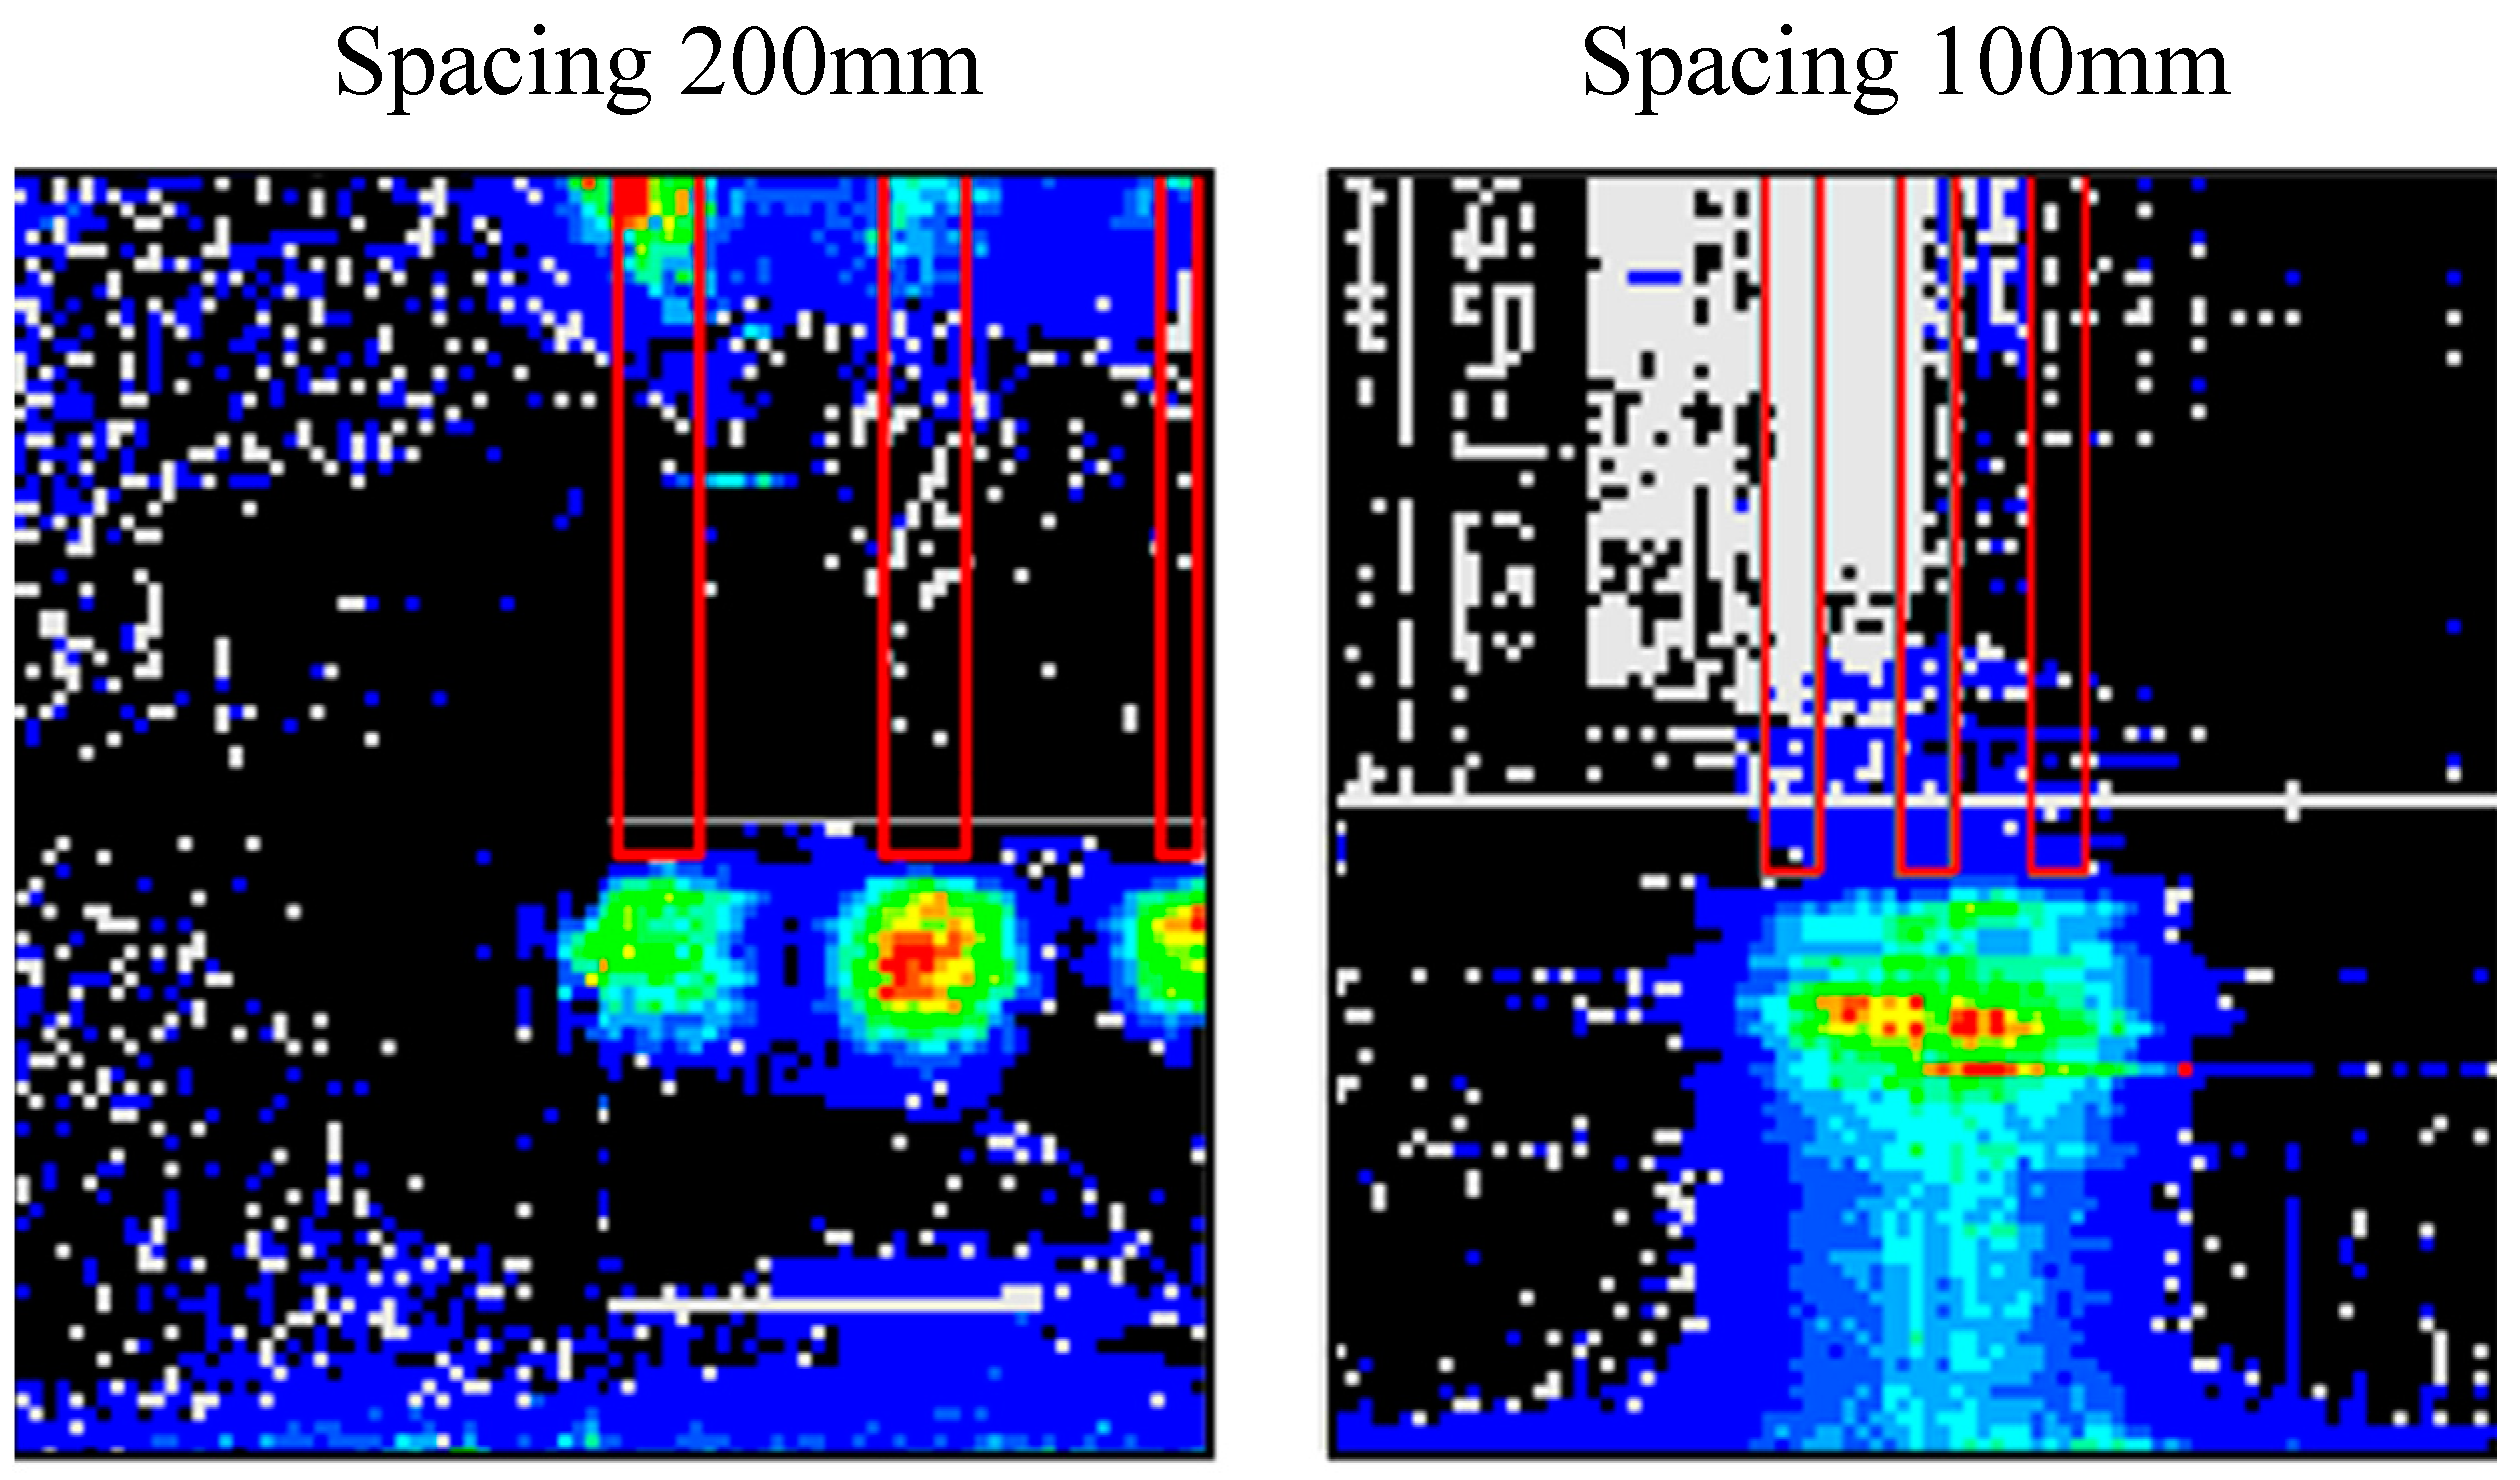
4.1.3. Horizontal Pressure Distributions
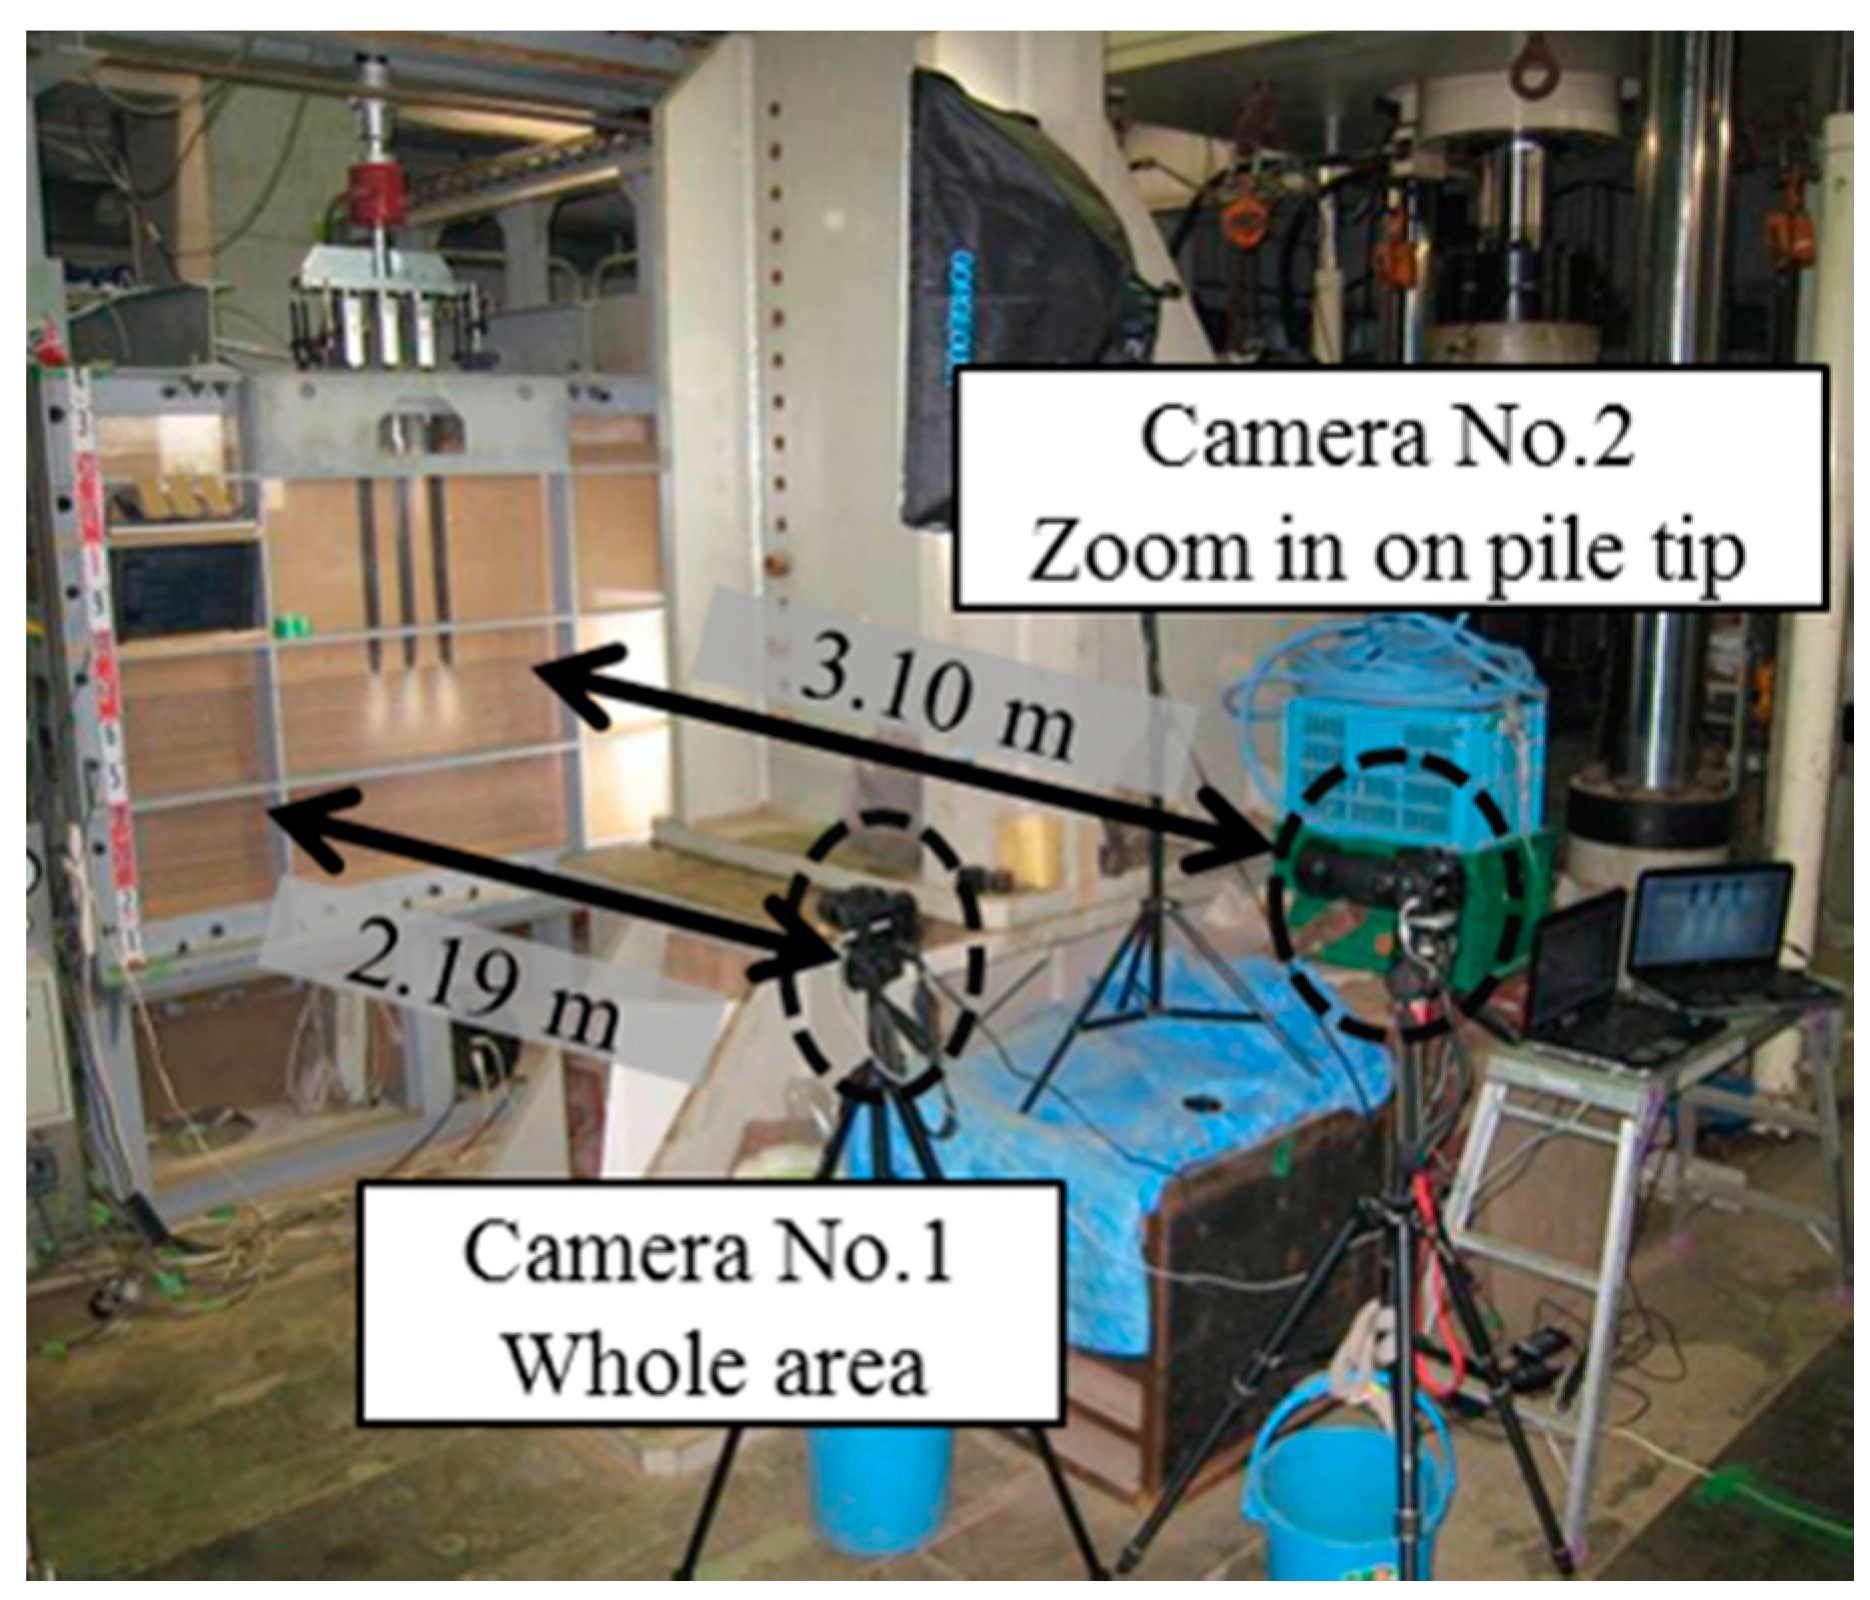
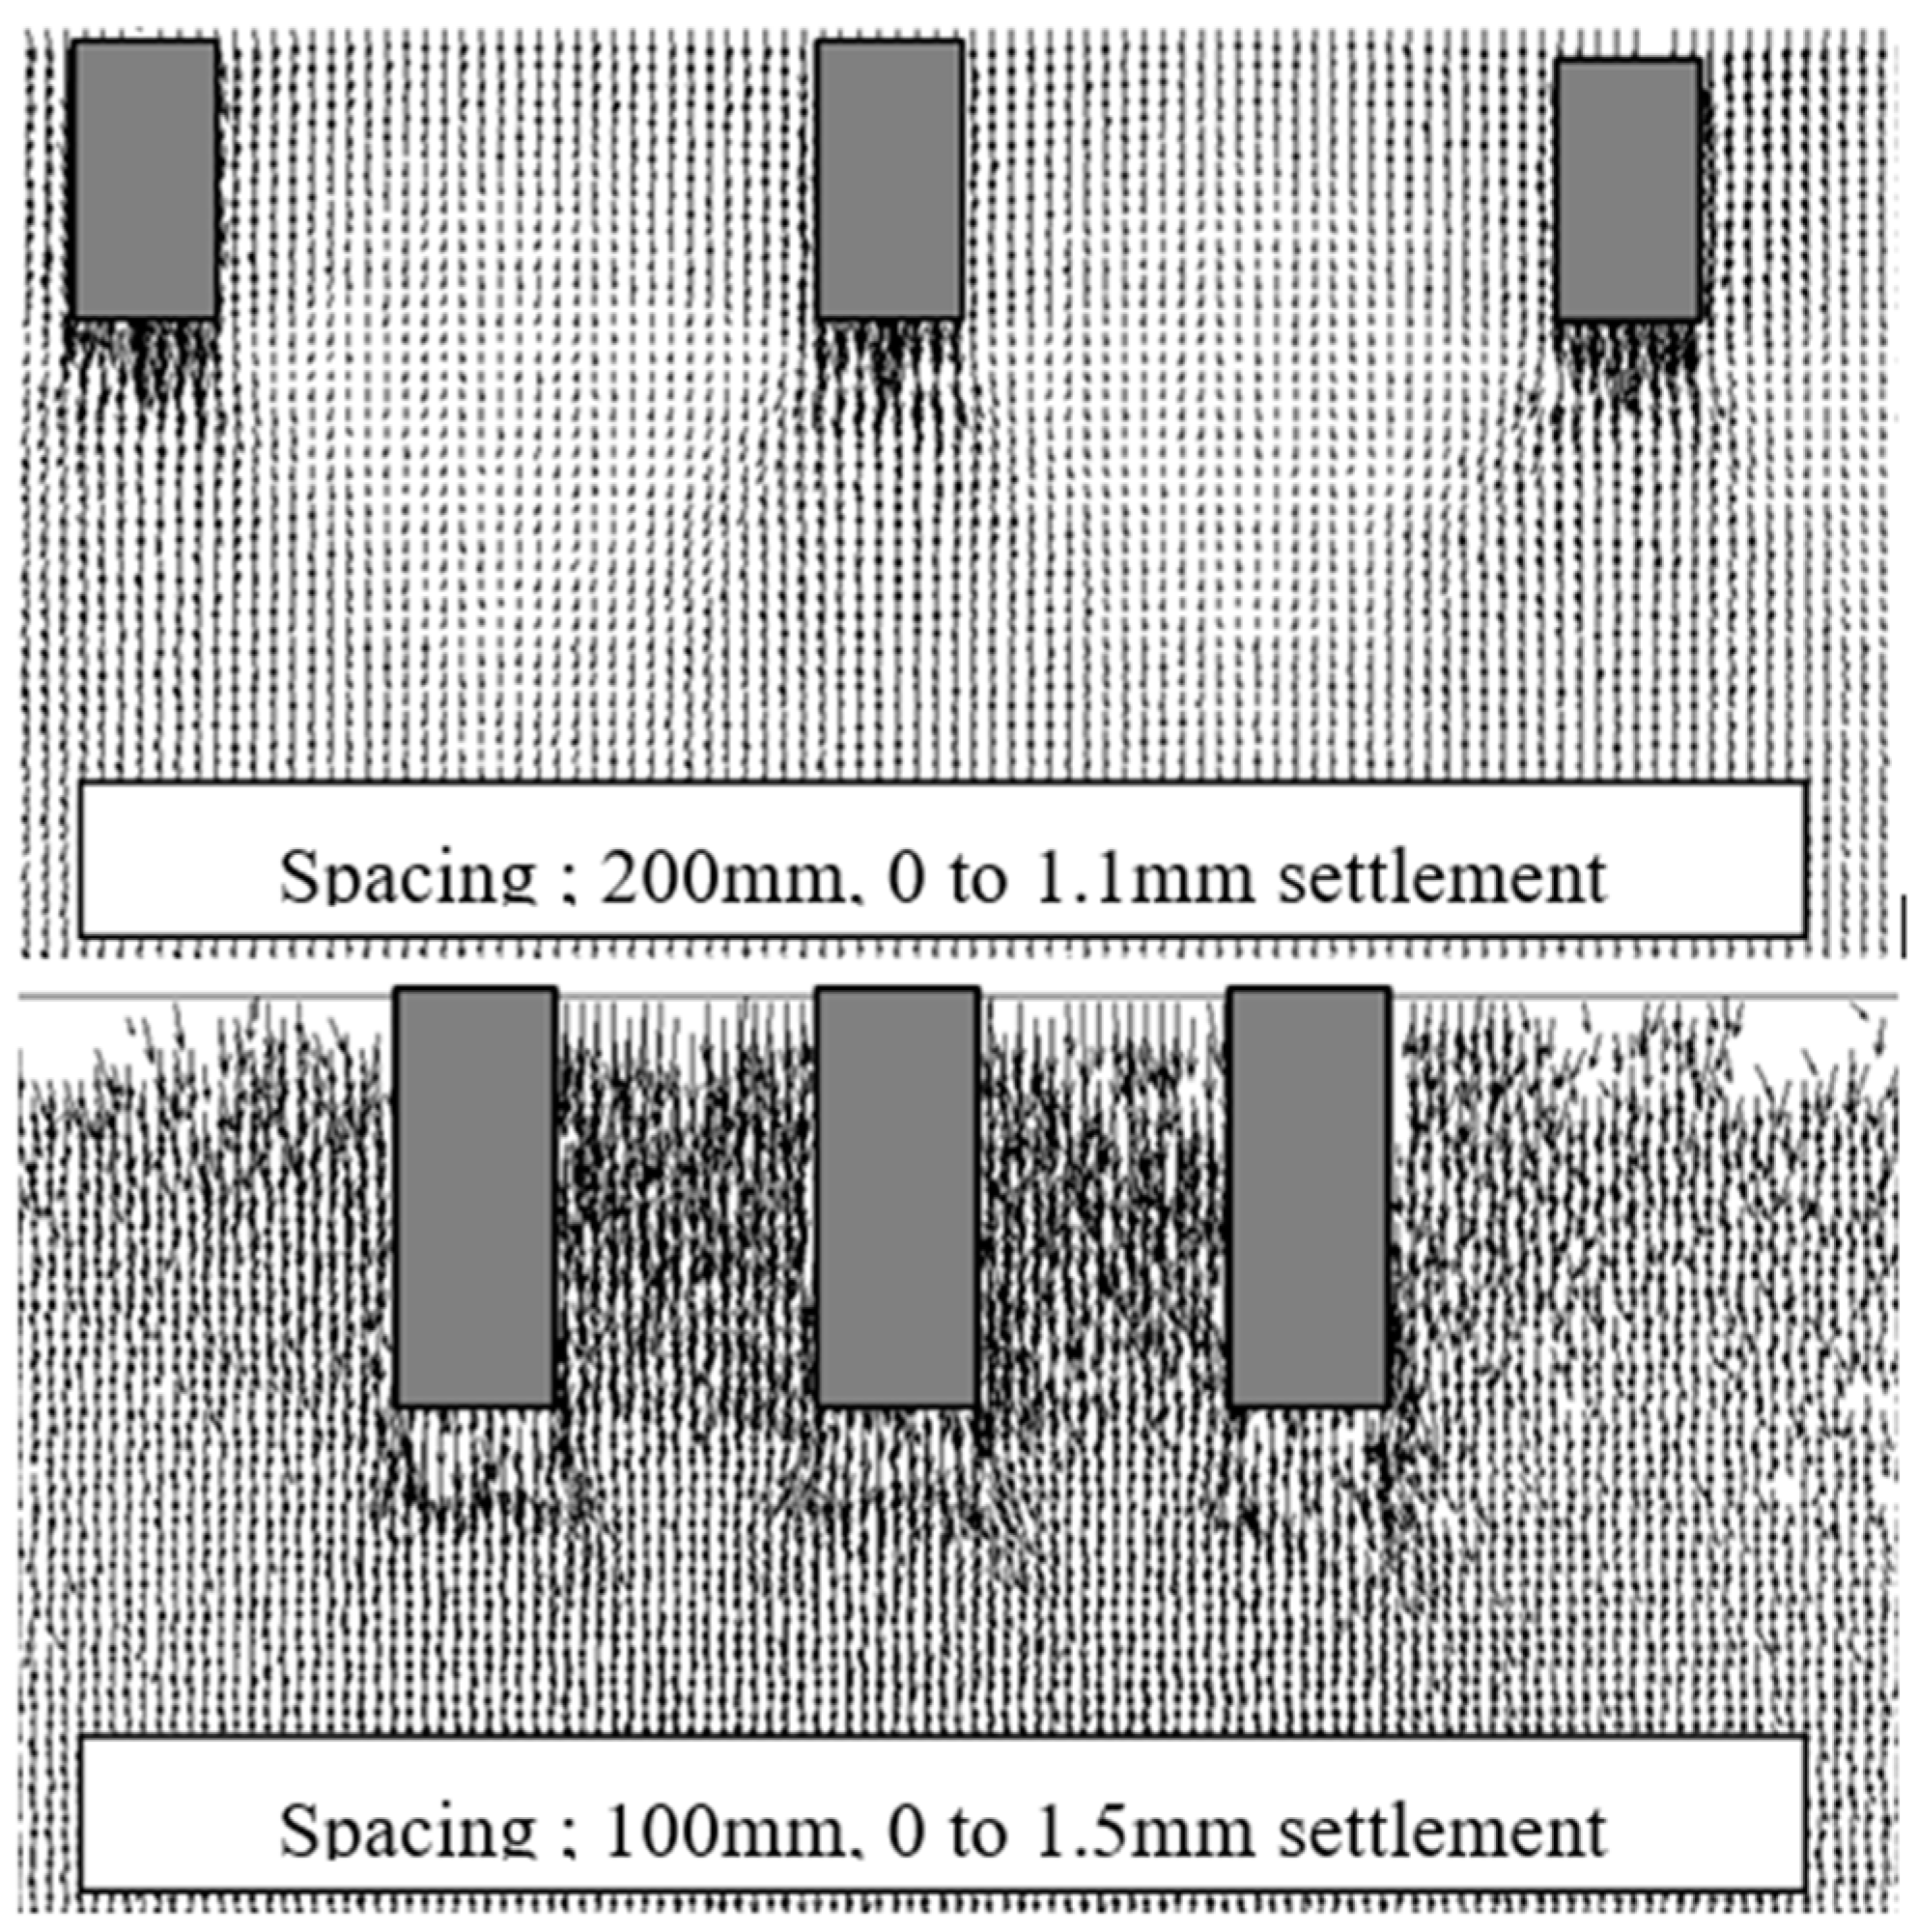
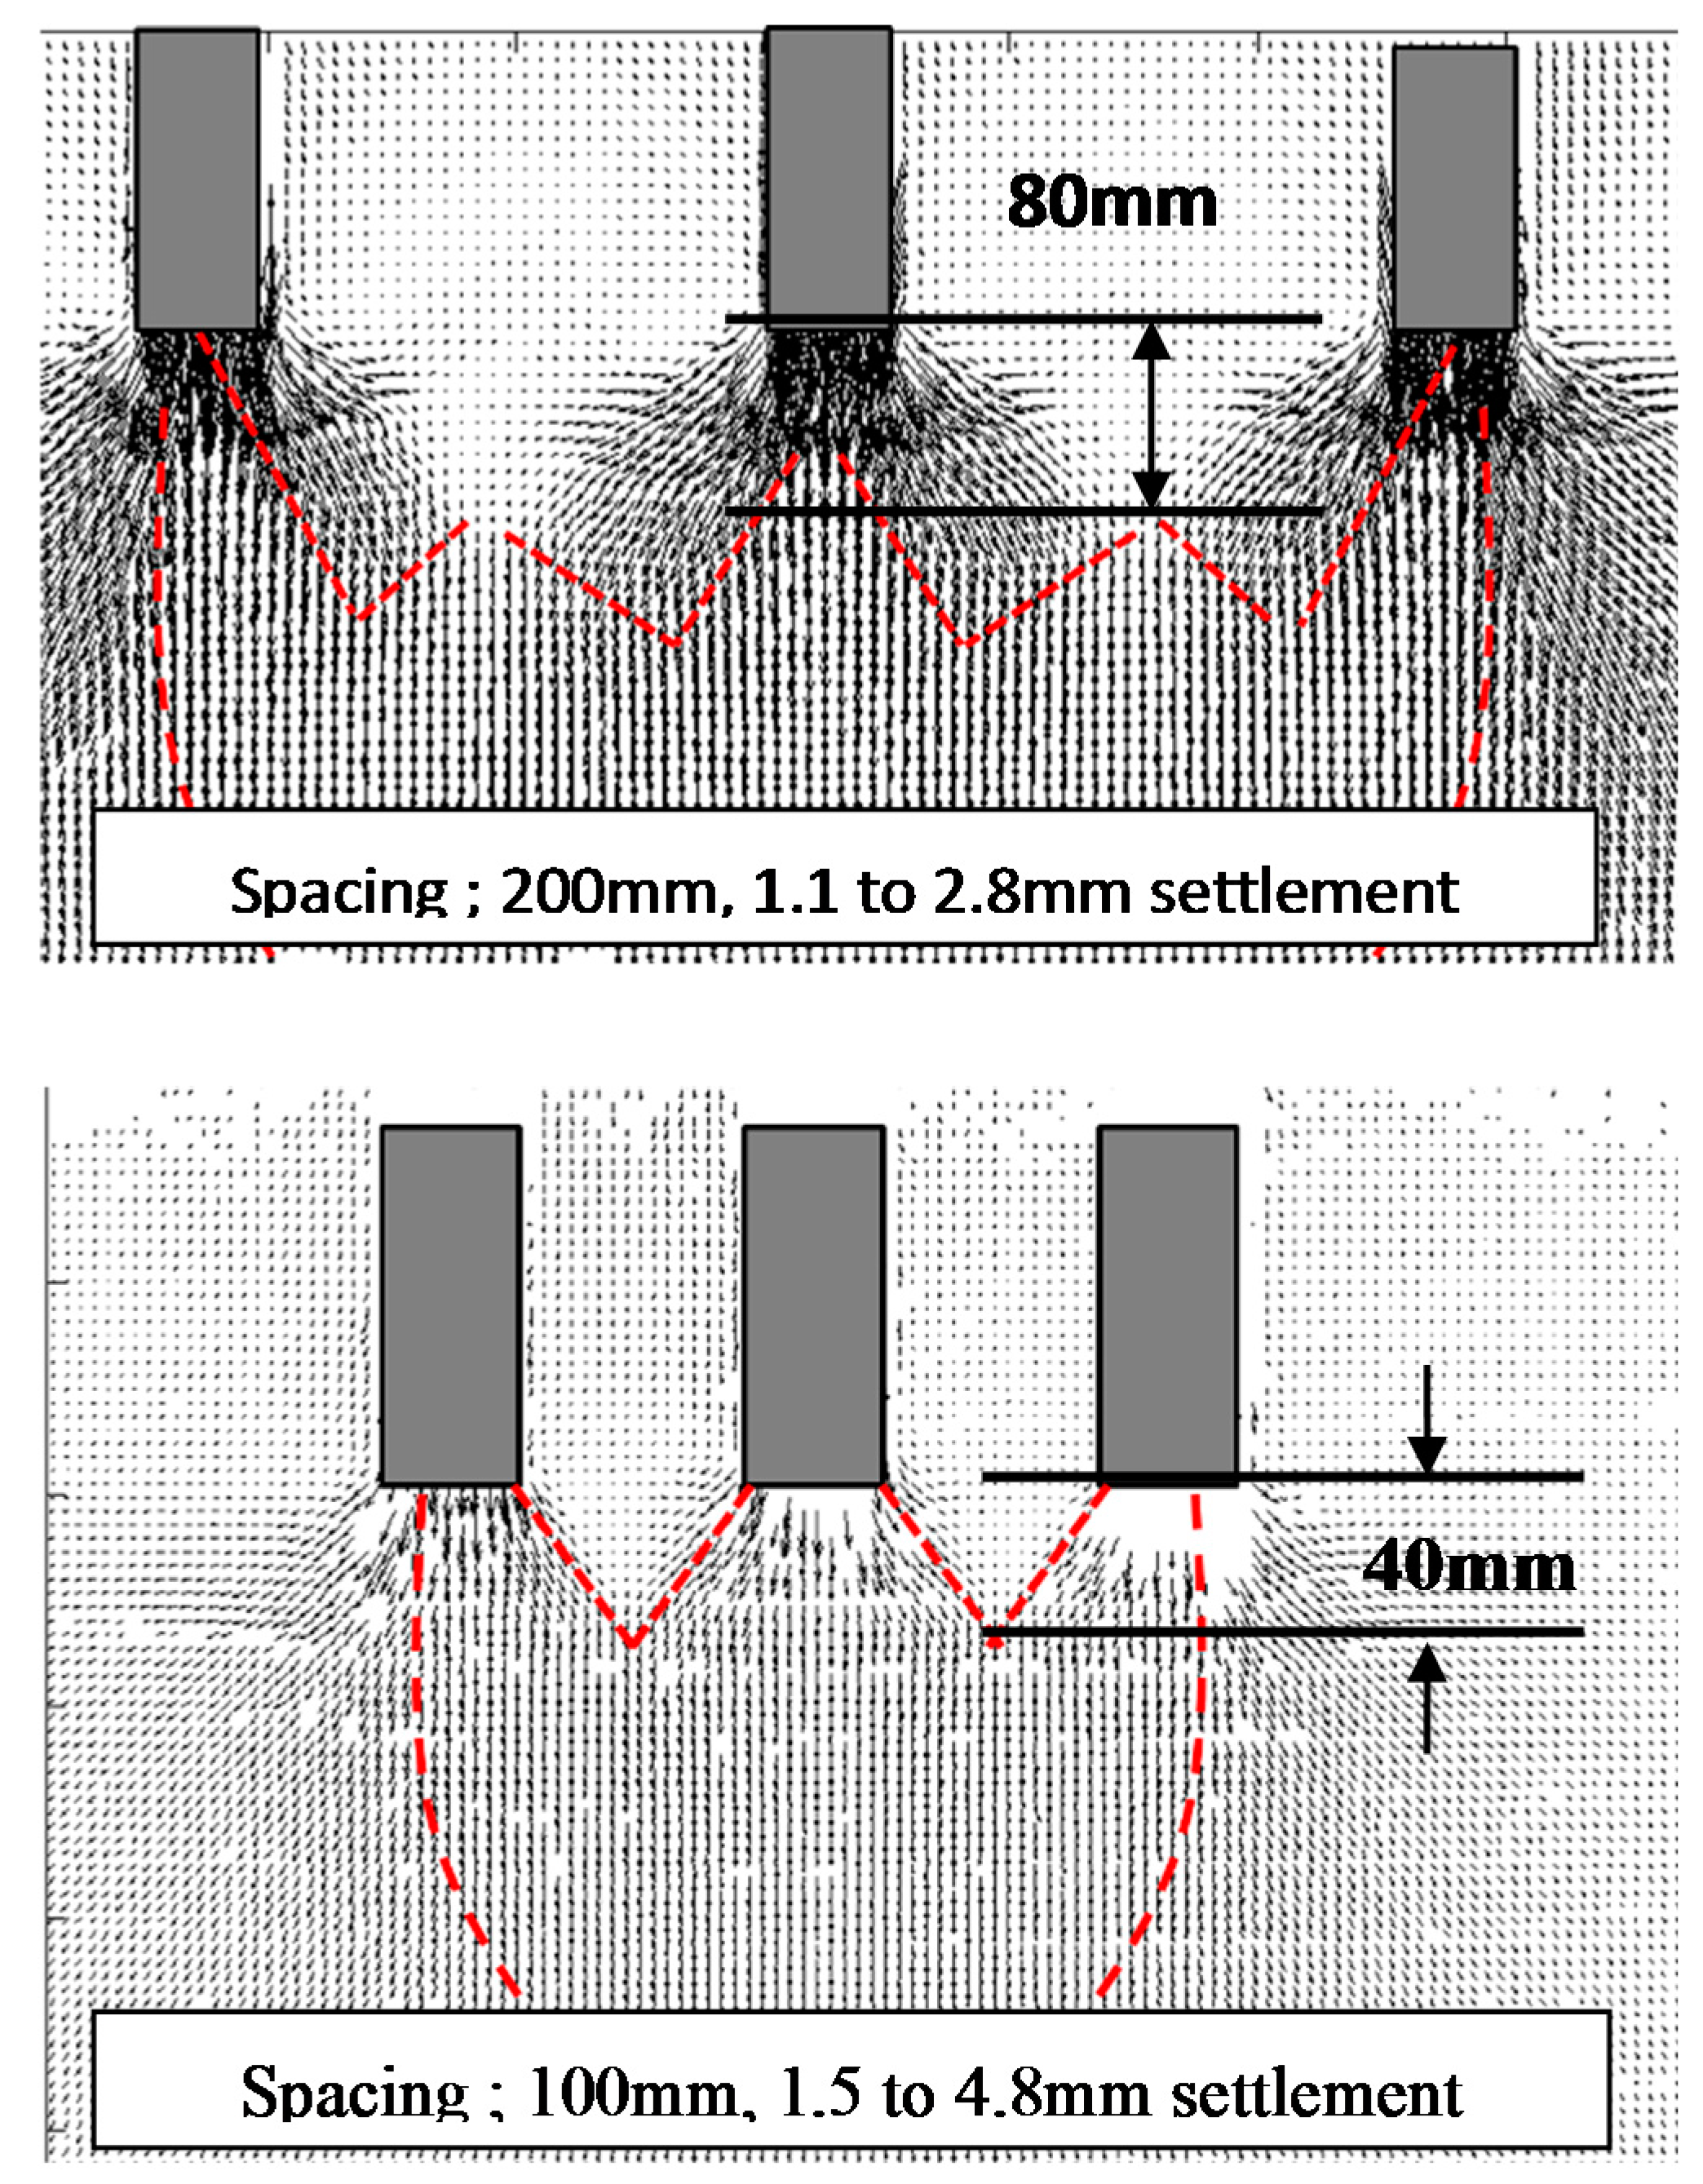
4.2. PIV Analysis
5. Conclusions
- (1)
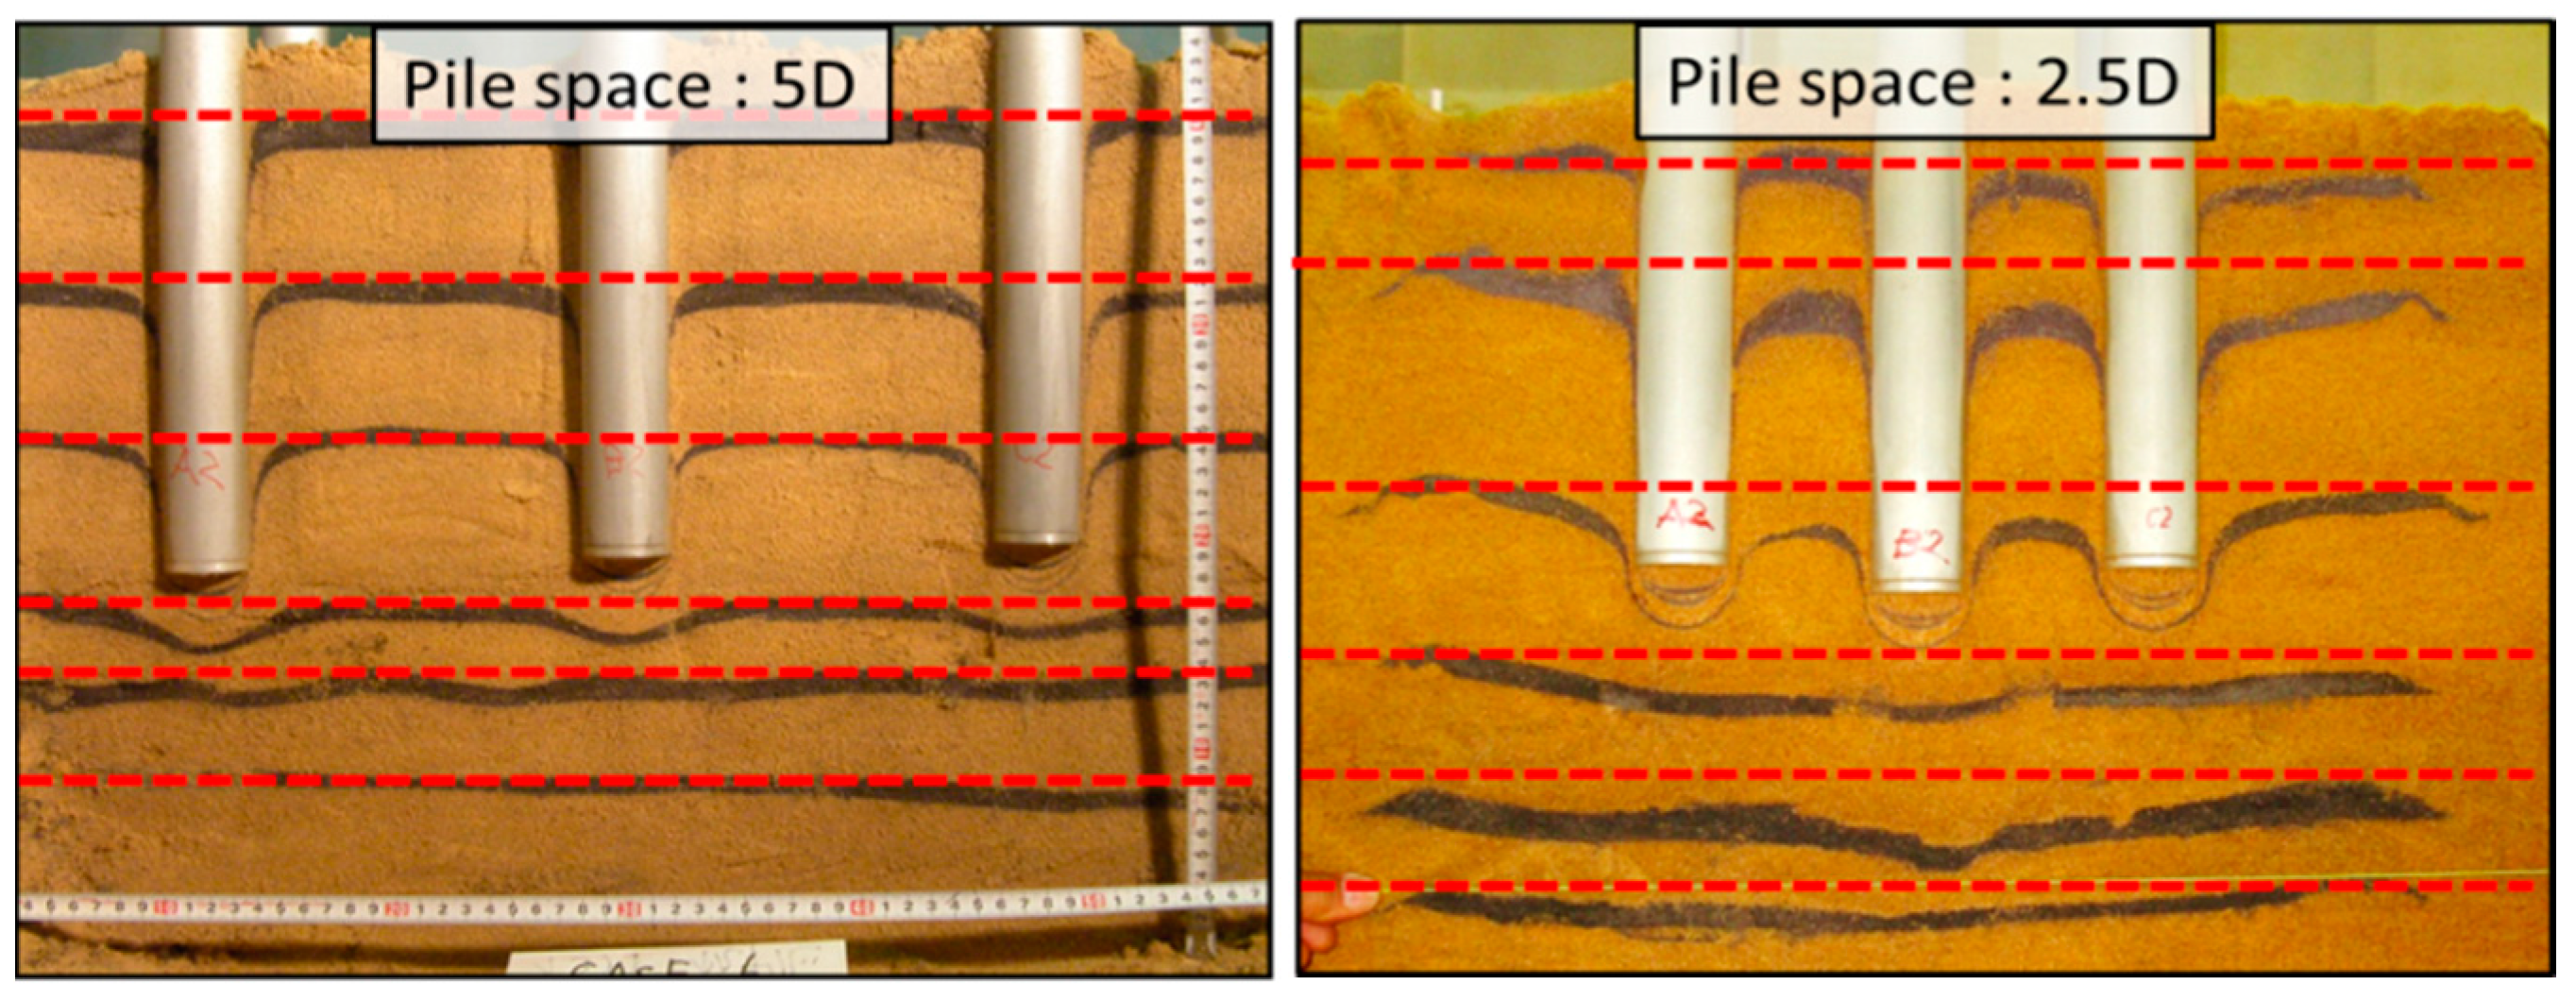
- For a narrow space pile space, a group pile yields at a larger displacement and the apportionment of tip resistance among piles changed depending on the penetration length. These behaviors are consistent with that of large diameter pile. This suggests that the group pile with narrow space works as one block.
- (2)
- Toroidal distribution was observed in the vertical pressure recorded by the tactile sensors. This form was not represented by simple superposition and implied the interaction of piles. This interaction would affect the behavior of a pile group as one block, if it occurred near the pile tip in case of the narrow spacing group pile.
- (3)
- A clumpy distribution was observed below the piles by the tactile sensors on the side wall in narrower spacing pile group. This support the point that the group pile with narrow space works as one block. Furthermore, the downward propagation of lateral pressure distribution was also measured in wider area at the narrow space. This suggests the large deformation under the same penetration length and the settlement stiffness will decrease in narrow spacing.
- (4)
- The consecutive ground deformation in a block way occurred in the elastic phase only in case of the group pile with narrow space. The interference of ground deformation affected the behavior of the group pile because the distance from the pile tips to the area was short enough.
Acknowledgments
Author Contributions
Conflicts of Interest
References
- O’Neill, M.W.; Hawkins, R.A.; Mahar, L.J. Load transfer mechanisms in piles and pile groups. J. Geotech. Eng. Div. ASCE 1982, 108, 1605–1623. [Google Scholar]
- Randolph, M.F. Science and empiricism in pile foundation design. Géotechnique 2003, 53, 847–875. [Google Scholar] [CrossRef]
- Comodromos, E.M. Response evaluation of axially loaded fixed head pile groups using 3D nonlinear analysis. Soils Found. 2004, 44, 31–39. [Google Scholar] [CrossRef]
- Conte, E.; Troncone, A.; Vena, M. Behaviour of flexible piles subjected to inclined loads. Comput. Geotech. 2015, 69, 199–209. [Google Scholar] [CrossRef]
- Leung, Y.F.; Klar, A.; Soga, K. Theoretical study on pile length optimization of pile groups and piled rafts. J. Geotech. Geoenviron. Eng. 2009, 136, 319–330. [Google Scholar] [CrossRef]
- Whitaker, T. Experiments with model piles in groups. Geotechnique 1957, 7, 147–167. [Google Scholar] [CrossRef]
- Vesic, A.S. A Study of Bearing Capacity of Deep Foundations; Final Report Project B-139; Georogia Institute Technology: Atlanta, GA, USA, 1967. [Google Scholar]
- Itoh, A.; Yamagata, K. Vertical Loading Test of Model Pile Groups (Part 3: Influence of Pile Spacing). In Proceedings of the Annual Conference AIJ, Structure I, Tokyo, Japan, 9–10 September 1988; pp. 661–662. (In Japanese). [Google Scholar]
- Doohyun, K.; Junhwan, L. Interpretative analysis of lateral load-carrying behavior and design model for inclined single and group micropiles. J. Geotech. Geoenviron. Eng. 2018, 144, 04017105. [Google Scholar] [CrossRef]
- Goto, S.; Aoyama, S.; Liu, B.; AyalaAlarco, R.; Takita, A.; Towhata, I. Model pile and pile group bearing capacity in large scale soil tank test. In Proceedings of the IS-Kanazawa 2012, Kanazawa, Japan, 18–20 September 2012. [Google Scholar]
- Michael, C.; Palmer, D.; O’Rourke, T. Tactile pressure sensors for soil-structure interaction assessment. J. Geotech. Geoenviron. Eng. ASCE 2009, 135, 1638–1645. [Google Scholar]
- White, D.J.; Take, W.A.; Bolton, M.D. Soil deformation measurement using particle image velocimetry and photogrammetry. Geotechnique 2003, 53, 619–631. [Google Scholar] [CrossRef]


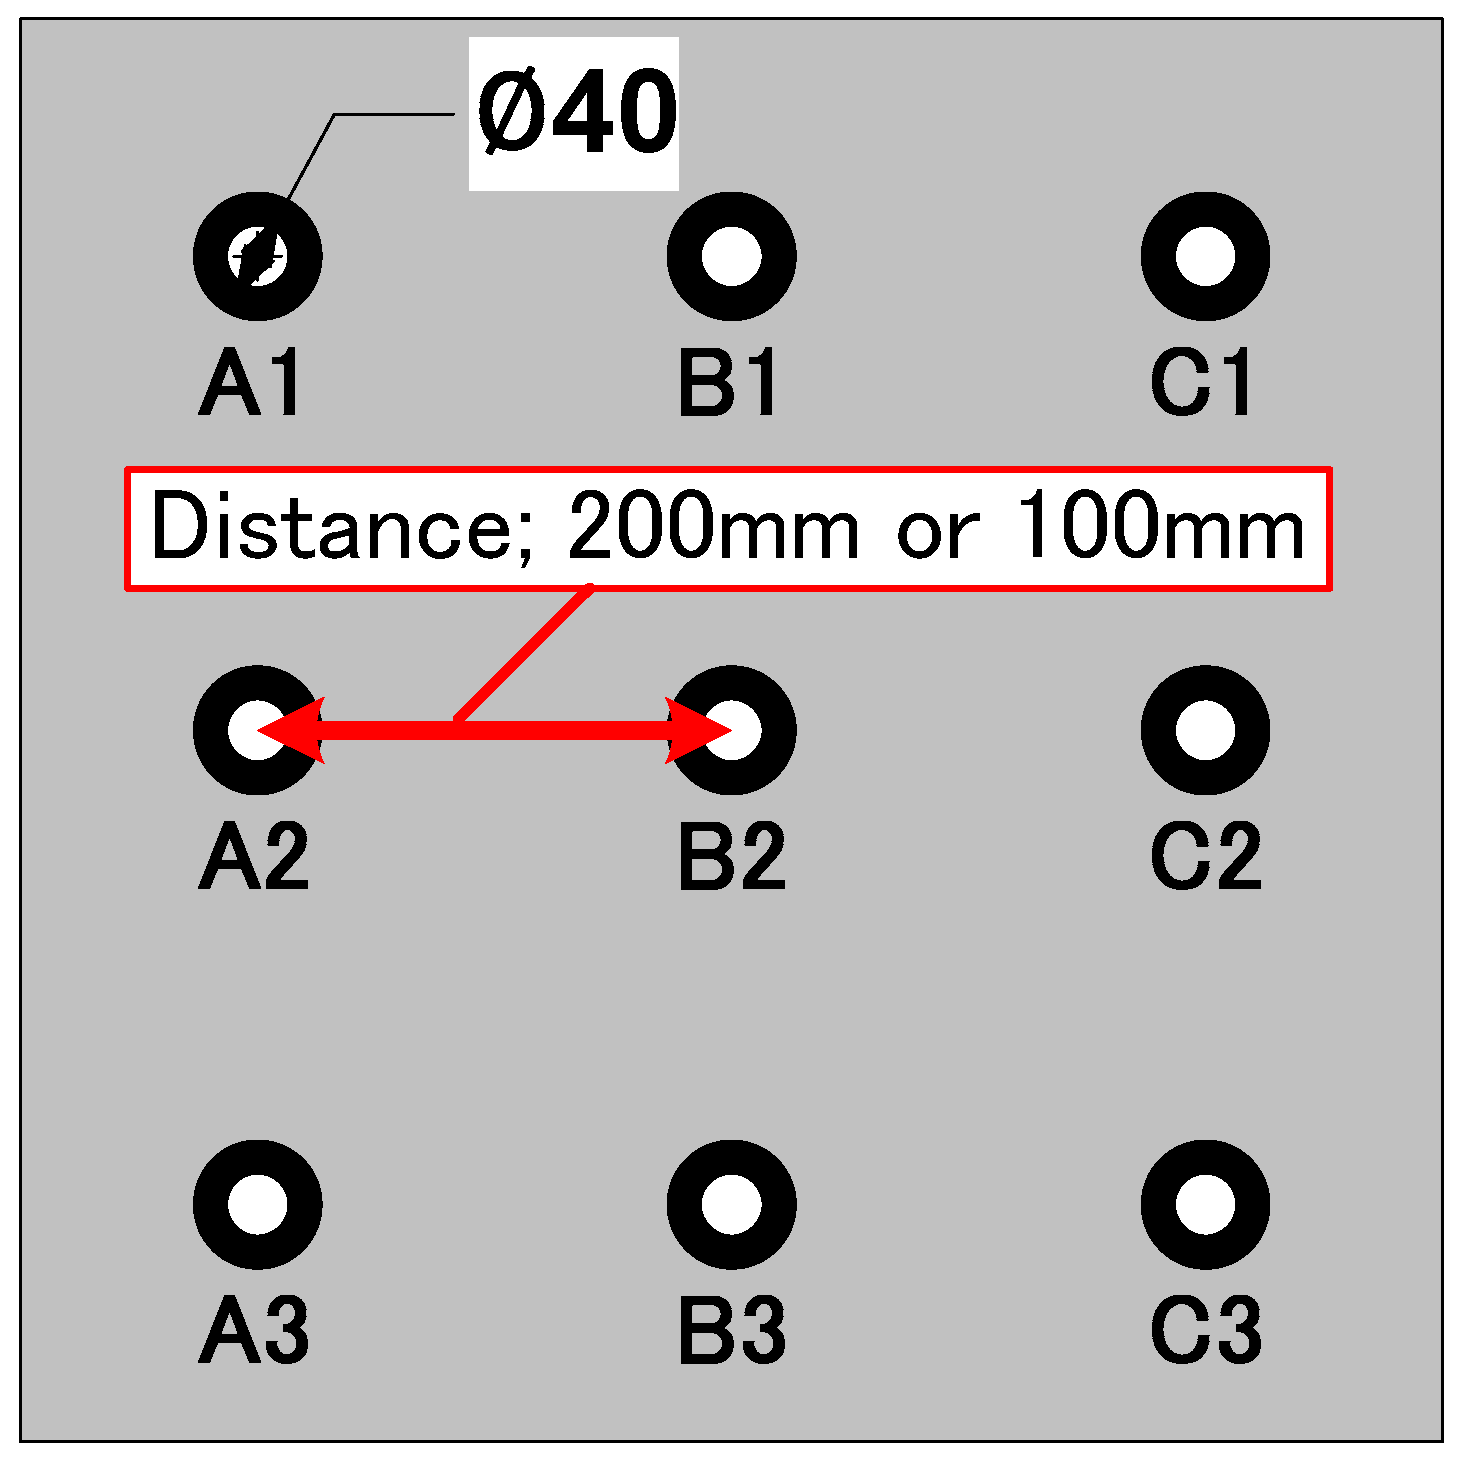
| Case No. | Aim of Tests | Test Location | Loading Rate | Pile Shape | Pile Length | Number of Piles | Spacing between Piles | Confining Pressure |
|---|---|---|---|---|---|---|---|---|
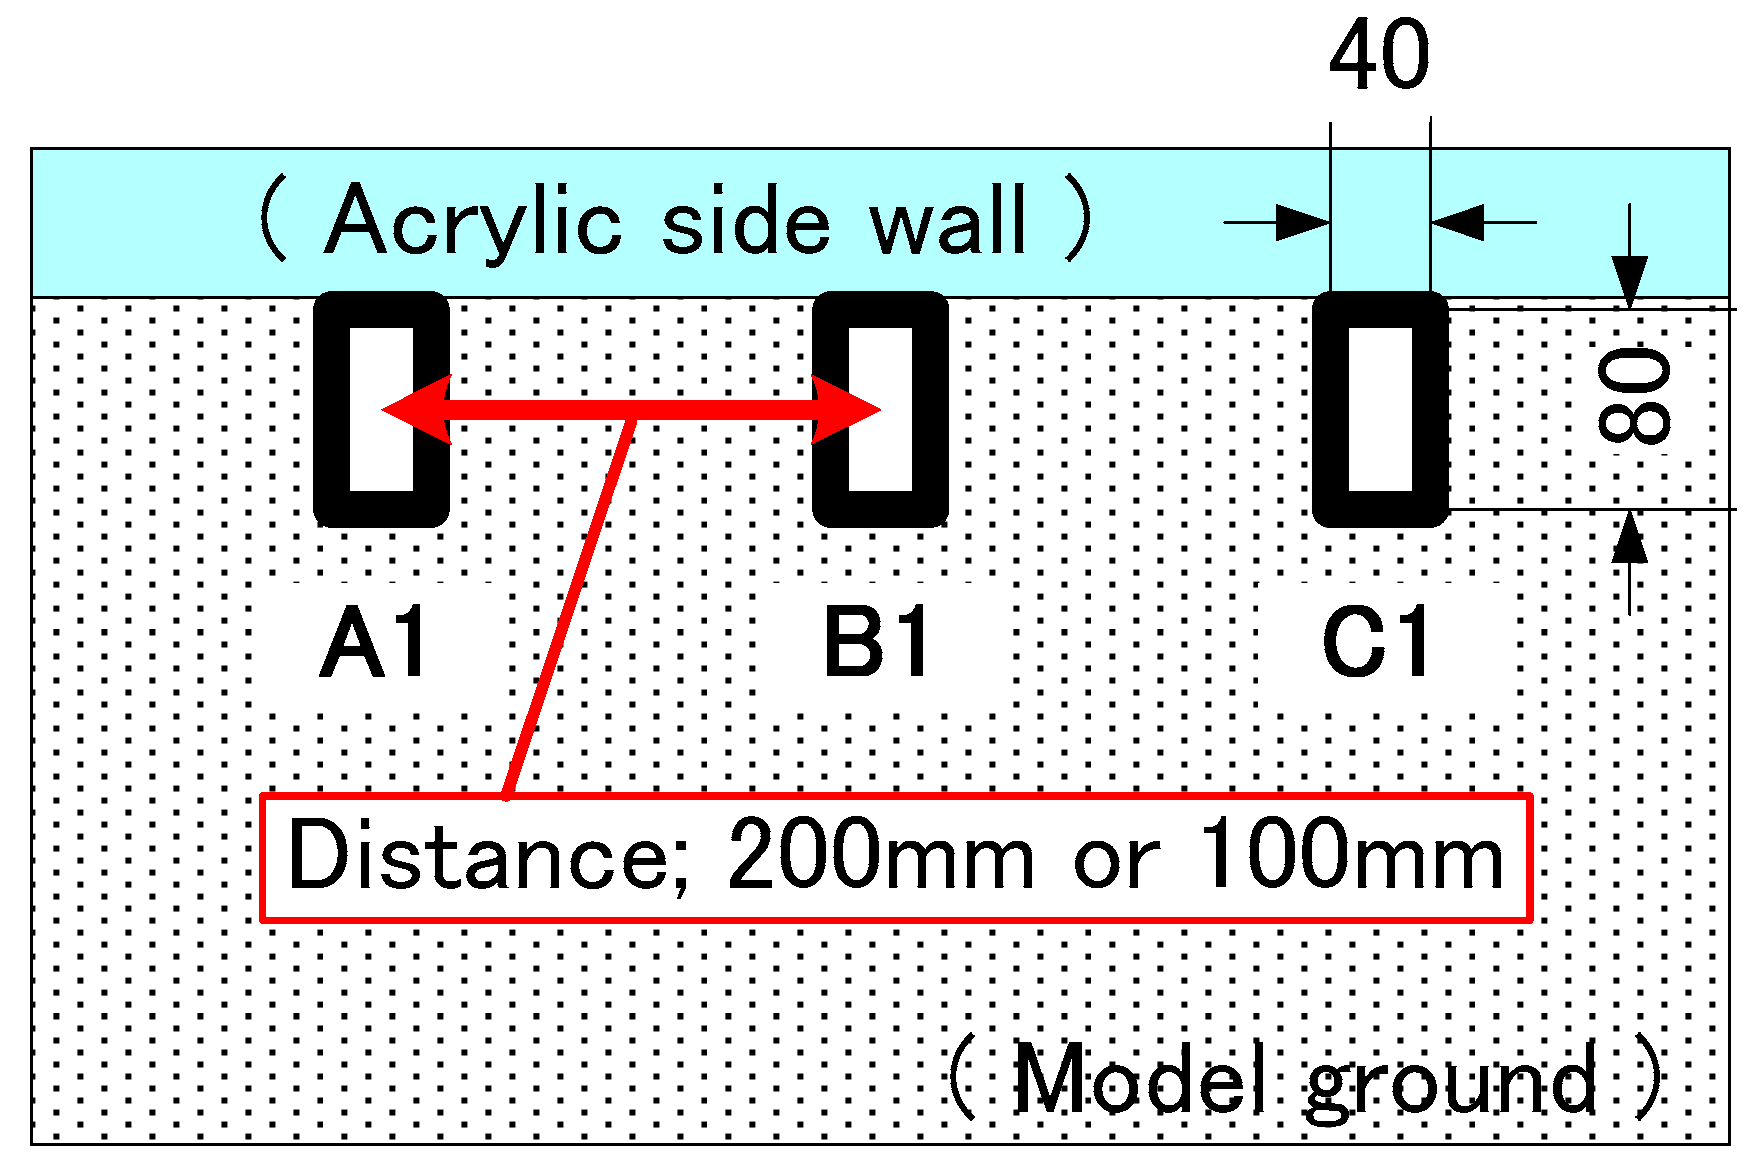
| 1 | Group pile loading test | Center | 1 mm/min | Cylindrical diameter 40 mm | 1000 mm | 9 (3 × 3) | 100 mm (2.5D) | 50 kPa → 100 kPa → 150 kPa → 200 kPa |
| 2 | 200 mm (5D) | |||||||
| 3 | Vertical pressure distribution under group pile loading | 1300 mm | 100 mm (2.5D) | |||||
| 4 | 200 mm (5D) | |||||||
| 5 | Horizontal pressure distribution under group pile loading | Near the side wall | 1000 mm | 100 mm (2.5D) | ||||
| 6 | 200 mm (5D) | |||||||
| 7 | Single pile loading test | Near the back wall | 2 mm/min | 1 | ||||
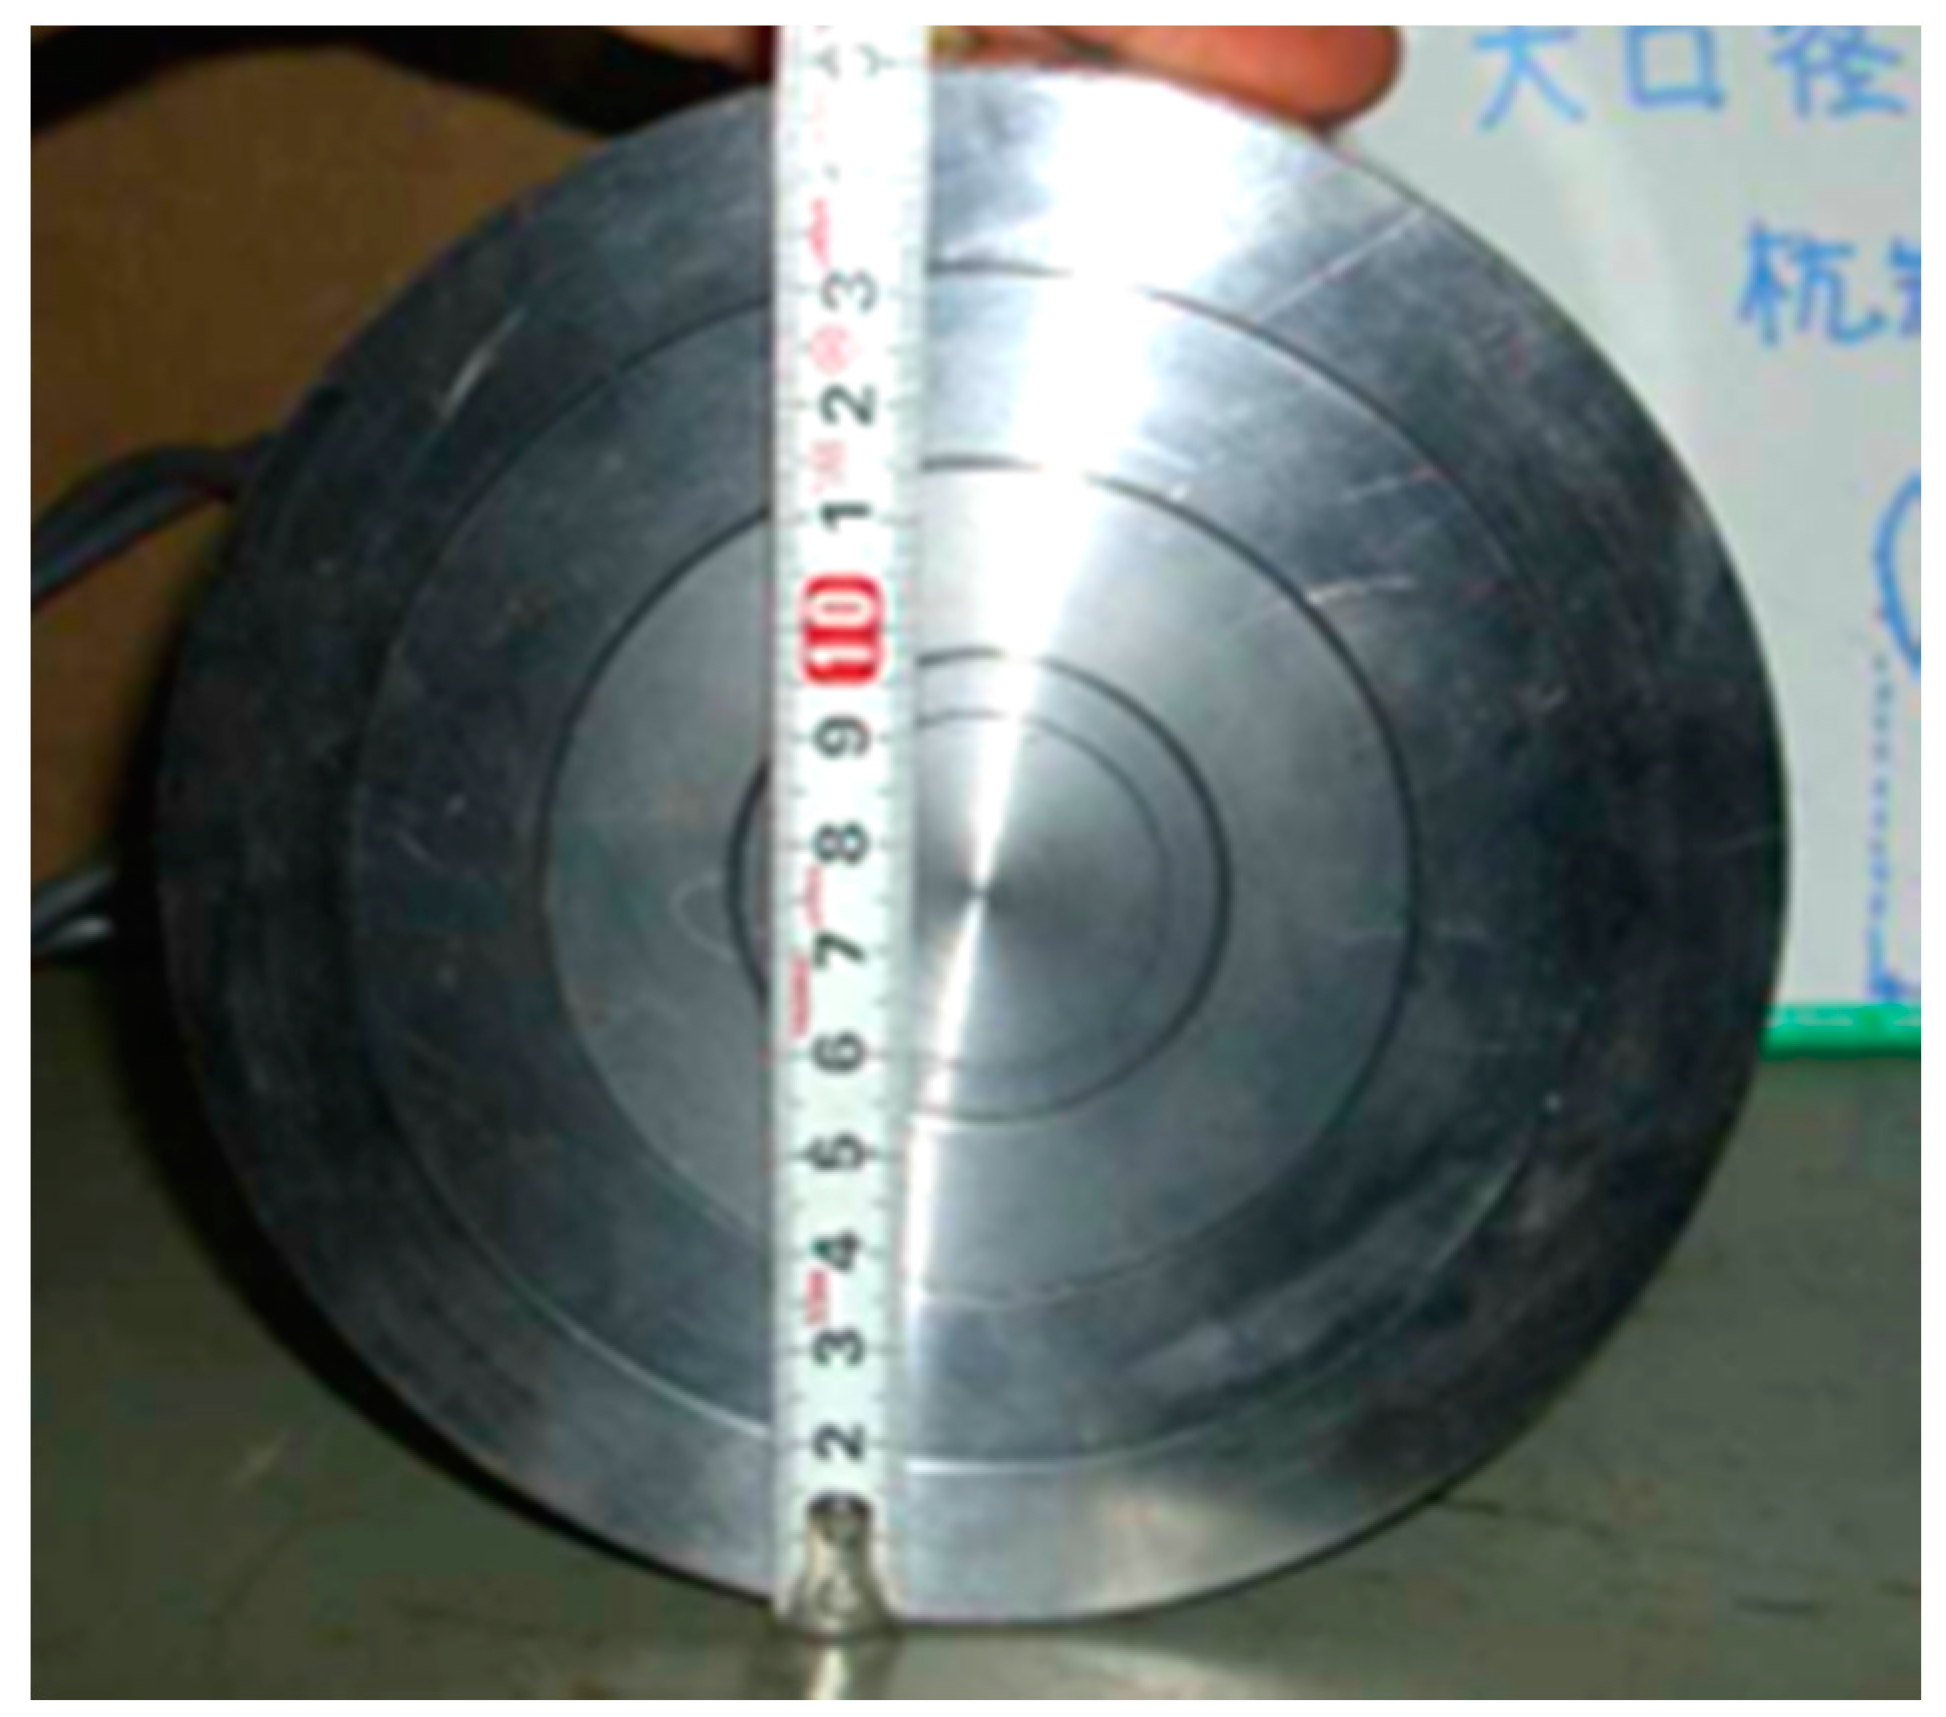
| 8 | Center | Cylindrical diameter 150 mm | ||||||
| 9 | Group pile visualization tests | Near the front wall | 1 mm/min | Rectangular parallel pipe width 40 × 80 mm | 3 | 100 mm (2.5D) | 50 kPa → 100 kPa → 150 kPa → 200 kPa → 150 kPa → 100 kPa → 50 kPa | |
| 10 | 200 mm (5D) |
| Parameters | Values |
|---|---|
| Technology | Piezoresistive |
| Sensing Point Size | 1″ × 1″ (25.4 mm × 25.4 mm) |
| Scan Speed | Up to 35 hertz |
| Temperature | 10–40 °C |
| Accuracy | ±10% |
| Repeatability | ±2% |
| Hysteresis | ±5% |
| Non-linearity | ±1.5% |
| Parameters | Values |
|---|---|
| Size of target mesh | 24 pixel |
| Space between target mesh | 8 pixel |
| Search range | 250 pixel |
| Resolution | 7360 × 4912 pixels |
| Time interval between pictures | 20 s |
© 2018 by the authors. Licensee MDPI, Basel, Switzerland. This article is an open access article distributed under the terms and conditions of the Creative Commons Attribution (CC BY) license (http://creativecommons.org/licenses/by/4.0/).
Share and Cite
You, Z.; Chen, Y. The Use of Tactile Sensors and PIV Analysis for Understanding the Bearing Mechanism of Pile Groups. Sensors 2018, 18, 476. https://doi.org/10.3390/s18020476
You Z, Chen Y. The Use of Tactile Sensors and PIV Analysis for Understanding the Bearing Mechanism of Pile Groups. Sensors. 2018; 18(2):476. https://doi.org/10.3390/s18020476
Chicago/Turabian StyleYou, Zhijia, and Yulong Chen. 2018. "The Use of Tactile Sensors and PIV Analysis for Understanding the Bearing Mechanism of Pile Groups" Sensors 18, no. 2: 476. https://doi.org/10.3390/s18020476
APA StyleYou, Z., & Chen, Y. (2018). The Use of Tactile Sensors and PIV Analysis for Understanding the Bearing Mechanism of Pile Groups. Sensors, 18(2), 476. https://doi.org/10.3390/s18020476