Dressing Tool Condition Monitoring through Impedance-Based Sensors: Part 1—PZT Diaphragm Transducer Response and EMI Sensing Technique


Abstract
1. Introduction
2. Electromechanical Impedance (EMI) Technique
2.1. PZT Diaphragm Transducers
2.2. EMI Principle
3. PZT Diaphragm Transducers Sensitivity Assessment
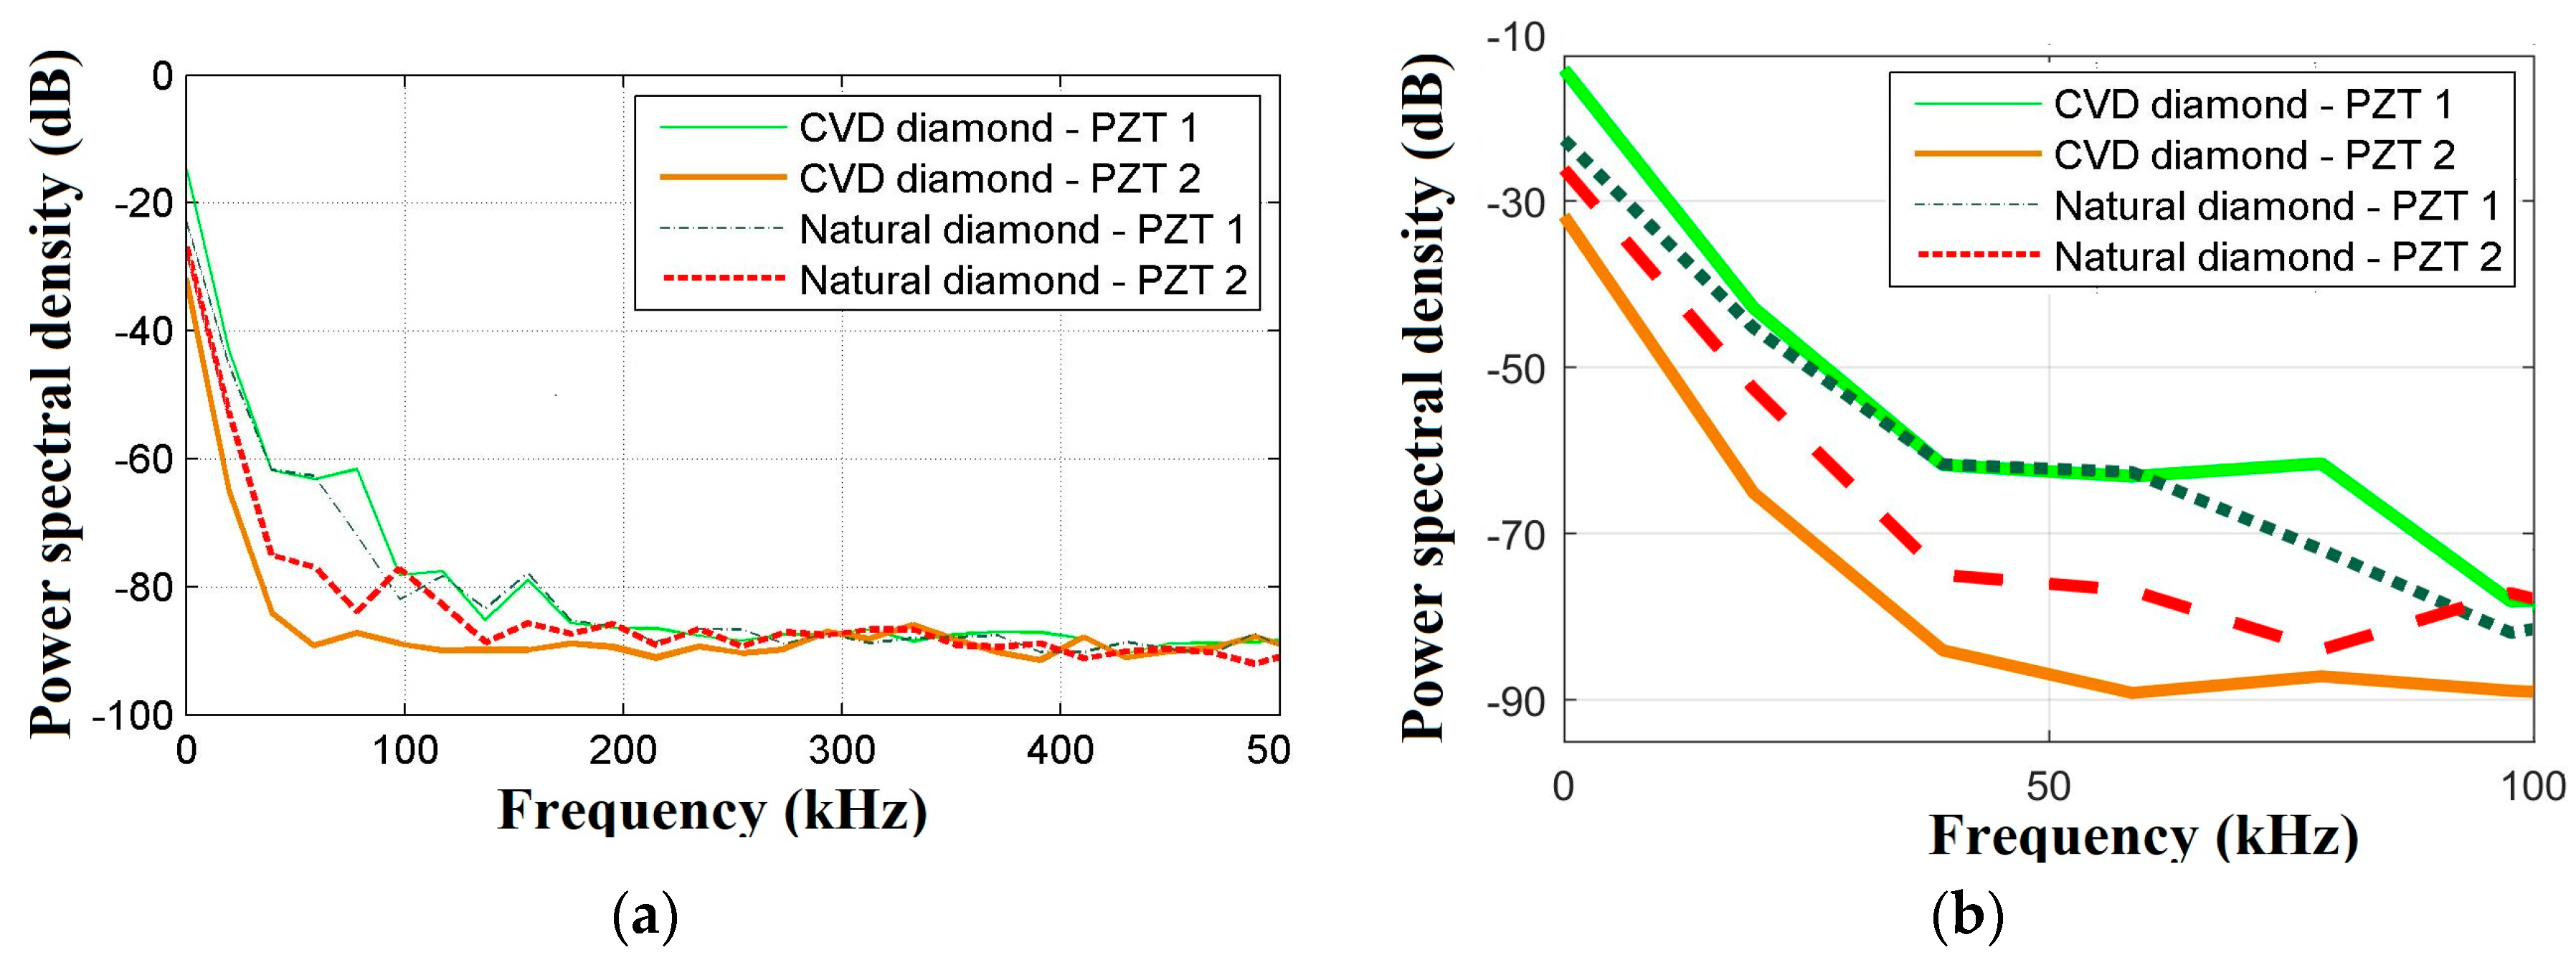
3.1. Pencil-Lead Break Method
3.2. Damage Indices
4. Material and Methods
4.1. Experimental Dressing Tests
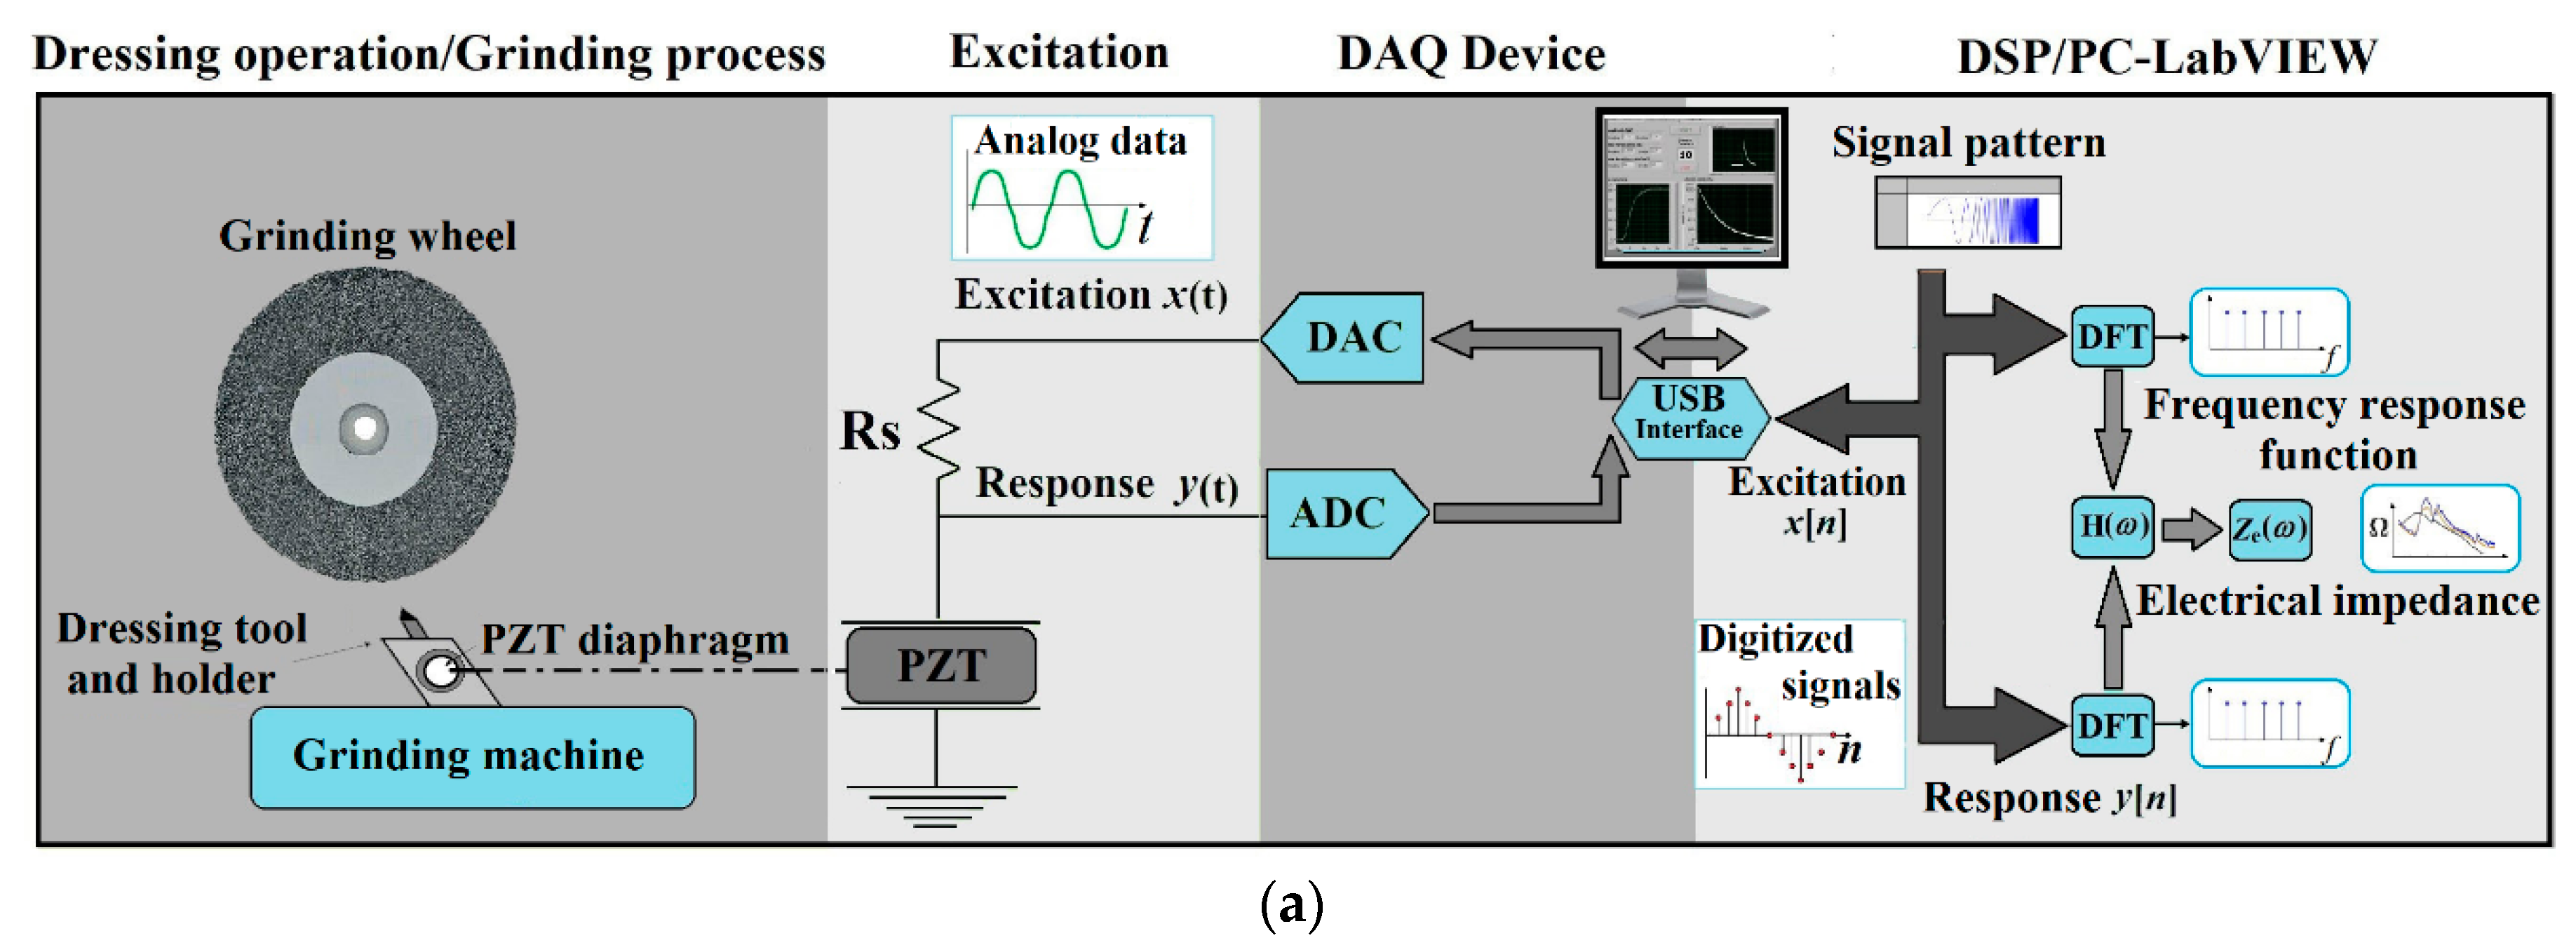
4.2. DAQ Device and Sensing System
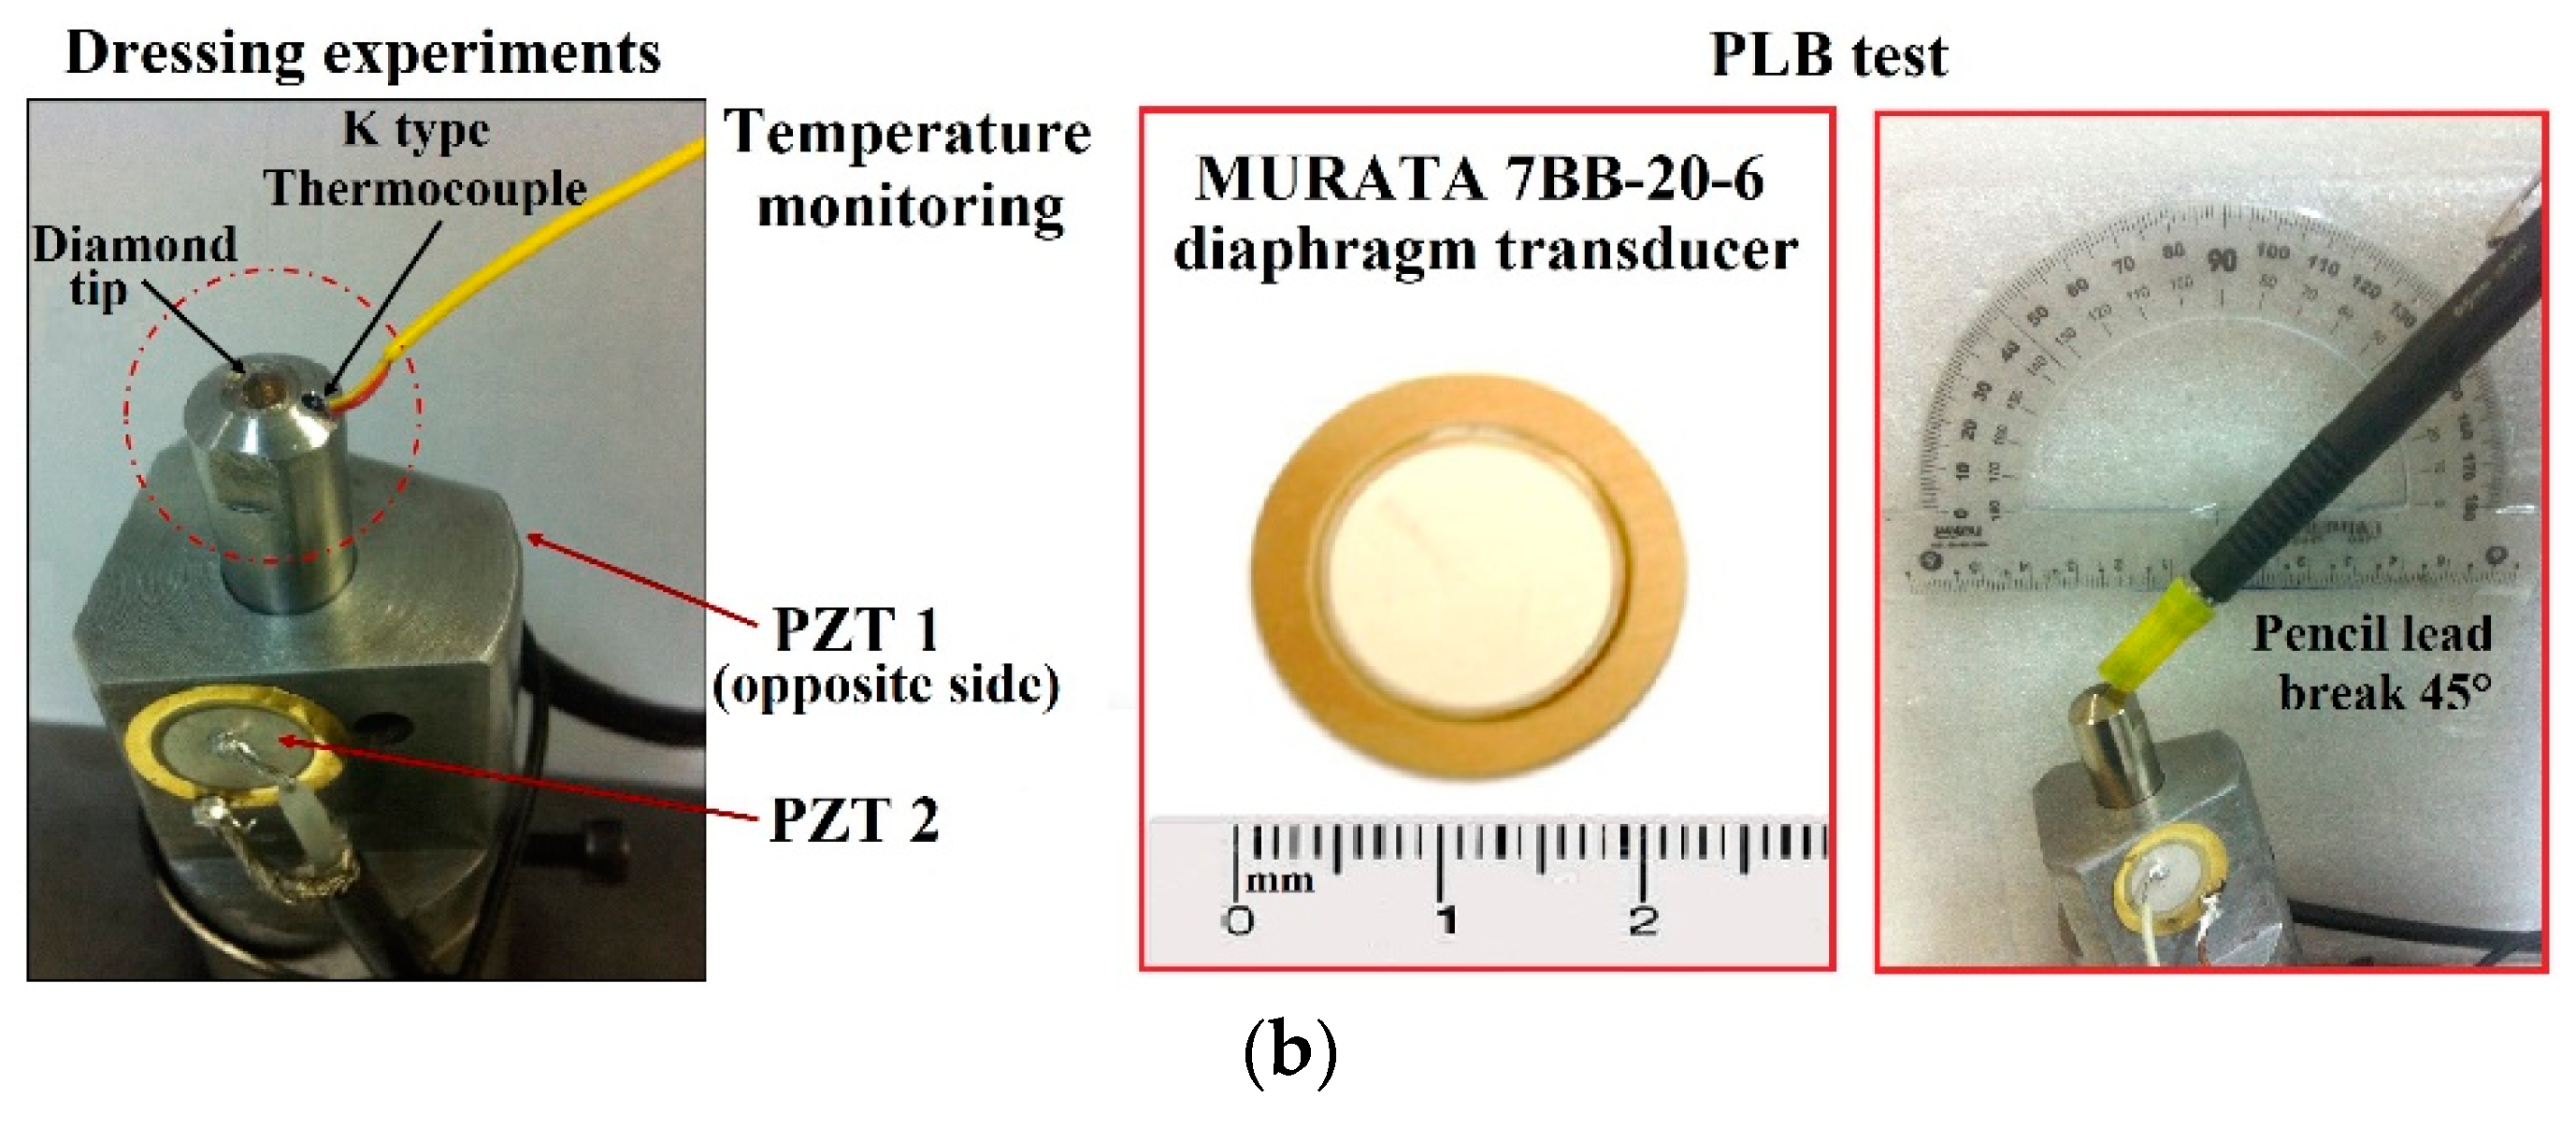
4.3. PLB Method and Temperature Monitoring
5. Results and Discussion
5.1. Tool Wear Analysis
5.2. PZT Diaphragm Transducer Characterization
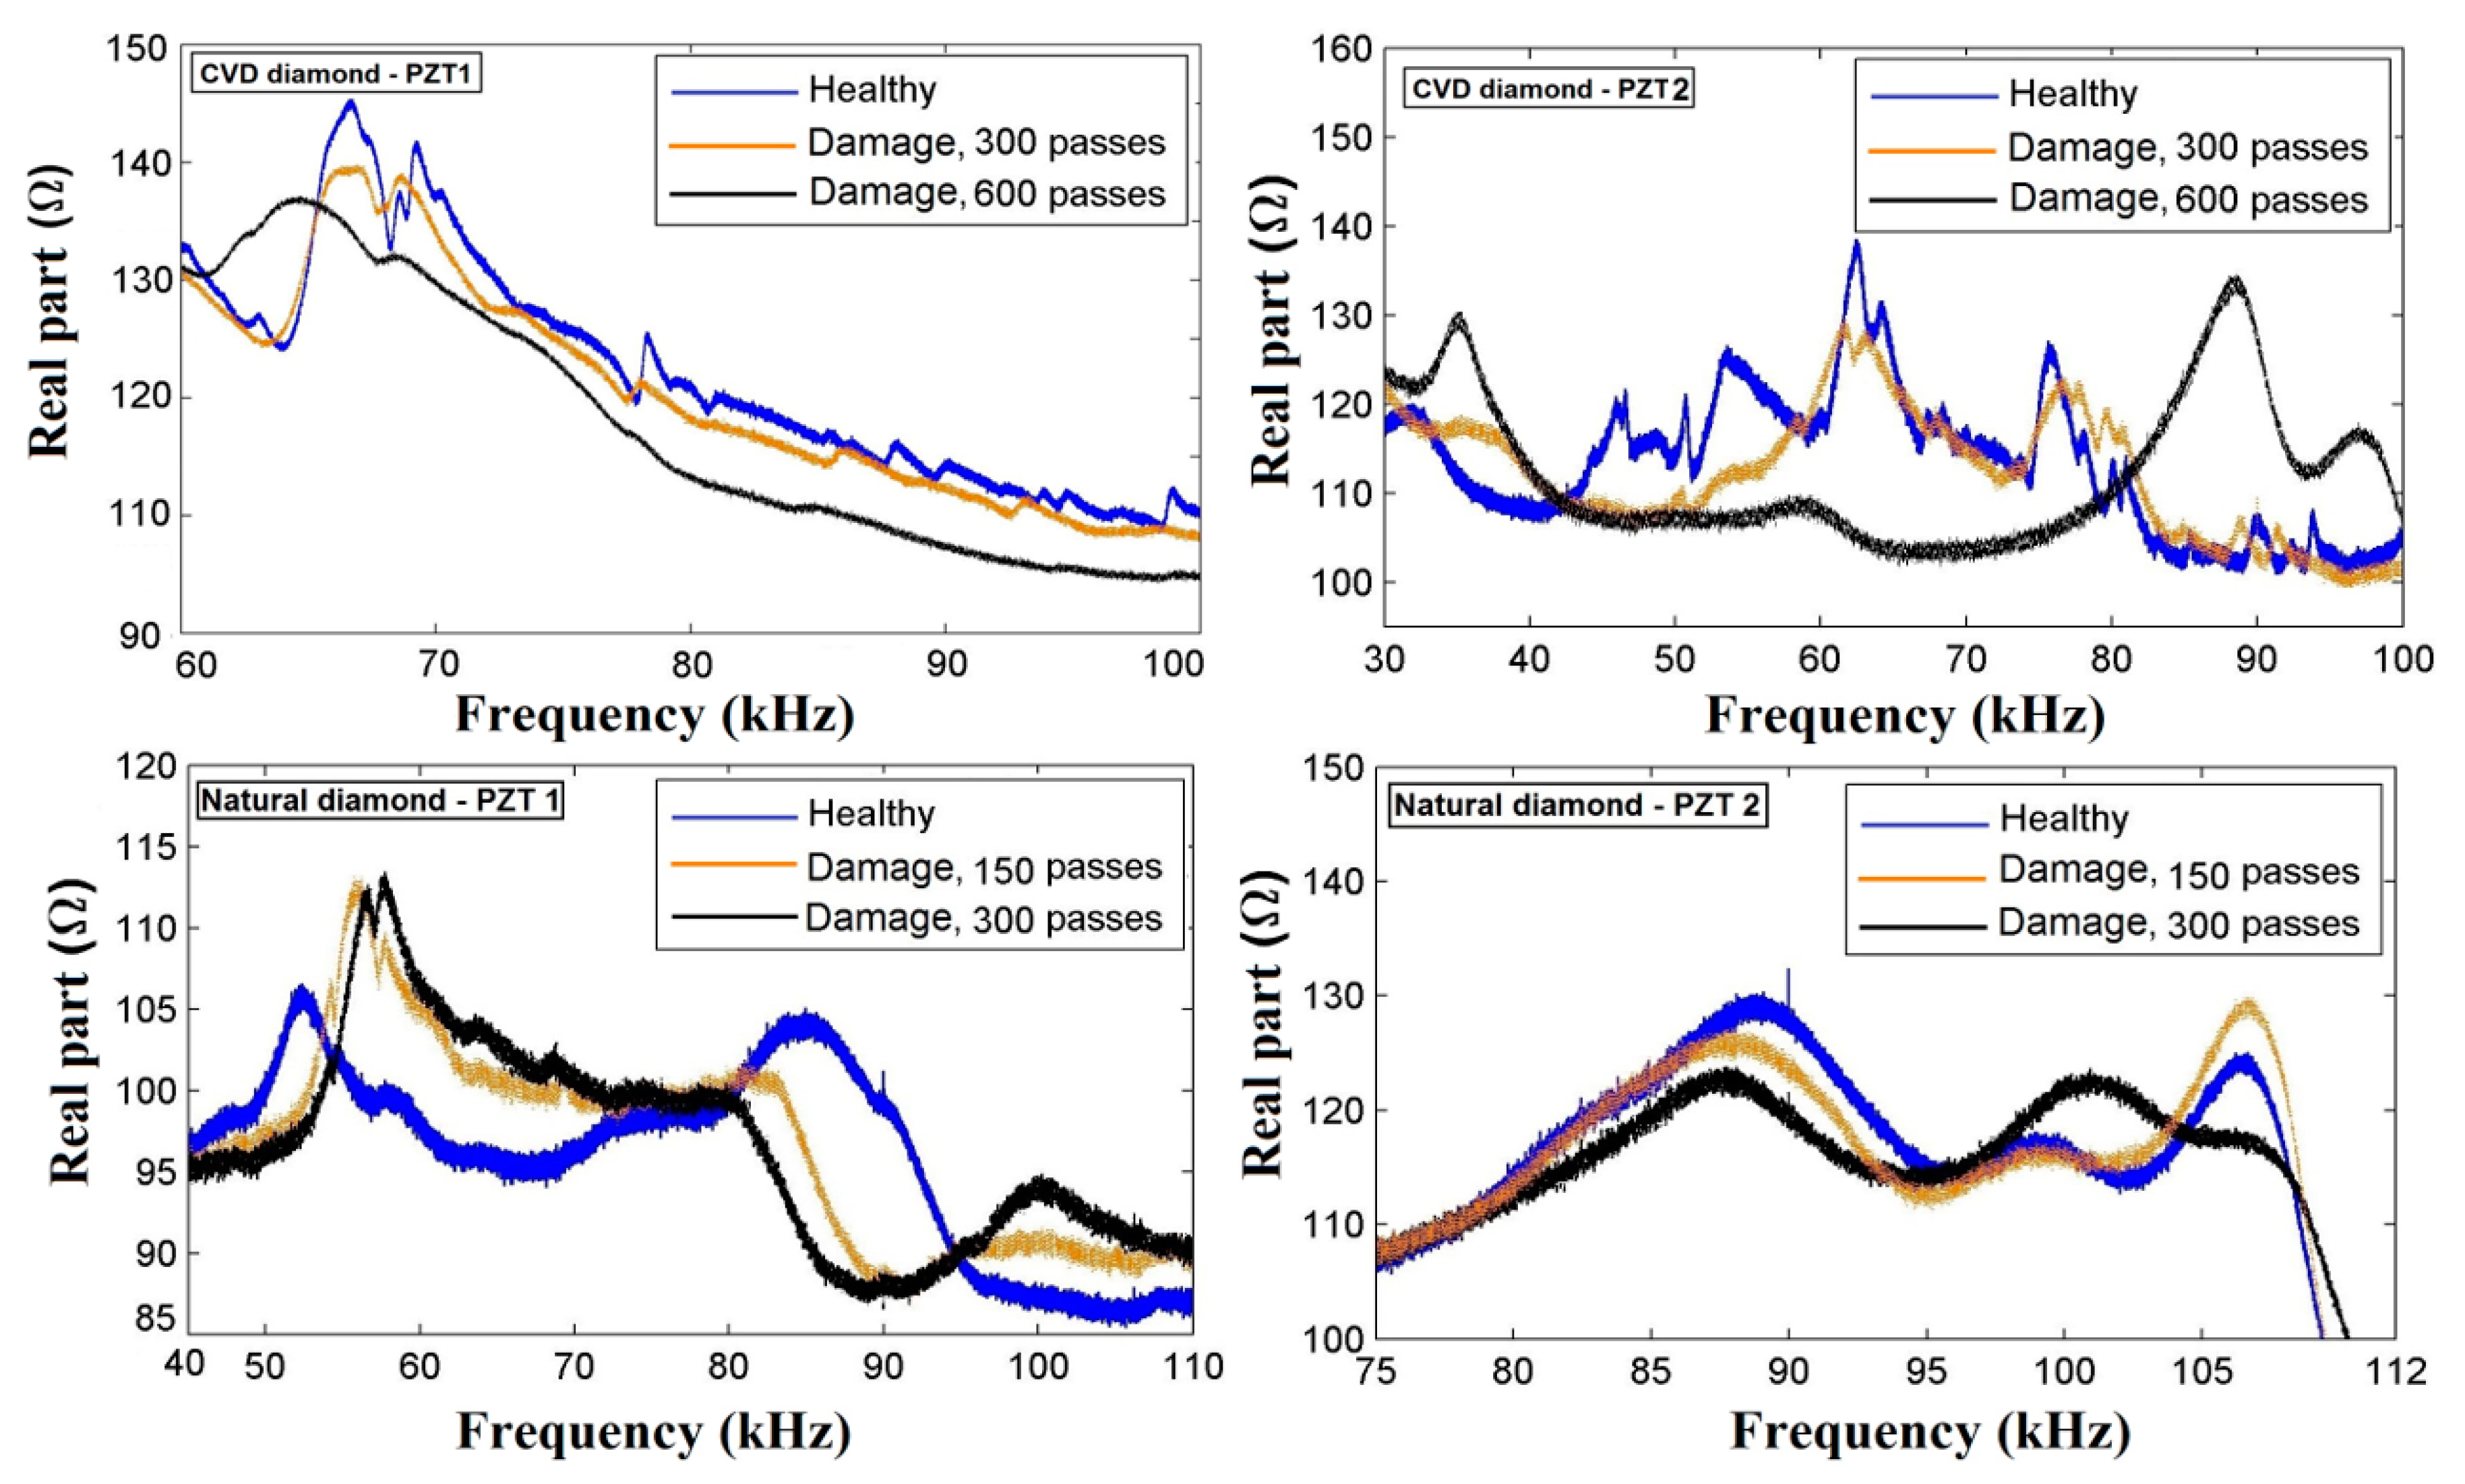
5.3. Dressing Tool Condition Monitoring Though Impedance-Based Sensors
6. Conclusions
Author Contributions
Funding
Acknowledgments
Conflicts of Interest
References
- Zhou, Y.; Xue, W. A Multisensor Fusion Method for Tool Condition Monitoring in Milling. Sensors 2018, 18, 3866. [Google Scholar] [CrossRef] [PubMed]
- Zhang, C.; Yao, X.; Zhang, J.; Jin, H. Tool condition monitoring and remaining useful life prognostic based on awireless sensor in dry milling operations. Sensors 2016, 16, 795. [Google Scholar] [CrossRef] [PubMed]
- Jauregui, J.C.; Resendiz, J.R.; Thenozhi, S.; Szalay, T.; Jacso, A.; Takacs, M. Frequency and Time-Frequency Analysis of Cutting Force and Vibration Signals for Tool Condition Monitoring. IEEE Access 2018, 6, 6400–6410. [Google Scholar] [CrossRef]
- Martins, C.H.R.; Aguiar, P.R.; Frech, A.; Bianchi, E.C. Tool Condition Monitoring of Single-Point Dresser Using Acoustic Emission and Neural Networks Models. IEEE Trans. Instrum. Meas. 2014, 63, 667–679. [Google Scholar] [CrossRef]
- Pombo, I.; Cearsolo, X.; Sánchez, J.A.; Cabanes, I. Experimental and numerical analysis of thermal phenomena in the wear of single point diamond dressing tools. J. Manuf. Process. 2017, 27, 145–157. [Google Scholar] [CrossRef]
- Wegener, K.; Hoffmeister, H.-W.; Karpuschewski, B.; Kuster, F.; Hahmann, W.-C.; Rabiey, M. Conditioning and monitoring of grinding wheels. CIRP Ann.—Manuf. Technol. 2011, 60, 757–777. [Google Scholar] [CrossRef]
- Habrat, W.; Batsch, A.; Porzycki, J. Monitoring of the single-point diamond dresser wear. Arch. Civ. Mech. Eng. 2005, 5, 13–18. [Google Scholar]
- Cearsolo, X.; Cabanes, I.; Sanchez, J.A.; Pombo, I.; Portillo, E. Dry-dressing for ecological grinding. J. Clean. Prod. 2016, 135, 633–643. [Google Scholar] [CrossRef]
- Teti, R.; Jemielniak, K.; O’Donnell, G.; Dornfeld, D. Advanced monitoring of machining operations. CIRP Ann.—Manuf. Technol. 2010, 59, 717–739. [Google Scholar] [CrossRef]
- Byrne, G.; Dornfeld, D.; Inasaki, I.; Ketteler, G.; König, W.; Teti, R. Tool Condition Monitoring (TCM)—The Status of Research and Industrial Application. CIRP Ann.—Manuf. Technol. 1995, 44, 541–567. [Google Scholar] [CrossRef]
- Micheletti, D.F.; König, W.; Victor, H.R. In Process Tool Wear Sensor for Cutting Operations. CIRP Ann. 1976, 25, 483–496. [Google Scholar]
- Tlusty, J.; Andrews, G.C. A Critical Review of Sensors for Unmanned Machining. CIRP Ann. 1983, 32, 563–572. [Google Scholar] [CrossRef]
- Tönshoff, H.K.; Wulfsberg, J.P.; Kals, H.J.J.; König, W.; van Luttervelt, C.A. Development and Trends in Monitoring and Control of Machining Process. CIRP Ann. 1988, 37, 611–622. [Google Scholar] [CrossRef]
- Teti, R. A Review of Tool Condition Monitoring Literature Database. CIRP Ann. 1995, 44, 659–666. [Google Scholar]
- Rehorn, A.G.; Jiang, J.; Orban, P.E. State-of-the-art methods and results in tool condition monitoring: A review. Int. J. Adv. Manuf. Technol. 2005, 26, 693–710. [Google Scholar] [CrossRef]
- Bhuiyan, M.S.H.; Choudhury, I.A. Review of Sensor Applications in Tool Condition Monitoring in Machining. In Comprehensive Materials Processing; Elsevier: Amsterdam, The Netherlands, 2014; pp. 539–569. [Google Scholar]
- Kwak, J.; Ha, M. Detection of dressing time using the grinding force signal based on the discrete wavelet decomposition. Int. J. Adv. Manuf. Technol. 2004, 23, 87–92. [Google Scholar] [CrossRef]
- Aguiar, P.R.; Souza, A.G.O.; Bianchi, E.C.; Leite, R.R.; Dotto, F.R.L. Monitoring the dressing operation in the grinding process. Int. J. Mach. Mach. Mater. 2009, 5, 3–22. [Google Scholar] [CrossRef]
- Miranda, H.I.; Rocha, C.A.; Oliveira, P.; Martins, C.; Aguiar, P.R.; Bianchi, E.C. Monitoring single-point dressers using fuzzy models. Procedia CIRP 2015, 33, 281–286. [Google Scholar] [CrossRef]
- D’Addona, D.M.; Matarazzo, D.; de Aguiar, P.R.; Bianchi, E.C.; Martins, C.H.R. Neural Networks Tool Condition Monitoring in Single-point Dressing Operations. Procedia CIRP 2016, 41, 431–436. [Google Scholar] [CrossRef]
- Junior, P.O.; Souza, R.V.; Ferreira, F.I.; Martins, C.H.; Aguiar, P.R.; Bianchi, E.C. Wear monitoring of single-point dresser in dry dressing operation based on neural models. In Proceedings of the IASTED International Conference on Modelling, Identification and Control, Innsbruck, Austria, 20–21 February 2017; Volume 848. [Google Scholar]
- Inman, D.J.; Farrar, C.R.; Junior, V.L.; Junior, V.S. Damage Prognosis: For Aerospace, Civil and Mechanical Systems; Wiley: New York, NY, USA, 2005; ISBN 978-0-470-86907-9. [Google Scholar]
- Annamdas, V.G.M.; Soh, C.K. Application of Electromechanical Impedance Technique for Engineering Structures: Review and Future Issues. J. Intell. Mater. Syst. Struct. 2010, 21, 41–59. [Google Scholar] [CrossRef]
- Giurgiutiu, V.; Zagrai, A.N. Characterization of Piezoelectric Wafer Active Sensors. J. Intell. Mater. Syst. Struct. 2000, 11, 959–976. [Google Scholar] [CrossRef]
- Lim, Y.Y.; Soh, C.K. Electro-Mechanical Impedance (EMI)-Based Incipient Crack Monitoring and Critical Crack Identification of Beam Structures. Res. Nondestruct. Eval. 2014, 25, 82–98. [Google Scholar] [CrossRef]
- Yang, Y.; Lim, Y.Y.; Soh, C.K. Practical issues related to the application of the electromechanical impedance technique in the structural health monitoring of civil structures: I. Experiment. Smart Mater. Struct. 2008, 17, 035008. [Google Scholar] [CrossRef]
- Park, G.; Sohn, H.; Farrar, C.R.; Inman, D.J. Overview of Piezoelectric Impedance-Based Health Monitoring and Path Forward. Shock Vib. Dig. 2003, 35, 451–463. [Google Scholar] [CrossRef]
- Maruo, I.I.C.; Giachero, G.D.F.; Steffen Junior, V.; Finzi Neto, R.M. Electromechanical Impedance—Based Structural Health Monitoring Instrumentation System Applied to Aircraft Structures and Employing a Multiplexed Sensor Array. J. Aerosp. Technol. Manag. 2015, 7, 294–306. [Google Scholar] [CrossRef]
- Fan, S.; Zhao, S.; Qi, B.; Kong, Q. Damage Evaluation of Concrete Column under Impact Load Using a Piezoelectric-Based EMI Technique. Sensors 2018, 18, 1591. [Google Scholar] [CrossRef] [PubMed]
- Lin, S.; Xu, J. Effect of the Matching Circuit on the Electromechanical Characteristics of Sandwiched Piezoelectric Transducers. Sensors 2017, 17, 329. [Google Scholar] [CrossRef] [PubMed]
- Hu, X.; Zhu, H.; Wang, D. A Study of Concrete Slab Damage Detection Based on the Electromechanical Impedance Method. Sensors 2014, 14, 19897–19909. [Google Scholar] [CrossRef] [PubMed]
- Dziendzikowski, M.; Niedbala, P.; Kurnyta, A.; Kowalczyk, K.; Dragan, K. Structural Health Monitoring of a Composite Panel Based on PZT Sensors and a Transfer Impedance Framework. Sensors 2018, 18, 1521. [Google Scholar] [CrossRef] [PubMed]
- Inman, D.J.; Vieira, J.; Guimar, F. Time-domain analysis of piezoelectric impedance-based structural health monitoring using multilevel wavelet decomposition. Mech. Syst. Signal Process. 2011, 25, 1550–1558. [Google Scholar]
- De Oliveira, M.A.; Filho, J.V.; Junior, V.L.; Inman, D.J. A novel time-domain technique for damage detection applied to SHM using Savitzky-Golay filter. Aerosp. Eng. A Roadmap Intell. Struct. 2013, 1, 996–1003. [Google Scholar]
- Zhou, P.; Wang, D.; Zhu, H. A Novel Damage Indicator Based on the Electromechanical Impedance Principle for Structural Damage Identification. Sensors 2018, 18, 2199. [Google Scholar] [CrossRef] [PubMed]
- Baptista, F.G.; Filho, J.V. Optimal Frequency Range Selection for PZT Transducers in Impedance-Based SHM Systems. IEEE Sens. J. 2010, 10, 1297–1303. [Google Scholar] [CrossRef]
- Yang, Y.; Divsholi, B.S. Sub-Frequency Interval Approach in Electromechanical Impedance Technique for Concrete Structure Health Monitoring. Sensors 2010, 10, 11644–11661. [Google Scholar] [CrossRef] [PubMed]
- Huynh, T.-C.; Dang, N.-L.; Kim, J.-T. Preload Monitoring in Bolted Connection Using Piezoelectric-Based Smart Interface. Sensors 2018, 18, 2766. [Google Scholar] [CrossRef] [PubMed]
- Marchi, M.; Baptista, F.G.; de Aguiar, P.R.; Bianchi, E.C. Grinding process monitoring based on electromechanical impedance measurements. Meas. Sci. Technol. 2015, 26, 045601. [Google Scholar] [CrossRef]
- Junior, P.O.C.; Ferreira, F.I.; Aguiar, P.R.; Batista, F.G.; Bianchi, E.C.; Daddona, D.M. Time-domain Analysis Based on the Electromechanical Impedance Method for Monitoring of the Dressing Operation. Procedia CIRP 2018, 67, 319–324. [Google Scholar] [CrossRef]
- Batista da Silva, R.; Ferreira, F.I.; Baptista, F.G.; de Aguiar, P.R.; de Souza Ruzzi, R.; Hubner, H.B.; da Penha Cindra Fonseca, M.; Bianchi, E.C. Electromechanical impedance (EMI) technique as alternative to monitor workpiece surface damages after the grinding operation. Int. J. Adv. Manuf. Technol. 2018, 98, 2429–2438. [Google Scholar] [CrossRef]
- Freitas, E.S.; Baptista, F.G.; Budoya, D.E.; De Castro, B.A. Equivalent Circuit of Piezoelectric Diaphragms for Impedance-Based Structural Health Monitoring Applications. IEEE Sens. J. 2017, 17, 5537–5546. [Google Scholar] [CrossRef]
- Budoya, D.; de Castro, B.; Campeiro, L.; da Silveira, R.; de Freitas, E.; Baptista, F. Analysis of Piezoelectric Diaphragms in Impedance-Based Damage Detection in Large Structures. Proceedings 2017, 2, 131. [Google Scholar] [CrossRef]
- Silva, E.F.; Baptista, F.G. Experimental analysis of the feasibility of low-cost piezoelectric diaphragms in impedance-based SHM applications. Sens. Actuators A Phys. 2016, 238, 220–228. [Google Scholar] [CrossRef]
- Silveira, R.Z.; Campeiro, L.M.; Baptista, F.G. Performance of three transducer mounting methods in impedance-based structural health monitoring applications. J. Intell. Mater. Syst. Struct. 2017, 28. [Google Scholar] [CrossRef]
- Castro, B.; Clerice, G.; Ramos, C.; Andreoli, A.; Baptista, F.; Campos, F.; Ulson, J. Partial Discharge Monitoring in Power Transformers Using Low-Cost Piezoelectric Sensors. Sensors 2016, 16, 1266. [Google Scholar] [CrossRef] [PubMed]
- De Castro, B.A.; Brunini, D.D.M.; Baptista, F.G.; Andreoli, A.L.; Alfredo, J.; Ulson, C. Assessment of Macro Fiber Composite Sensors for Measurement of Acoustic Partial Discharge Signals in Power Transformers. IEEE Sens. J. 2017, 17, 6090–6099. [Google Scholar] [CrossRef]
- Liang, Q.; Yi, Z.; Hu, Q.; Zhang, Y. Low-Cost Sensor Fusion Technique for Surface Roughness Discrimination with Optical and Piezoelectric Sensors. IEEE Sens. J. 2017, 17, 7954–7960. [Google Scholar] [CrossRef]
- Ribeiro, D.M.S.; Aguiar, P.R.; Fabiano, L.F.G.; Baptista, F.G.; D’Addona, D.M.; Baptista, F.G.; Bianchi, E.C. Spectra Measurements Using Piezoelectric Diaphragms to Detect Burn in Grinding Process. IEEE Trans. Instrum. Meas. 2017, 66, 3052–3063. [Google Scholar] [CrossRef]
- Liang, R.; Wang, Q.M. High sensitivity piezoelectric sensors using flexible PZT thick-film for shock tube pressure testing. Sens. Actuators A Phys. 2015, 235, 317–327. [Google Scholar] [CrossRef]
- Na, W.; Baek, J. A Review of the Piezoelectric Electromechanical Impedance Based Structural Health Monitoring Technique for Engineering Structures. Sensors 2018, 18, 1307. [Google Scholar] [CrossRef] [PubMed]
- Murata, M.C. Piezoelectric Sound Components. Available online: http://www.murata.com/ (accessed on 10 February 2018).
- Giurgiutiu, V. Structural Health Monitoring of Aerospace Composites; Elsevier: Amsterdam, The Netherlands, 2016; ISBN 9780124096059. [Google Scholar]
- IEEE Standard on Piezoelectricity an American National Standard. IEEE-ANSI; Electrical and Electronics Engineers, Inc. (IEEE): Piscataway, NJ, USA, 1987. [Google Scholar]
- Baptista, F.G.; Vieira, F.J. Transducer loading effect on the performance of PZT-based SHM systems. IEEE Trans. Ultrason. Ferroelect. Freq. Control 2010, 57, 933–941. [Google Scholar] [CrossRef] [PubMed]
- Baptista, F.G.; Budoya, D.; Almeida, V.A.D.; Ulson, J.A.C. An experimental study on the effect of temperature on piezoelectric sensors for impedance-based structural health monitoring. Sensors 2014, 14, 1208–1227. [Google Scholar] [CrossRef] [PubMed]
- Xu, D.; Hunag, S.; Cheng, X. Electromechanical impedance spectra investigation of impedance-based PZT and cement/polymer based piezoelectric composite sensors. Constr. Build. Mater. 2014, 65, 543–550. [Google Scholar] [CrossRef]
- Boukabache, H.; Escriba, C.; Zedek, S.; Medale, D.; Rolet, S.; Fourniols, J.Y. System-on-Chip Integration of a New Electromechanical Impedance Calculation Method for Aircraft Structure Health Monitoring. Sensors 2012, 12, 13617–13635. [Google Scholar] [CrossRef] [PubMed]
- Baptista, F.G.; Vieira, J.F. A new impedance measurement system for PZT based structural health monitoring. IEEE Trans. Instrum. Meas. 2009, 58, 3602–3608. [Google Scholar] [CrossRef]
- Sause, M. Investigation of Pencil Lead Breaks as Acoustic Emission Sources. J. Acoust. Emiss. 2011, 29, 184–196. [Google Scholar]
- De Almeida, V.A.D.; Baptista, F.G.; de Aguiar, P.R. Piezoelectric Transducers Assessed by the Pencil Lead Break for Impedance-Based Structural Health Monitoring. IEEE Sens. J. 2015, 15, 693–702. [Google Scholar] [CrossRef]
- E976-10, S. Standard Guide for Determining the Reproducibility of Acoustic Emission Sensor Response; ASTM: West Conshohocken, PA, USA, 2010. [Google Scholar]
- Uhlmann, E.; Brücher, M. Wear Behavior of CVD-Diamond Tools. CIRP Ann. 2002, 51, 49–52. [Google Scholar] [CrossRef]
- Fraimovitch, D.; Adelberd, A.; Marunko, S.; Lefeuvre, G.; Ruzin, A. CVD diamond metallization and characterization. Nucl. Inst. Methods Phys. Res. A 2017, 845, 76–79. [Google Scholar] [CrossRef]
- Poltoratskiy, V.G.; Lavrinenko, V.I.; Safonova, M.N.; Petasyuk, G.A. A novel composite diamond-containing dispersed material of natural and synthetic diamonds powders and abrasive tools made of it. Diam. Relat. Mater. 2016, 68, 66–70. [Google Scholar] [CrossRef]


| PZT Diaphragm Transducer and Dressing Tool | PSD (dB) from PLB Test | Impedance Signatures from Real Part (Ω) | RMSD Indices | CCDM Indices | ||||
|---|---|---|---|---|---|---|---|---|
| Healthy | Damage 1 | Damage 2 | Damage 1 | Damage 2 | Damage 1 | Damage 2 | ||
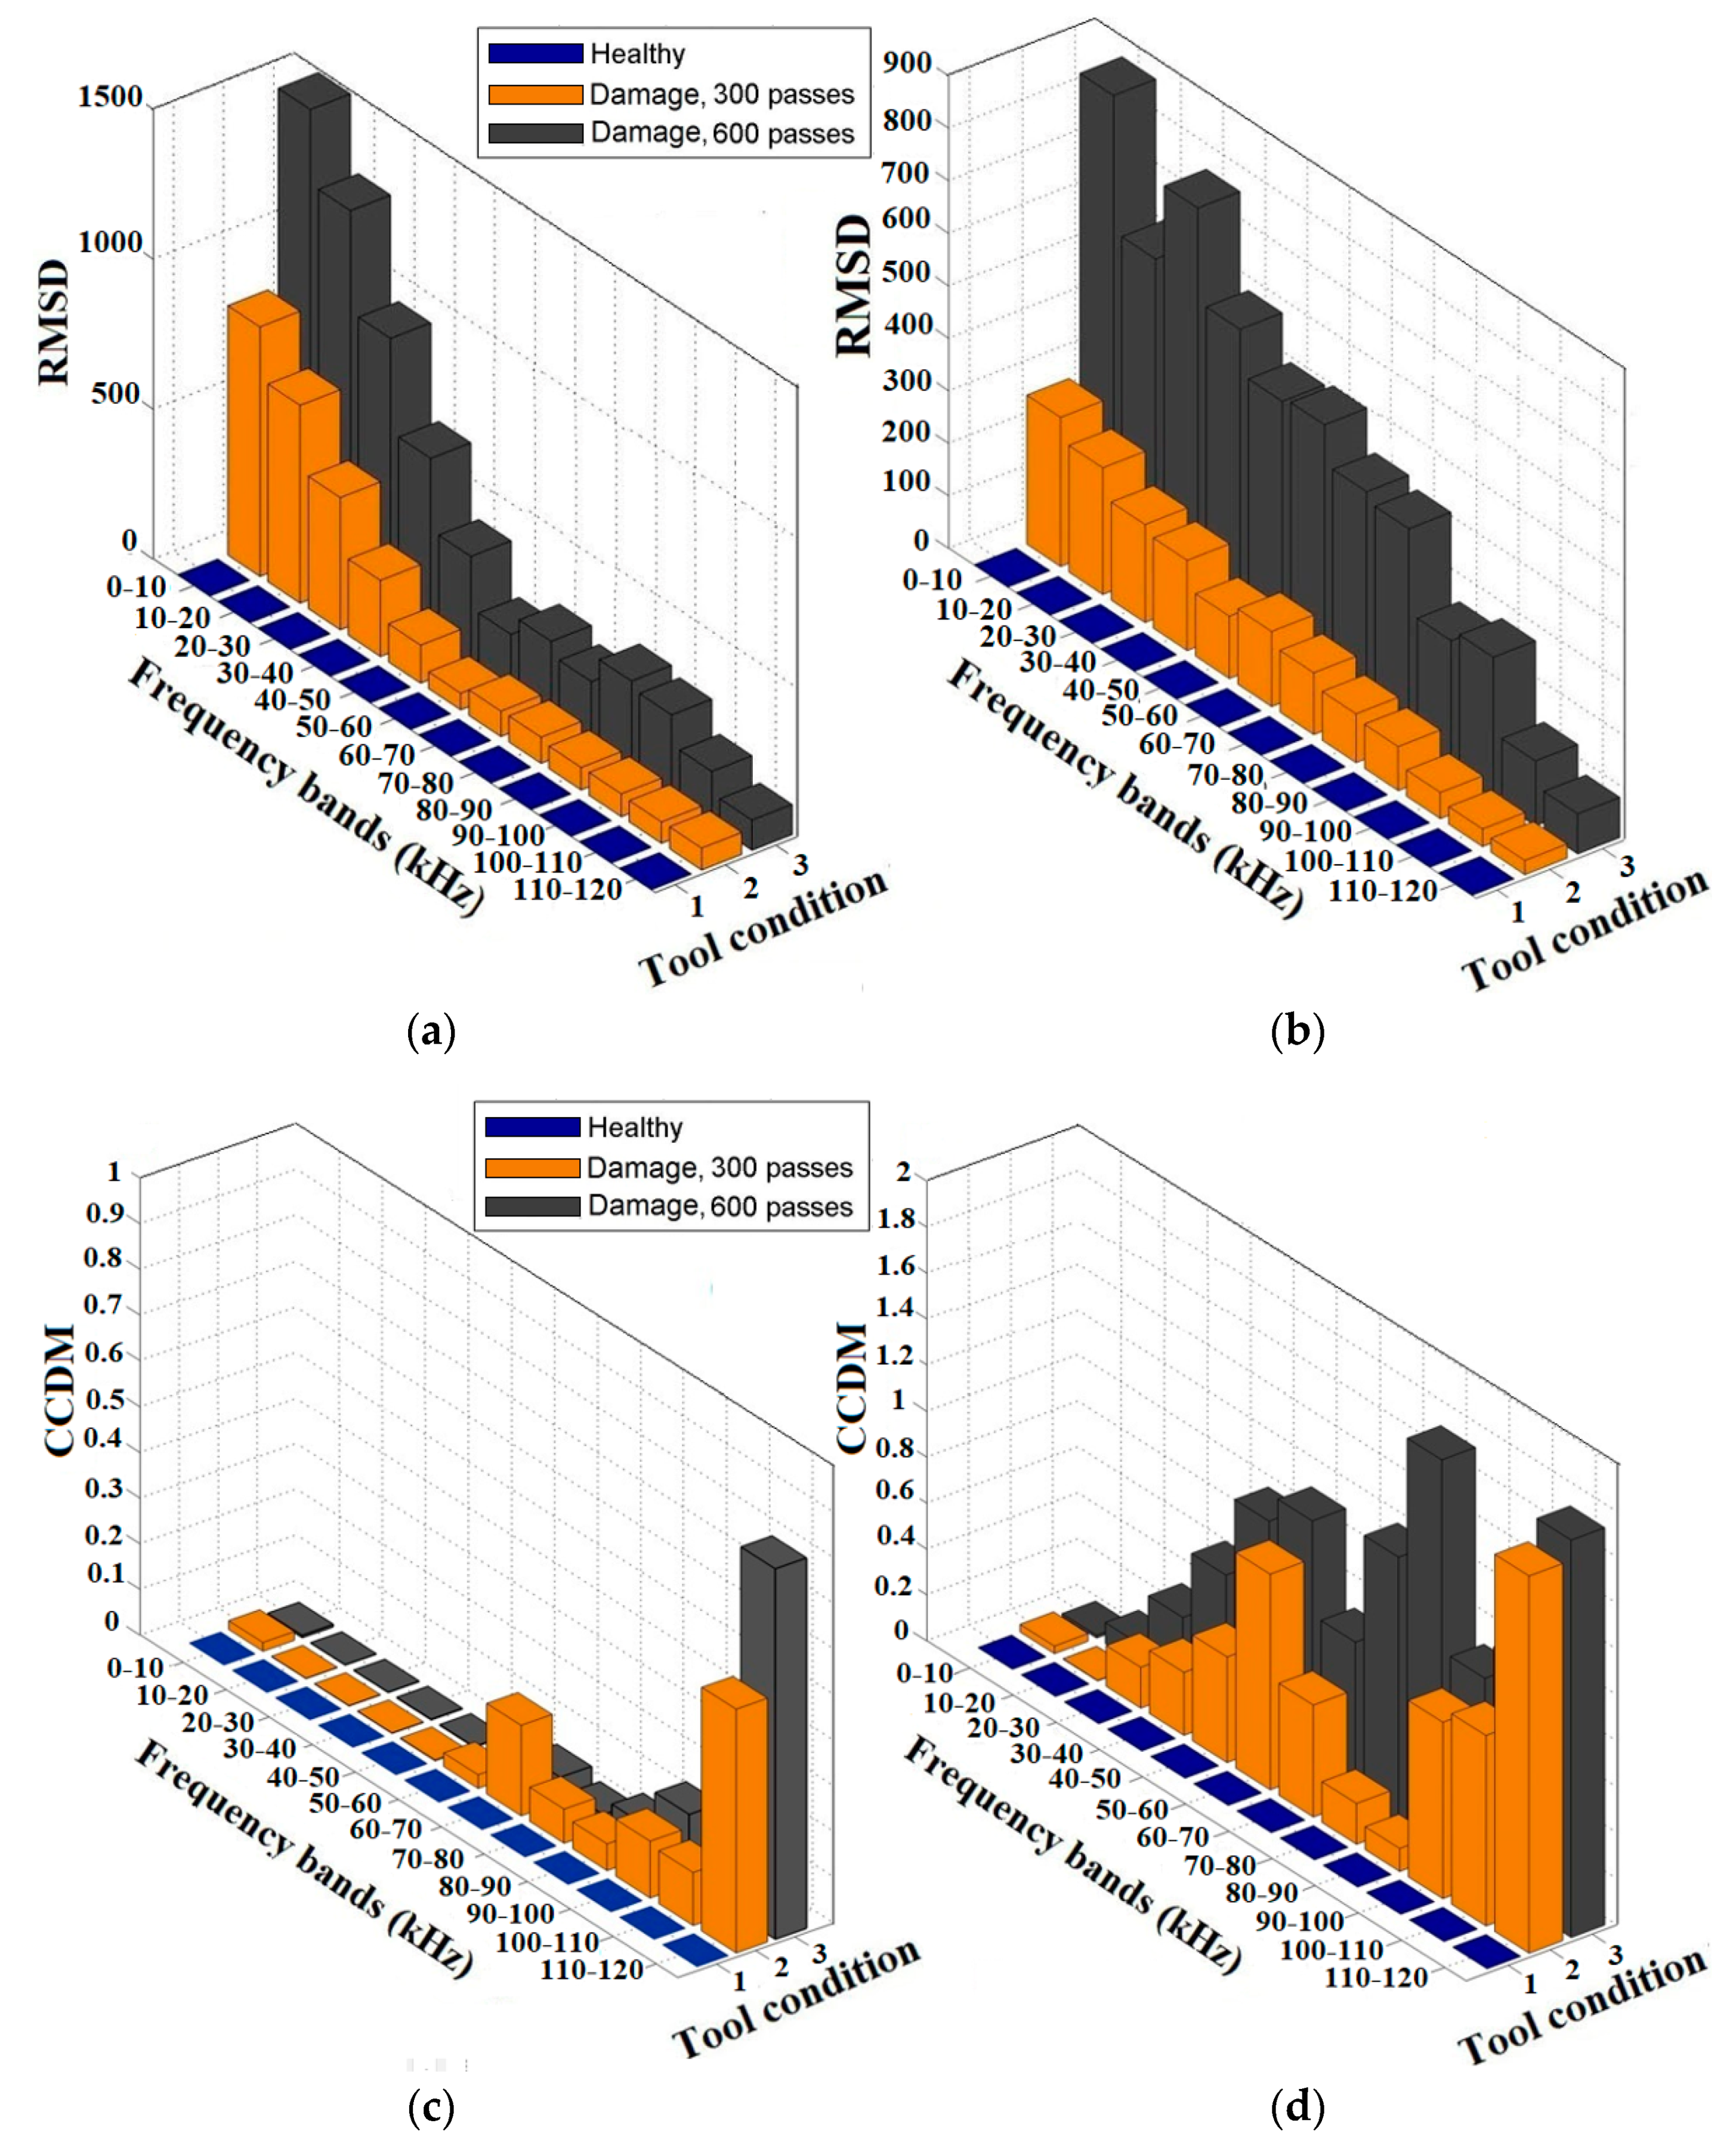
| PZT1, CVD diamond | −14.23 | 140.4 | 134.1 | 132.1 | 831.3 | 1490 | 0.534 | 0.815 |
| PZT2, CVD diamond | −31.85 | 138.5 | 129.5 | 134.7 | 284.1 | 857.6 | 1.643 | 1.731 |
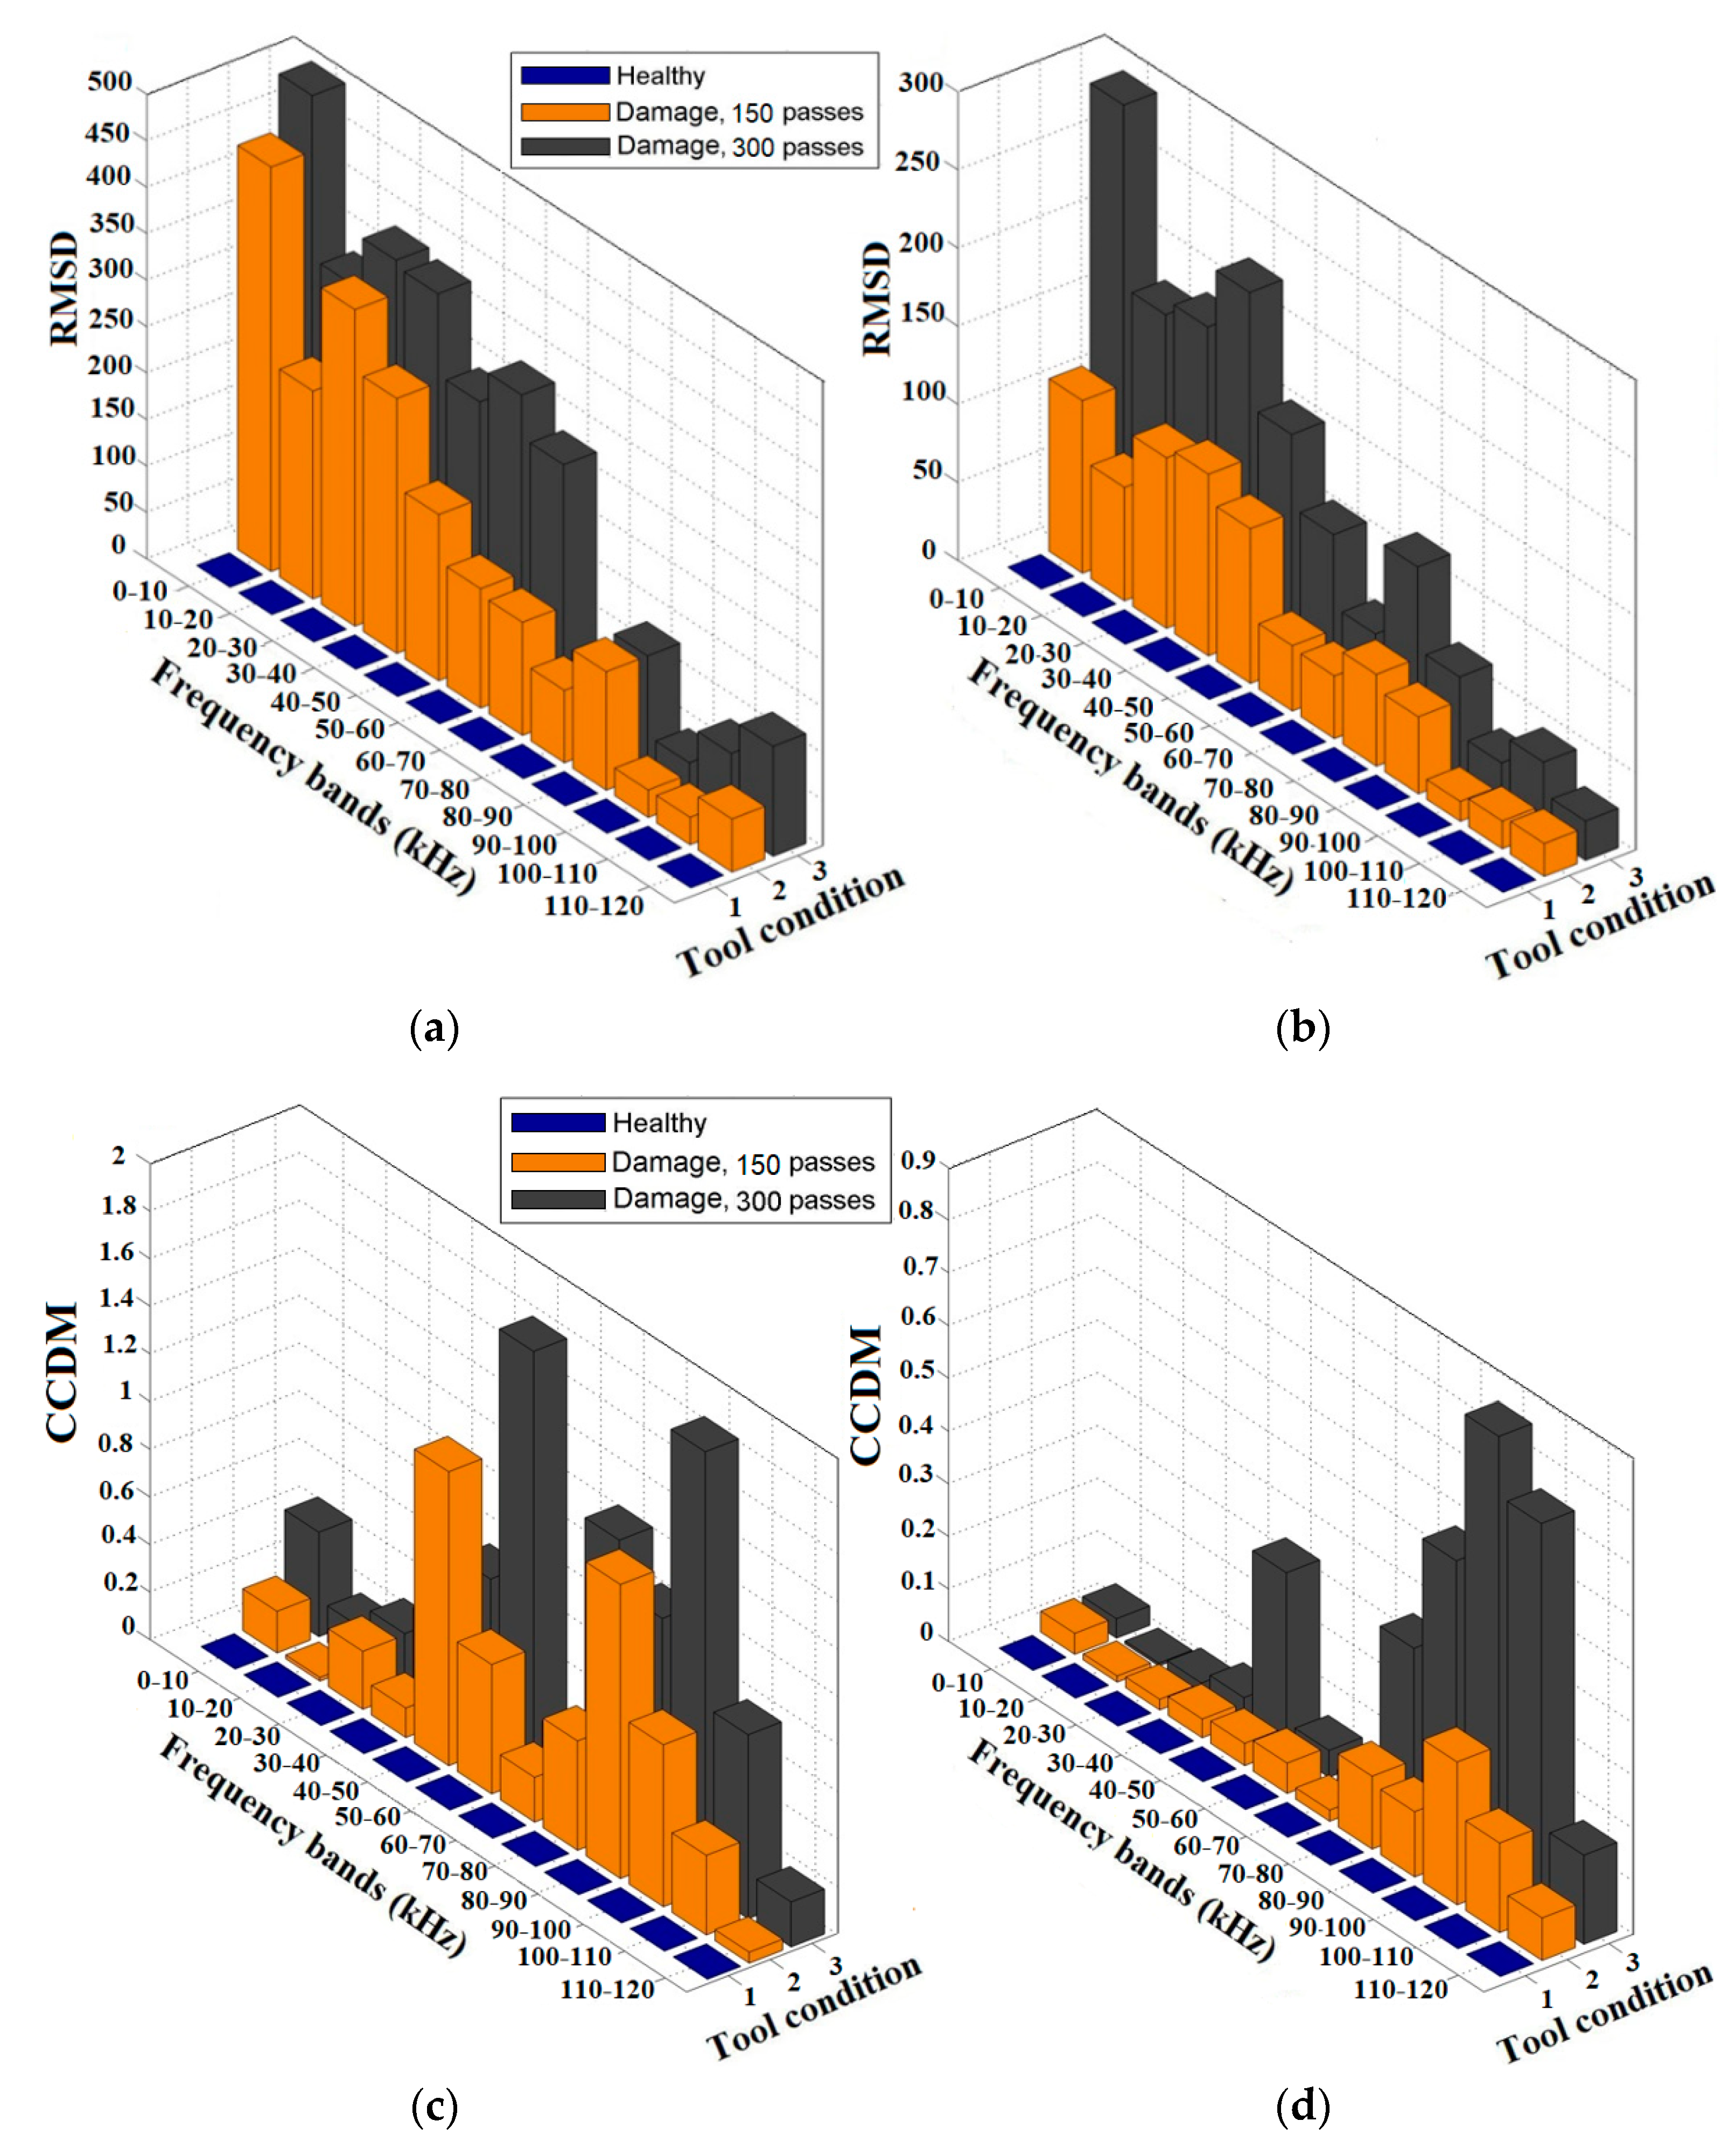
| PZT1, natural diamond | −22.66 | 106.6 | 113.2 | 113.4 | 435.2 | 495 | 1.236 | 1.845 |
| PZT2, natural diamond | −26.23 | 132.4 | 129.9 | 124 | 116.6 | 289.4 | 0.271 | 0.860 |
© 2018 by the authors. Licensee MDPI, Basel, Switzerland. This article is an open access article distributed under the terms and conditions of the Creative Commons Attribution (CC BY) license (http://creativecommons.org/licenses/by/4.0/).
Share and Cite
Junior, P.; D’Addona, D.M.; Aguiar, P.R.; Teti, R. Dressing Tool Condition Monitoring through Impedance-Based Sensors: Part 1—PZT Diaphragm Transducer Response and EMI Sensing Technique. Sensors 2018, 18, 4455. https://doi.org/10.3390/s18124455
Junior P, D’Addona DM, Aguiar PR, Teti R. Dressing Tool Condition Monitoring through Impedance-Based Sensors: Part 1—PZT Diaphragm Transducer Response and EMI Sensing Technique. Sensors. 2018; 18(12):4455. https://doi.org/10.3390/s18124455
Chicago/Turabian StyleJunior, Pedro, Doriana M. D’Addona, Paulo R. Aguiar, and Roberto Teti. 2018. "Dressing Tool Condition Monitoring through Impedance-Based Sensors: Part 1—PZT Diaphragm Transducer Response and EMI Sensing Technique" Sensors 18, no. 12: 4455. https://doi.org/10.3390/s18124455
APA StyleJunior, P., D’Addona, D. M., Aguiar, P. R., & Teti, R. (2018). Dressing Tool Condition Monitoring through Impedance-Based Sensors: Part 1—PZT Diaphragm Transducer Response and EMI Sensing Technique. Sensors, 18(12), 4455. https://doi.org/10.3390/s18124455