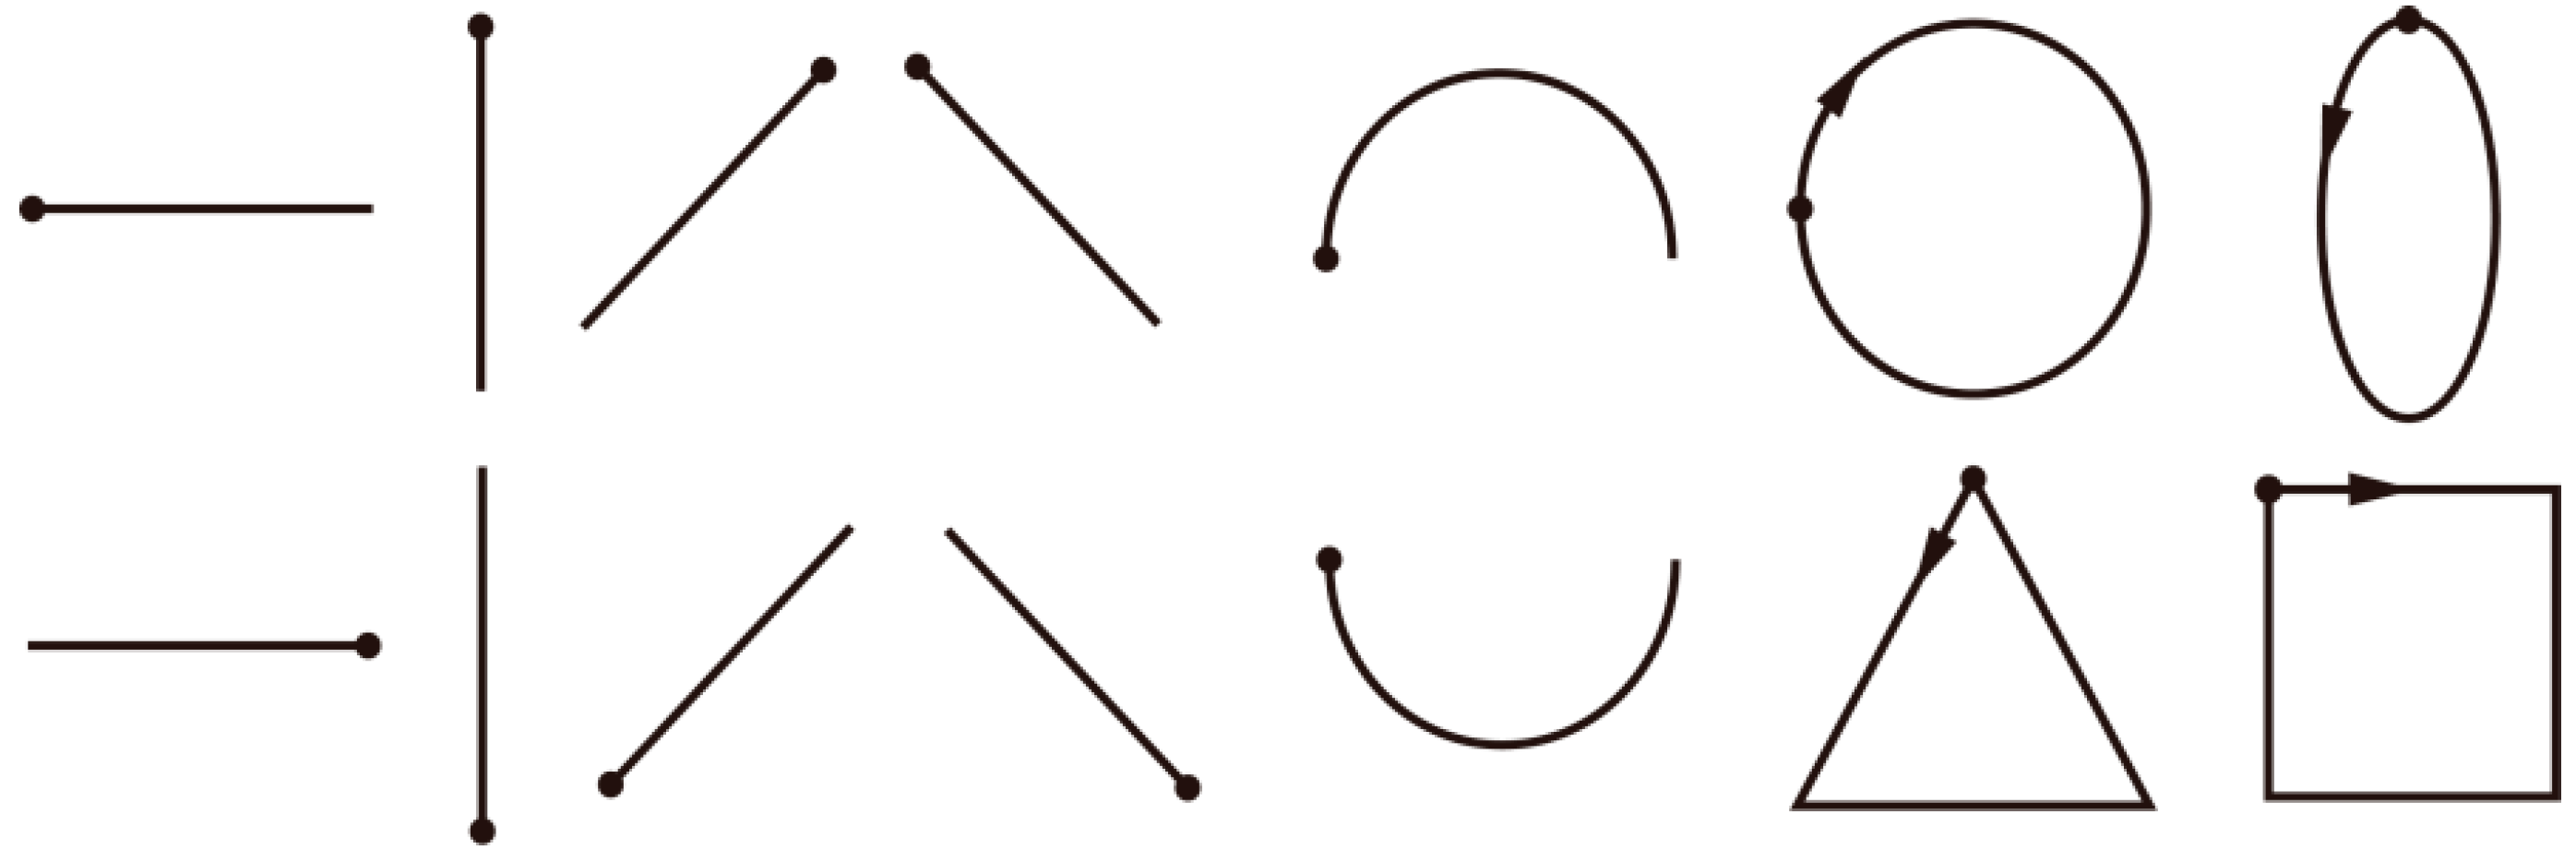
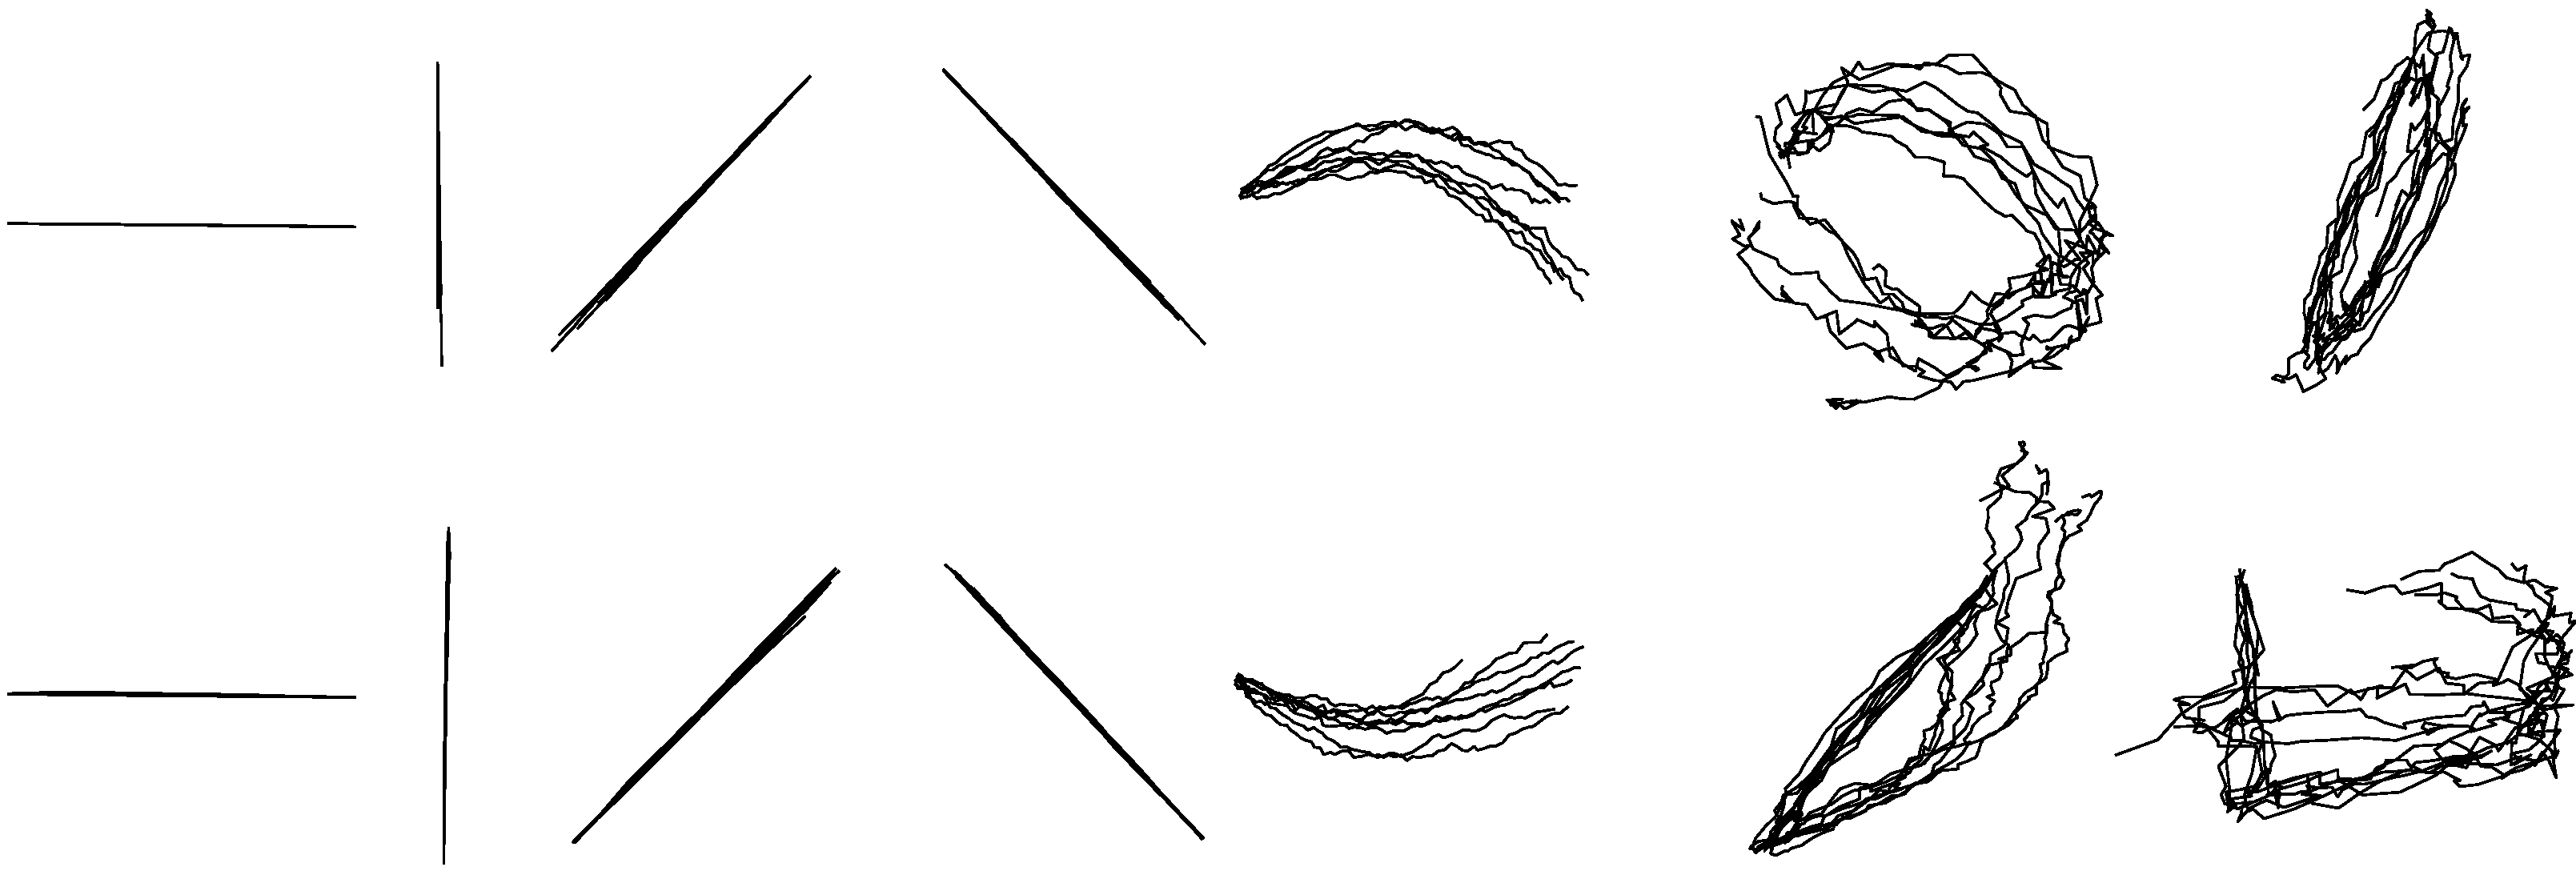
Figure 1.
The fourteen basic one-stroke hand-drawn shapes used in our study. Dots represent starting points, arrows represent directions. The shapes are, from left to right, in order, horizontal line, vertical line, forward slash, backslash, arch, circle, ellipse, reversed horizontal line, reversed vertical line, reversed forward slash, reversed backslash, reversed arch, square and triangle.
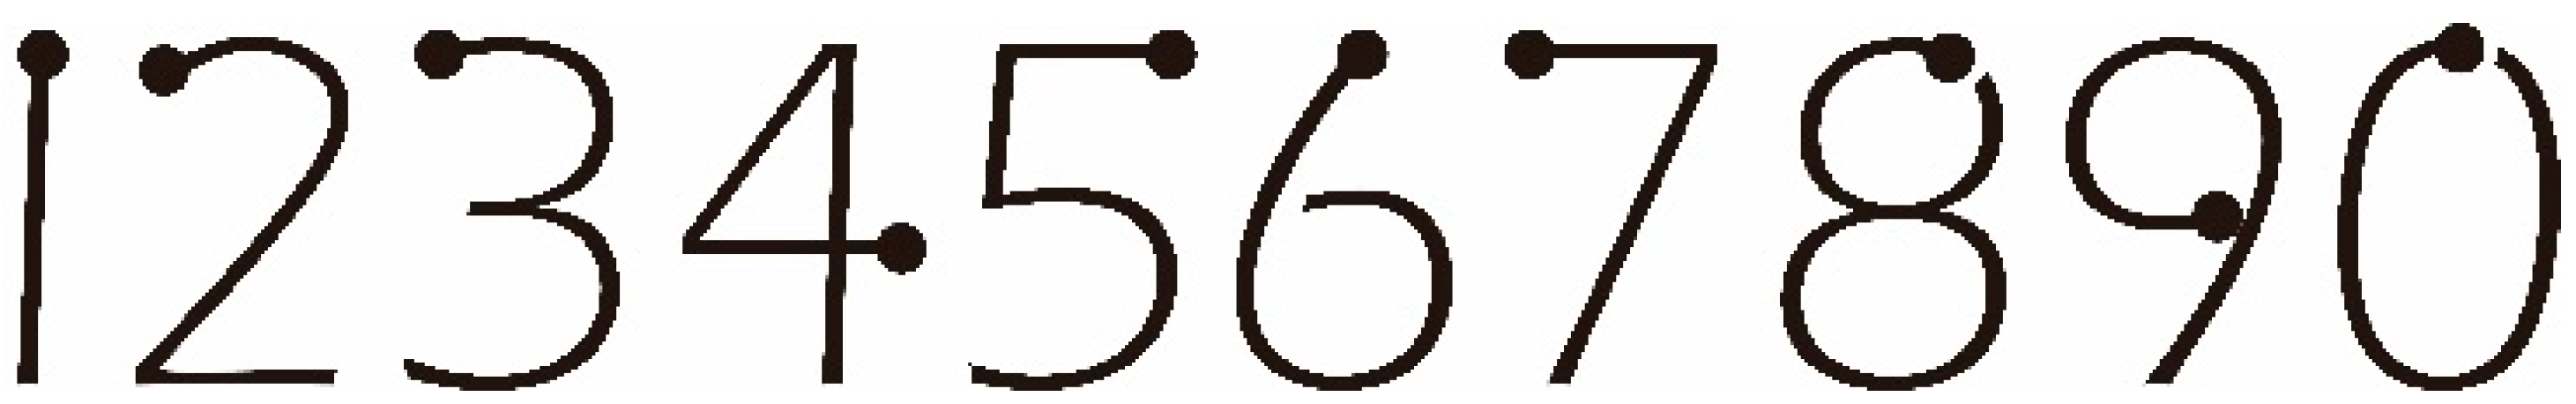
Figure 2.
The ten numeric characters used in our study. Dots represent starting points.
Figure 2.
The ten numeric characters used in our study. Dots represent starting points.
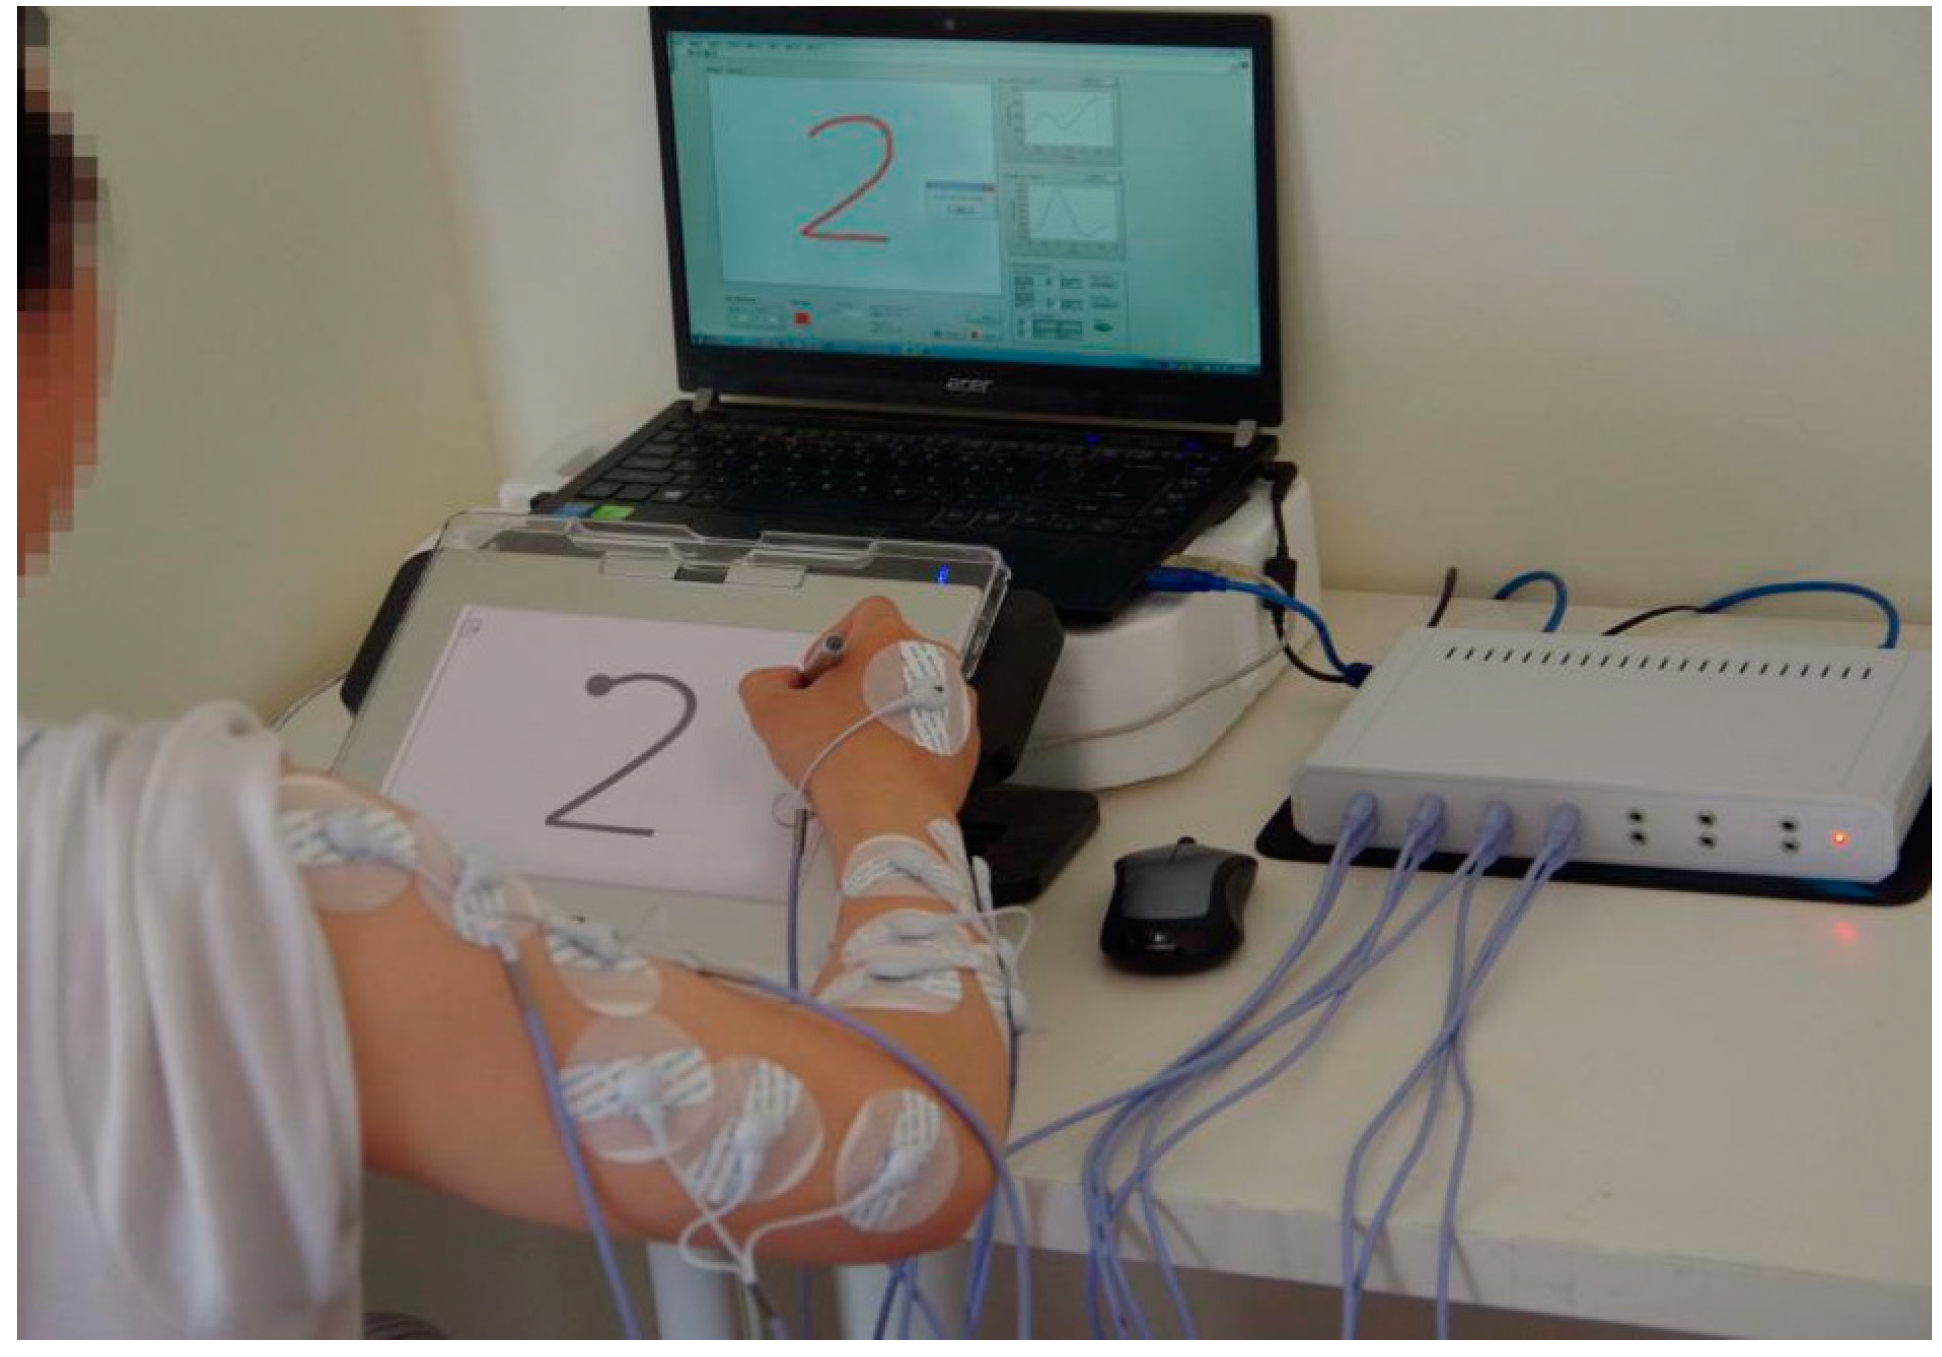
Figure 3.
A photograph of one subject in the task stage.
Figure 3.
A photograph of one subject in the task stage.
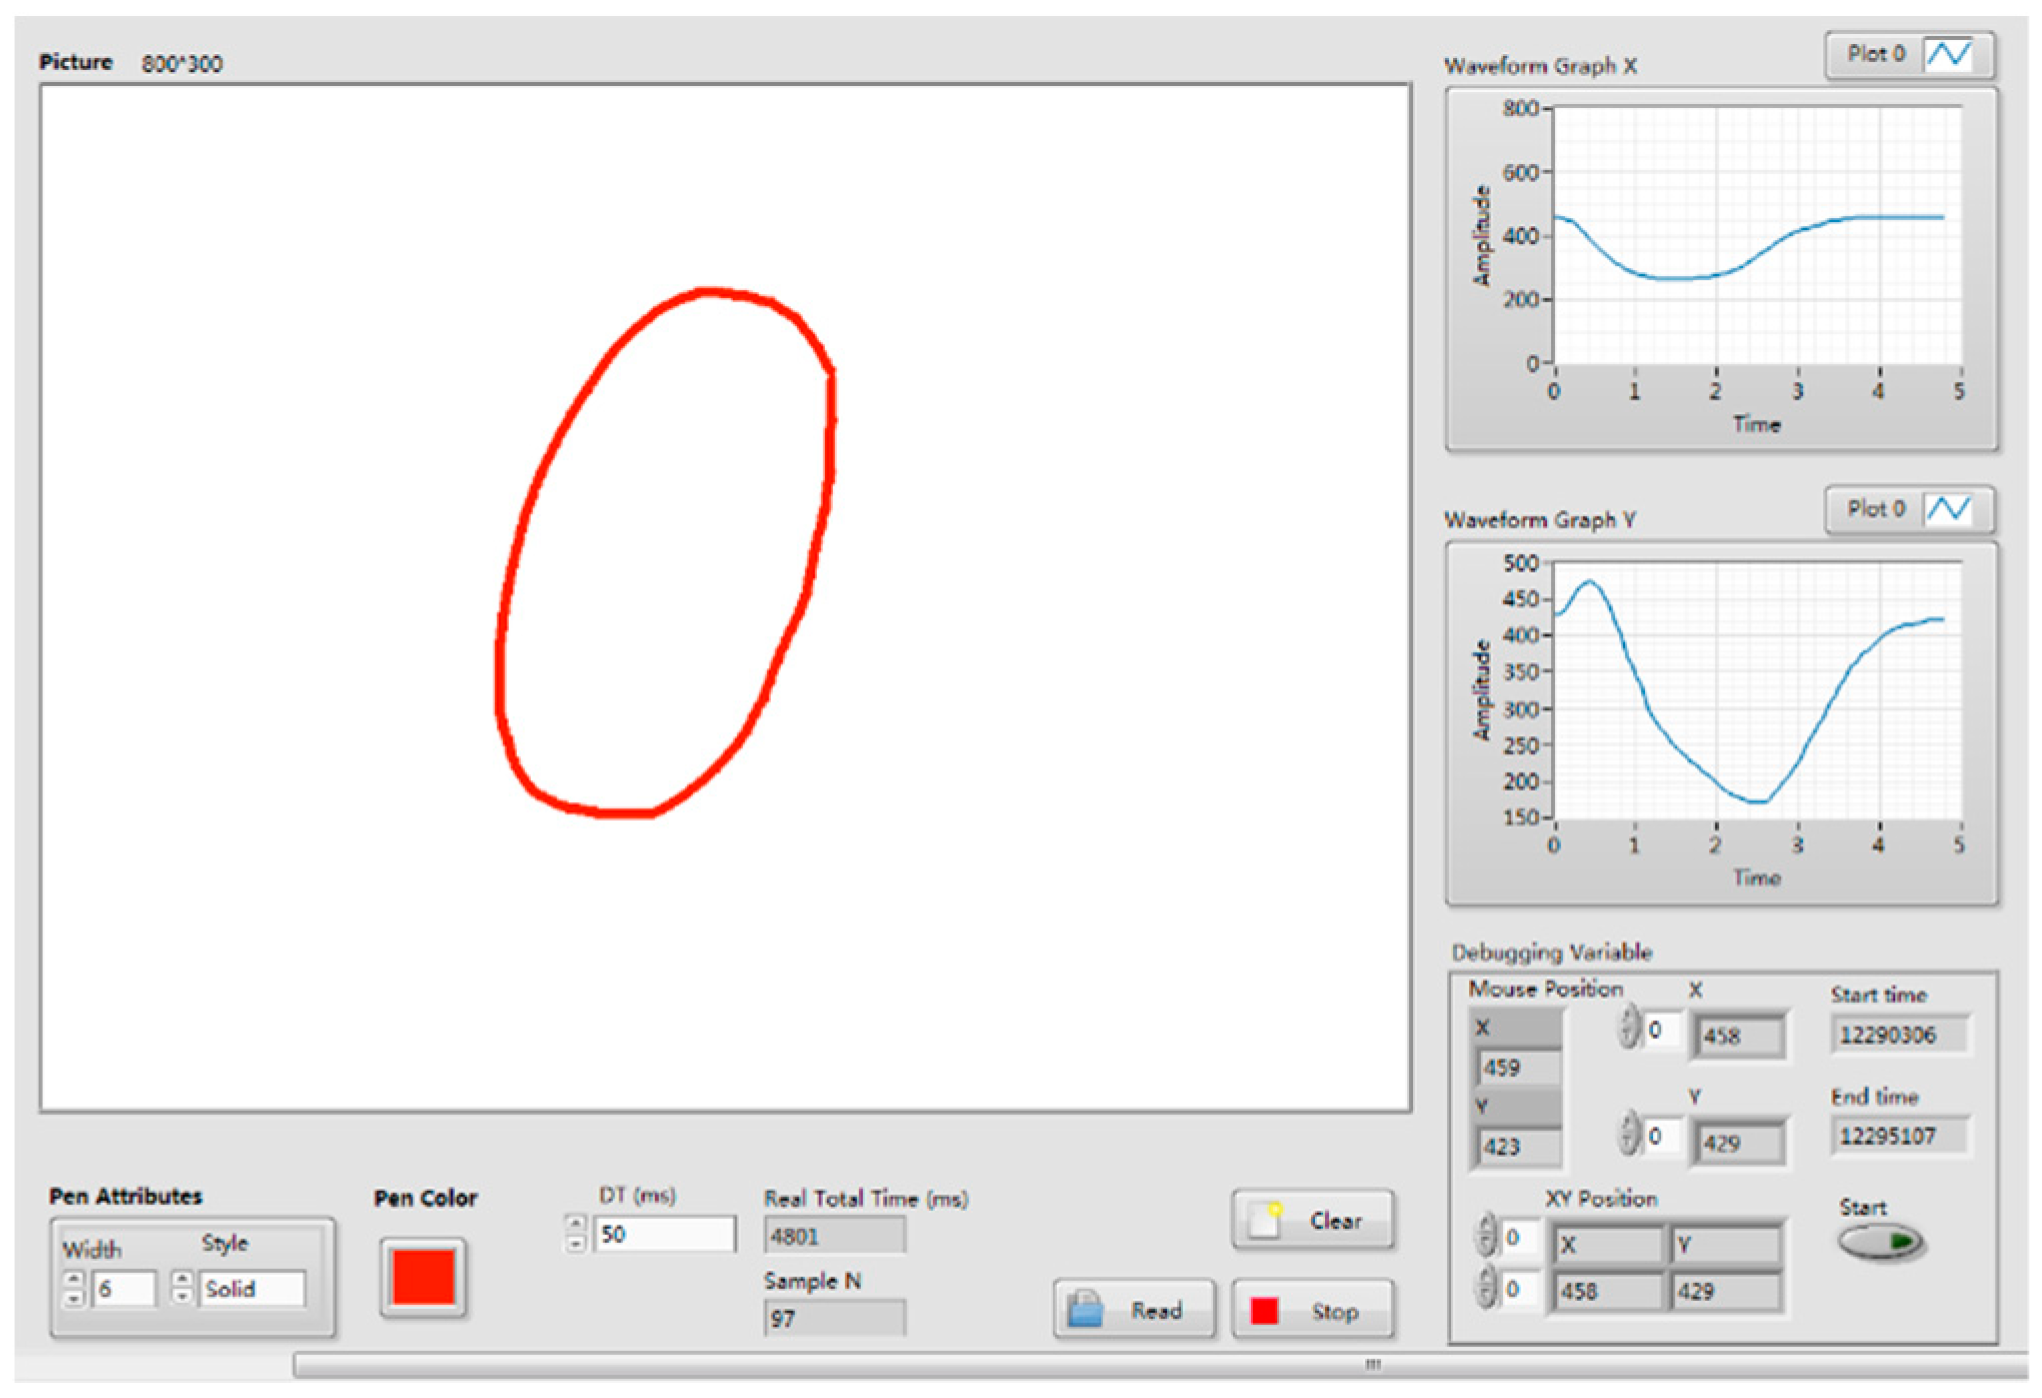
Figure 4.
The Drawing Coordinates Acquisition System (DCAS) software developed in Labview.
Figure 4.
The Drawing Coordinates Acquisition System (DCAS) software developed in Labview.
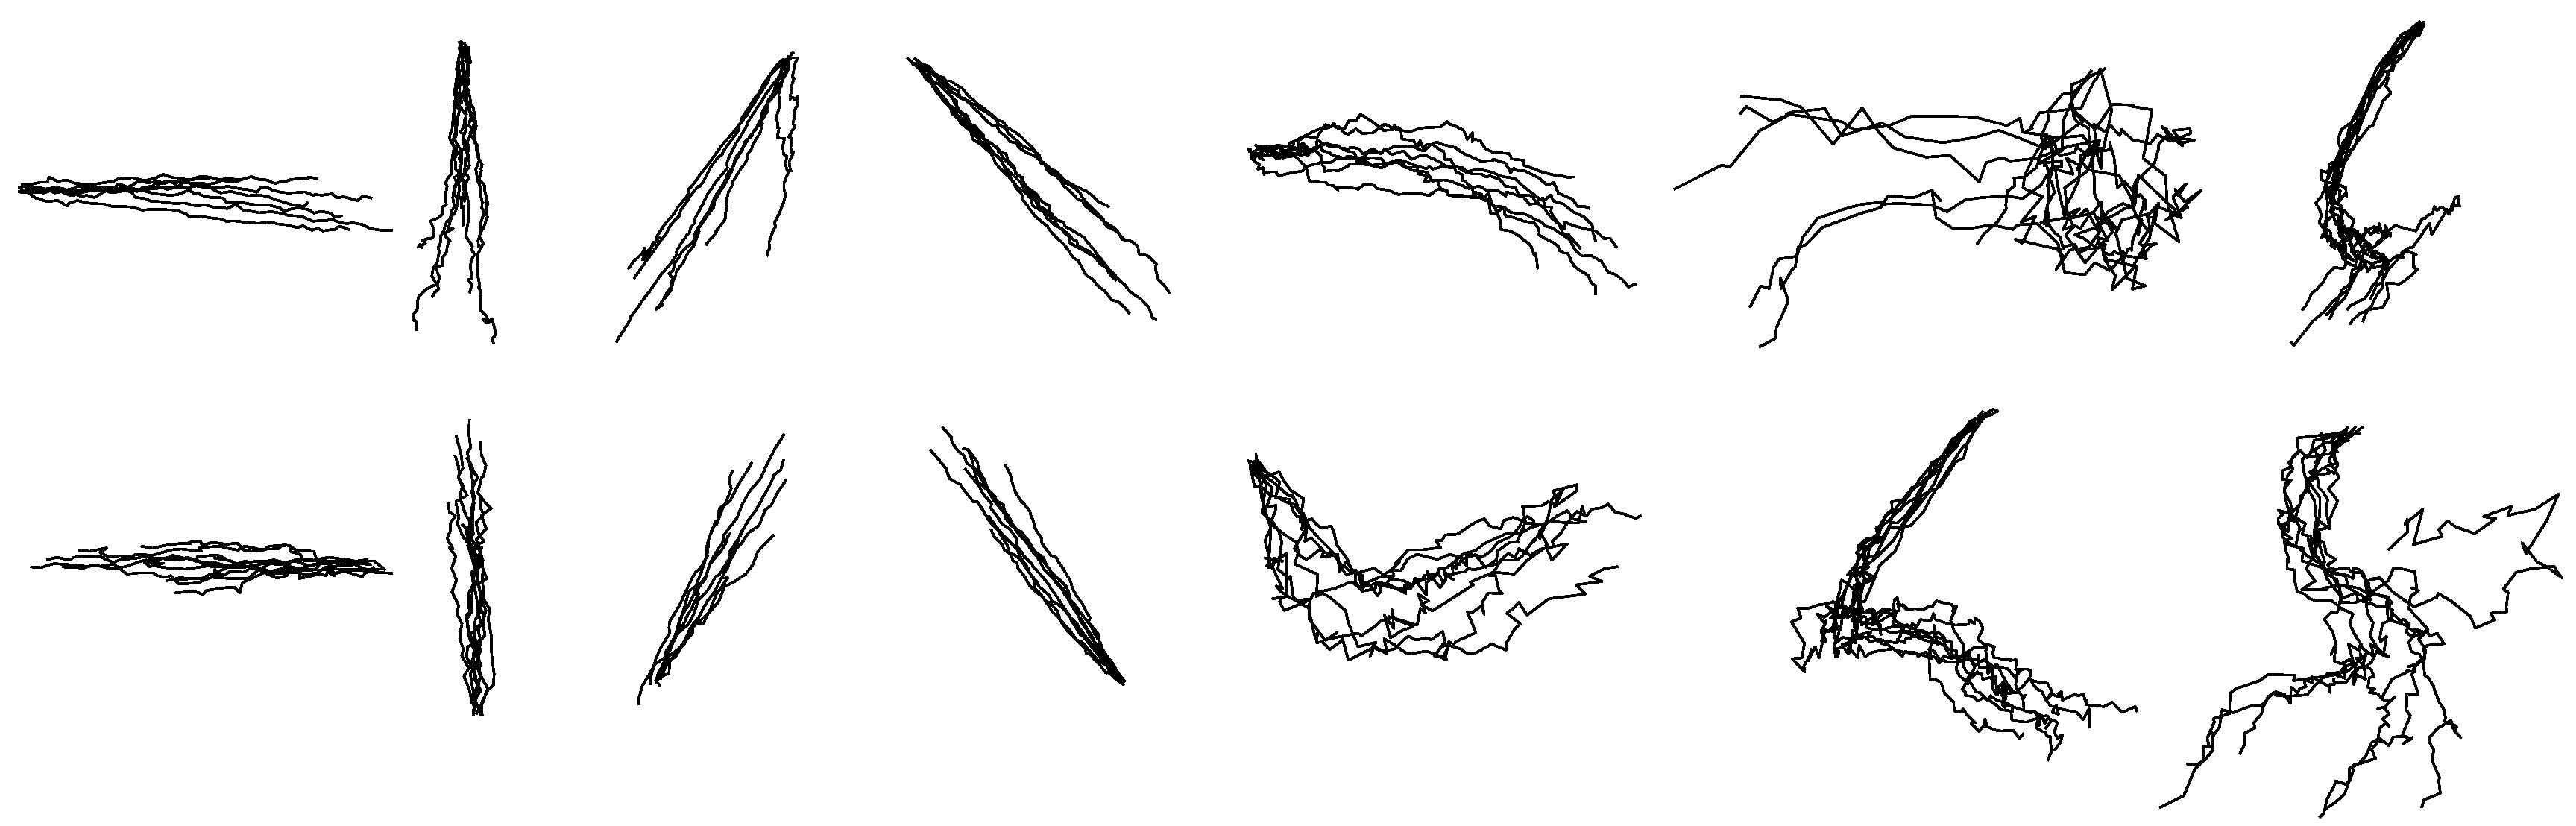
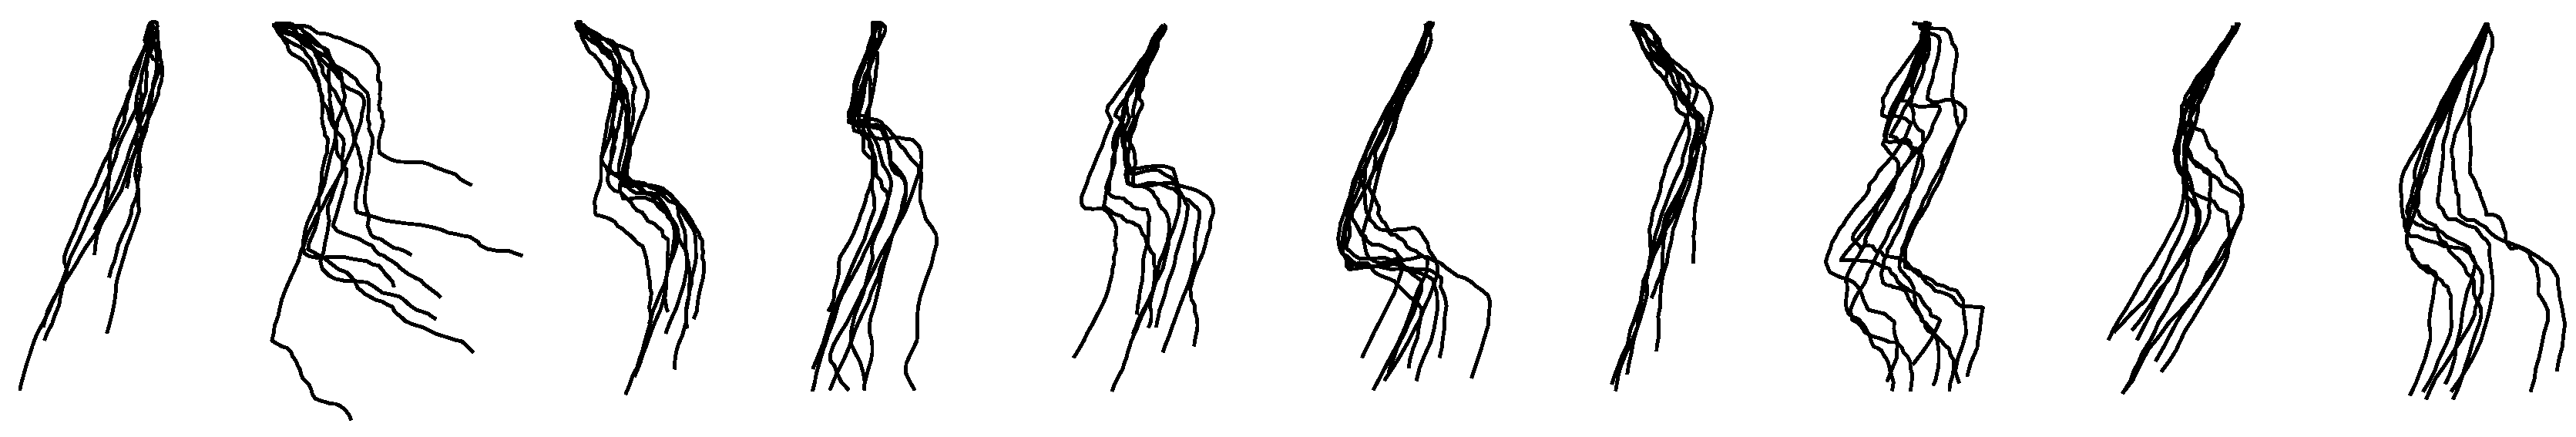
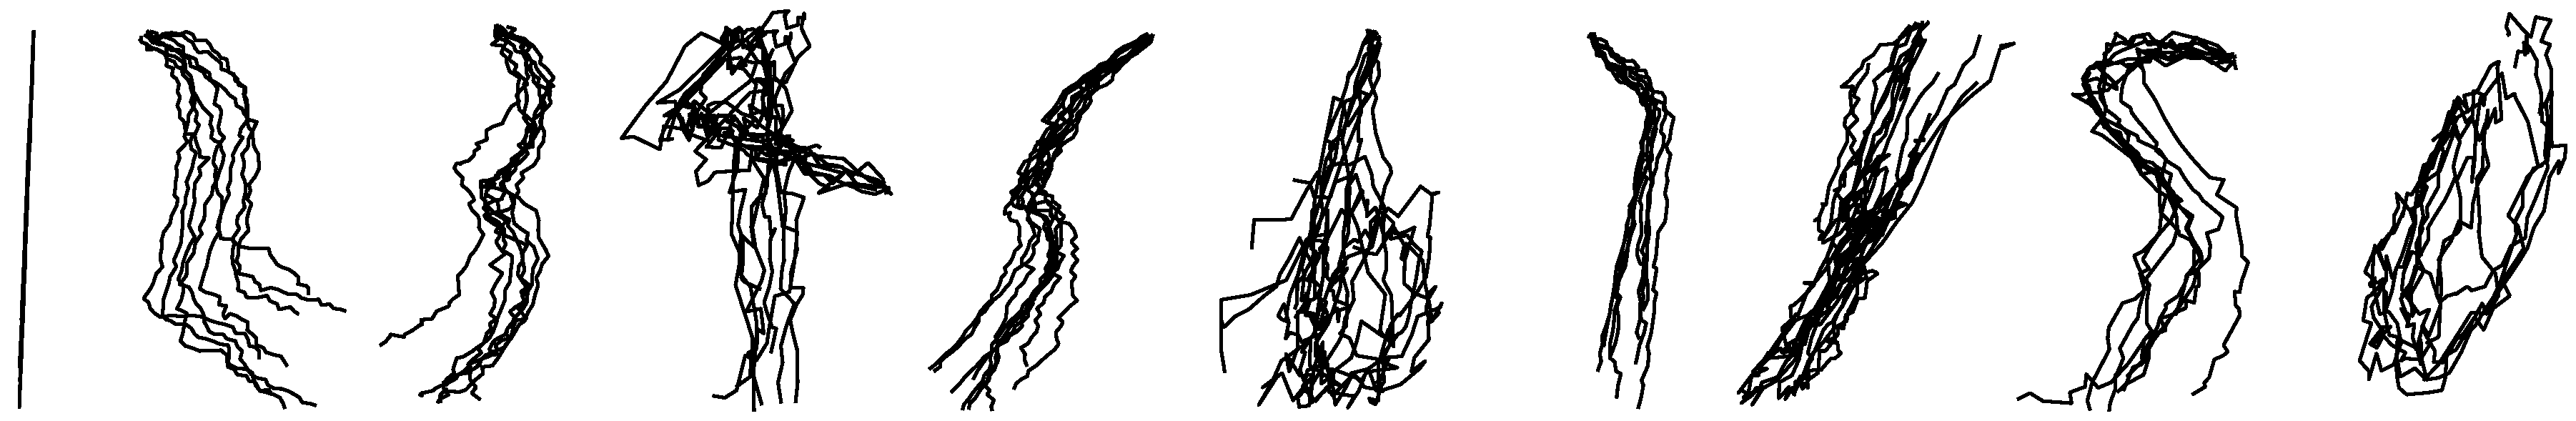
Figure 5.
The randomly selected reconstructed drawing traces of with-group reconstruction by the KF-GEP. The shapes are, from left to right, in order, horizontal line, vertical line, forward slash, backslash, arch, circle, ellipse, reversed horizontal line, reversed vertical line, reversed forward slash, reversed backslash, reversed arch, square and triangle.
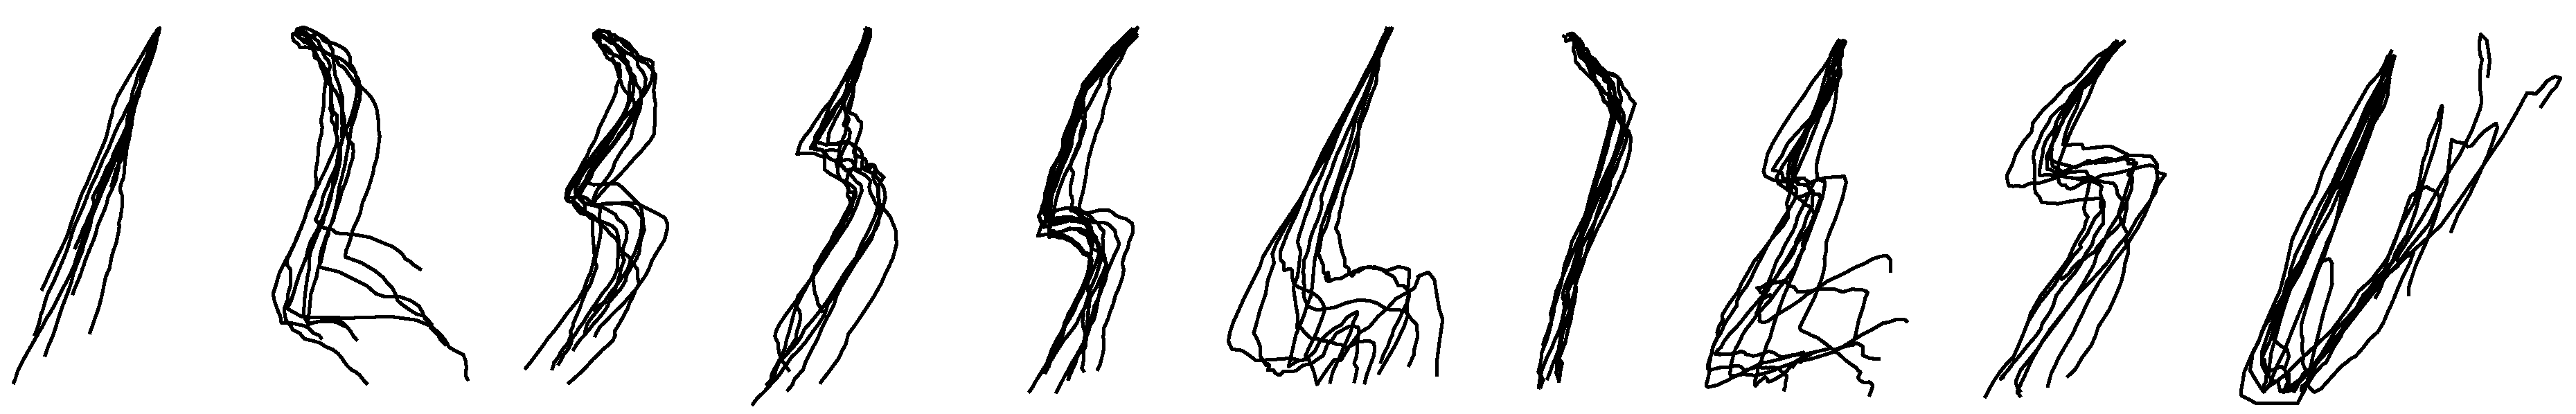
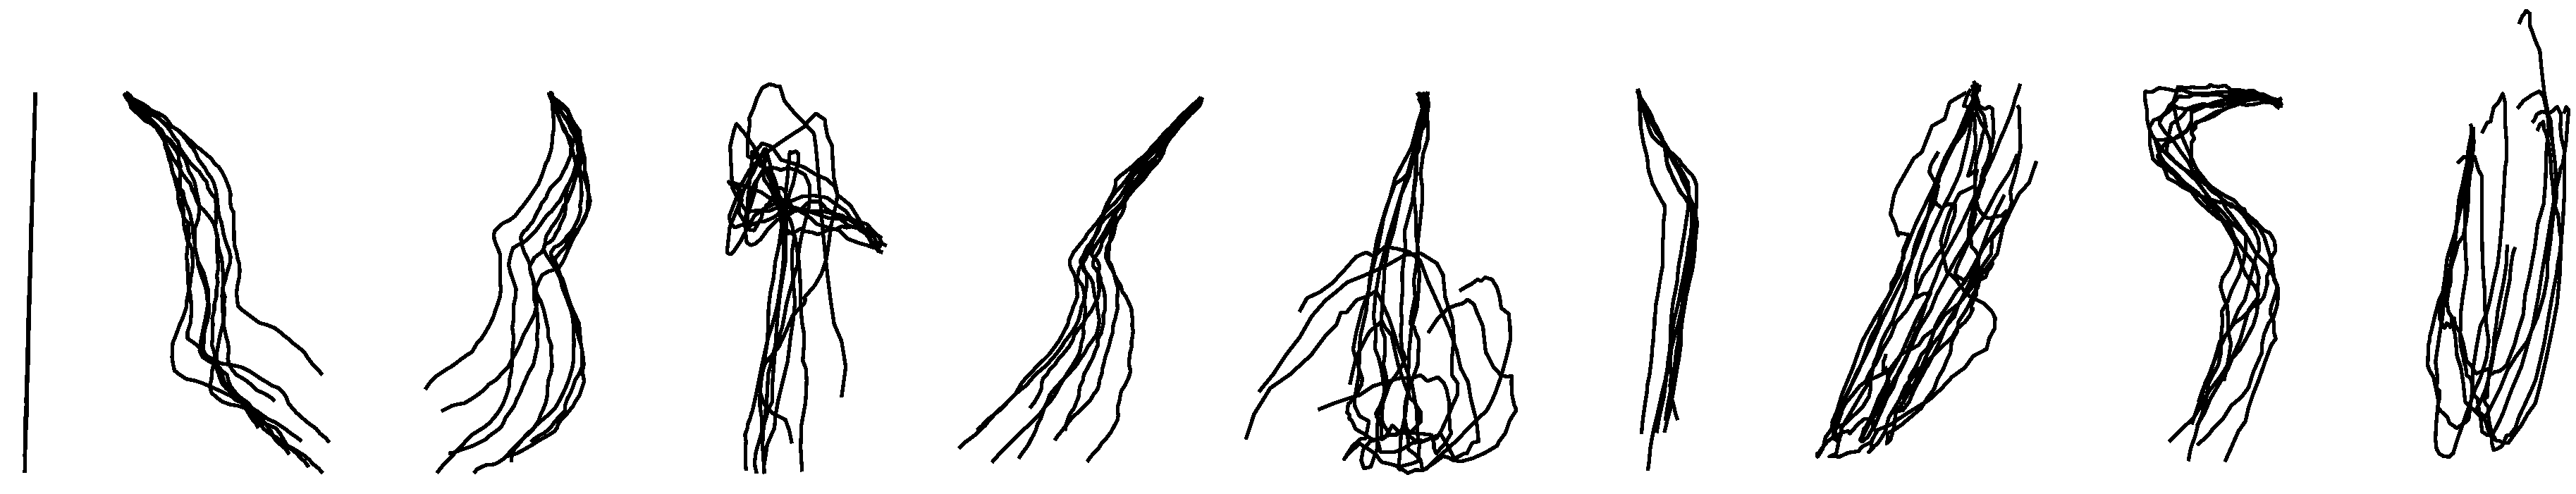
Figure 6.
The randomly selected reconstructed numeric characters of with-group reconstruction by the KF-GEP.
Figure 6.
The randomly selected reconstructed numeric characters of with-group reconstruction by the KF-GEP.
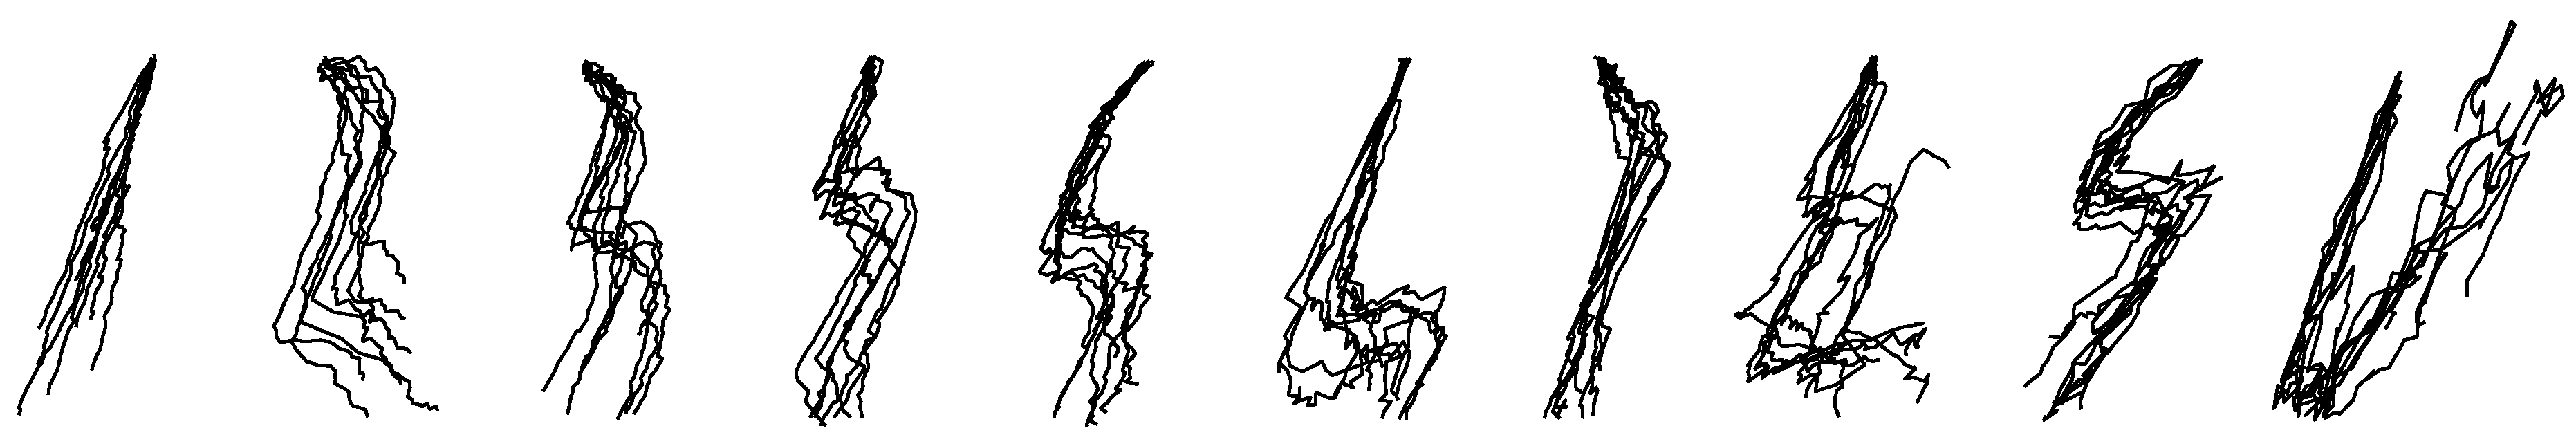
Figure 7.
The randomly selected reconstructed drawing traces of between-group reconstruction by the KF-GEP.
Figure 7.
The randomly selected reconstructed drawing traces of between-group reconstruction by the KF-GEP.
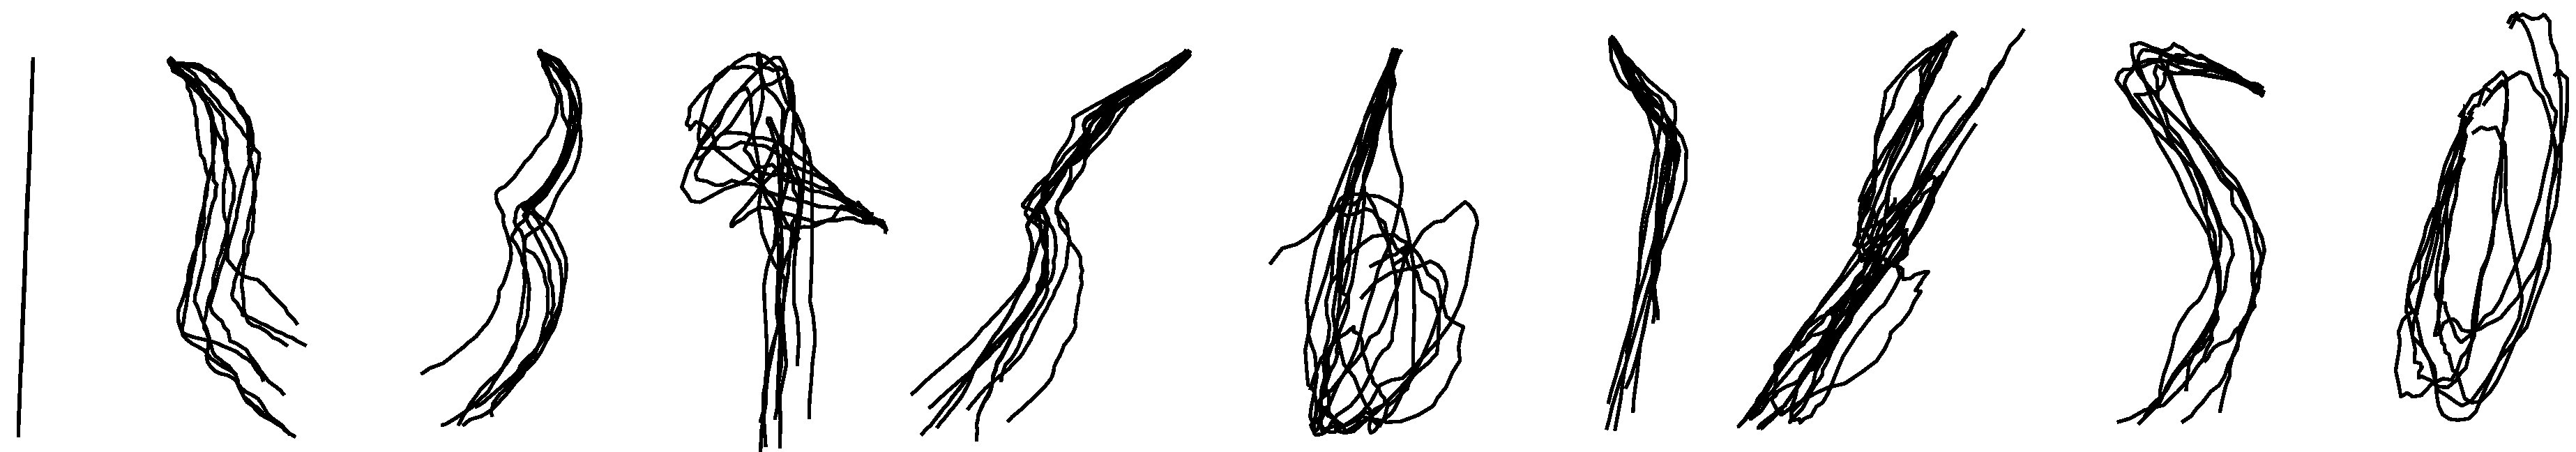
Figure 8.
The randomly selected reconstructed numeric character of between-group reconstruction by the KF-GEP.
Figure 8.
The randomly selected reconstructed numeric character of between-group reconstruction by the KF-GEP.
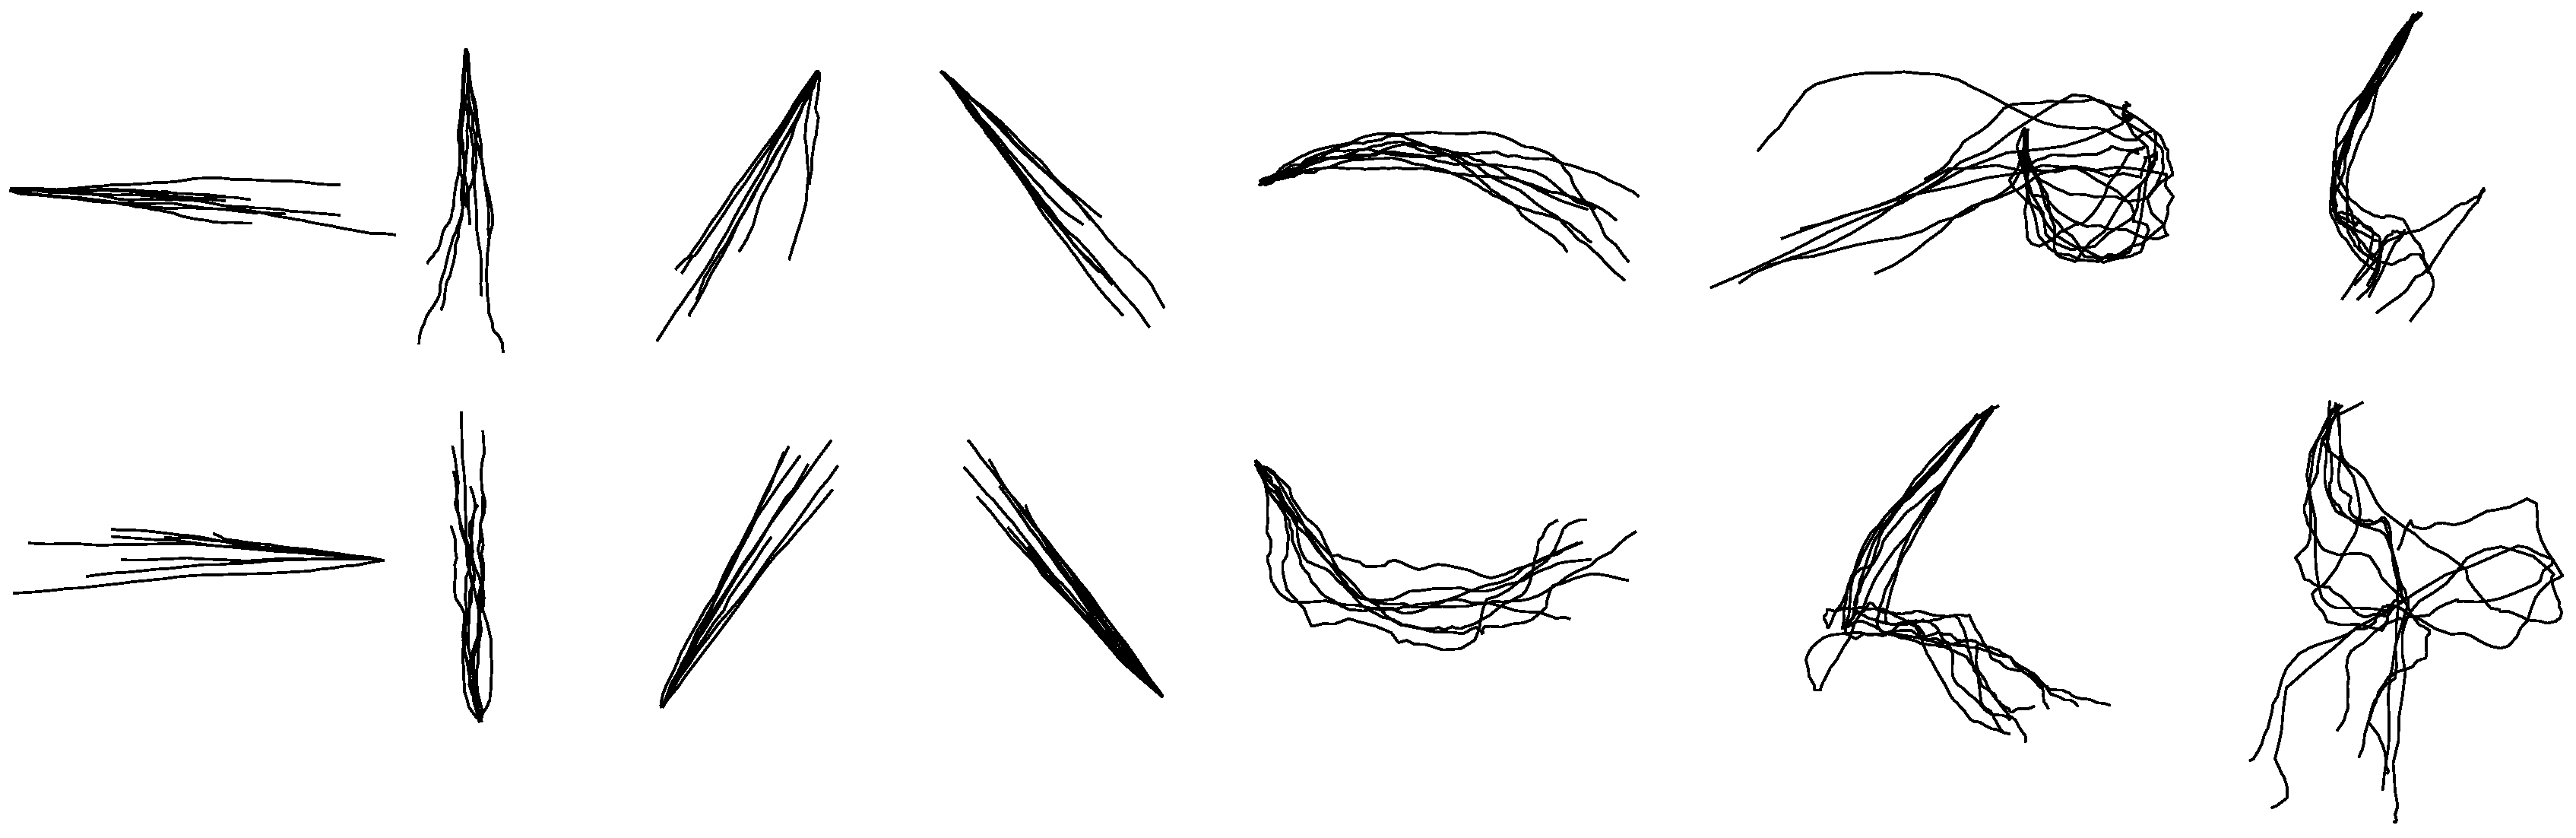
Figure 9.
The randomly selected reconstructed drawing traces of within-group reconstruction by the KF.
Figure 9.
The randomly selected reconstructed drawing traces of within-group reconstruction by the KF.
Figure 10.
The randomly selected reconstructed numeric character of within-group reconstruction by the KF.
Figure 10.
The randomly selected reconstructed numeric character of within-group reconstruction by the KF.
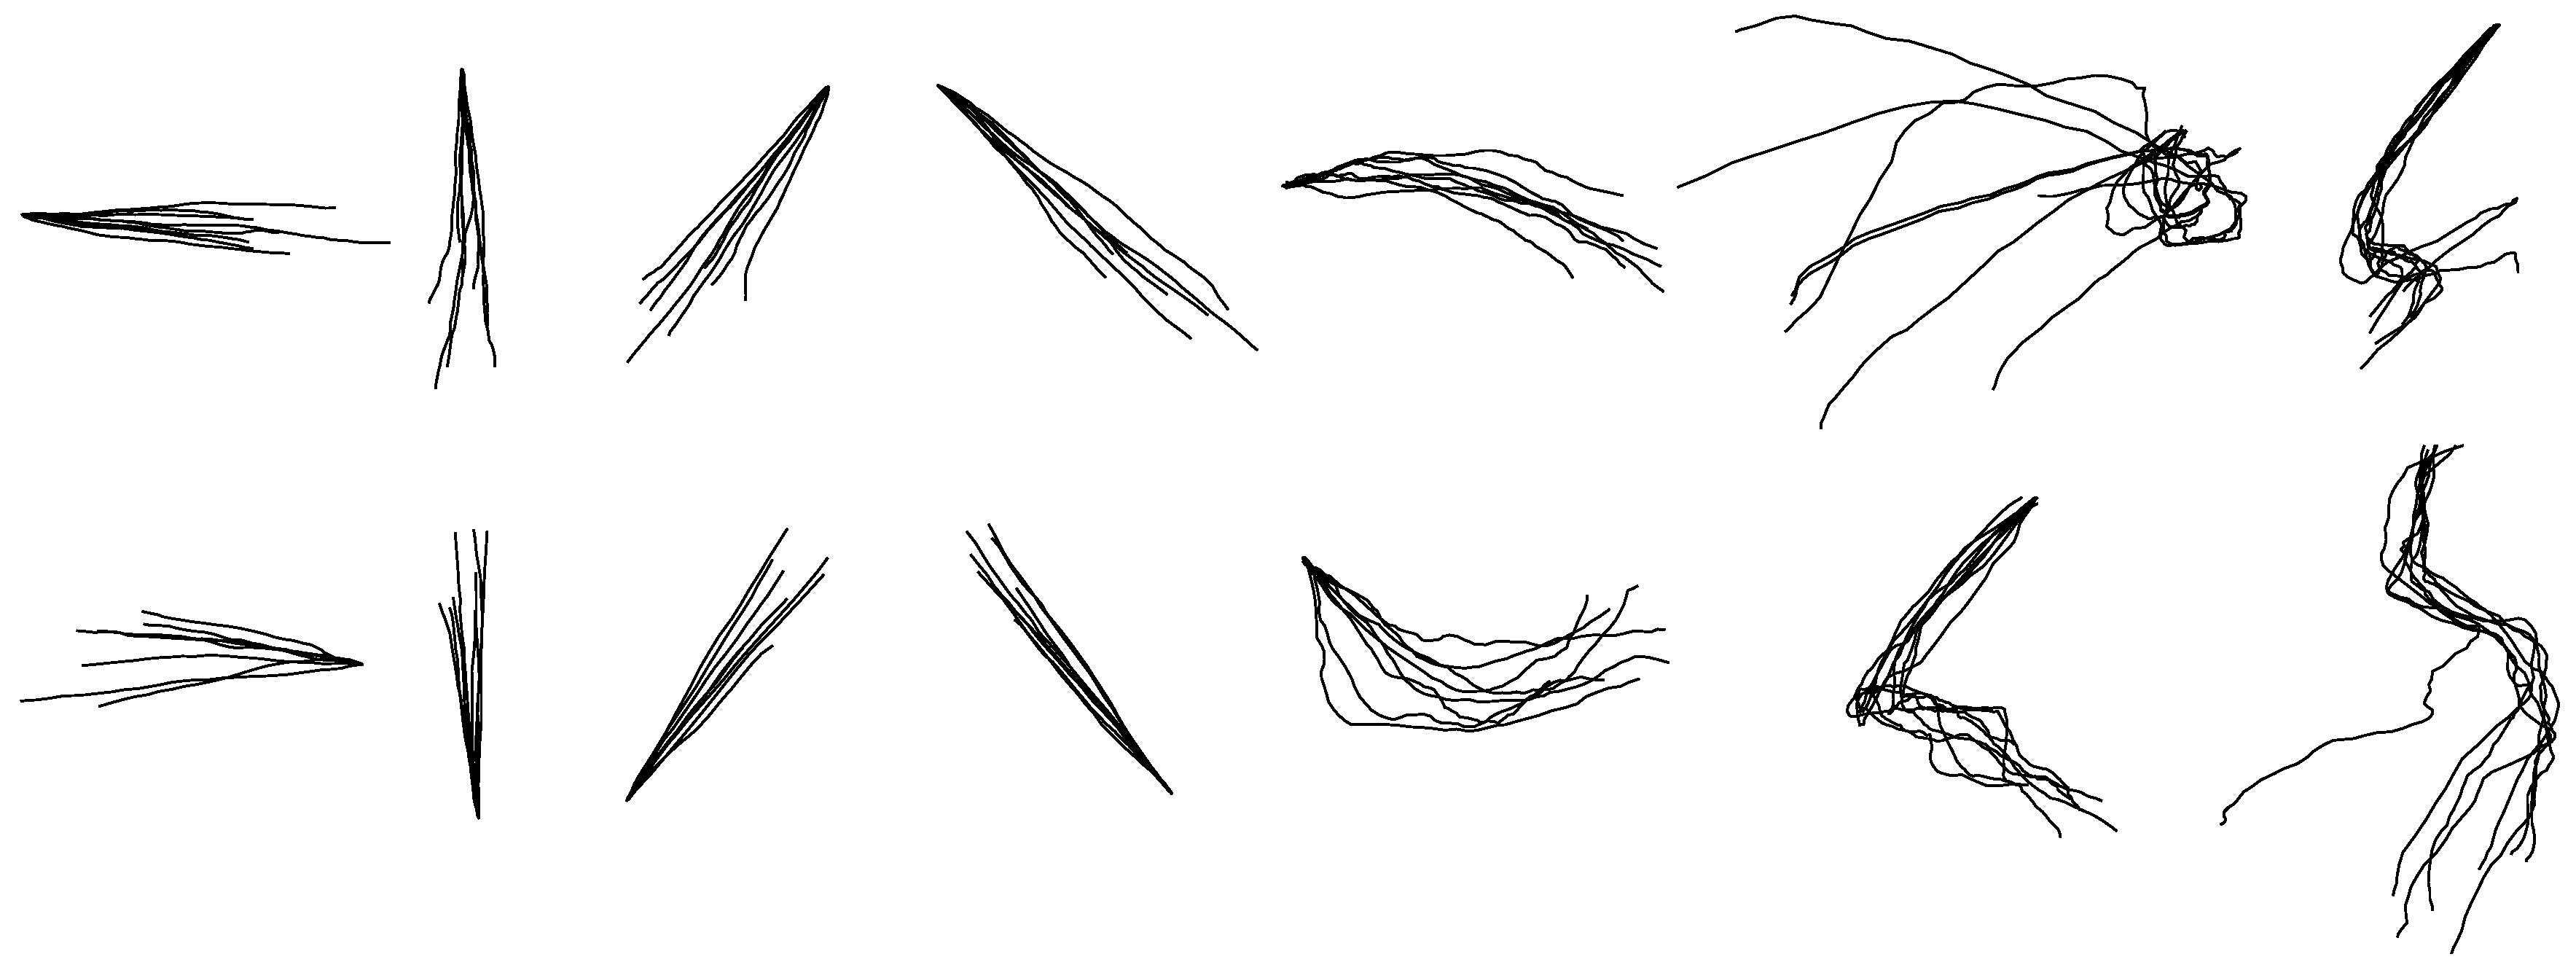
Figure 11.
The randomly selected reconstructed drawing traces of between-group reconstruction by the KF.
Figure 11.
The randomly selected reconstructed drawing traces of between-group reconstruction by the KF.
Figure 12.
The randomly selected reconstructed numeric character of between-group reconstruction by the KF.
Figure 12.
The randomly selected reconstructed numeric character of between-group reconstruction by the KF.
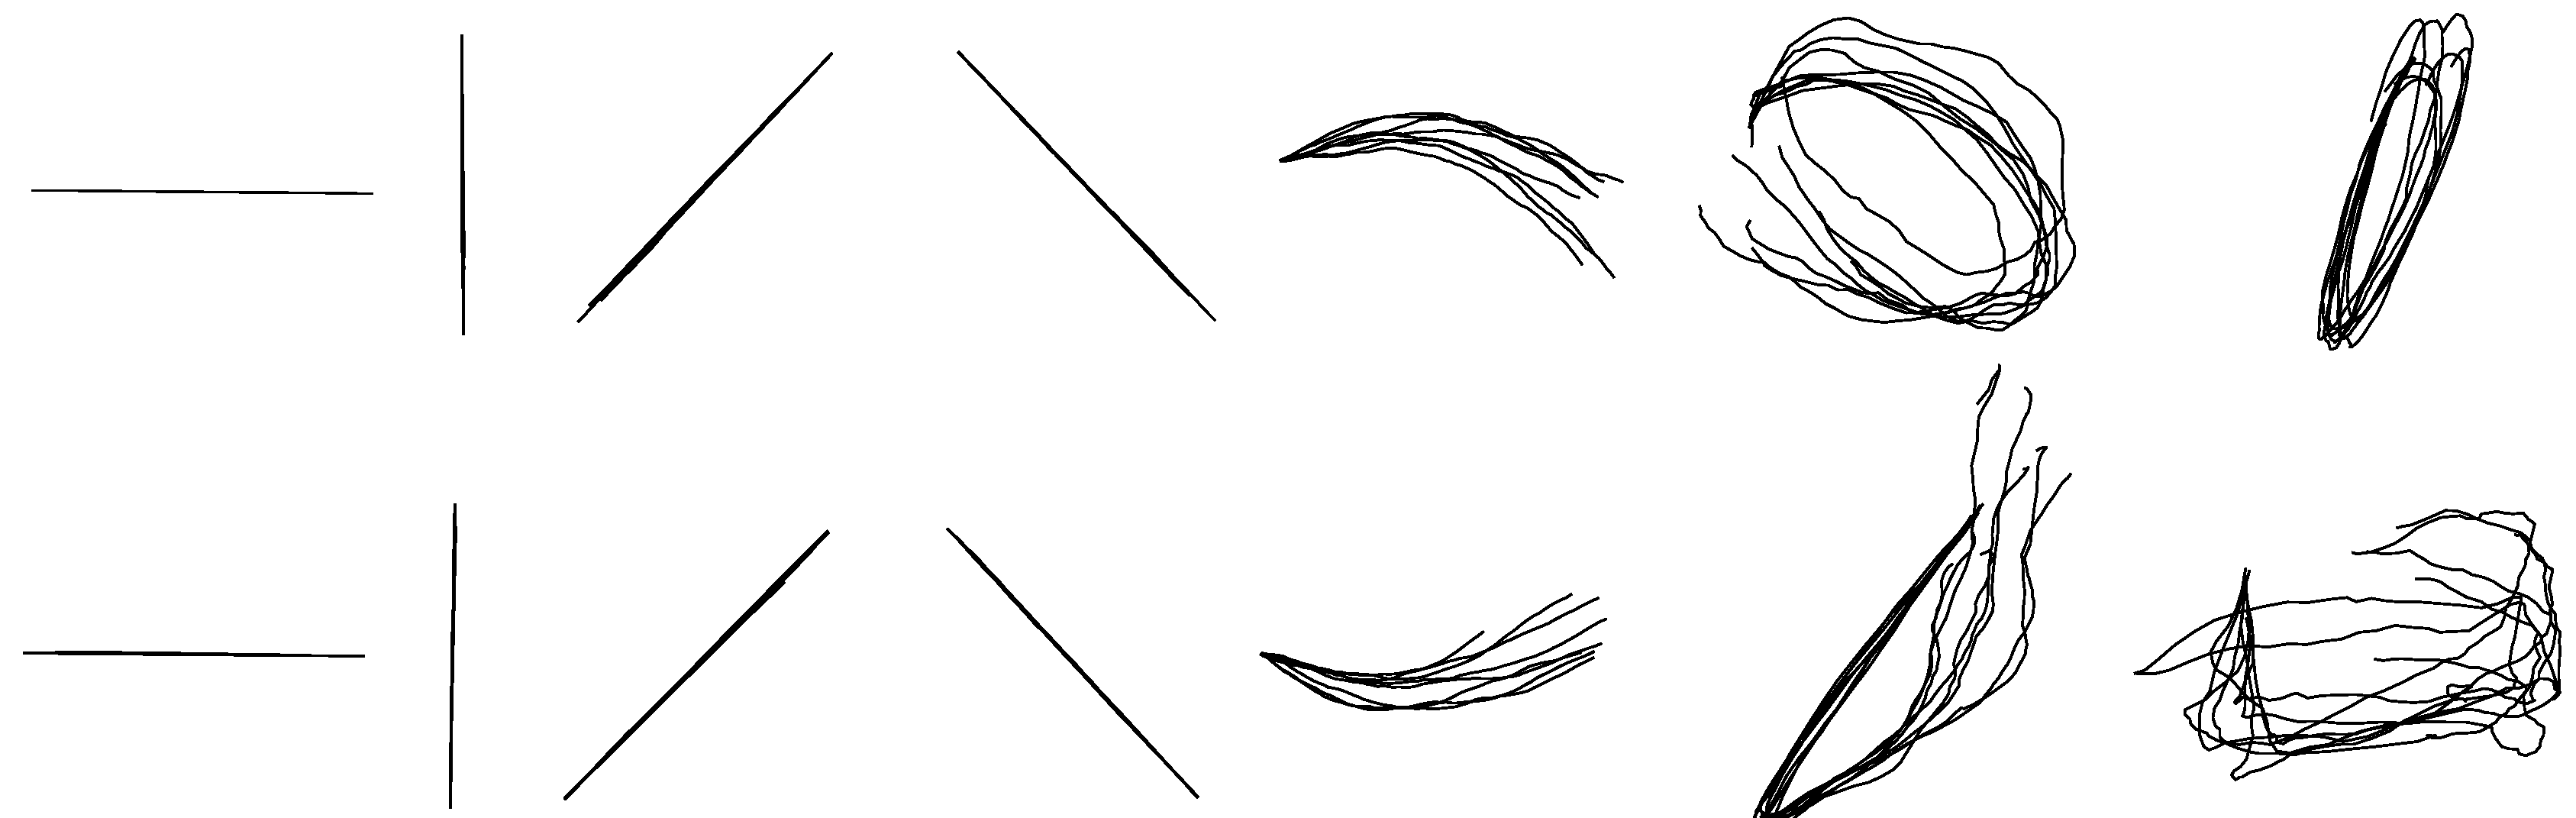
Figure 13.
The randomly selected reconstructed drawing traces of within-group reconstruction by the GEP.
Figure 13.
The randomly selected reconstructed drawing traces of within-group reconstruction by the GEP.
Figure 14.
The randomly selected reconstructed numeric character of within-group reconstruction by the GEP.
Figure 14.
The randomly selected reconstructed numeric character of within-group reconstruction by the GEP.
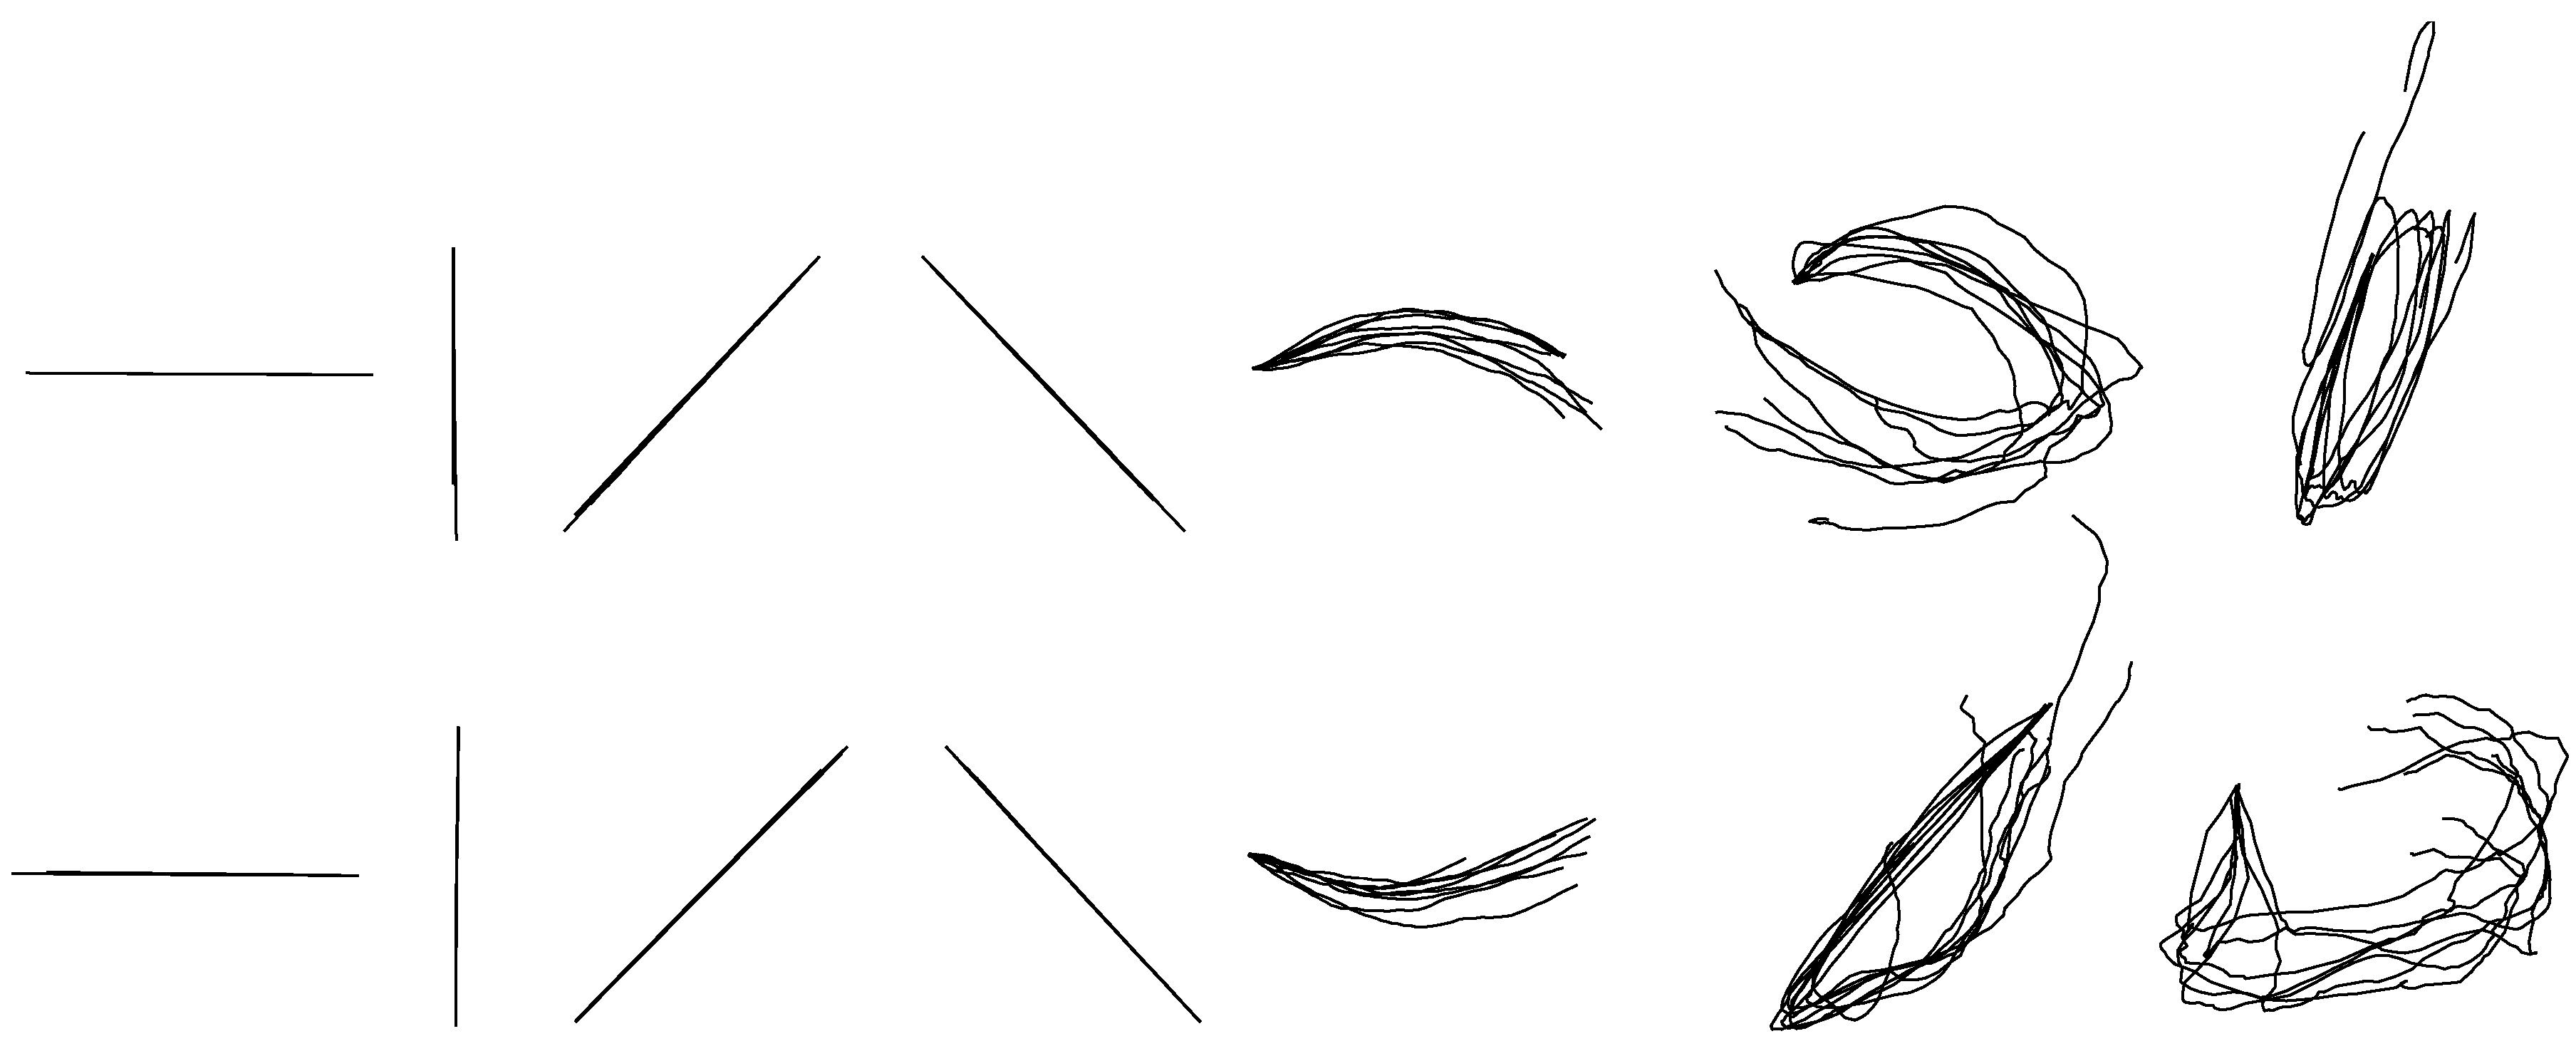
Figure 15.
The randomly selected reconstructed drawing traces of between-group reconstruction by the GEP.
Figure 15.
The randomly selected reconstructed drawing traces of between-group reconstruction by the GEP.
Figure 16.
The randomly selected reconstructed numeric character of between-group reconstruction by the GEP.
Figure 16.
The randomly selected reconstructed numeric character of between-group reconstruction by the GEP.
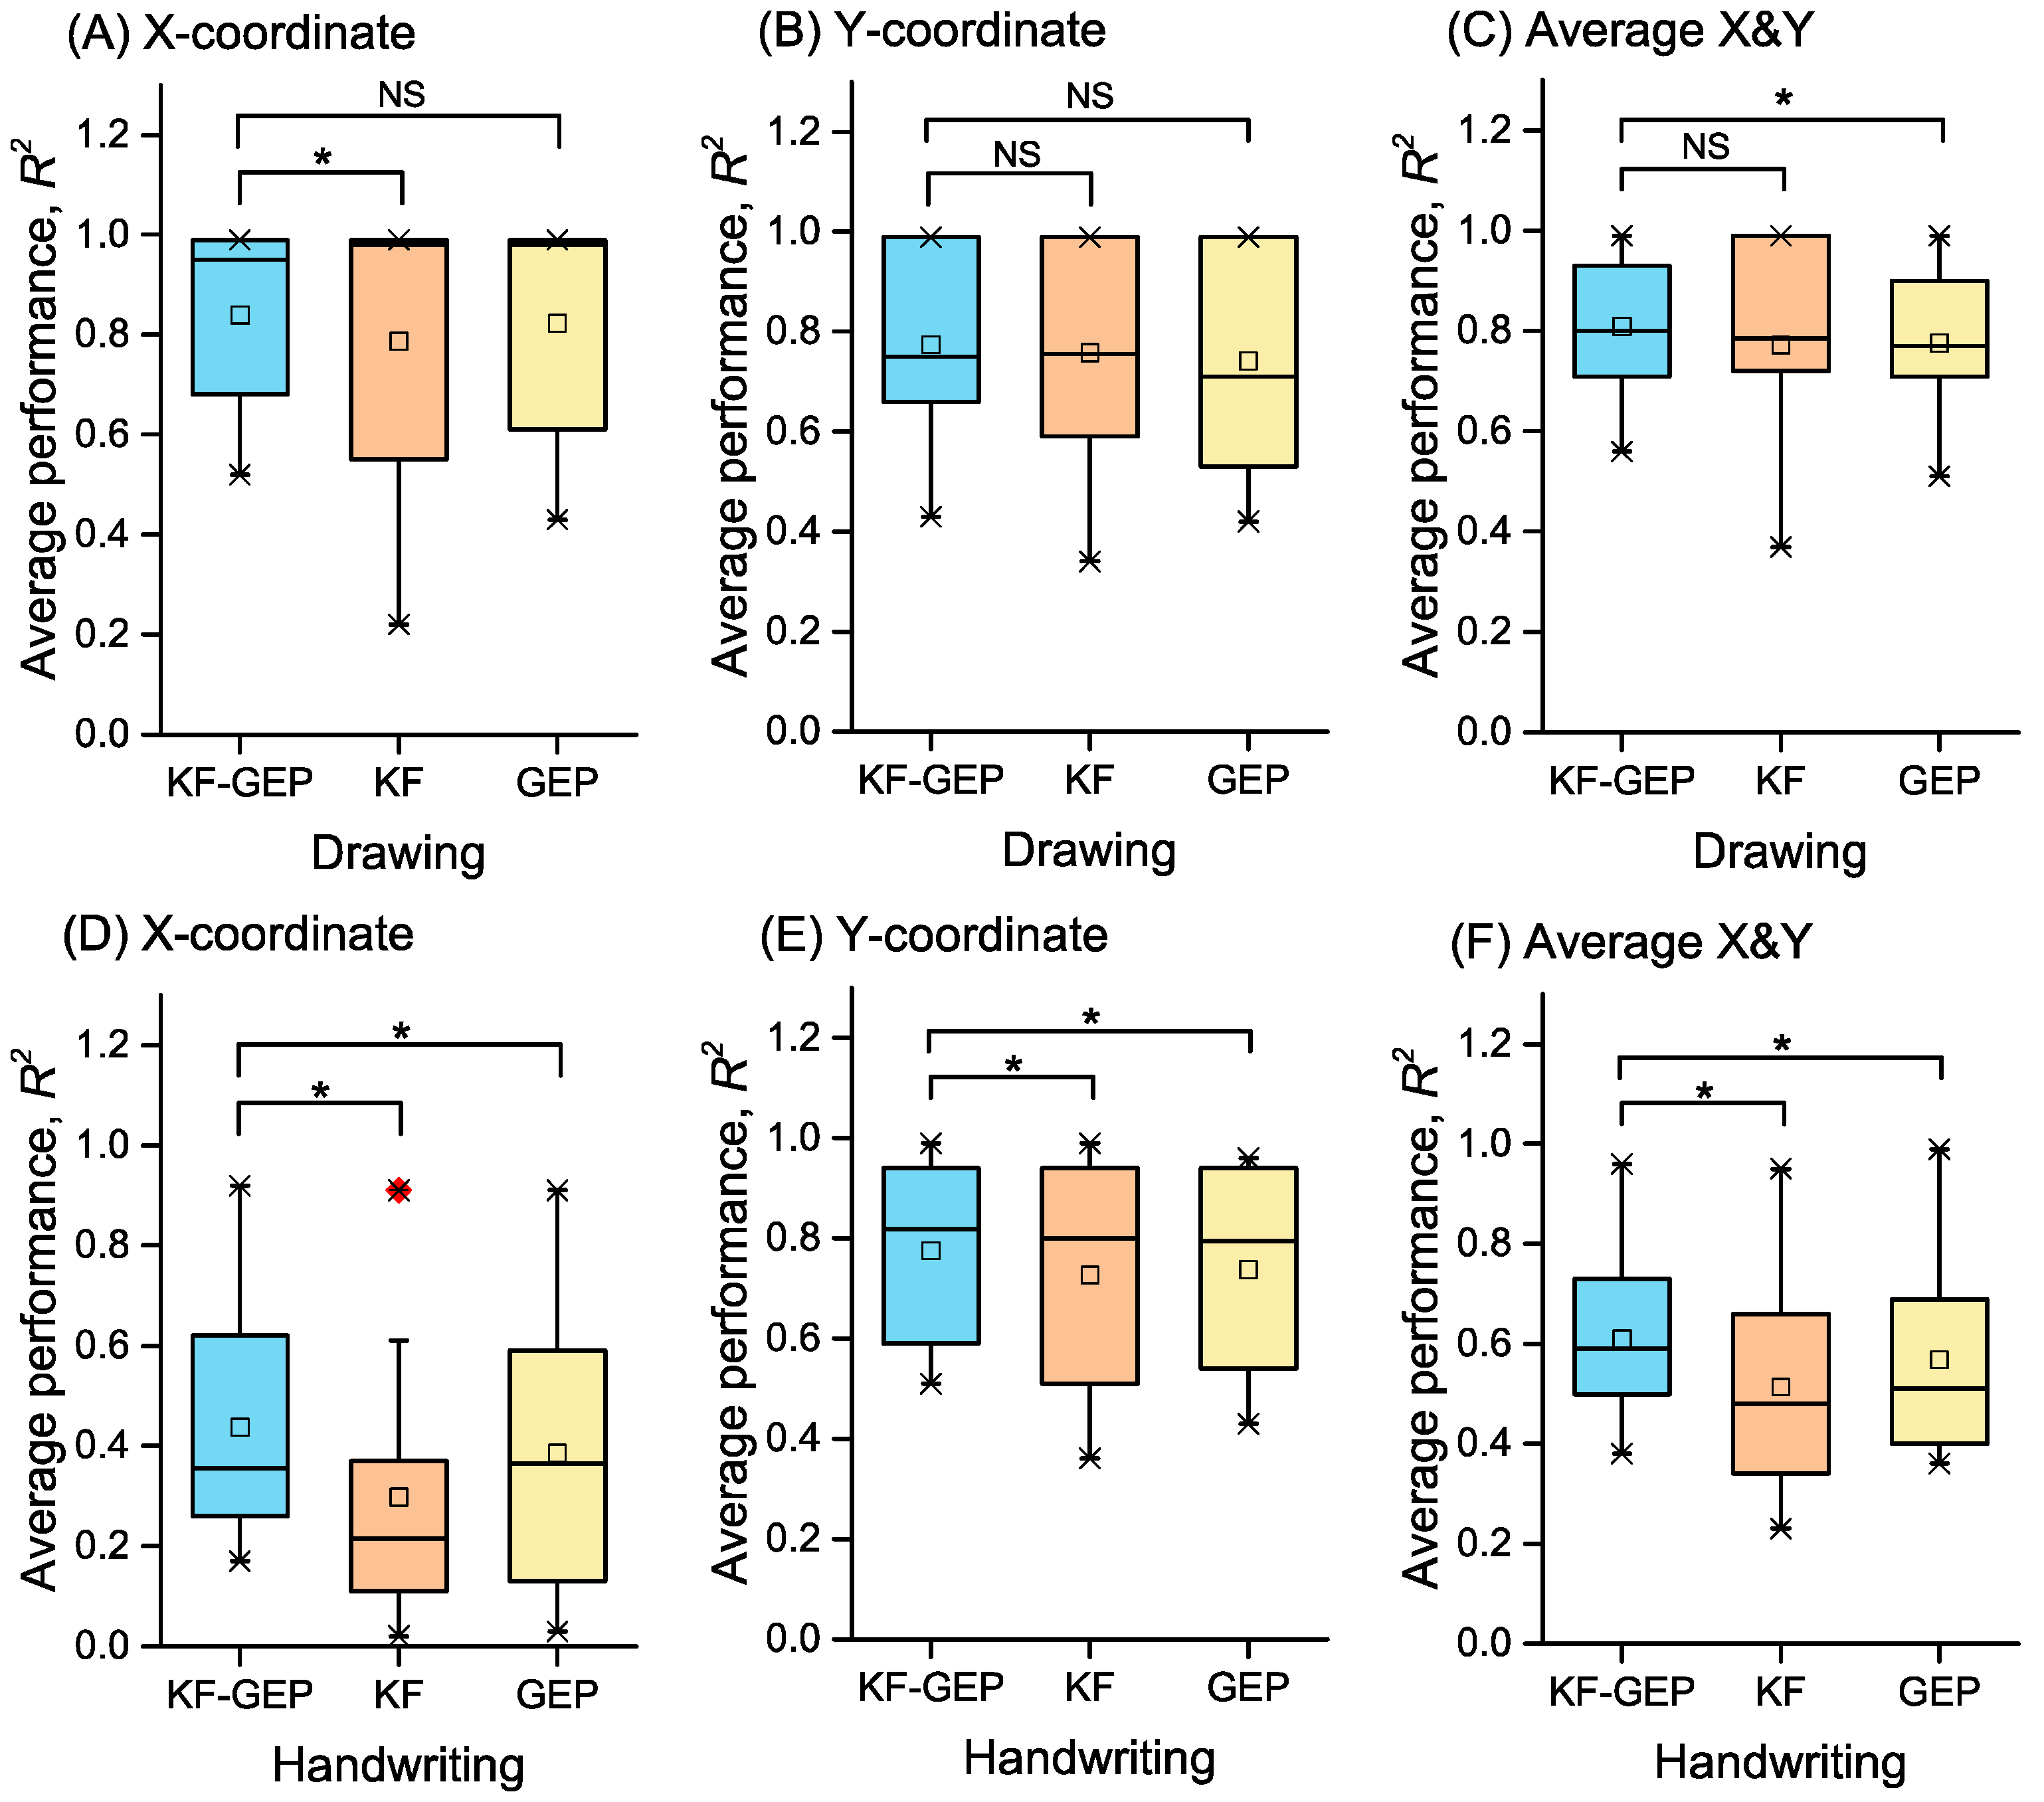
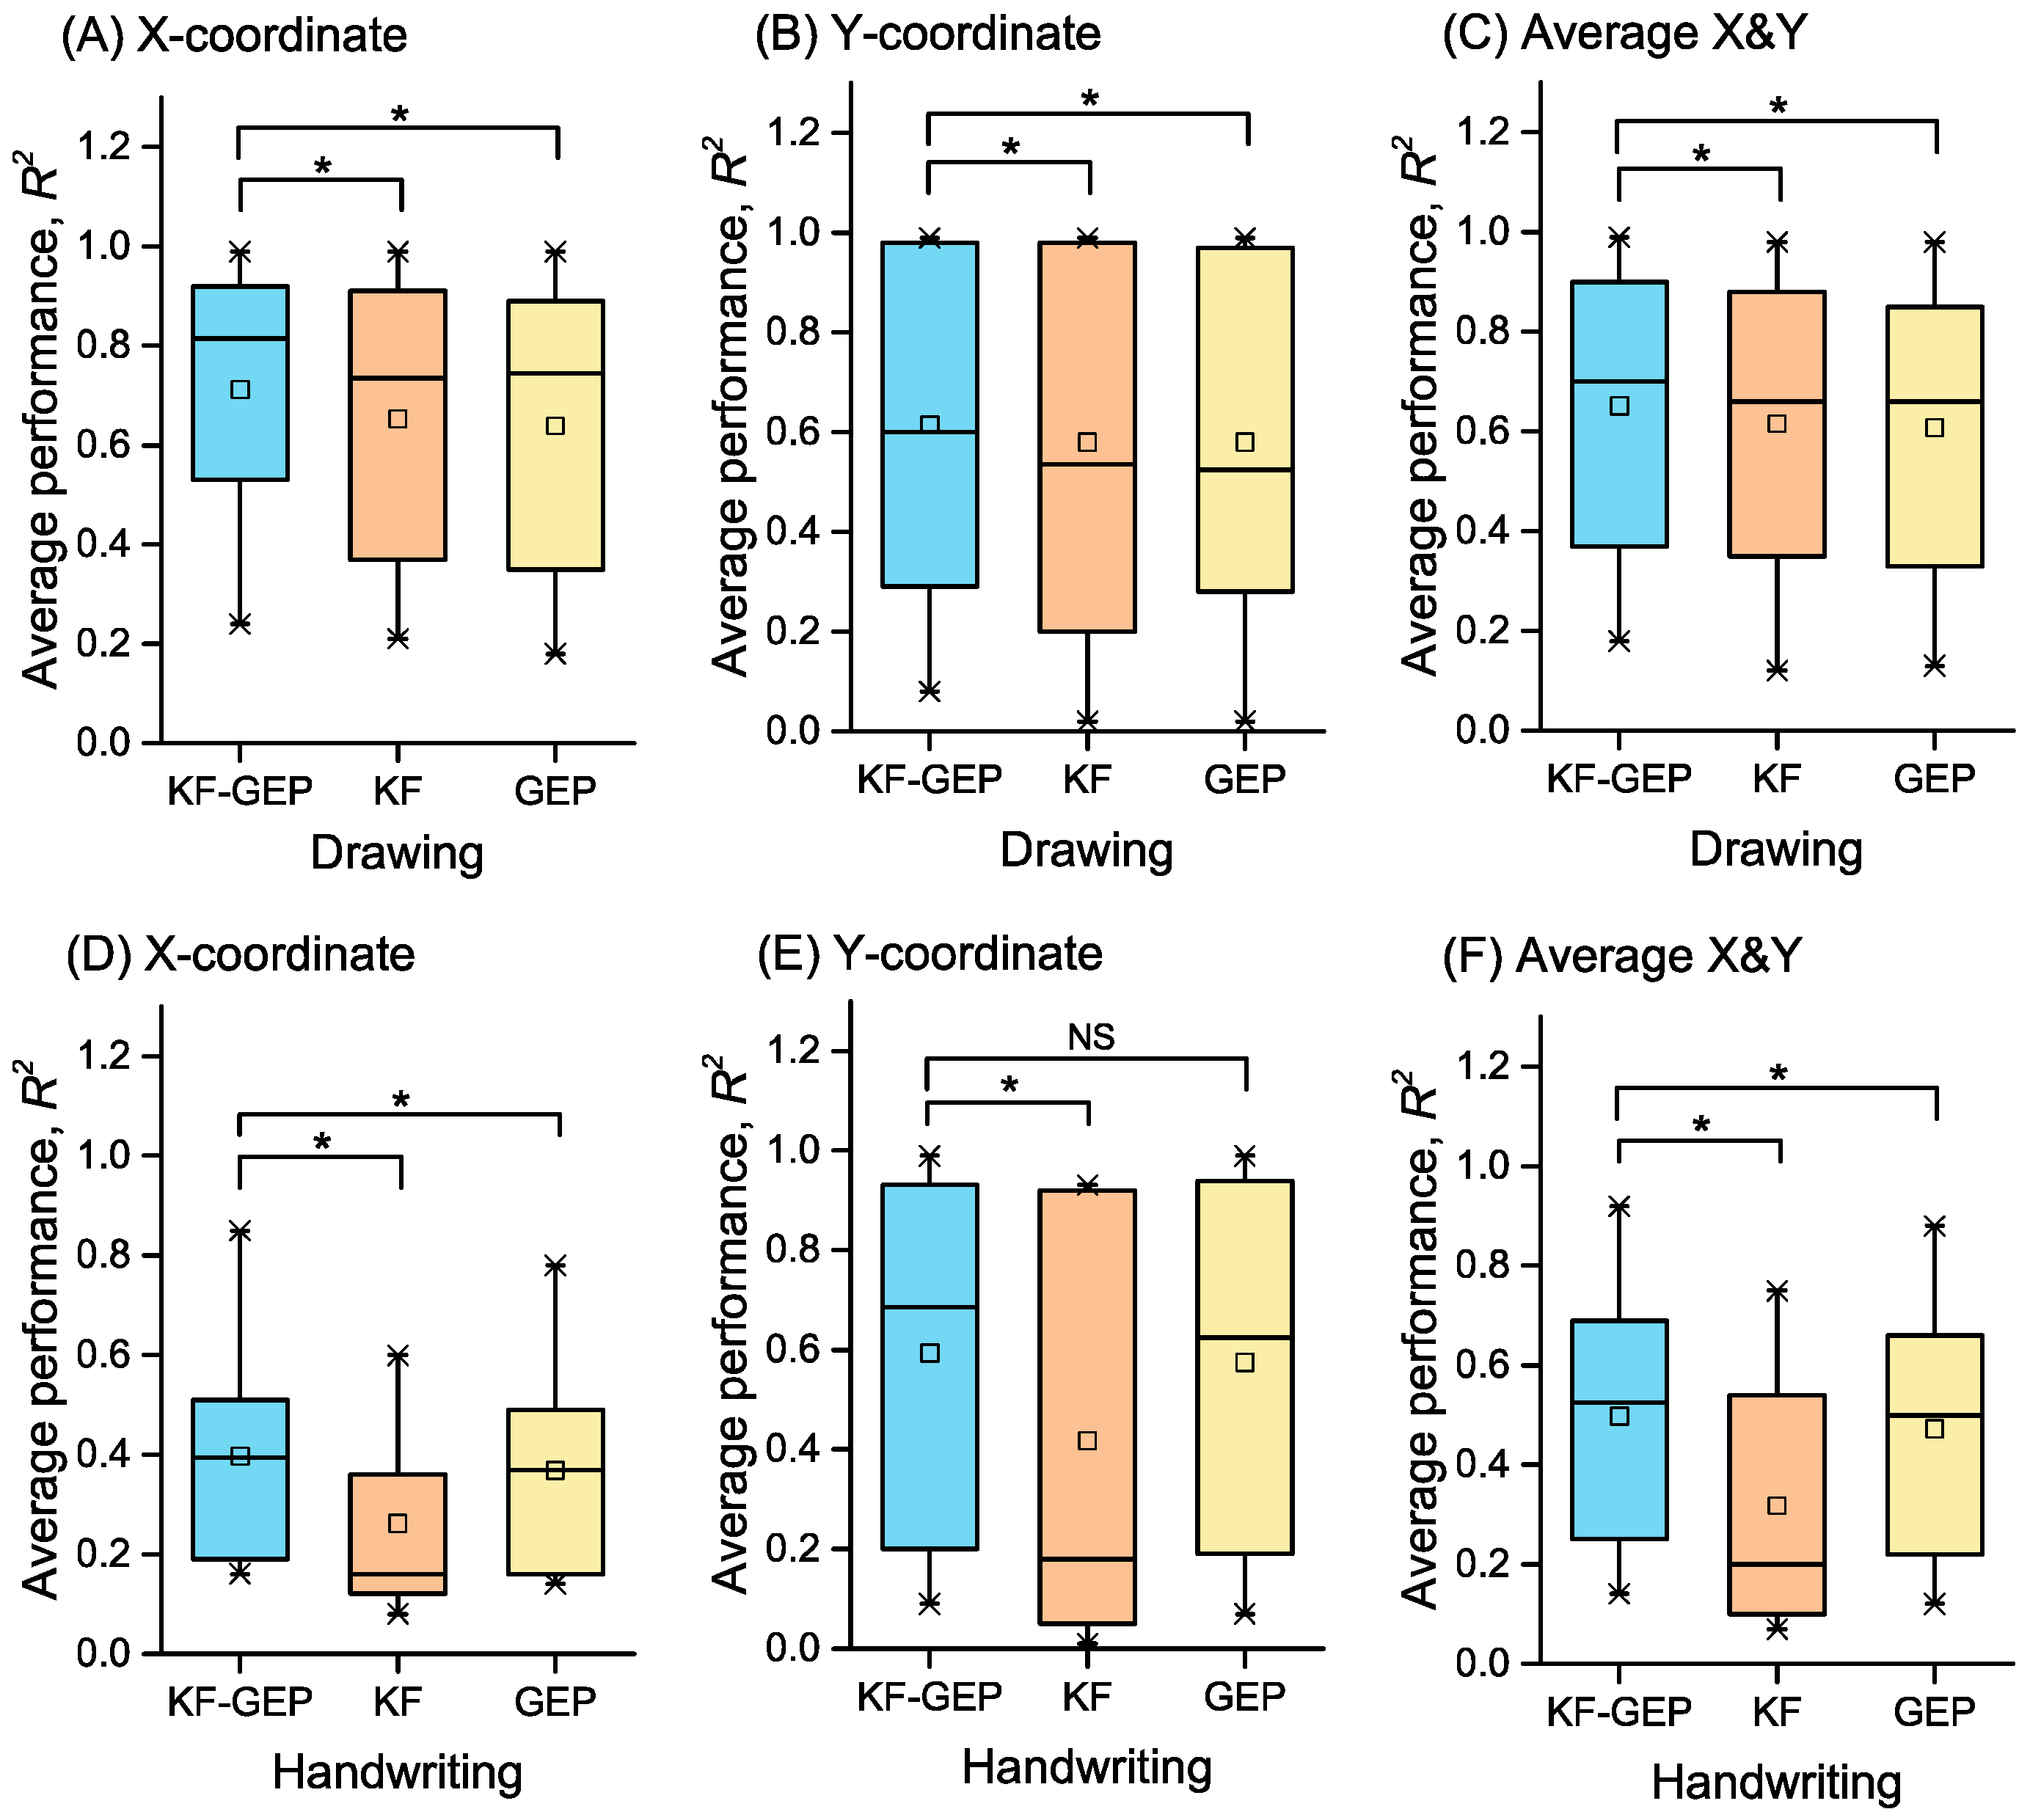
Figure 17.
The averages of R2s in within-group reconstruction achieved by three methods. Statistical difference between the KF-GEP and KF and between the KF-GEP and GEP was measured by paired sample Wilcoxon signed-rank test: * the KF-GEP’s performance do significantly tends to be greater than the KF’s and GEP’s at the 0.05 level.
Figure 18.
The averages of R2s in between-group reconstruction achieved by three methods. Statistical difference between the KF-GEP and KF and between the KF-GEP and GEP was measured by paired sample Wilcoxon signed-rank test: * the KF-GEP’s performance do significantly tends to be greater than the KF’s and GEP’s at the 0.05 level.
Table 1.
Parameters for the GEP algorithm in the training stage.
Table 1.
Parameters for the GEP algorithm in the training stage.
| Parameter | Value |
|---|
| Number of chromosomes | 200 |
| Function set | F = {+, −, ×, /, Sin, Cos, Sqrt, x2, Inv, Exp} |
| Terminal | T = {T1, T2, T3, T4, T5, T6, T7} |
| Number of genes, head size, gene size | 6, 15, 31 |
| Linking function | Addition |
| Fitness function error type | RMSE |
| Mutation rate | 0.00138 |
| Inversion rate | 0.00546 |
| IS/RIS/gene transposition rate | 0.00546 |
| One-point/two-point recombination rate | 0.00277 |
| Gene recombination rate | 0.00277 |
Table 2.
Within-group reconstruction performance by the KF-GEP: the average accuracy of each shape across the five subjects.
Table 2.
Within-group reconstruction performance by the KF-GEP: the average accuracy of each shape across the five subjects.
| Average Performance, R2 |
|---|
| Shape | X-Coordinate | Y-Coordinate | Average: (X + Y)/2 |
|---|
| horizontal line | 0.99 ± 0.00 | 0.71 ± 0.26 | 0.85 ± 0.13 |
| vertical line | 0.42 ± 0.27 | 0.95 ± 0.13 | 0.69 ± 0.15 |
| forward slash | 0.84 ± 0.25 | 0.99 ± 0.01 | 0.92 ± 0.10 |
| backslash | 0.99 ± 0.01 | 0.99 ± 0.01 | 0.99 ± 0.01 |
| Arch | 0.92 ± 0.08 | 0.49 ± 0.15 | 0.71 ± 0.11 |
| Circle | 0.24 ± 0.13 | 0.42 ± 0.28 | 0.33 ± 0.18 |
| Ellipse | 0.34 ± 0.20 | 0.09 ± 0.05 | 0.22 ± 0.15 |
| Reversed horizontal line | 0.88 ± 0.27 | 0.47 ± 0.32 | 0.68 ± 0.21 |
| Reversed vertical line | 0.53 ± 0.31 | 0.97 ± 0.06 | 0.75 ± 0.18 |
| Reversed forward slash | 0.81 ± 0.26 | 0.98 ± 0.01 | 0.90 ± 0.13 |
| Reversed backslash | 0.95 ± 0.16 | 0.99 ± 0.01 | 0.97 ± 0.08 |
| Reversed arch | 0.82 ± 0.25 | 0.29 ± 0.21 | 0.56 ± 0.18 |
| Square | 0.55 ± 0.30 | 0.19 ± 0.12 | 0.37 ± 0.20 |
| Triangle | 0.28 ± 0.12 | 0.08 ± 0.05 | 0.18 ± 0.08 |
| All | 0.68 ± 0.19 | 0.62 ± 0.12 | 0.65 ± 0.14 |
Table 3.
Within-group reconstruction performance by the KF-GEP: the average accuracy of each numeric character across the five subjects.
Table 3.
Within-group reconstruction performance by the KF-GEP: the average accuracy of each numeric character across the five subjects.
| Average Performance, R2 |
|---|
| Character | X-Coordinate | Y-Coordinate | Average: (X + Y)/2 |
|---|
| “0” | 0.49 ± 0.27 | 0.45 ± 0.26 | 0.47 ± 0.27 |
| “1” | 0.85 ± 0.12 | 0.99 ± 0.01 | 0.92 ± 0.07 |
| “2” | 0.44 ± 0.28 | 0.93 ± 0.02 | 0.69 ± 0.15 |
| “3” | 0.21 ± 0.21 | 0.95 ± 0.01 | 0.58 ± 0.11 |
| “4” | 0.19 ± 0.18 | 0.09 ± 0.02 | 0.14 ± 0.09 |
| “5” | 0.35 ± 0.22 | 0.93 ± 0.02 | 0.64 ± 0.13 |
| “6” | 0.16 ± 0.11 | 0.15 ± 0.10 | 0.16 ± 0.09 |
| “7” | 0.51 ± 0.17 | 0.92 ± 0.04 | 0.72 ± 0.10 |
| “8” | 0.18 ± 0.18 | 0.32 ± 0.19 | 0.25 ± 0.18 |
| “9” | 0.59 ± 0.23 | 0.20 ± 0.16 | 0.40 ± 0.19 |
| All | 0.40 ± 0.19 | 0.59 ± 0.06 | 0.50 ± 0.13 |
Table 4.
Between-group reconstruction performance by the KF-GEP: the average accuracy of each shape across the five subjects.
Table 4.
Between-group reconstruction performance by the KF-GEP: the average accuracy of each shape across the five subjects.
| Average Performance, R2 |
|---|
| Shape | X-Coordinate | Y-Coordinate | Average: (X + Y)/2 |
|---|
| horizontal line | 0.99 ± 0.002 | 0.78 ± 0.26 | 0.89 ± 0.15 |
| vertical line | 0.52 ± 0.26 | 0.99 ± 0.01 | 0.76 ± 0.12 |
| forward slash | 0.92 ± 0.27 | 0.93 ± 0.2 | 0.93 ± 0.25 |
| backslash | 0.99 ± 0.01 | 0.99 ± 0.004 | 0.99 ± 0.01 |
| Arch | 0.98 ± 0.01 | 0.68 ± 0.24 | 0.83 ± 0.12 |
| Circle | 0.79 ± 0.26 | 0.72 ± 0.28 | 0.76 ± 0.26 |
| Ellipse | 0.68 ± 0.28 | 0.69 ± 0.22 | 0.69 ± 0.25 |
| Reversed horizontal line | 0.99 ± 0.01 | 0.54 ± 0.34 | 0.77 ± 0.16 |
| Reversed vertical line | 0.71 ± 0.29 | 0.99 ± 0.01 | 0.85 ± 0.18 |
| Reversed forward slash | 0.99 ± 0.01 | 0.99 ± 0.004 | 0.99 ± 0.01 |
| Reversed backslash | 0.99 ± 0.004 | 0.99 ± 0.01 | 0.99 ± 0.004 |
| Reversed arch | 0.98 ± 0.01 | 0.43 ± 0.26 | 0.71 ± 0.02 |
| Square | 0.66 ± 0.32 | 0.46 ± 0.20 | 0.56 ± 0.28 |
| Triangle | 0.56 ± 0.22 | 0.66 ± 0.12 | 0.61 ± 0.16 |
| All | 0.84 ± 0.13 | 0.77 ± 0.15 | 0.81 ± 0.13 |
Table 5.
Between-group reconstruction performance by the KF-GEP: the average accuracy of each numeric character across the five subjects.
Table 5.
Between-group reconstruction performance by the KF-GEP: the average accuracy of each numeric character across the five subjects.
| Average Performance, R2 |
|---|
| Character | X-Coordinate | Y-Coordinate | Average: (X + Y)/2 |
|---|
| “0” | 0.73 ± 0.24 | 0.72 ± 0.27 | 0.73 ± 0.21 |
| “1” | 0.92 ± 0.06 | 0.99 ± 0.003 | 0.96 ± 0.03 |
| “2” | 0.28 ± 0.18 | 0.93 ± 0.01 | 0.61 ± 0.09 |
| “3” | 0.26 ± 0.06 | 0.97 ± 0.01 | 0.62 ± 0.04 |
| “4” | 0.32 ± 0.26 | 0.54 ± 0.26 | 0.43 ± 0.21 |
| “5” | 0.19 ± 0.06 | 0.94 ± 0.04 | 0.57 ± 0.03 |
| “6” | 0.39 ± 0.27 | 0.64 ± 0.29 | 0.52 ± 0.24 |
| “7” | 0.62 ± 0.25 | 0.92 ± 0.04 | 0.77 ± 0.14 |
| “8” | 0.17 ± 0.12 | 0.59 ± 0.25 | 0.38 ± 0.16 |
| “9” | 0.49 ± 0.29 | 0.51 ± 0.14 | 0.50 ± 0.15 |
| All | 0.44 ± 0.18 | 0.78 ± 0.13 | 0.60 ± 0.12 |
Table 6.
Within-group reconstruction performance by the KF: the average accuracy of each shape across the five subjects.
Table 6.
Within-group reconstruction performance by the KF: the average accuracy of each shape across the five subjects.
| Average Performance, R2 |
|---|
| Shape | X-Coordinate | Y-Coordinate | Average: (X + Y)/2 |
|---|
| horizontal line | 0.99 ± 0.07 | 0.64 ± 0.33 | 0.81 ± 0.17 |
| vertical line | 0.37 ± 0.29 | 0.98 ± 0.03 | 0.67 ± 0.14 |
| forward slash | 0.95 ± 0.08 | 0.98 ± 0.02 | 0.97 ± 0.04 |
| backslash | 0.99 ± 0.01 | 0.98 ± 0.05 | 0.98 ± 0.02 |
| Arch | 0.91 ± 0.07 | 0.38 ± 0.15 | 0.65 ± 0.09 |
| Circle | 0.21 ± 0.22 | 0.35 ± 0.15 | 0.28 ± 0.12 |
| Ellipse | 0.36 ± 0.16 | 0.03 ± 0.05 | 0.19 ± 0.08 |
| Reversed horizontal line | 0.84 ± 0.27 | 0.43 ± 0.31 | 0.63 ± 0.22 |
| Reversed vertical line | 0.48 ± 0.34 | 0.98 ± 0.03 | 0.73 ± 0.17 |
| Reversed forward slash | 0.77 ± 0.27 | 0.98 ± 0.01 | 0.88 ± 0.14 |
| Reversed backslash | 0.82 ± 0.28 | 0.99 ± 0.01 | 0.91 ± 0.14 |
| Reversed arch | 0.70 ± 0.3 | 0.20 ± 0.16 | 0.45 ± 0.18 |
| Square | 0.53 ± 0.35 | 0.17 ± 0.07 | 0.35 ± 0.18 |
| Triangle | 0.21 ± 0.15 | 0.02 ± 0.03 | 0.12 ± 0.08 |
| All | 0.65 ± 0.2 | 0.58 ± 0.10 | 0.62 ± 0.13 |
Table 7.
Within-group reconstruction performance by the KF: the average accuracy of each numeric character across the five subjects.
Table 7.
Within-group reconstruction performance by the KF: the average accuracy of each numeric character across the five subjects.
| Average Performance, R2 |
|---|
| Character | X-Coordinate | Y-Coordinate | Average: (X + Y)/2 |
|---|
| “0” | 0.36 ± 0.28 | 0.01 ± 0.01 | 0.19 ± 0.14 |
| “1” | 0.60 ± 0.35 | 0.01 ± 0.01 | 0.19 ± 0.14 |
| “2” | 0.15 ± 0.23 | 0.92 ± 0.03 | 0.54 ± 0.12 |
| “3” | 0.08 ± 0.17 | 0.93 ± 0.02 | 0.50 ± 0.08 |
| “4” | 0.16 ± 0.15 | 0.08 ± 0.04 | 0.12 ± 0.09 |
| “5” | 0.30 ± 0.24 | 0.93 ± 0.02 | 0.61 ± 0.08 |
| “6” | 0.12 ± 0.14 | 0.07 ± 0.05 | 0.09 ± 0.08 |
| “7” | 0.60 ± 0.17 | 0.89 ± 0.03 | 0.75 ± 0.10 |
| “8” | 0.09 ± 0.18 | 0.05 ± 0.05 | 0.07 ± 0.09 |
| “9” | 0.16 ± 0.17 | 0.28 ± 0.07 | 0.21 ± 0.12 |
| All | 0.26 ± 0.21 | 0.42 ± 0.03 | 0.28 ± 0.10 |
Table 8.
Between-group reconstruction performance by the KF: the average accuracy of each shape across the five subjects.
Table 8.
Between-group reconstruction performance by the KF: the average accuracy of each shape across the five subjects.
| Average Performance, R2 |
|---|
| Shape | X-Coordinate | Y-Coordinate | Average: (X + Y)/2 |
|---|
| horizontal line | 0.99 ± 0.002 | 0.77 ± 0.25 | 0.88 ± 0.12 |
| vertical line | 0.45 ± 0.25 | 0.99 ± 0.004 | 0.72 ± 0.12 |
| forward slash | 0.99 ± 0.007 | 0.99 ± 0.006 | 0.99 ± 0.006 |
| backslash | 0.99 ± 0.004 | 0.99 ± 0.004 | 0.99 ± 0.004 |
| Arch | 0.98 ± 0.01 | 0.65 ± 0.30 | 0.81 ± 0.15 |
| Circle | 0.76 ± 0.26 | 0.74 ± 0.26 | 0.75 ± 0.17 |
| Ellipse | 0.55 ± 0.25 | 0.59 ± 0.23 | 0.57 ± 0.14 |
| Reversed horizontal line | 0.99 ± 0.007 | 0.47 ± 0.33 | 0.73 ± 0.16 |
| Reversed vertical line | 0.59 ± 0.33 | 0.99 ± 0.007 | 0.79 ± 0.16 |
| Reversed forward slash | 0.99 ± 0.003 | 0.99 ± 0.004 | 0.99 ± 0.003 |
| Reversed backslash | 0.99 ± 0.003 | 0.99 ± 0.003 | 0.99 ± 0.003 |
| Reversed arch | 0.98 ± 0.01 | 0.59 ± 0.31 | 0.78 ± 0.16 |
| Square | 0.55 ± 0.36 | 0.34 ± 0.28 | 0.45 ± 0.22 |
| Triangle | 0.22 ± 0.21 | 0.52 ± 0.17 | 0.37 ± 0.10 |
| All | 0.79 ± 0.12 | 0.76 ± 0.15 | 0.77 ± 0.11 |
Table 9.
Between-group reconstruction performance by the KF: the average accuracy of each numeric character across the five subjects.
Table 9.
Between-group reconstruction performance by the KF: the average accuracy of each numeric character across the five subjects.
| Average Performance, R2 |
|---|
| Character | X-Coordinate | Y-Coordinate | Average: (X + Y)/2 |
|---|
| “0” | 0.61 ± 0.29 | 0.71 ± 0.29 | 0.66 ± 0.19 |
| “1” | 0.91 ± 0.06 | 0.99 ± 0.002 | 0.95 ± 0.03 |
| “2” | 0.02 ± 0.03 | 0.92 ± 0.01 | 0.47 ± 0.02 |
| “3” | 0.35 ± 0.24 | 0.96 ± 0.01 | 0.66 ± 0.12 |
| “4” | 0.21 ± 0.20 | 0.47 ± 0.24 | 0.34 ± 0.18 |
| “5” | 0.03 ± 0.02 | 0.94 ± 0.01 | 0.49 ± 0.01 |
| “6” | 0.15 ± 0.18 | 0.51 ± 0.30 | 0.33 ± 0.16 |
| “7” | 0.37 ± 0.32 | 0.89 ± 0.03 | 0.63 ± 0.16 |
| “8” | 0.11 ± 0.10 | 0.36 ± 0.25 | 0.23 ± 0.13 |
| “9” | 0.22 ± 0.23 | 0.52 ± 0.16 | 0.37 ± 0.14 |
| All | 0.30 ± 0.16 | 0.72 ± 0.13 | 0.51 ± 0.11 |
Table 10.
Within-group reconstruction performance by the GEP: the average accuracy of each shape across the five subjects.
Table 10.
Within-group reconstruction performance by the GEP: the average accuracy of each shape across the five subjects.
| Average Performance, R2 |
|---|
| Shape | X-Coordinate | Y-Coordinate | Average: (X + Y)/2 |
|---|
| horizontal line | 0.99 ± 0.01 | 0.59 ± 0.32 | 0.79 ± 0.16 |
| vertical line | 0.35 ± 0.29 | 0.94 ± 0.13 | 0.65 ± 0.15 |
| forward slash | 0.76 ± 0.29 | 0.97 ± 0.06 | 0.88 ± 0.14 |
| backslash | 0.97 ± 0.03 | 0.99 ± 0.01 | 0.98 ± 0.02 |
| Arch | 0.91 ± 0.14 | 0.43 ± 0.17 | 0.67 ± 0.11 |
| Circle | 0.18 ± 0.13 | 0.34 ± 0.27 | 0.26 ± 0.16 |
| Ellipse | 0.23 ± 0.18 | 0.04 ± 0.06 | 0.13 ± 0.09 |
| Reversed horizontal line | 0.89 ± 0.30 | 0.46 ± 0.28 | 0.63 ± 0.23 |
| Reversed vertical line | 0.45 ± 0.32 | 0.97 ± 0.04 | 0.71 ± 0.17 |
| Reversed forward slash | 0.73 ± 0.28 | 0.98 ± 0.03 | 0.85 ± 0.14 |
| Reversed backslash | 0.89 ± 0.14 | 0.99 ± 0.01 | 0.94 ± 0.07 |
| Reversed arch | 0.81 ± 0.24 | 0.28 ± 0.22 | 0.55 ± 0.17 |
| Square | 0.55 ± 0.33 | 0.12 ± 0.10 | 0.33 ± 0.18 |
| Triangle | 0.23 ± 0.16 | 0.02 ± 0.03 | 0.13 ± 0.08 |
| All | 0.64 ± 0.20 | 0.61 ± 0.12 | 0.58 ± 0.14 |
Table 11.
Within-group reconstruction performance by the GEP: the average accuracy of each numeric character across the five subjects.
Table 11.
Within-group reconstruction performance by the GEP: the average accuracy of each numeric character across the five subjects.
| Average Performance, R2 |
|---|
| Character | X-Coordinate | Y-Coordinate | Average: (X + Y)/2 |
|---|
| “0” | 0.49 ± 0.28 | 0.38 ± 0.24 | 0.44 ± 0.19 |
| “1” | 0.78 ± 0.19 | 0.99 ± 0.01 | 0.88 ± 0.09 |
| “2” | 0.42 ± 0.29 | 0.94 ± 0.02 | 0.68 ± 0.15 |
| “3” | 0.17 ± 0.26 | 0.95 ± 0.02 | 0.56 ± 0.13 |
| “4” | 0.16 ± 0.15 | 0.07 ± 0.04 | 0.12 ± 0.08 |
| “5” | 0.32 ± 0.22 | 0.93 ± 0.02 | 0.63 ± 0.12 |
| “6” | 0.14 ± 0.12 | 0.13 ± 0.08 | 0.13 ± 0.07 |
| “7” | 0.46 ± 0.08 | 0.87 ± 0.09 | 0.66 ± 0.04 |
| “8” | 0.16 ± 0.16 | 0.29 ± 0.17 | 0.22 ± 0.12 |
| “9” | 0.59 ± 0.21 | 0.19 ± 0.17 | 0.40 ± 0.16 |
| All | 0.37 ± 0.20 | 0.57 ± 0.08 | 0.47 ± 0.12 |
Table 12.
Between-group reconstruction performance by the GEP: the average accuracy of each shape across the five subjects.
Table 12.
Between-group reconstruction performance by the GEP: the average accuracy of each shape across the five subjects.
| Average Performance, R2 |
|---|
| Shape | X-Coordinate | Y-Coordinate | Average: (X + Y)/2 |
|---|
| horizontal line | 0.99 ± 0.003 | 0.74 ± 0.27 | 0.87 ± 0.14 |
| vertical line | 0.43 ± 0.26 | 0.99 ± 0.004 | 0.71 ± 0.13 |
| forward slash | 0.99 ± 0.01 | 0.93 ± 0.22 | 0.96 ± 0.10 |
| backslash | 0.99 ± 0.004 | 0.99 ± 0.004 | 0.99 ± 0.004 |
| Arch | 0.98 ± 0.01 | 0.68 ± 0.28 | 0.83 ± 0.14 |
| Circle | 0.78 ± 0.24 | 0.65 ± 0.31 | 0.71 ± 0.18 |
| Ellipse | 0.61 ± 0.24 | 0.46 ± 0.22 | 0.54 ± 0.12 |
| Reversed horizontal line | 0.99 ± 0.01 | 0.47 ± 0.33 | 0.73 ± 0.17 |
| Reversed vertical line | 0.59 ± 0.32 | 0.99 ± 0.01 | 0.79 ± 0.16 |
| Reversed forward slash | 0.99 ± 0.003 | 0.99 ± 0.003 | 0.9 ± 0.003 |
| Reversed backslash | 0.99 ± 0.003 | 0.99 ± 0.003 | 0.99 ± 0.003 |
| Reversed arch | 0.98 ± 0.01 | 0.53 ± 0.32 | 0.75 ± 0.16 |
| Square | 0.59 ± 0.34 | 0.42 ± 0.26 | 0.51 ± 0.23 |
| Triangle | 0.61 ± 0.19 | 0.55 ± 0.15 | 0.58 ± 0.11 |
| All | 0.82 ± 0.13 | 0.74 ± 0.17 | 0.78 ± 0.13 |
Table 13.
Between-group reconstruction performance by the GEP: the average accuracy of each numeric character across the five subjects.
Table 13.
Between-group reconstruction performance by the GEP: the average accuracy of each numeric character across the five subjects.
| Average Performance, R2 |
|---|
| Character | X-Coordinate | Y-Coordinate | Average: (X + Y)/2 |
|---|
| “0” | 0.67 ± 0.27 | 0.67 ± 0.29 | 0.67 ± 0.19 |
| “1” | 0.91 ± 0.06 | 0.95 ± 0.03 | 0.99 ± 0.002 |
| “2” | 0.11 ± 0.16 | 0.94 ± 0.01 | 0.53 ± 0.08 |
| “3” | 0.42 ± 0.22 | 0.96 ± 0.01 | 0.69 ± 0.10 |
| “4” | 0.35 ± 0.29 | 0.43 ± 0.25 | 0.39 ± 0.17 |
| “5” | 0.03 ± 0.06 | 0.94 ± 0.01 | 0.49 ± 0.03 |
| “6” | 0.26 ± 0.32 | 0.54 ± 0.29 | 0.40 ± 0.21 |
| “7” | 0.59 ± 0.26 | 0.92 ± 0.03 | 0.75 ± 0.13 |
| “8” | 0.13 ± 0.12 | 0.59 ± 0.27 | 0.36 ± 0.15 |
| “9” | 0.38 ± 0.30 | 0.43 ± 0.14 | 0.41 ± 0.13 |
| All | 0.39 ± 0.21 | 0.74 ± 0.13 | 0.56 ± 0.12 |


