Mapping of Rice Varieties and Sowing Date Using X-Band SAR Data

 ,
,  ,
, 
Abstract
1. Introduction
2. Test Site and Data
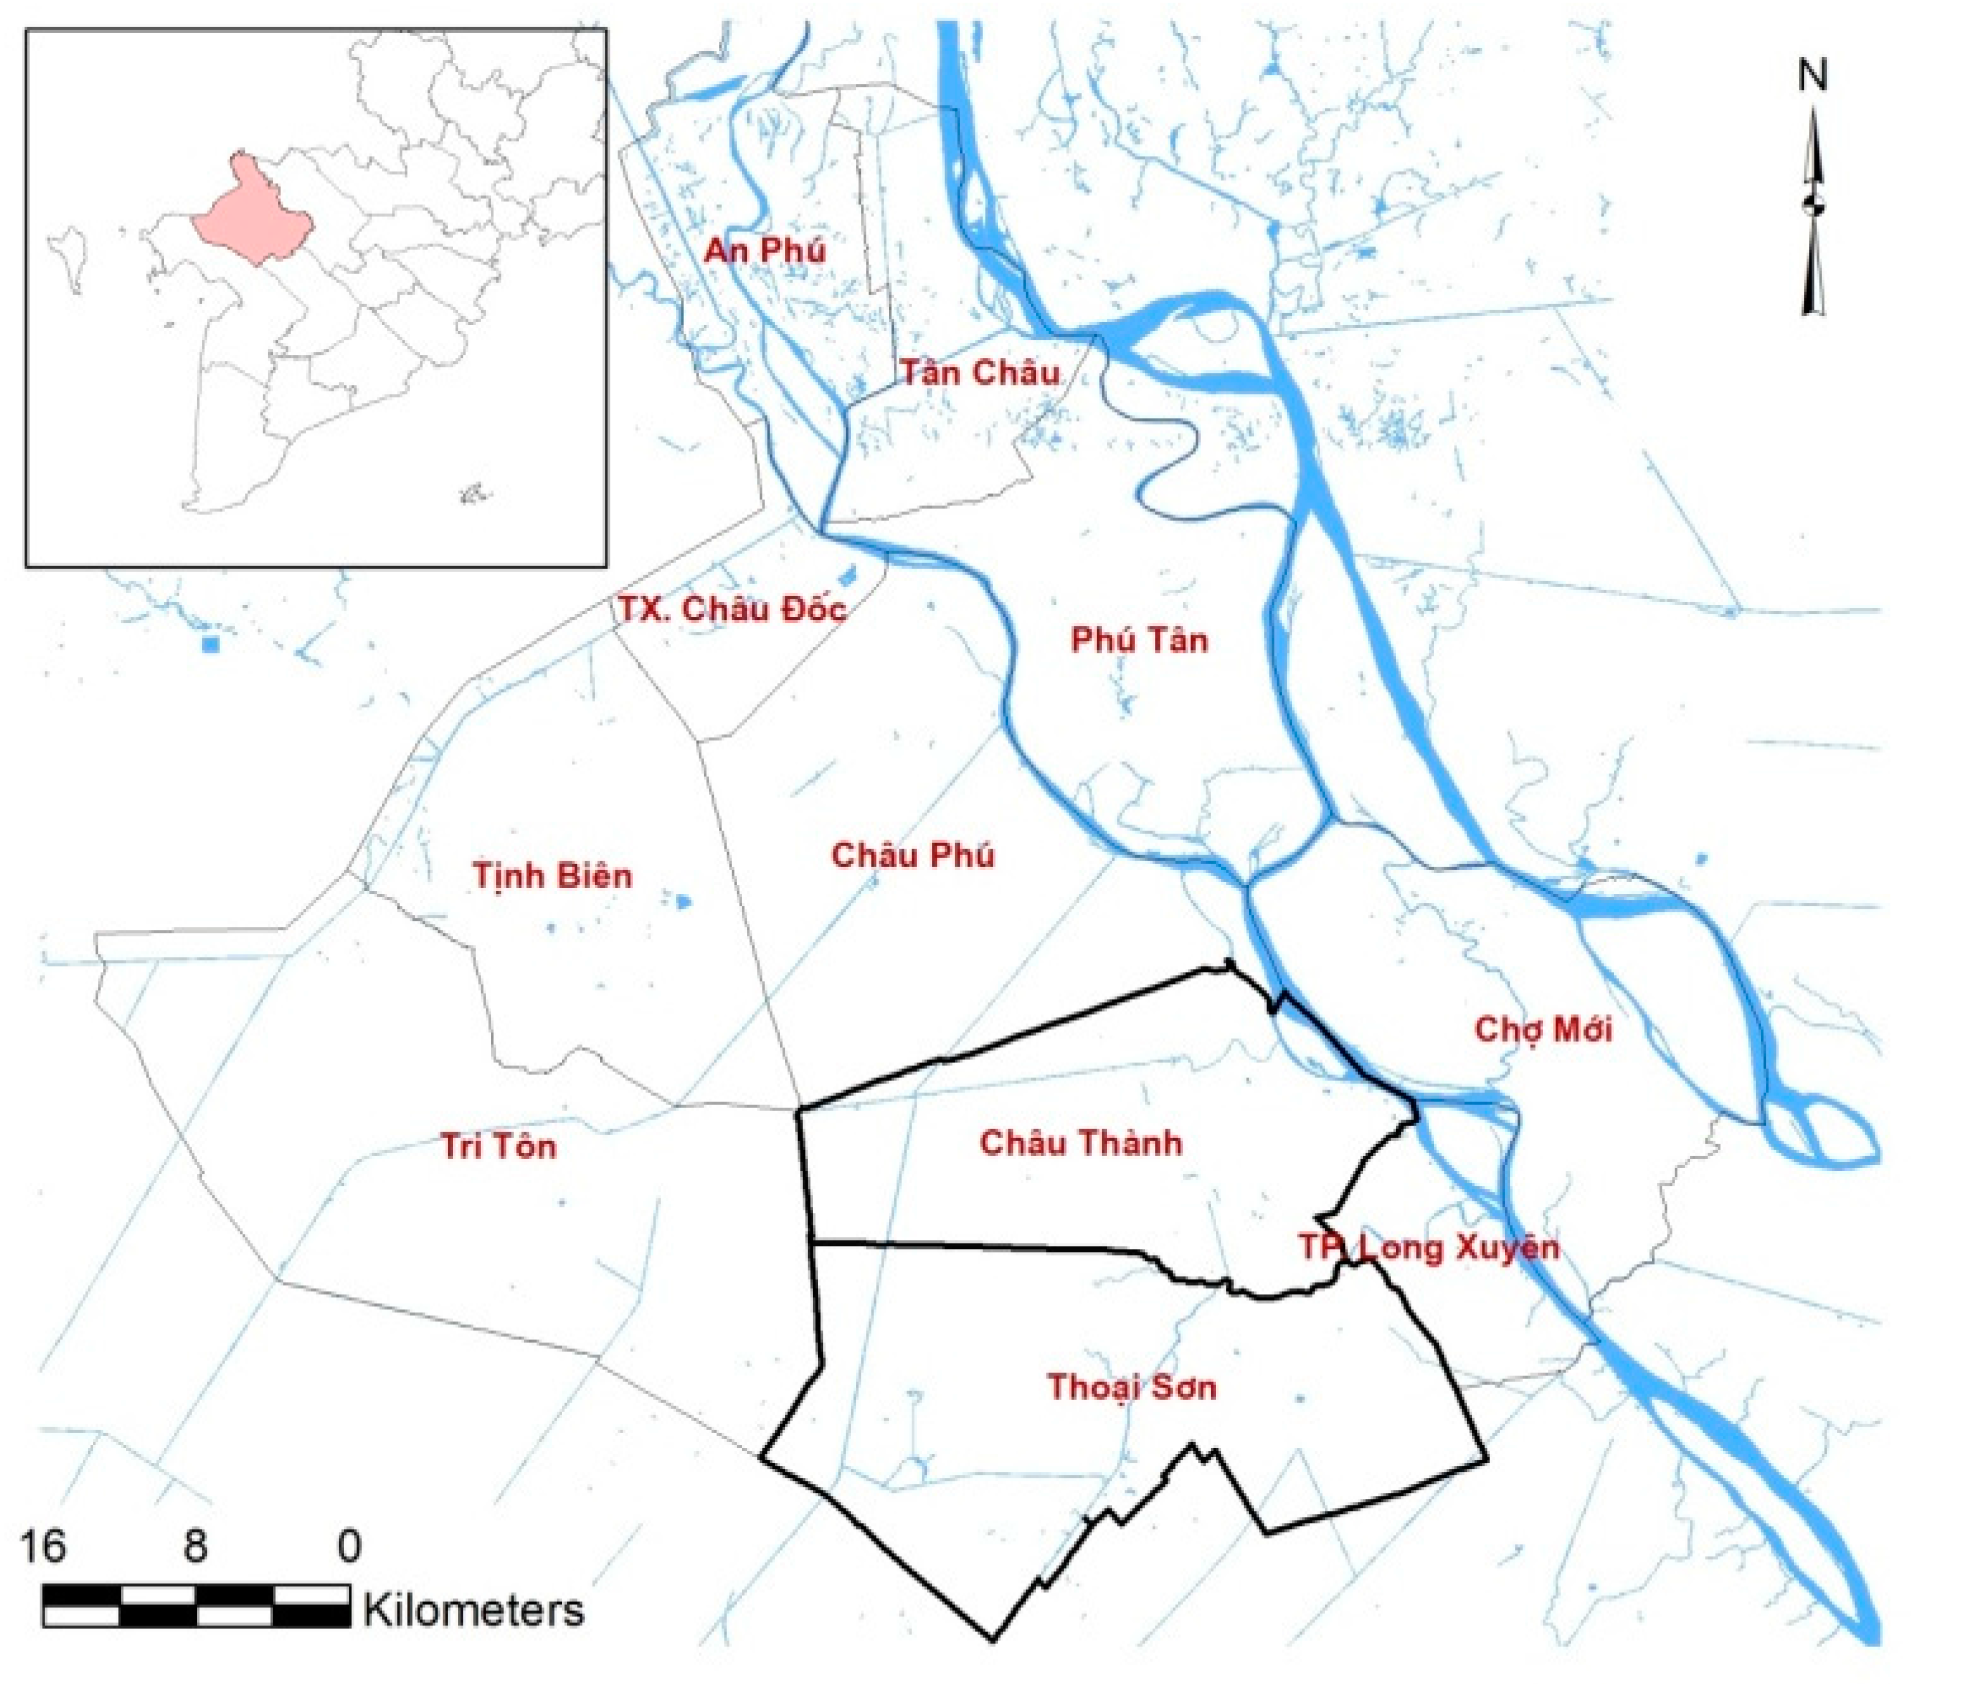
2.1. Test Site
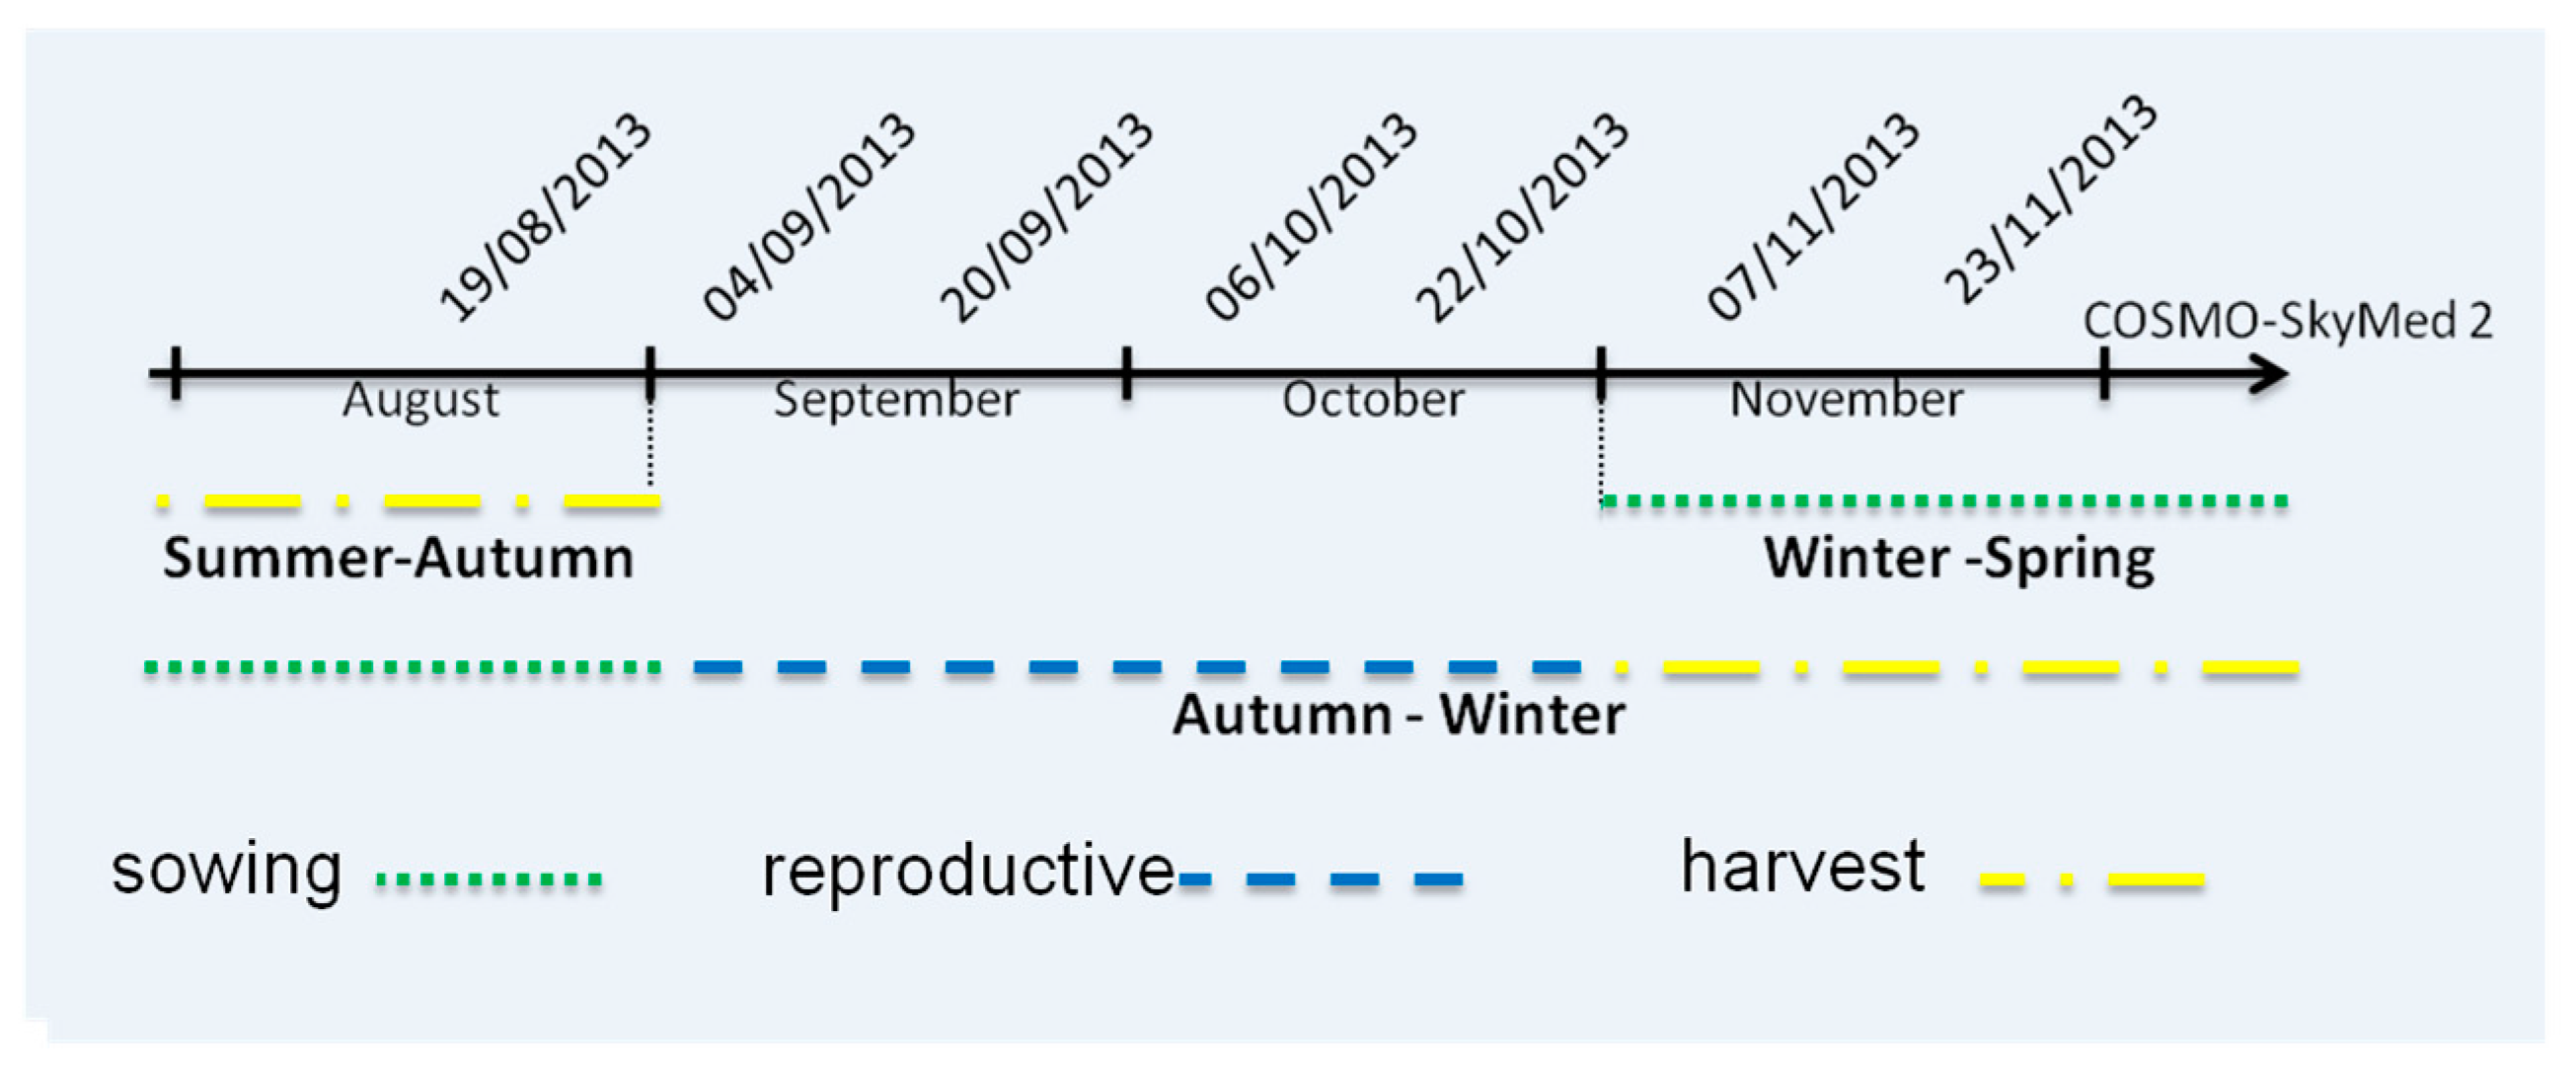
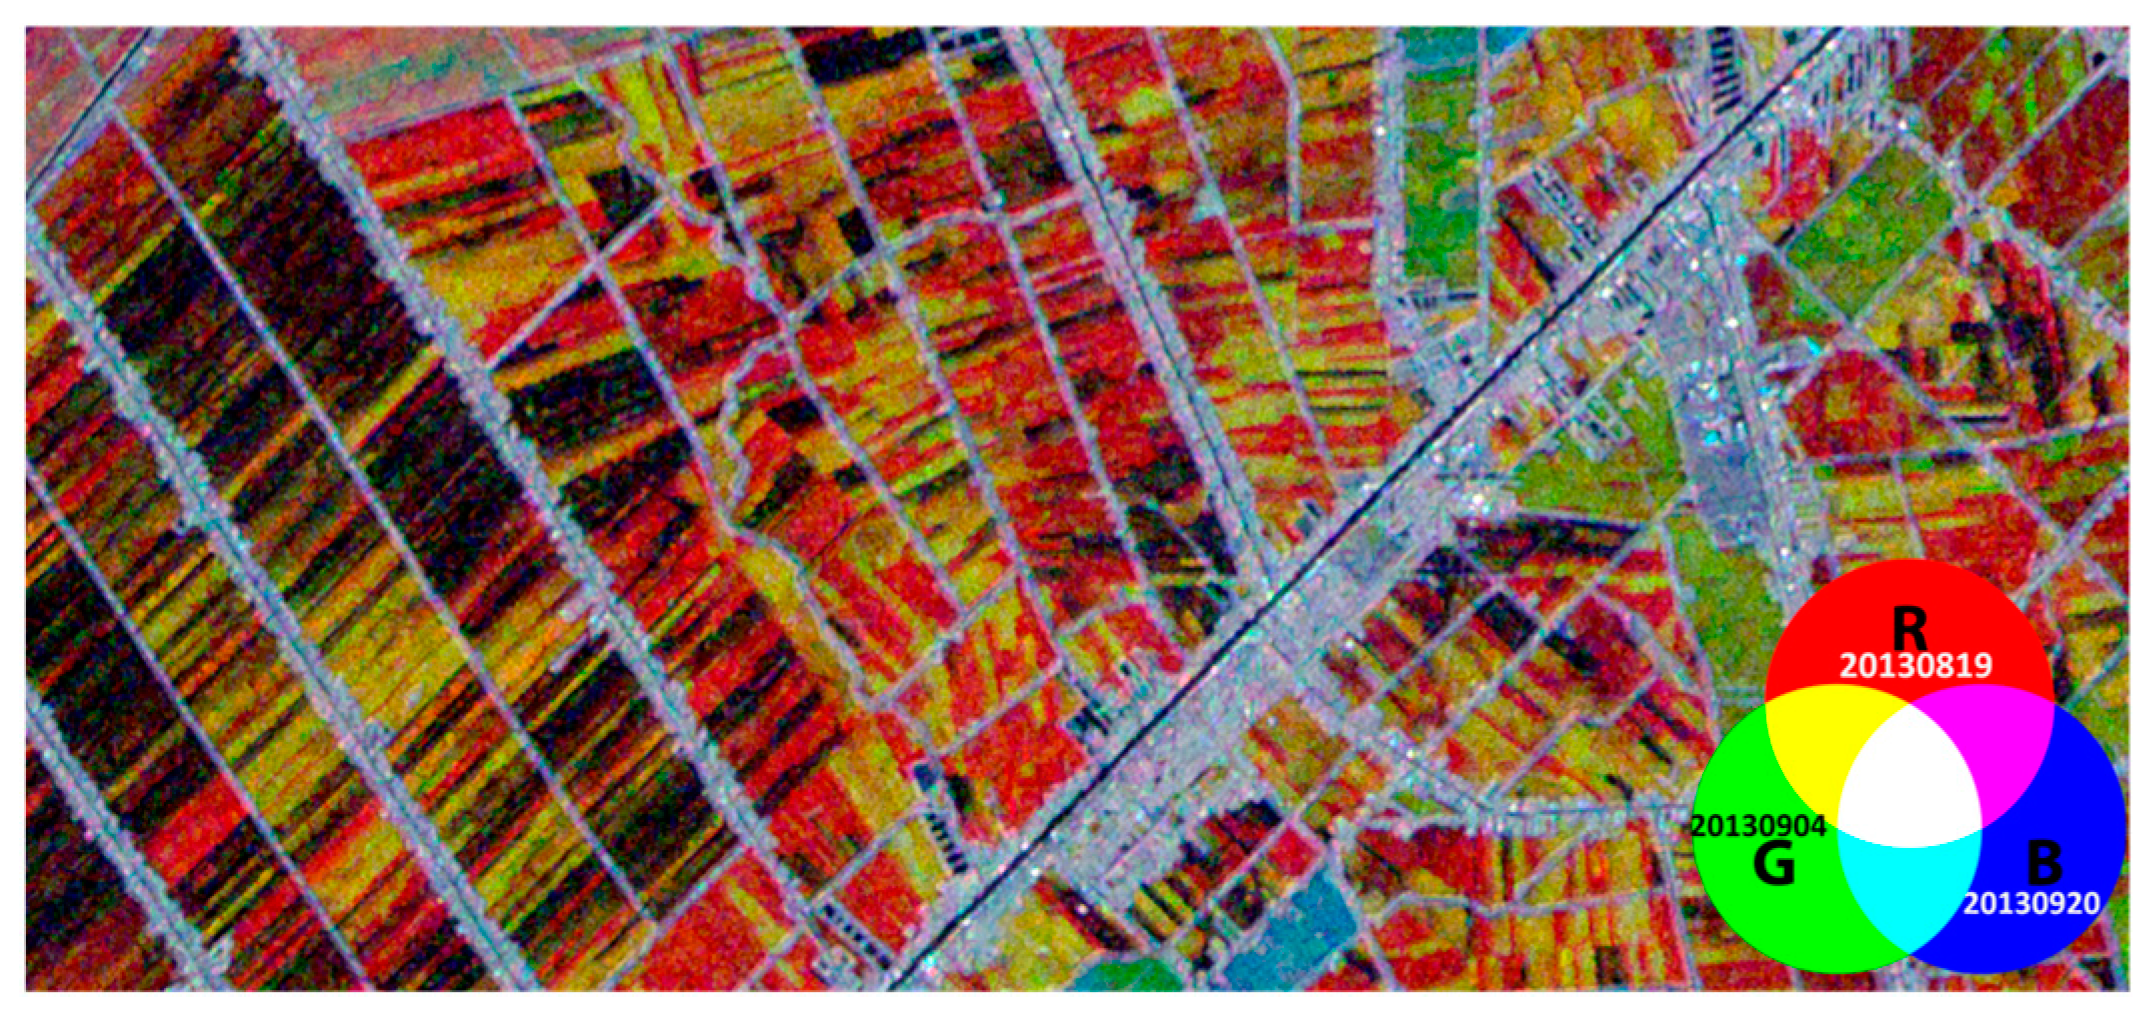
2.2. SAR Data
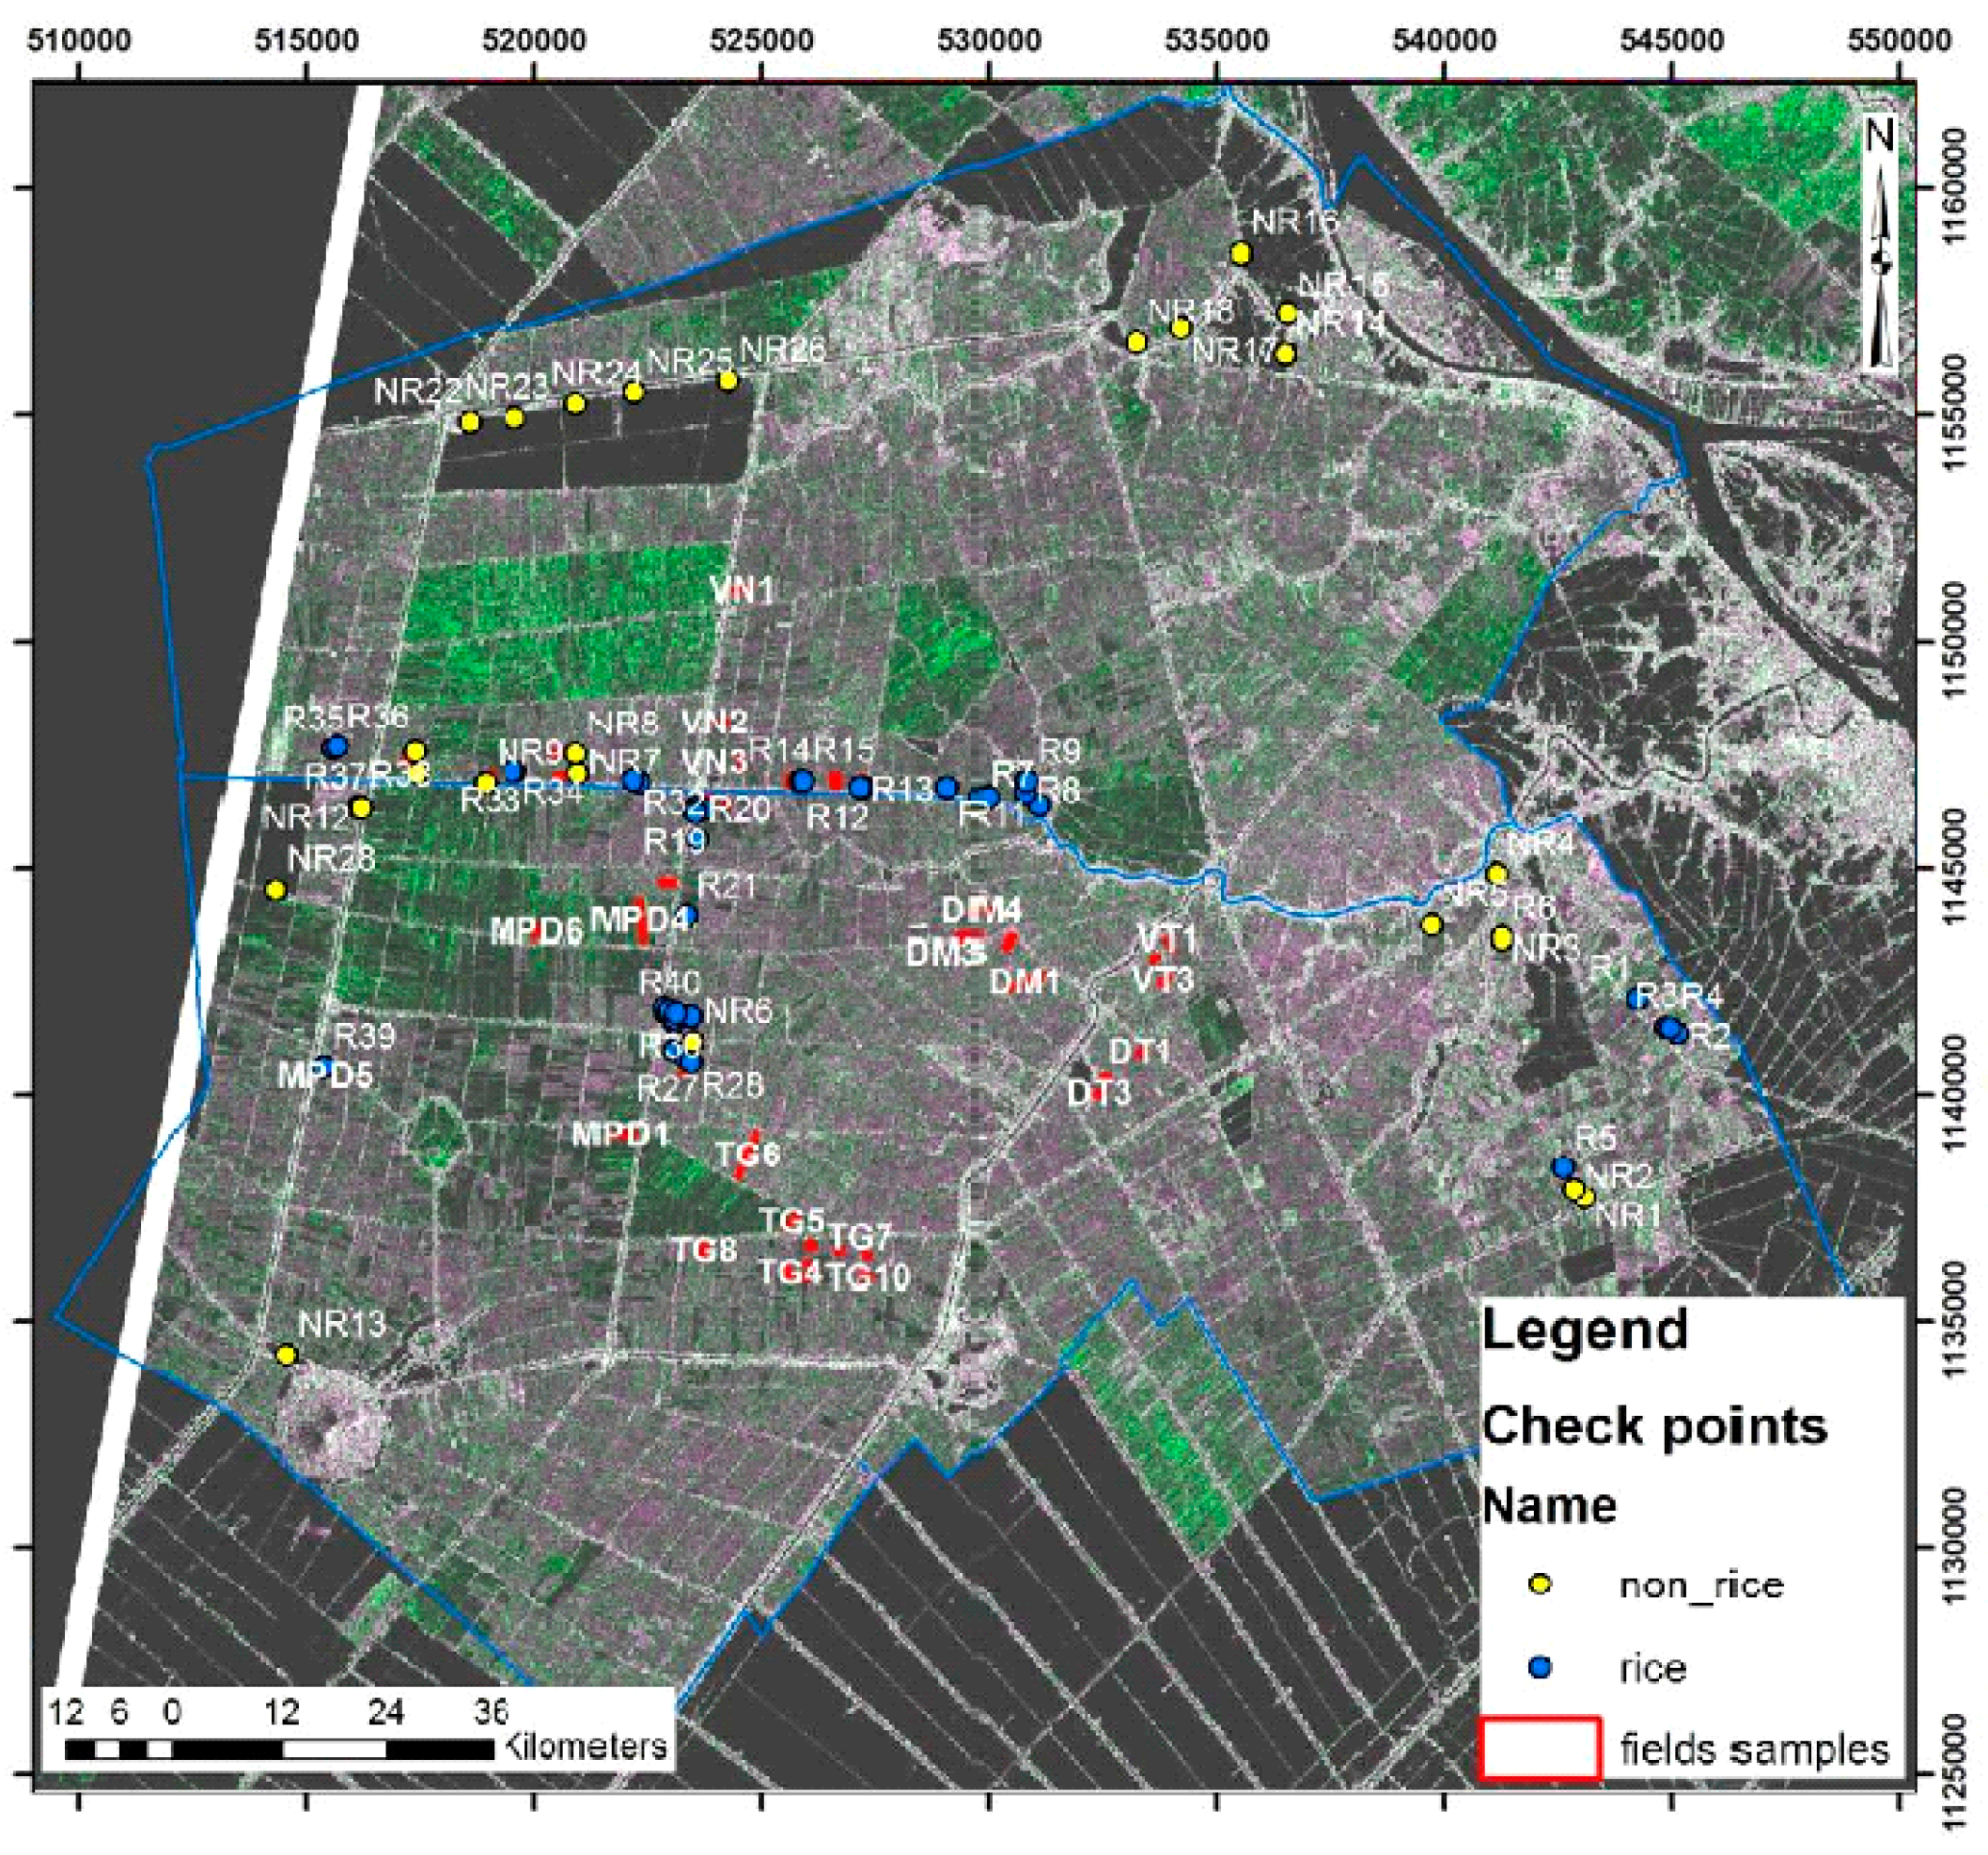
2.3. Ground Data
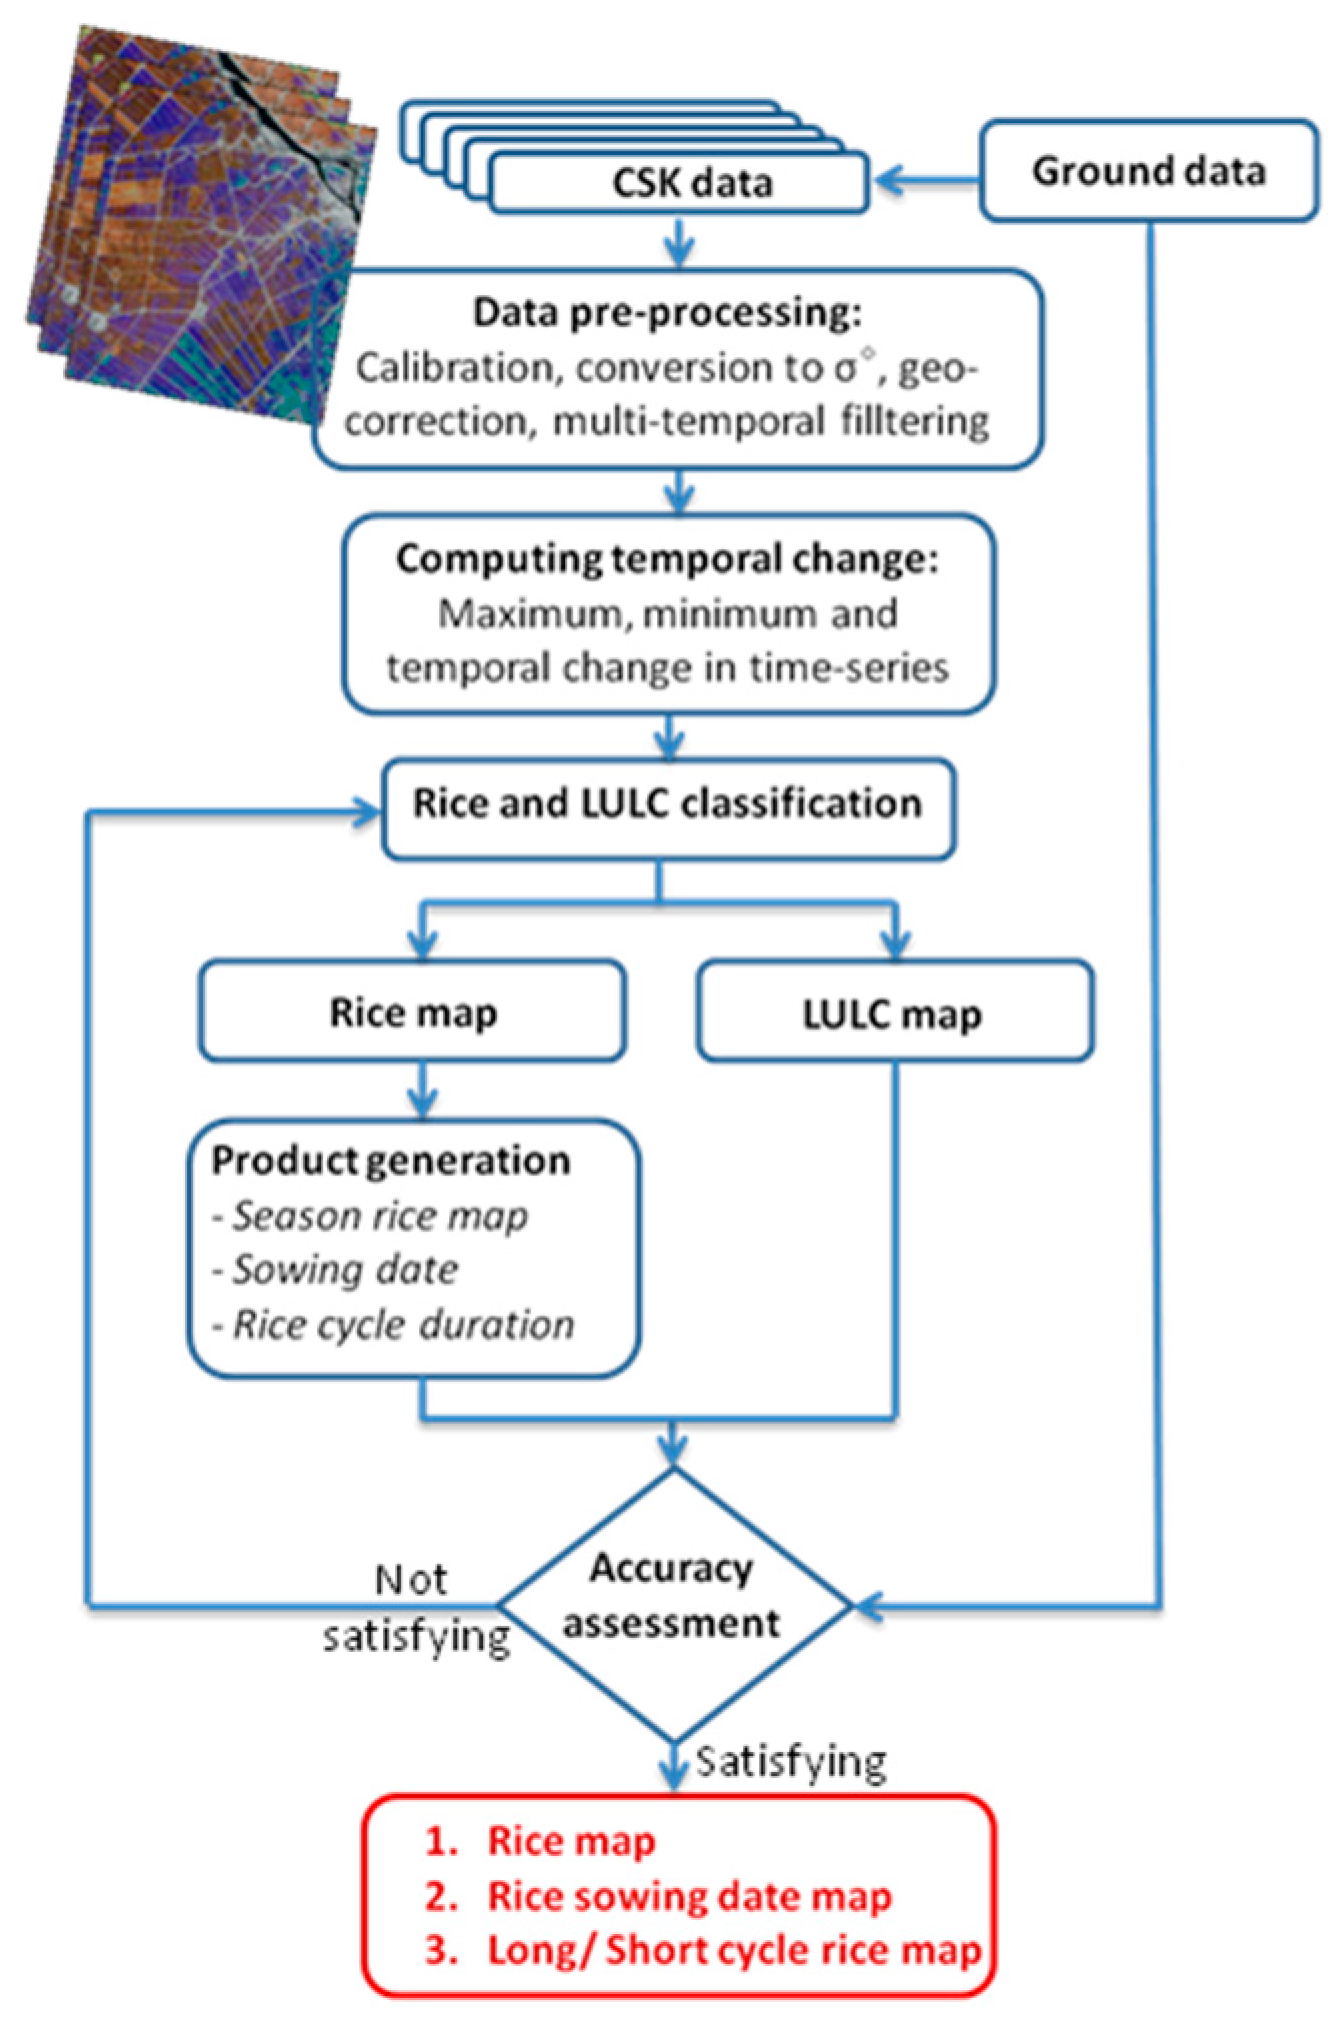
3. Methods
3.1. Analysis and Interpretation
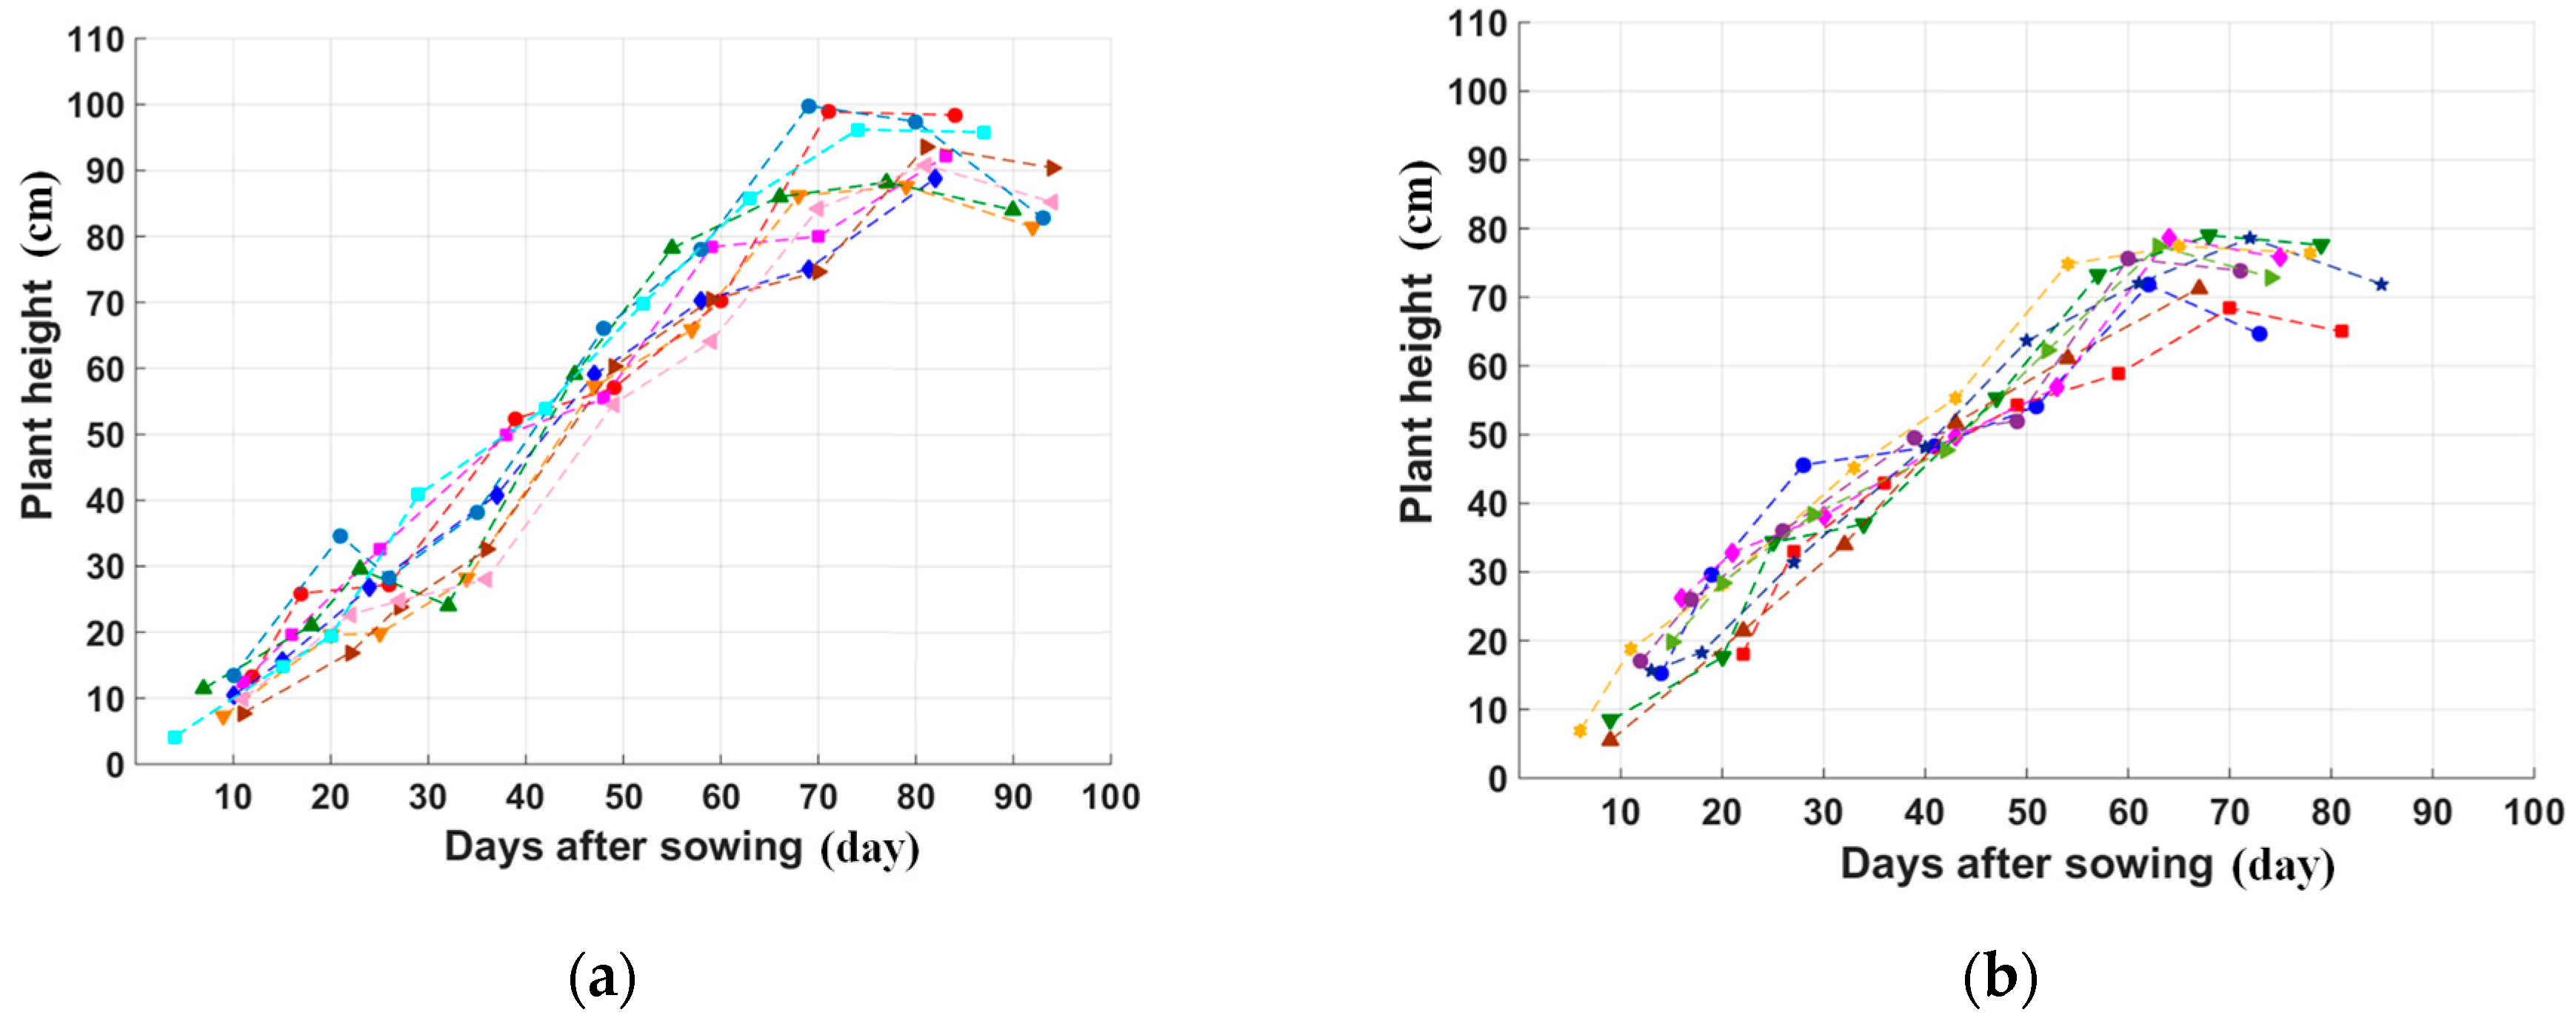
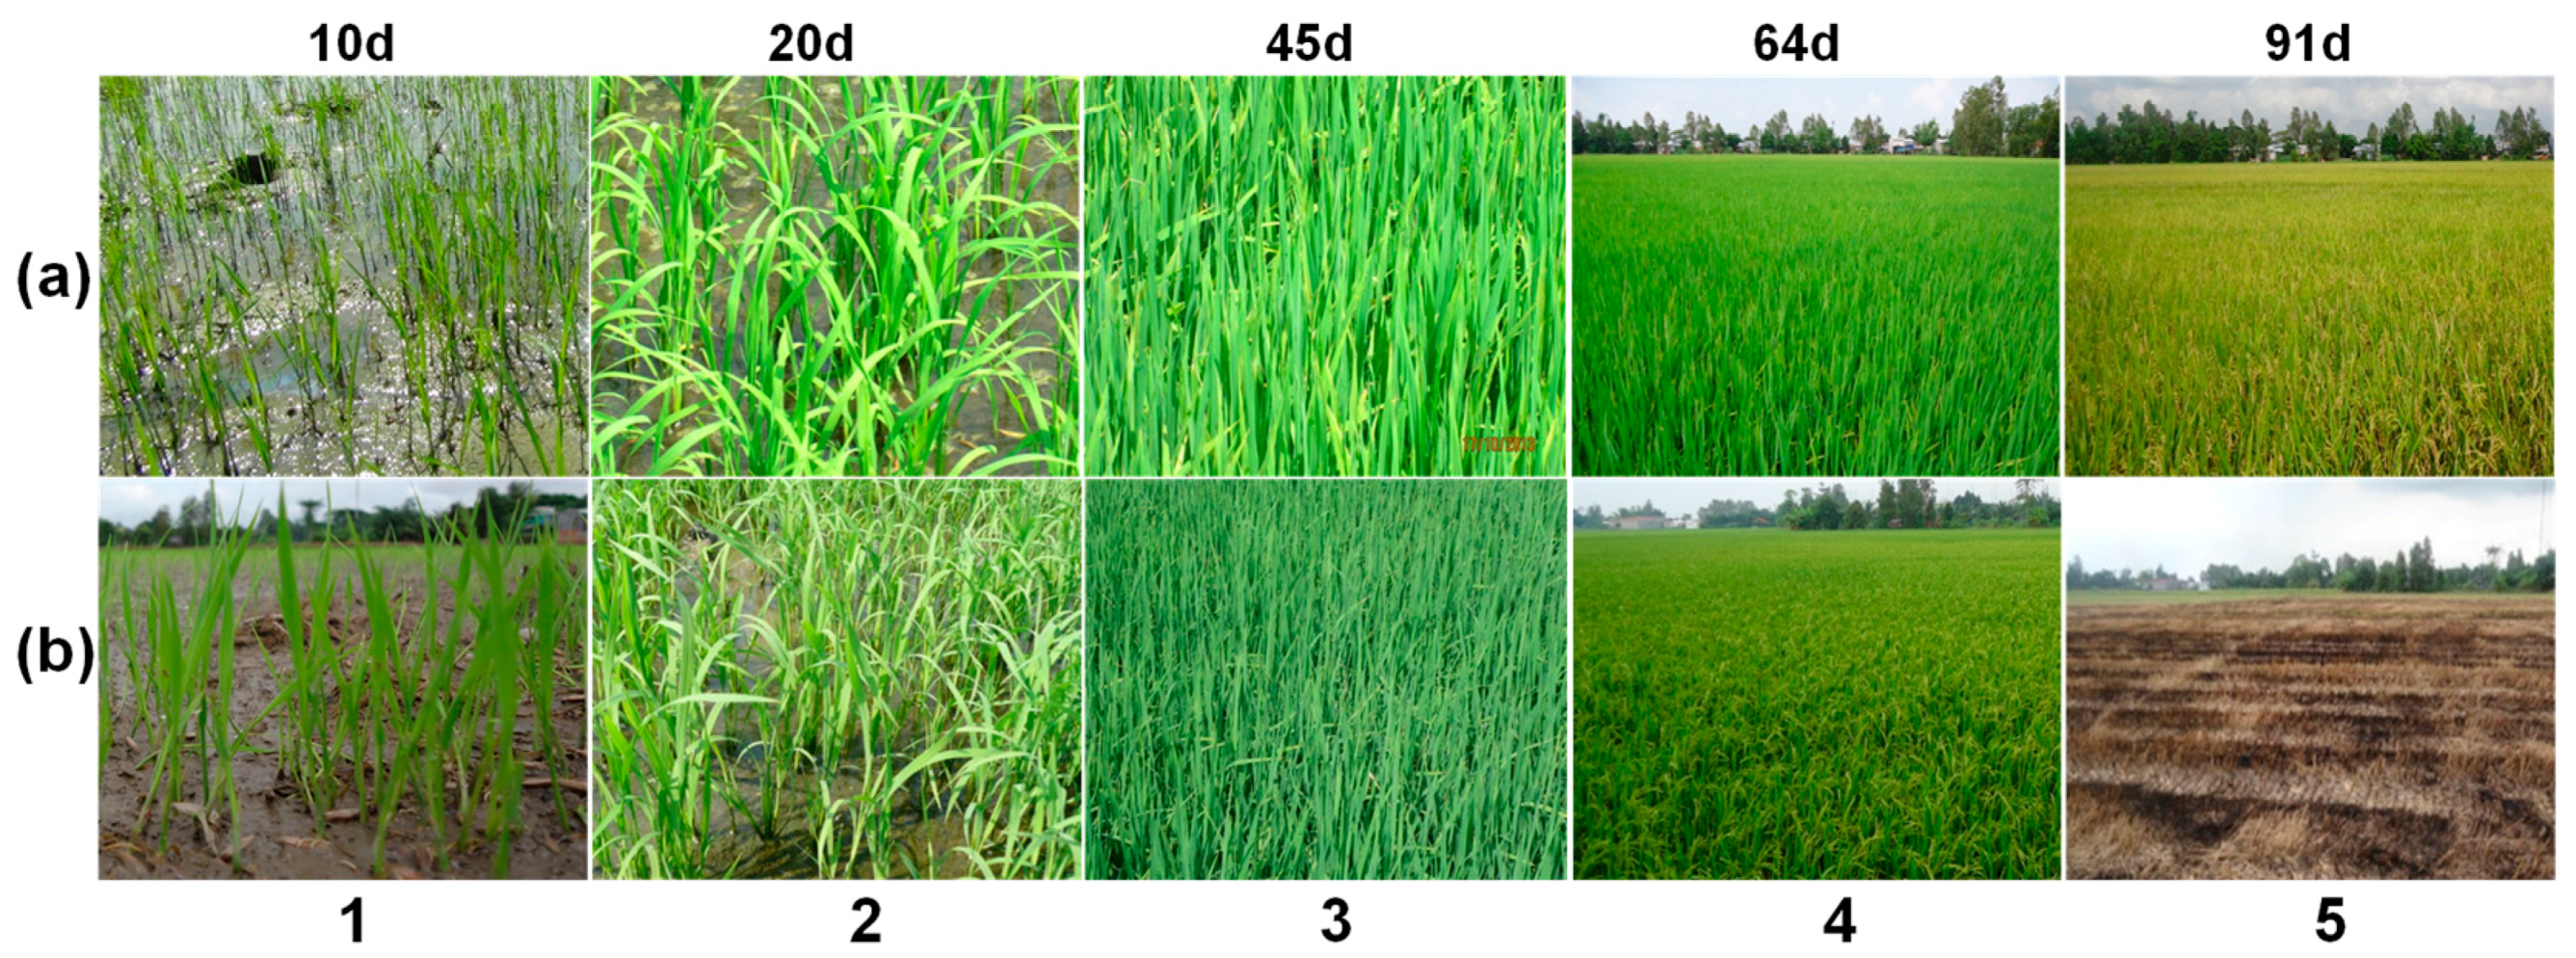
3.1.1. Ground Data Analysis
3.1.2. SAR Data Analysis and Interpretation
- ❖
- Calibration: conversion to the radar backscattering coefficient sigma nought () from the digital numbers, which follows the procedure specified by the European Space Agency (ESA) [29];
- ❖
- Geo-correction: Due to the topographical variations of a scene and the tilt of satellite sensor, distances can be distorted in the SAR images. Range-Doppler Terrain Correction is used to compensate for these distortions so that the geometric representation of the image will be corrected; these two operations are performed using the Sentinel Application Platform (SNAP) (http://step.esa.int/main/toolboxes/snap/).
- ❖
- Filtering: All the algorithms developed in this study require a prior reduction of the speckle noise in the SAR images. One effective approach to reduce the speckle effect while preserving the spatial resolution is to apply a multi-image speckle filter [30,31] (multi-temporal and double polarization images in this study). The filter linearly combines M input images on a pixel-to-pixel basis, to create M output images with reduced speckle and thus increase the original number of looks L in the image to a higher equivalent number of looks (ENL), without reducing the spatial resolution. This filter requires the estimation of local averages in a spatial window of N pixels. It is shown in [31] that the ENL can be expressed as:
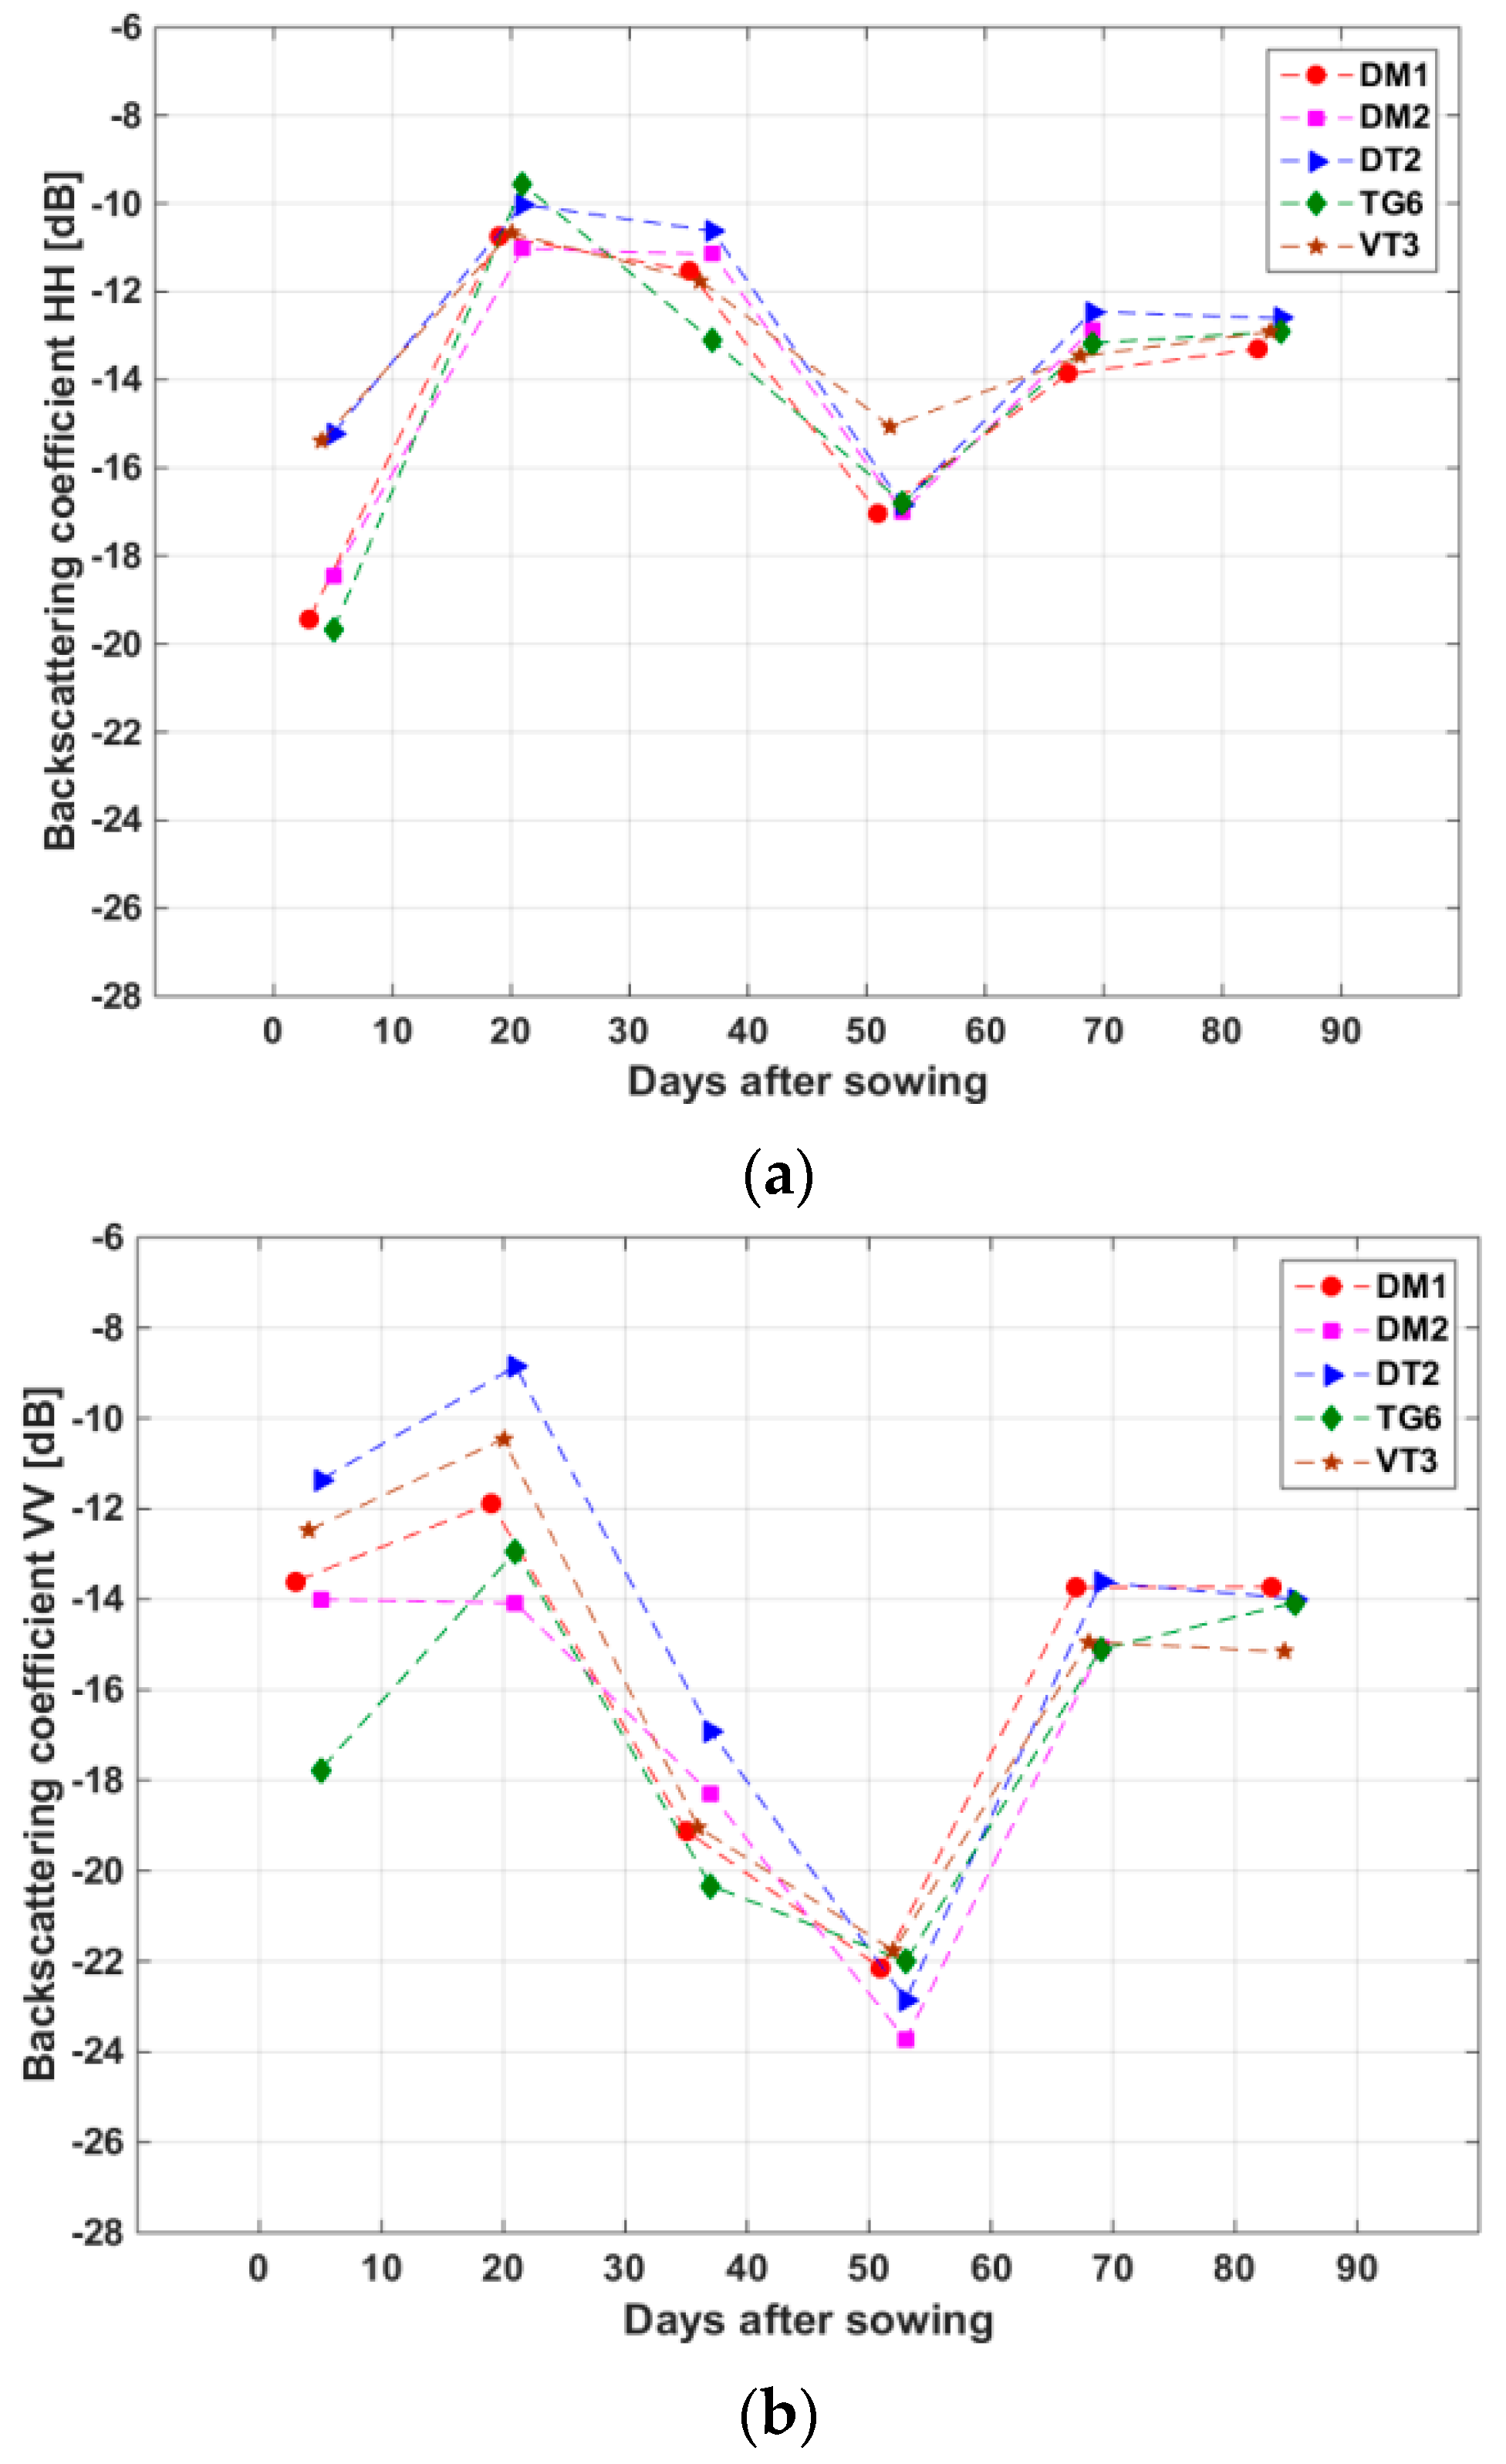
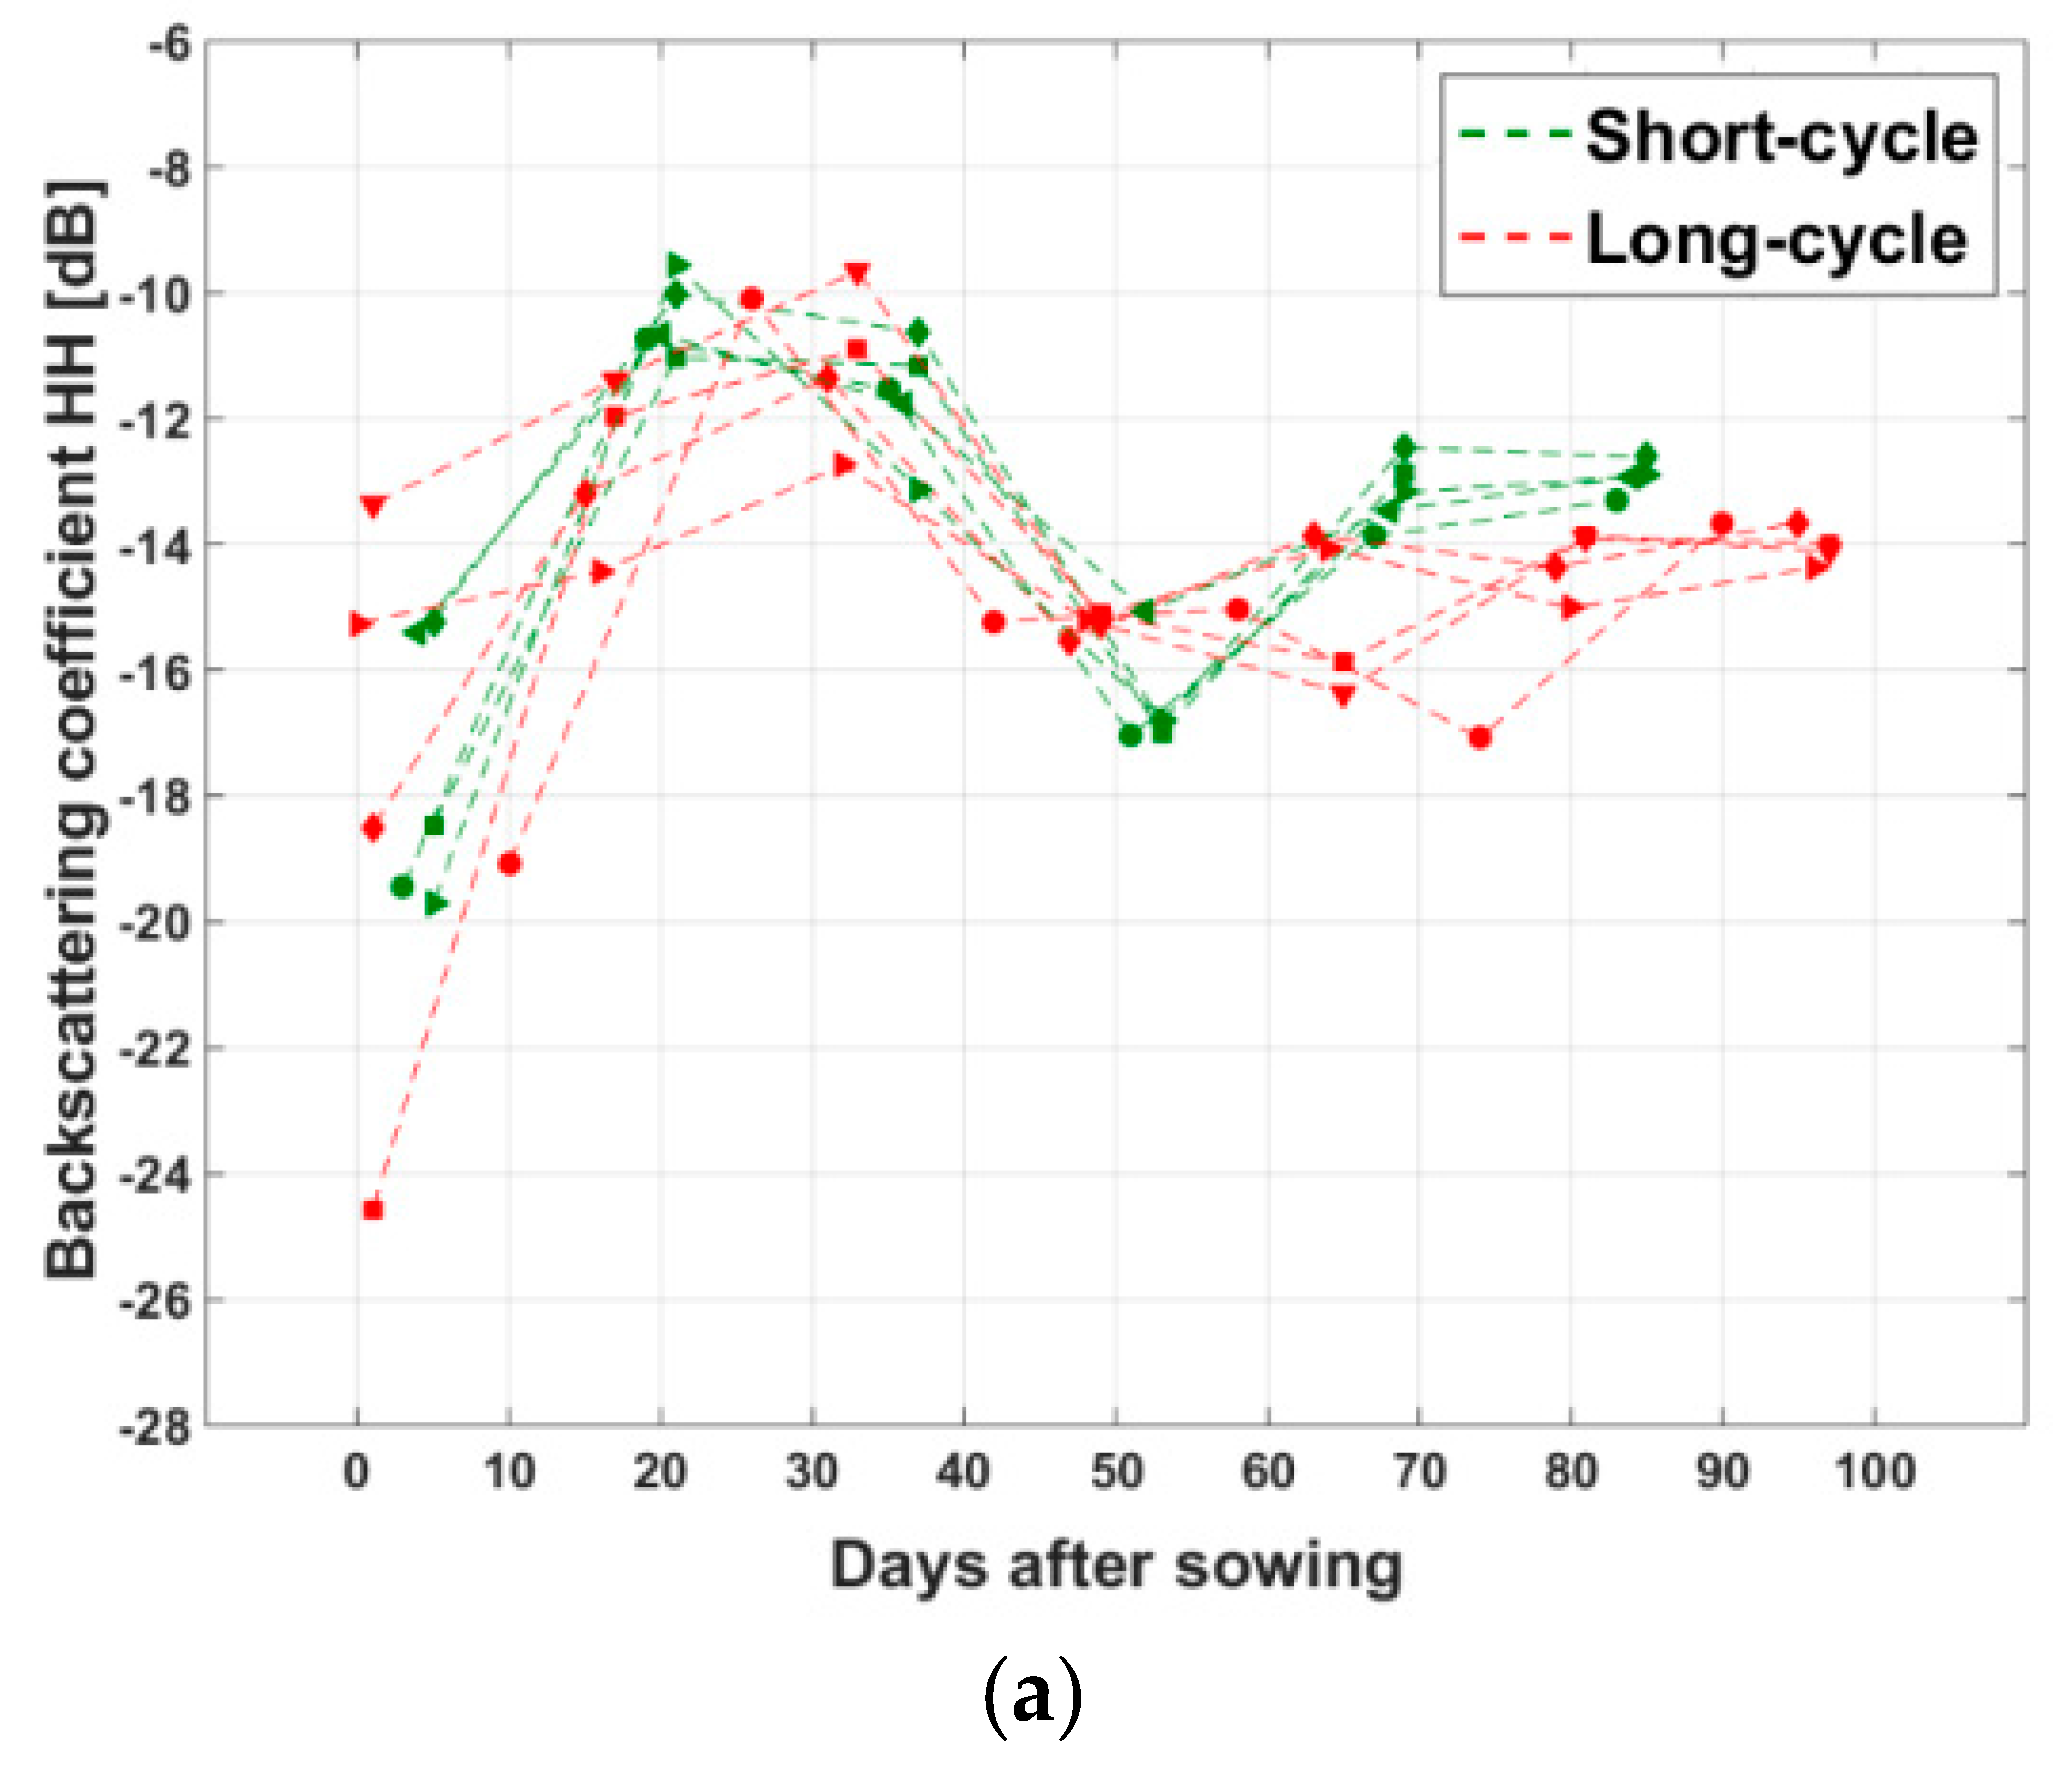
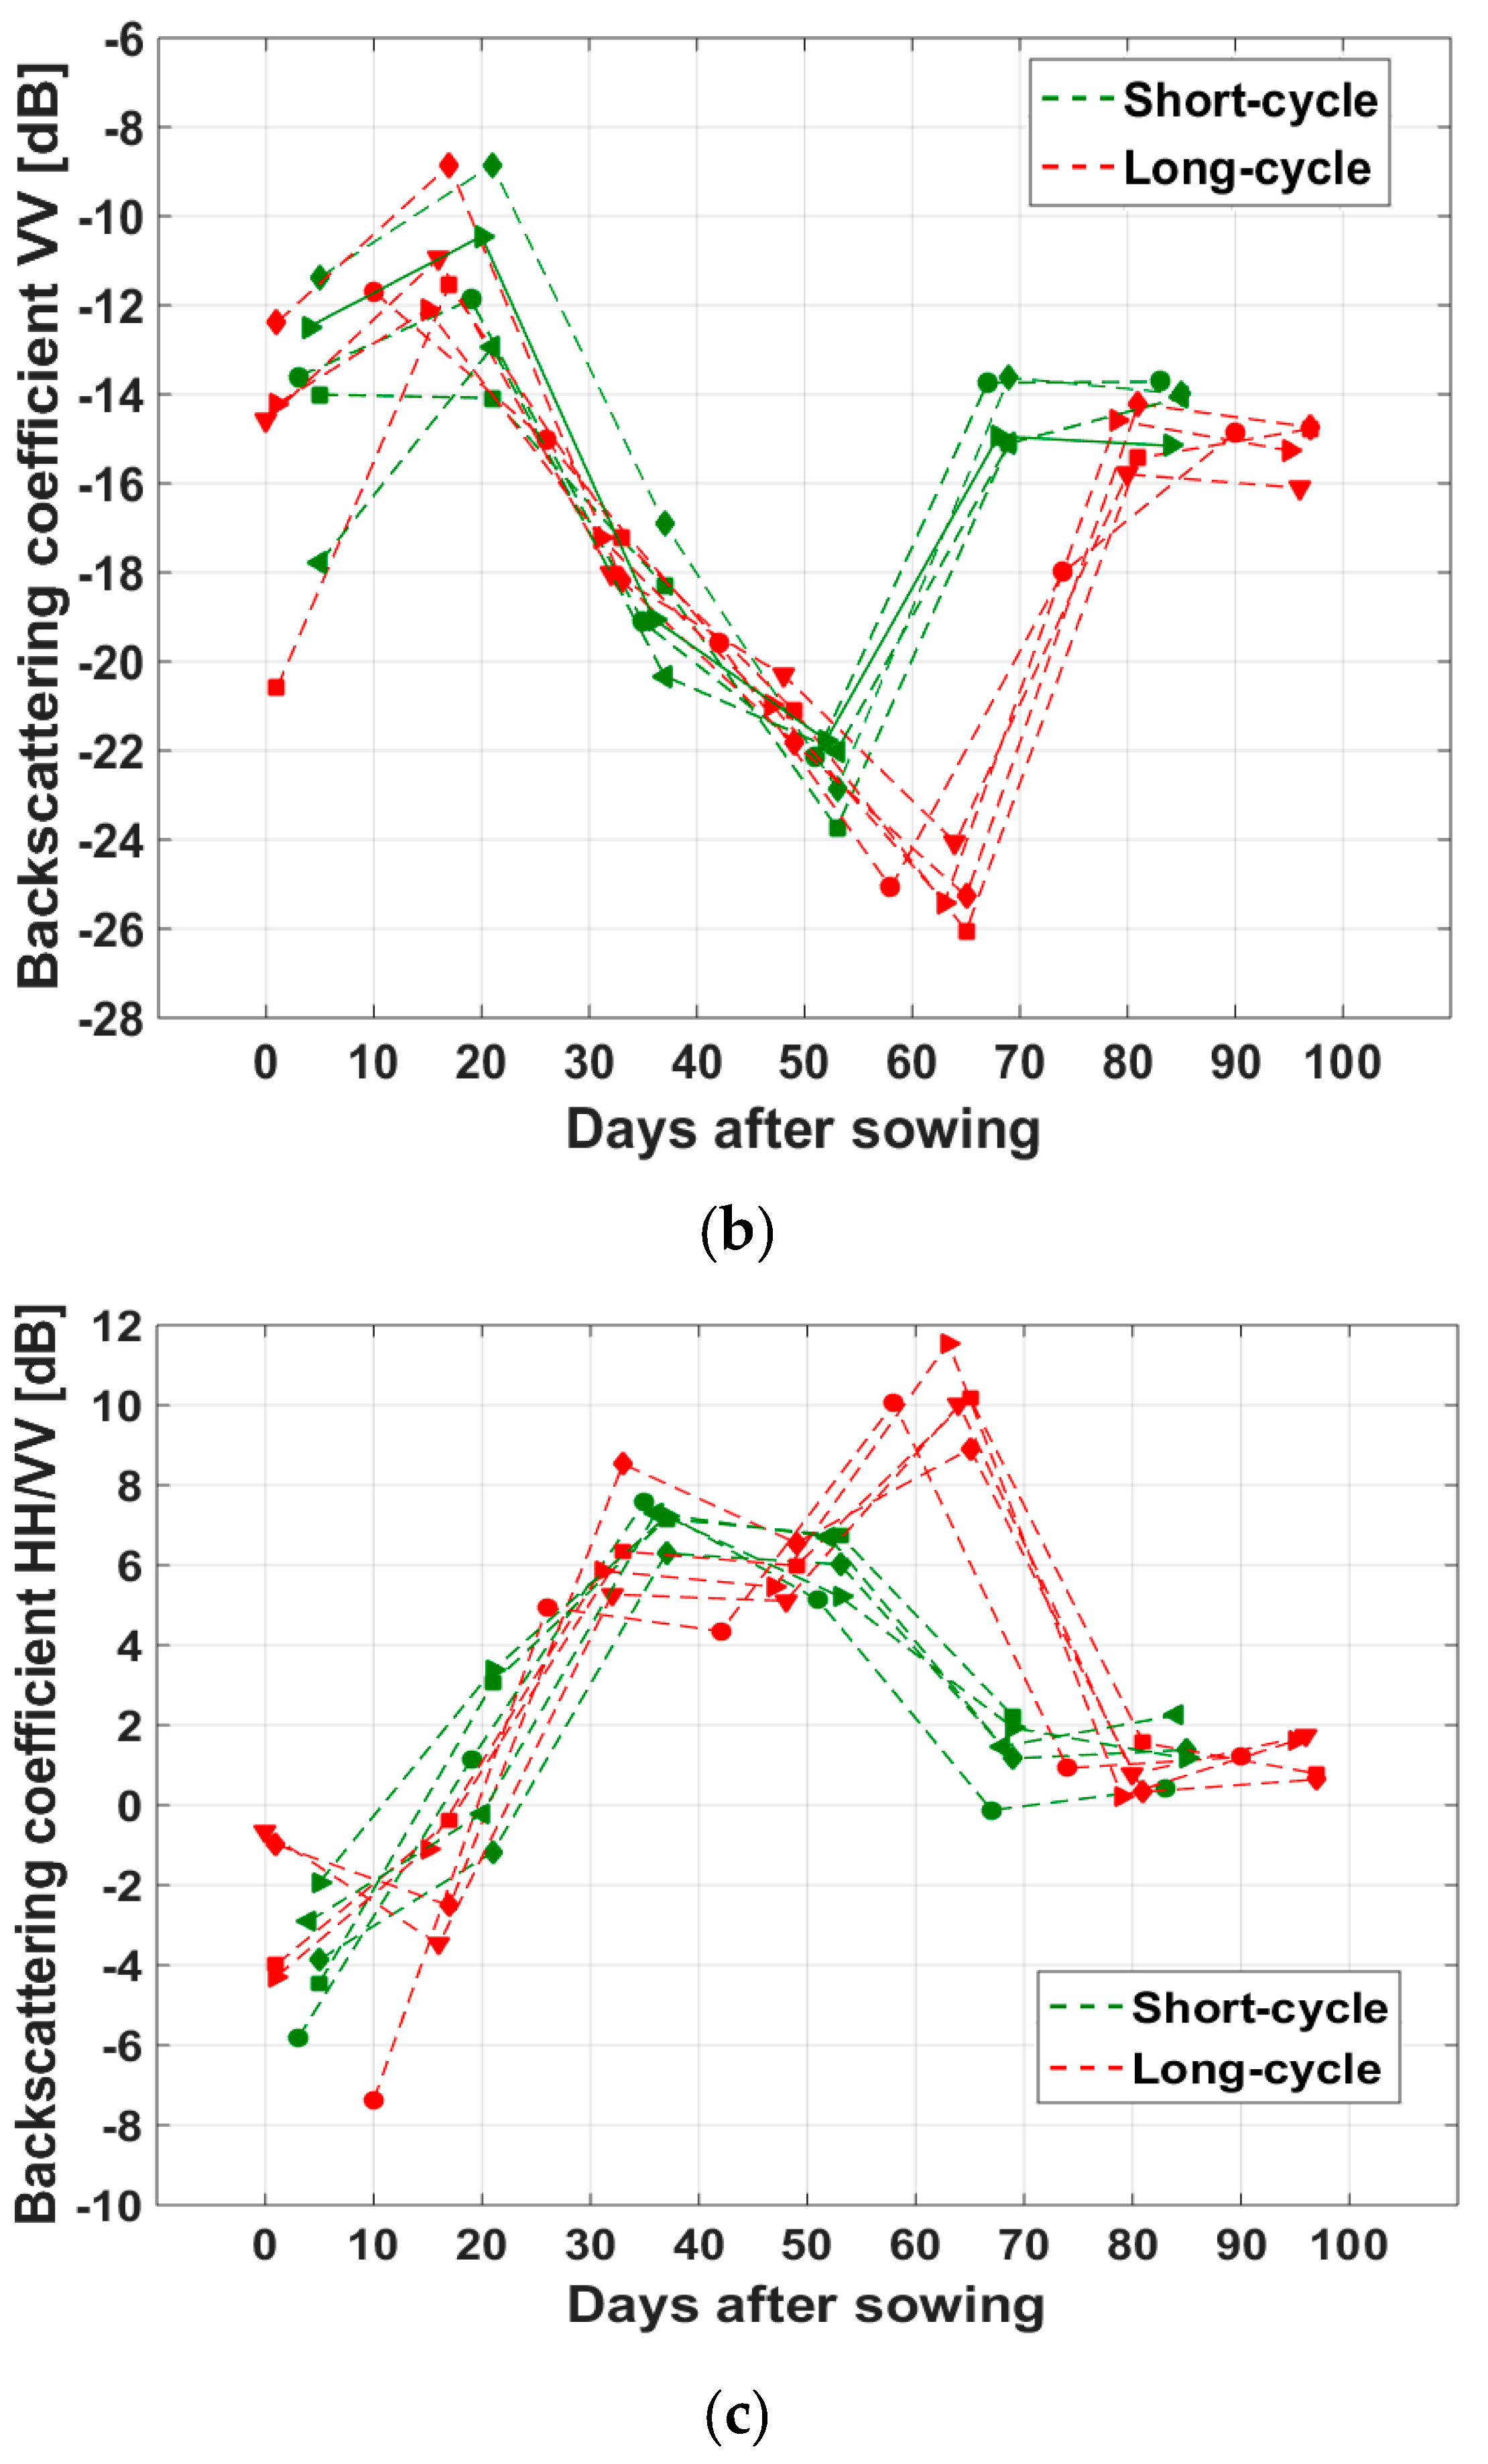
- From sowing to the beginning of tillering (0 to 20 days, plant height 0 to 20 cm, water in the fields from 10 to 20 days), an increase is observed at VV and HH, because of the increase in volume and double bounce scattering with the plant growth, the latter being largely dominant. At the first date, the fields were mostly wet bare soil. The backscatter has low backscatter values with large dispersion (5 to 6 dB), which can be interpreted as the effect of inter-field differences in soil moisture and surface roughness. From 0 to 20 days, VV is higher than HH, which is interpreted which was found in Le Toan et al., [14] as due to the double bounce scattering from vertical plant elements, the attenuation by these low biomass elements being negligible. At 20 days, when the plants lose their vertical structure, HH and VV are observed to have close backscatter values, with VV having more dispersion due to increasing attenuation by the plants. The resulting polarization ratio HH/VV exhibits also an increase from −4 ± 2 dB to 0.5 ± 2 dB.
- From the tillering to the beginning of the reproductive phase (20 to 35 days, plant height from 20 cm to 40 cm), the double bounce scattering decreases. At the same time, with the increase of biomass in the vertical stem, the plant attenuation increases, and in addition, the double bounce scattering, generates more backscatter in HH than in VV [32,33] leading to a much stronger decrease (7 to 8 dB) in VV, than in HH (1 to 2 dB). The resulting polarization ratio HH/VV increases up to 6 dB.
- From the beginning of the reproductive phase to the flowering stage (35 to 55 days, height from 40 cm to 60 cm, wet biomass from 2.5 to 4.5 kg/m², water in the fields between 40 to 50 days), the canopy was dense, leading to wave attenuation in both VV and HH. VV backscatter reaches a minimum value of −22 to −24 dB, HH reaching −15 to −17 dB. The resulting polarization ratio decreases slightly around 6 dB.
- From flowering stage to grain maturity phase (55 to 70 days, height from 60 cm to 80 cm), the attenuation by the stem is similar to that of the previous period. However, the biomass of the upper part of the plant increases. This results in an important increase of VV (8 dB) and of HH (4 dB). The resulting polarization ratio decreases to 0 to 2 dB.
3.2. Rice Monitoring Methodology
3.2.1. Mapping Indicators
- (a)
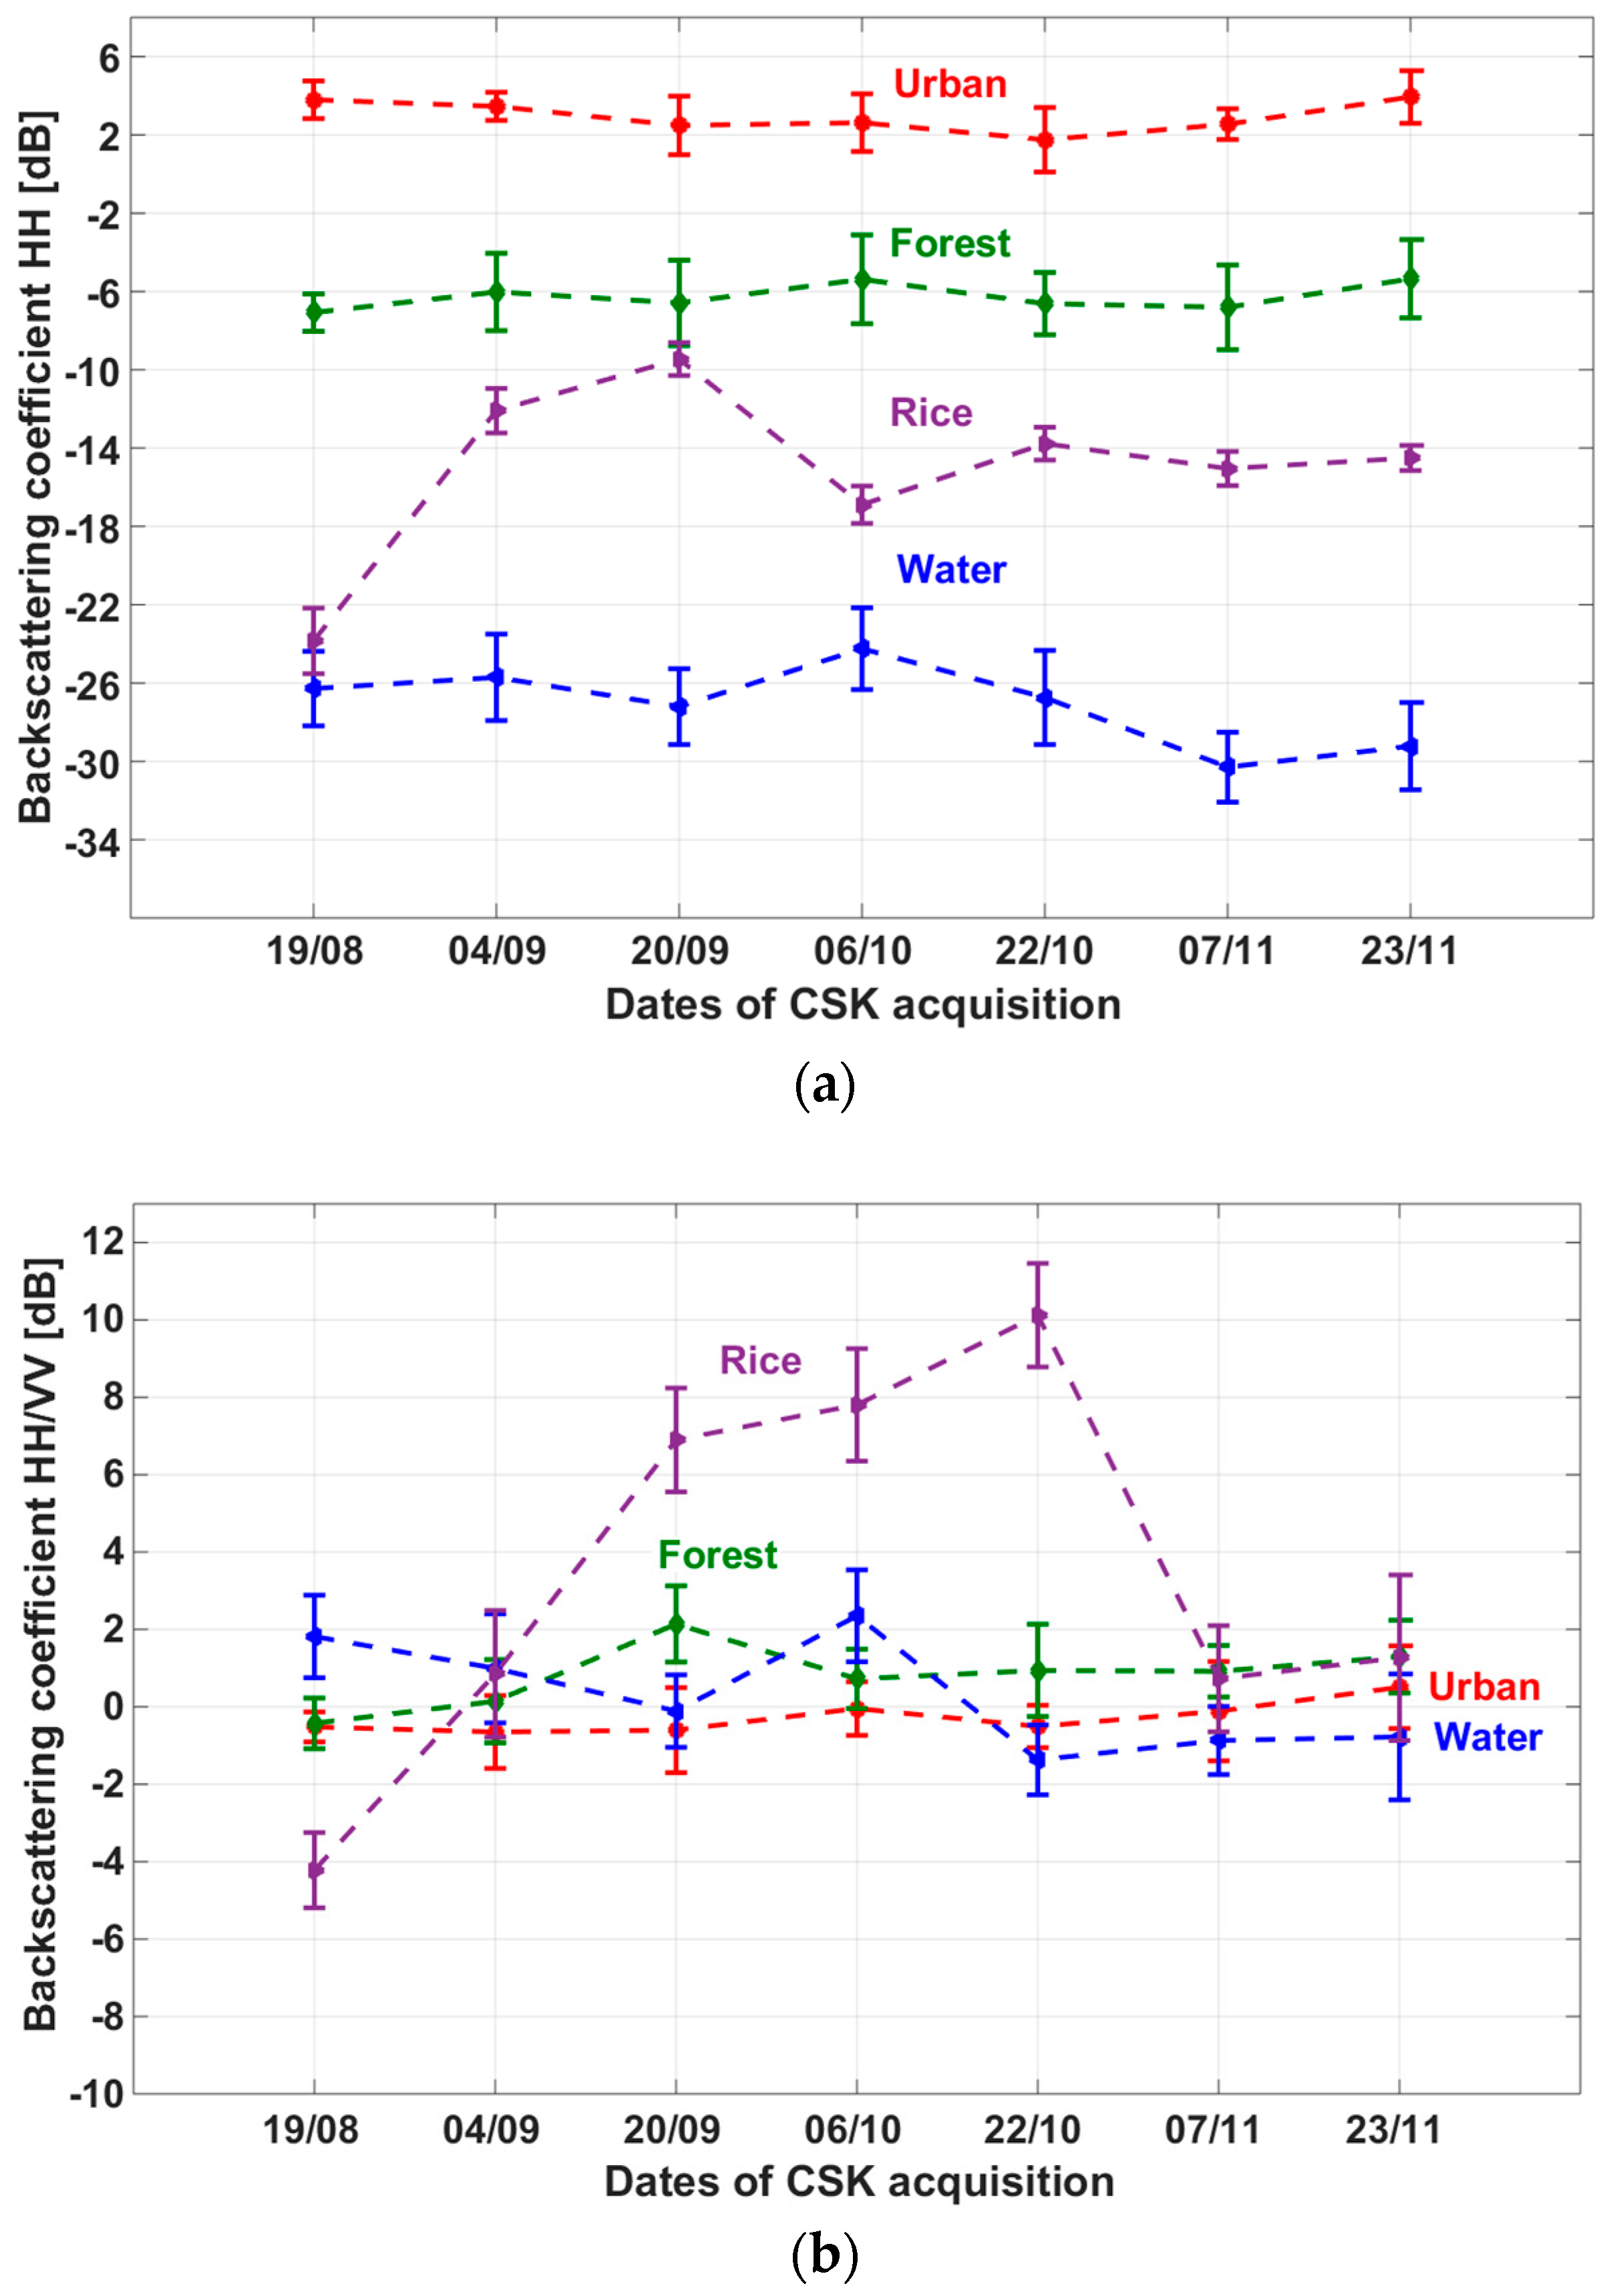
- Rice mapping: to discriminate rice fields from other LULC the temporal change of the HH and HH/VV ratio can be used. However, if the data acquisitions are not frequent, the data at the beginning or the end of a given rice season can be missed, polarization ratio HH/VV is a better indicator than HH for rice field mapping. In addition, indicators derived from the HH polarization (e.g., the maximum and minimum backscatter values in the HH time series) can be used to map other land use land cover classes (water, forest, and built up area), which can be used to reduce confusion in the rice map.
- (b)
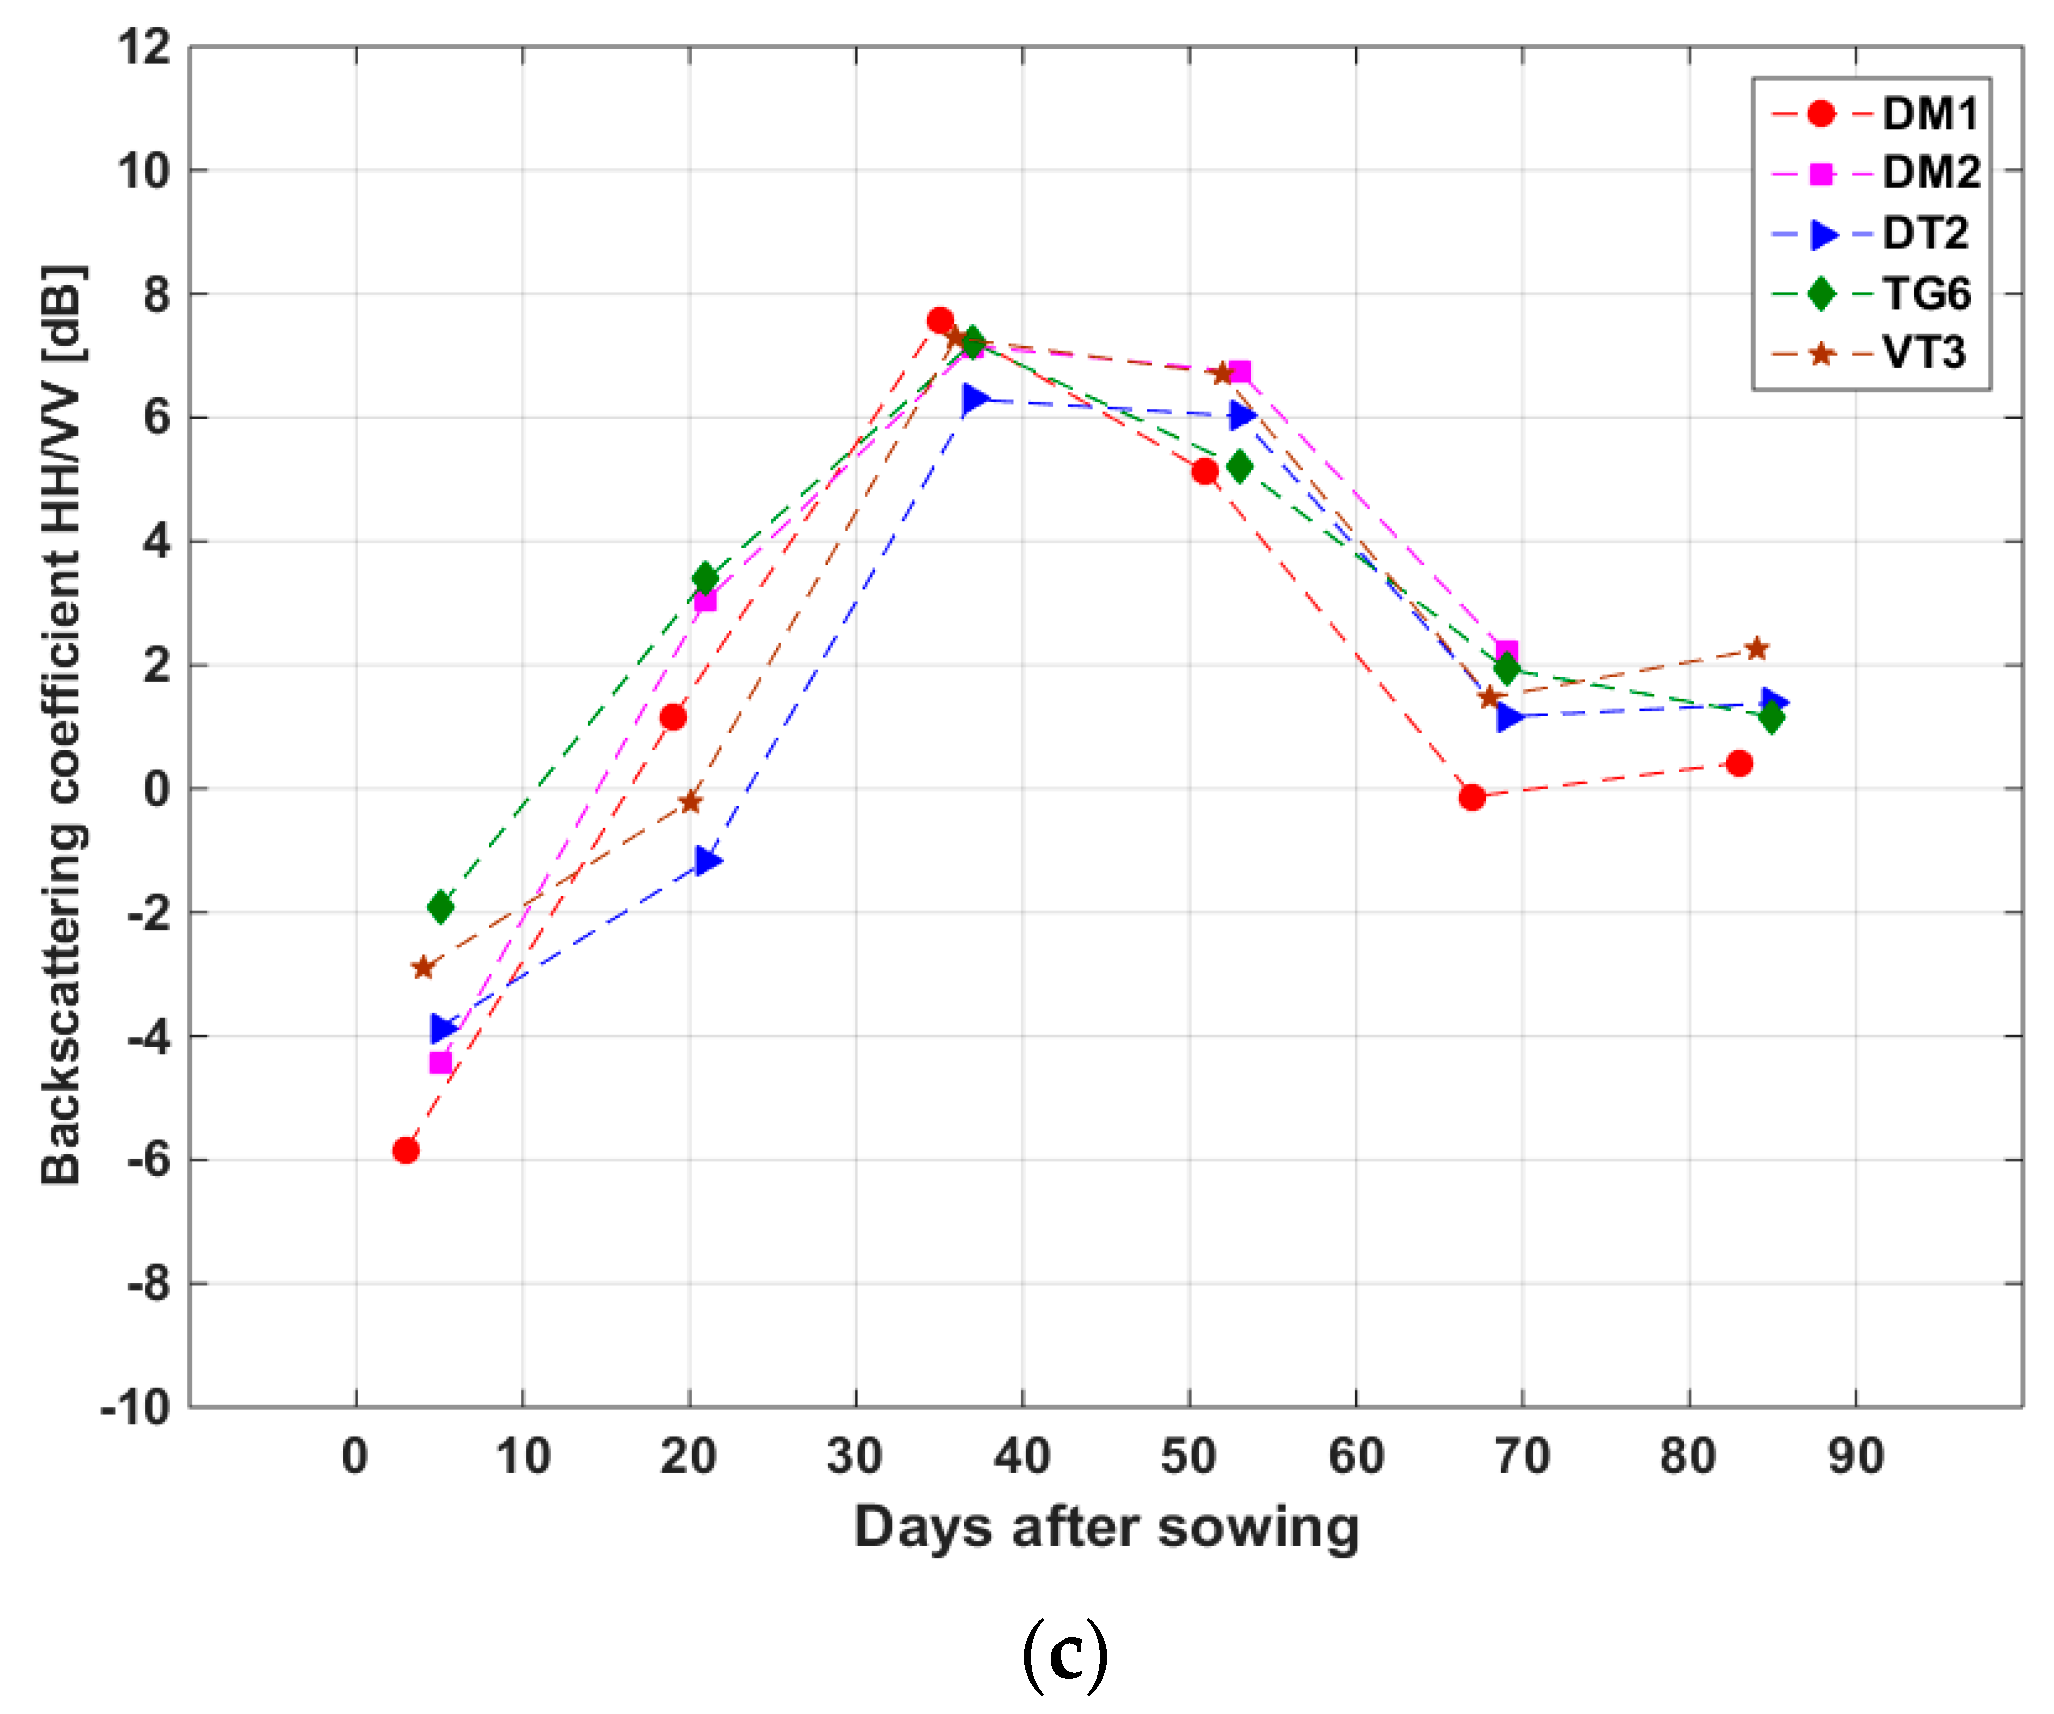
- Mapping of short/long cycle rice: in Figure 8c, the HH/VV ratio of the long cycle rice peaks at around 60 days after sowing at values of more than 10 dB (as compared to less than 8 dB at around 50 days after sowing for the short cycle rice). This was explained by the vertical structure of the plants (shown in Figure 5a(4)), and the plant height increasing from 80 cm to 100 cm, at 60 days to 80 days. The indicator to be used is therefore the maximum values of HH/VV.
- (c)
- Determination of sowing date: as seen in Figure 7c and Figure 8c, the data dispersion in the HH/VV temporal profiles is small at the beginning of the season, where short-cycle and long-cycle varieties follow a similar development. In particular, it is observed over the 40 monitored fields that the HH/VV temporal curves cross the 0 dB line at 19.6 ± 4.3 days after sowing. This can be physically explained by the fact that this date corresponds to the beginning of tillering, when there is a drastic change in the plant structure: the leaves lose their vertical orientation (Figure 5a(2),b(2)), this feature, which was already observed in a previous study [14], can be used for the retrieval of the sowing date. However, the number of days after sowing at which HH/VV crosses 0 dB may depend on other factors such as cultural practice (direct sowing or transplanting) and the incidence angle. In the study by Inoue et al., 2002 [37], HH/VV ratio around 0 dB can be reached around 10–20 days, with a dependence on the incidence angle by up to 10 days. As a consequence, the method should require recalibration to be transferred to other sites/data.
3.2.2. Methodology
4. Results and Discussions
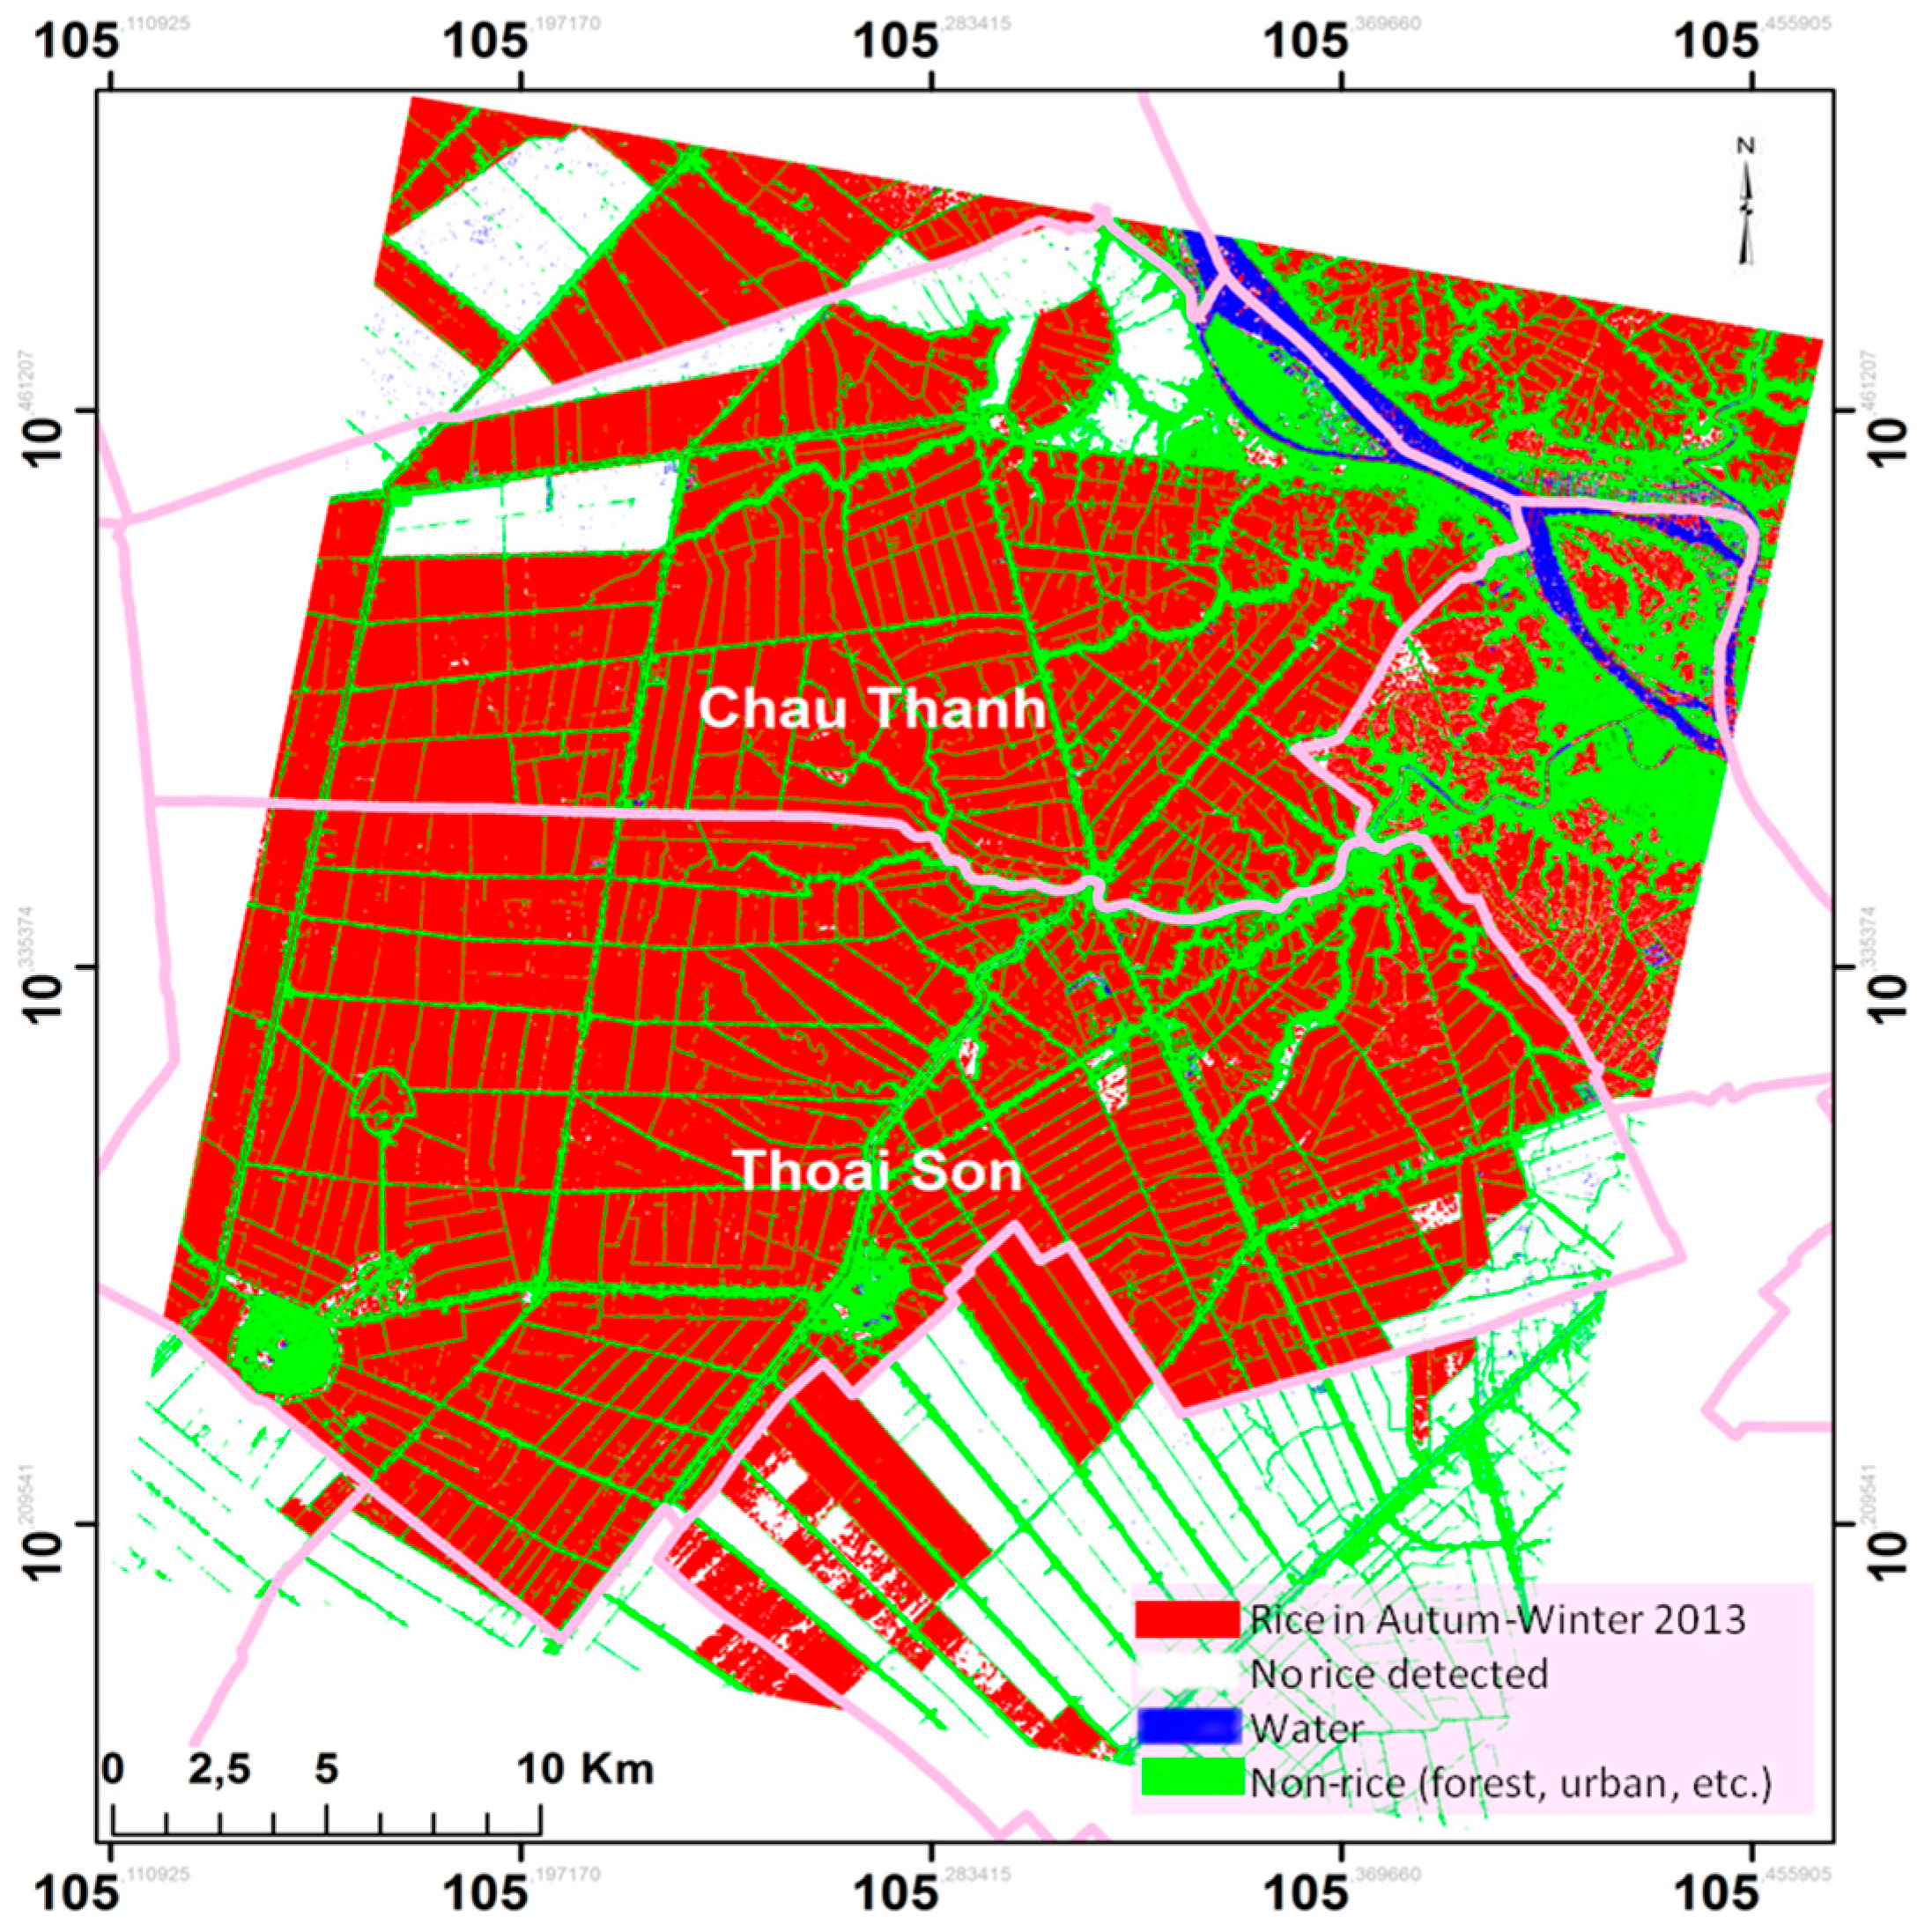
4.1. Rice Field Mapping
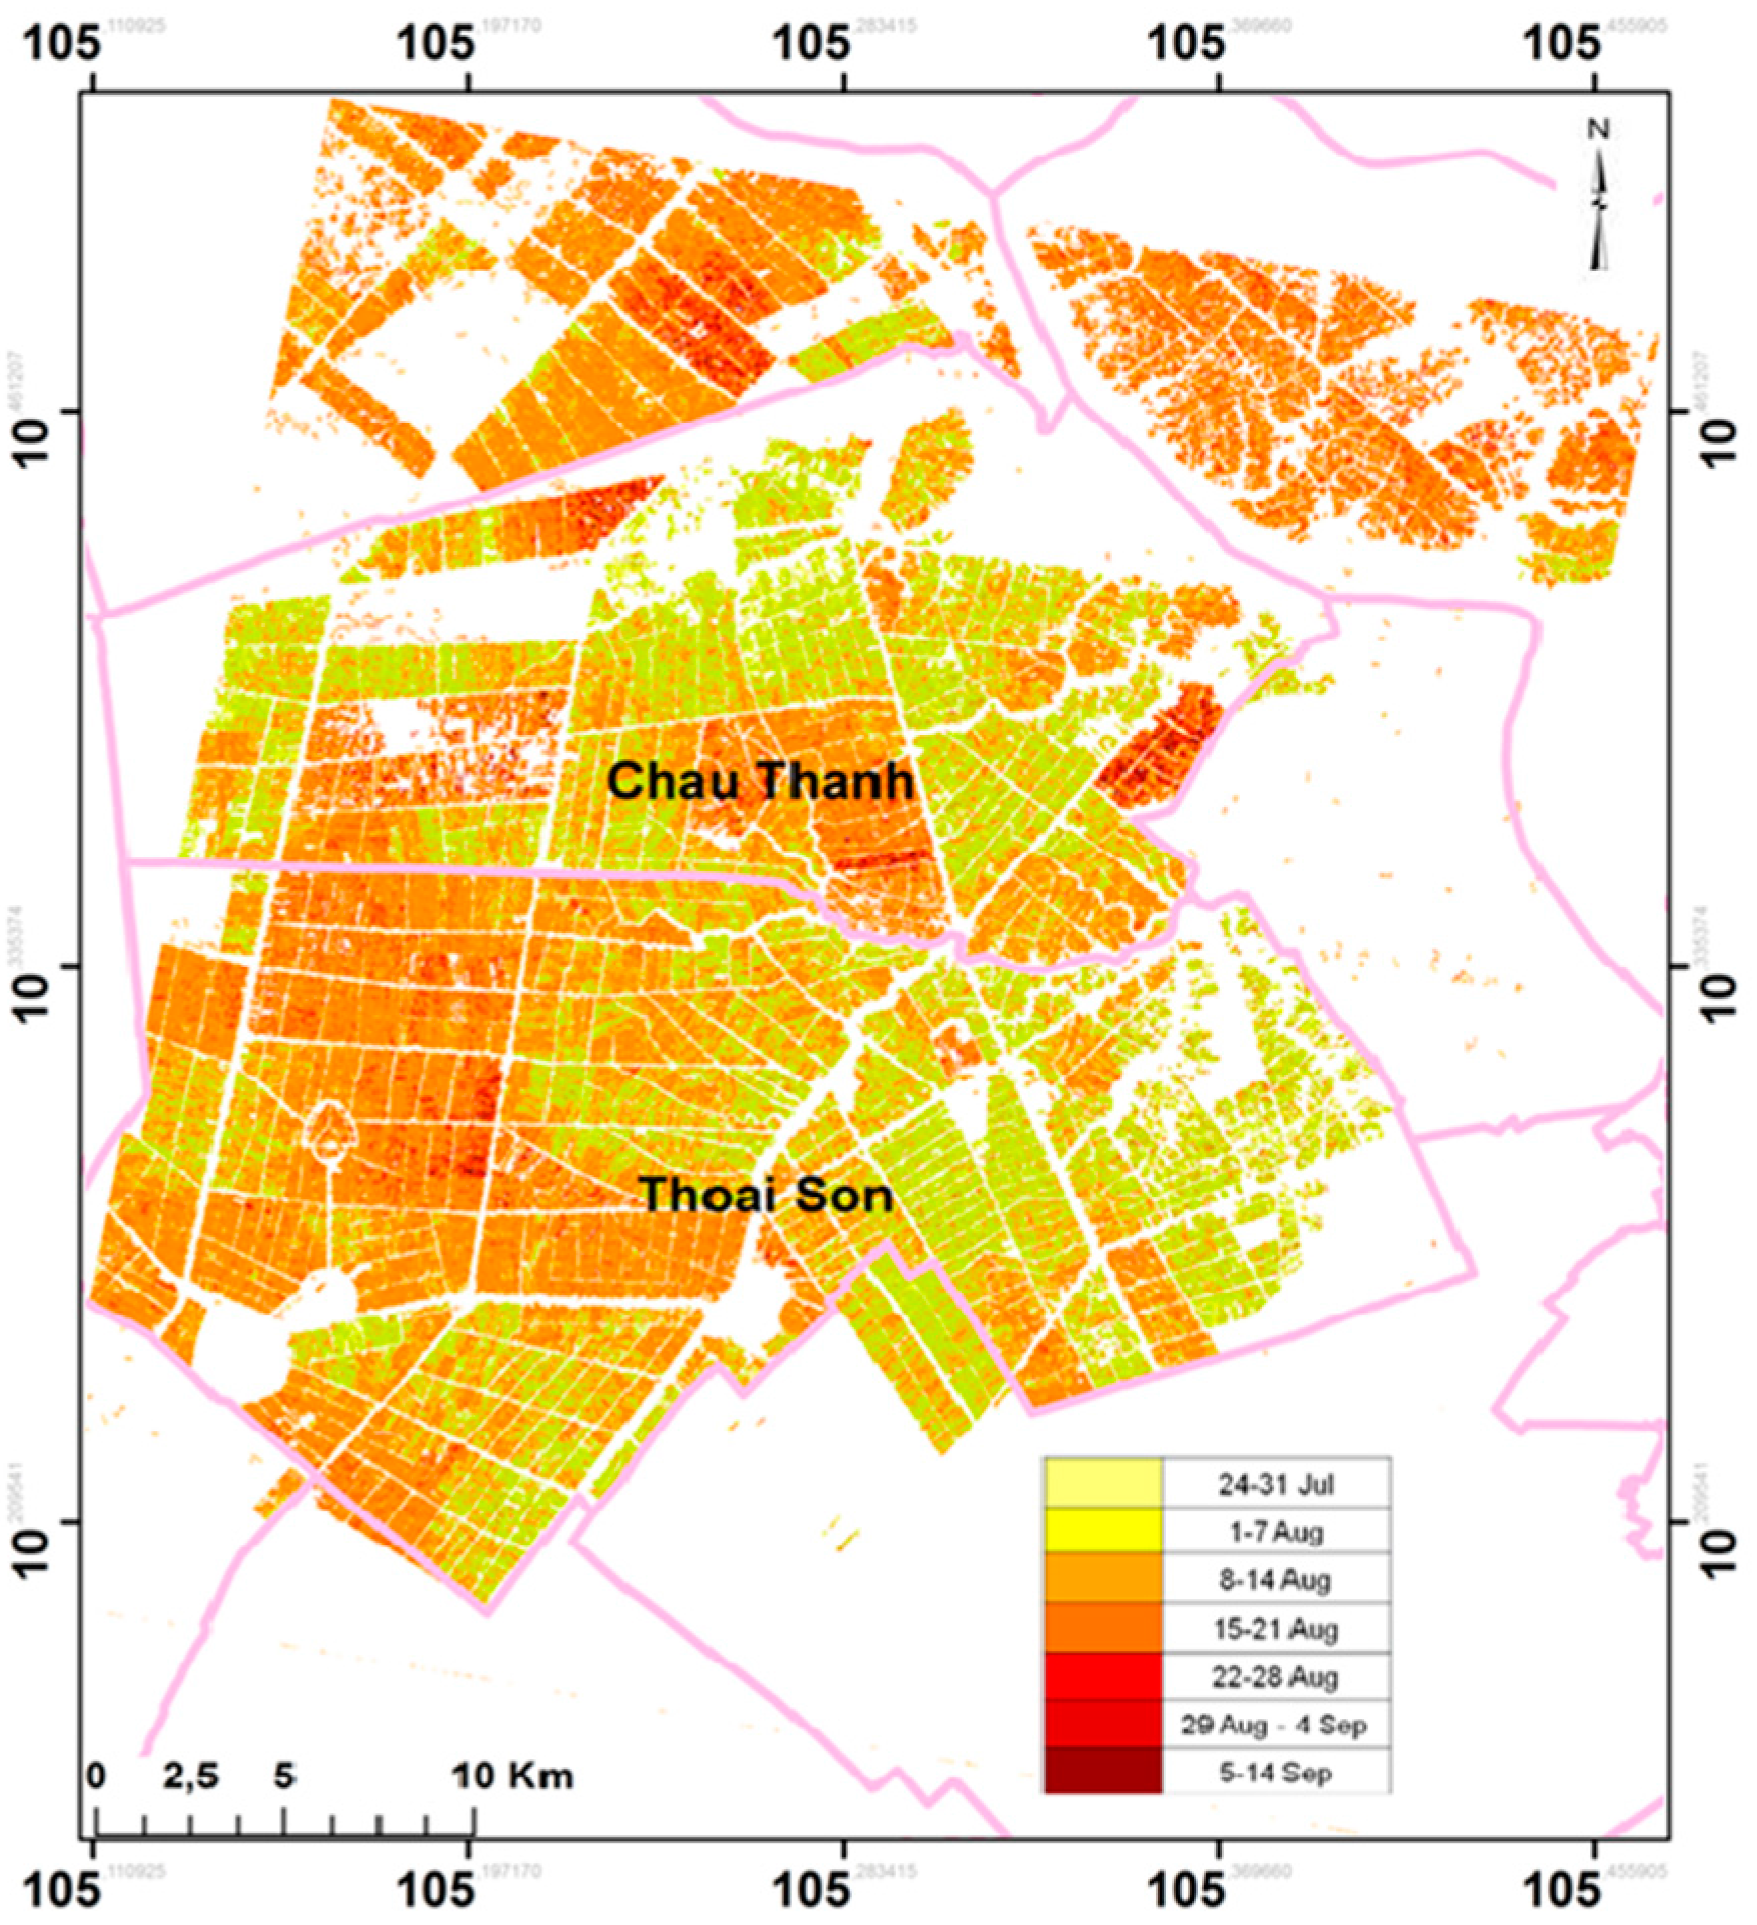
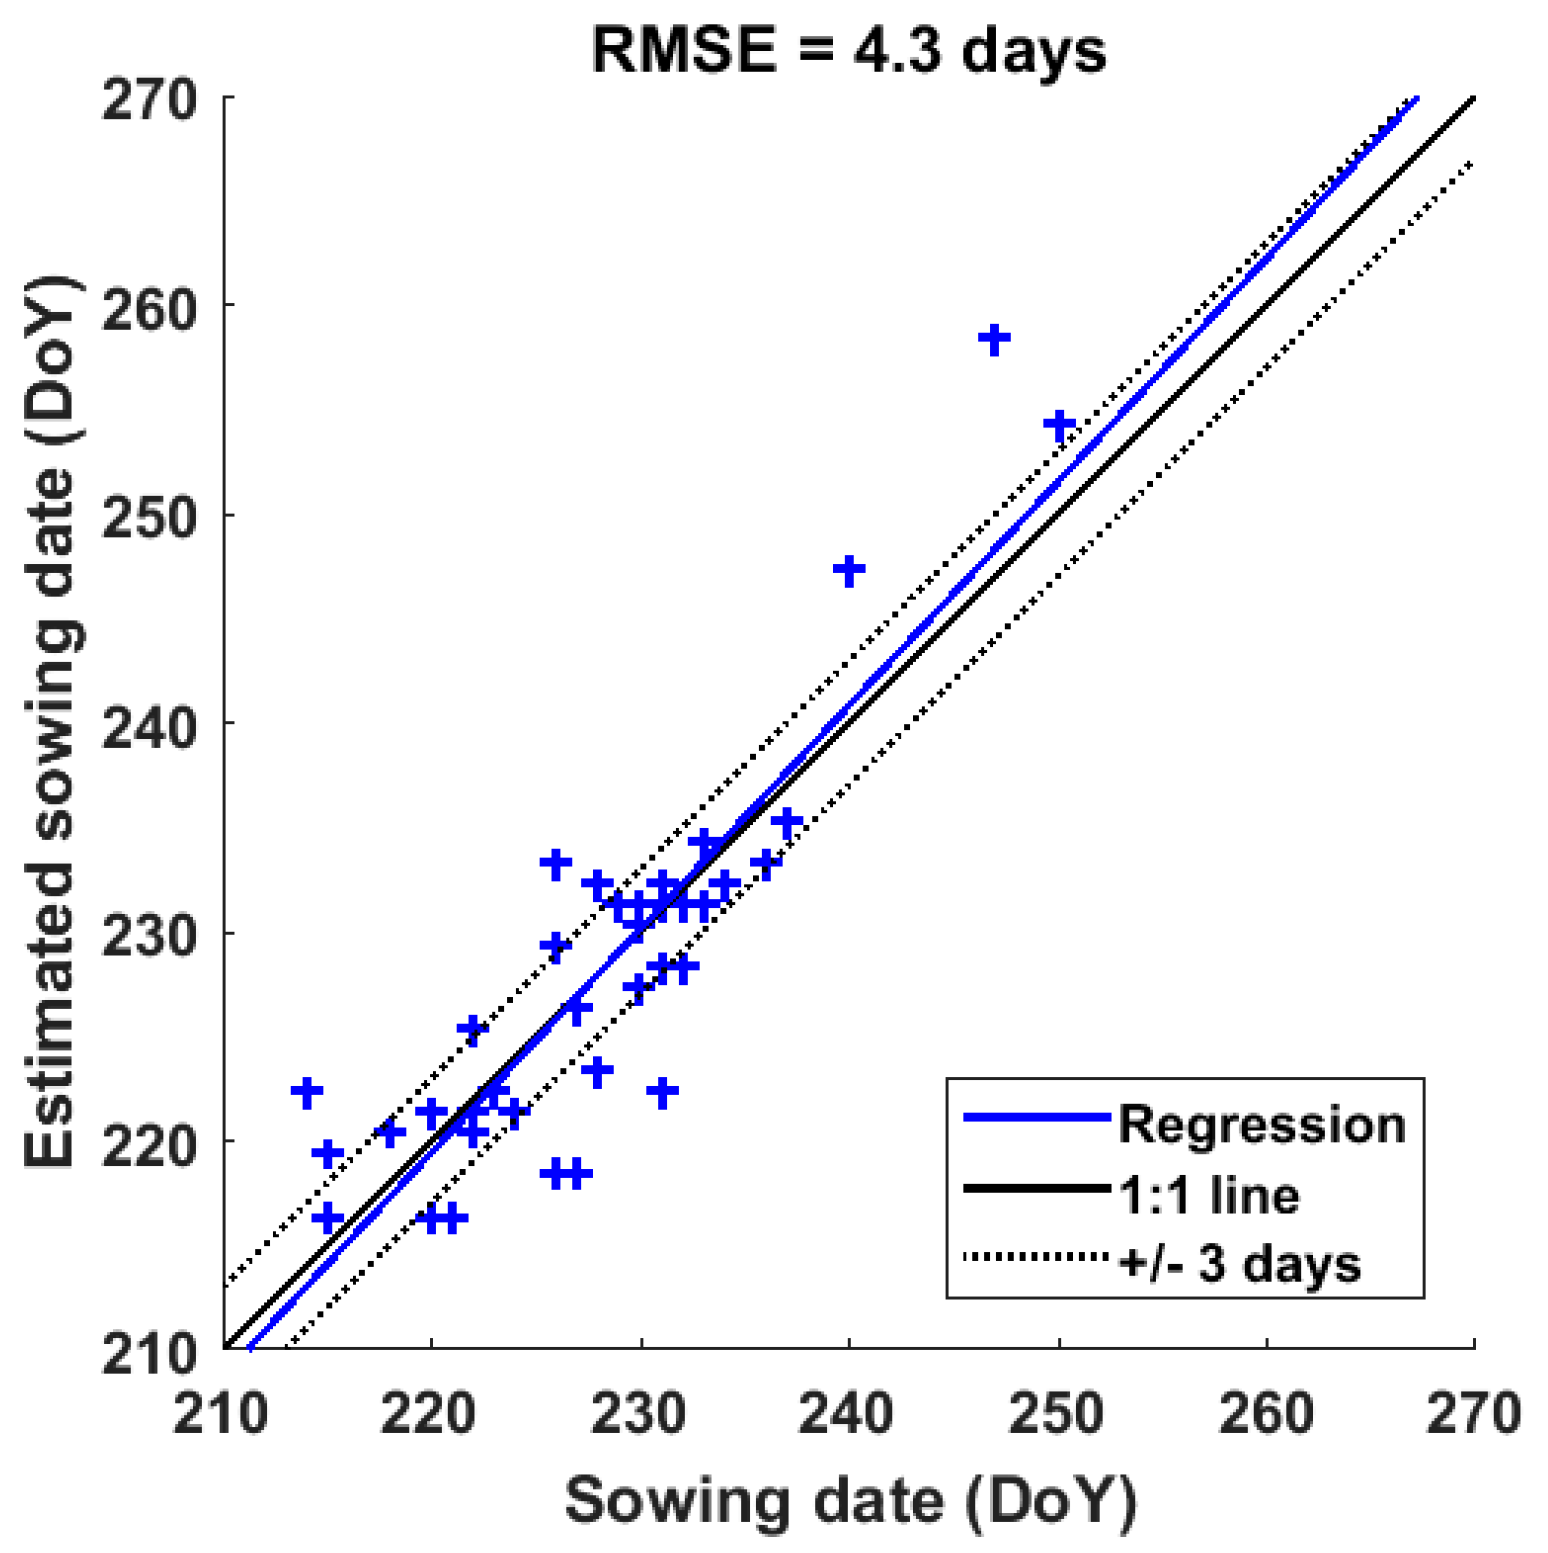
4.2. Sowing Date Mapping
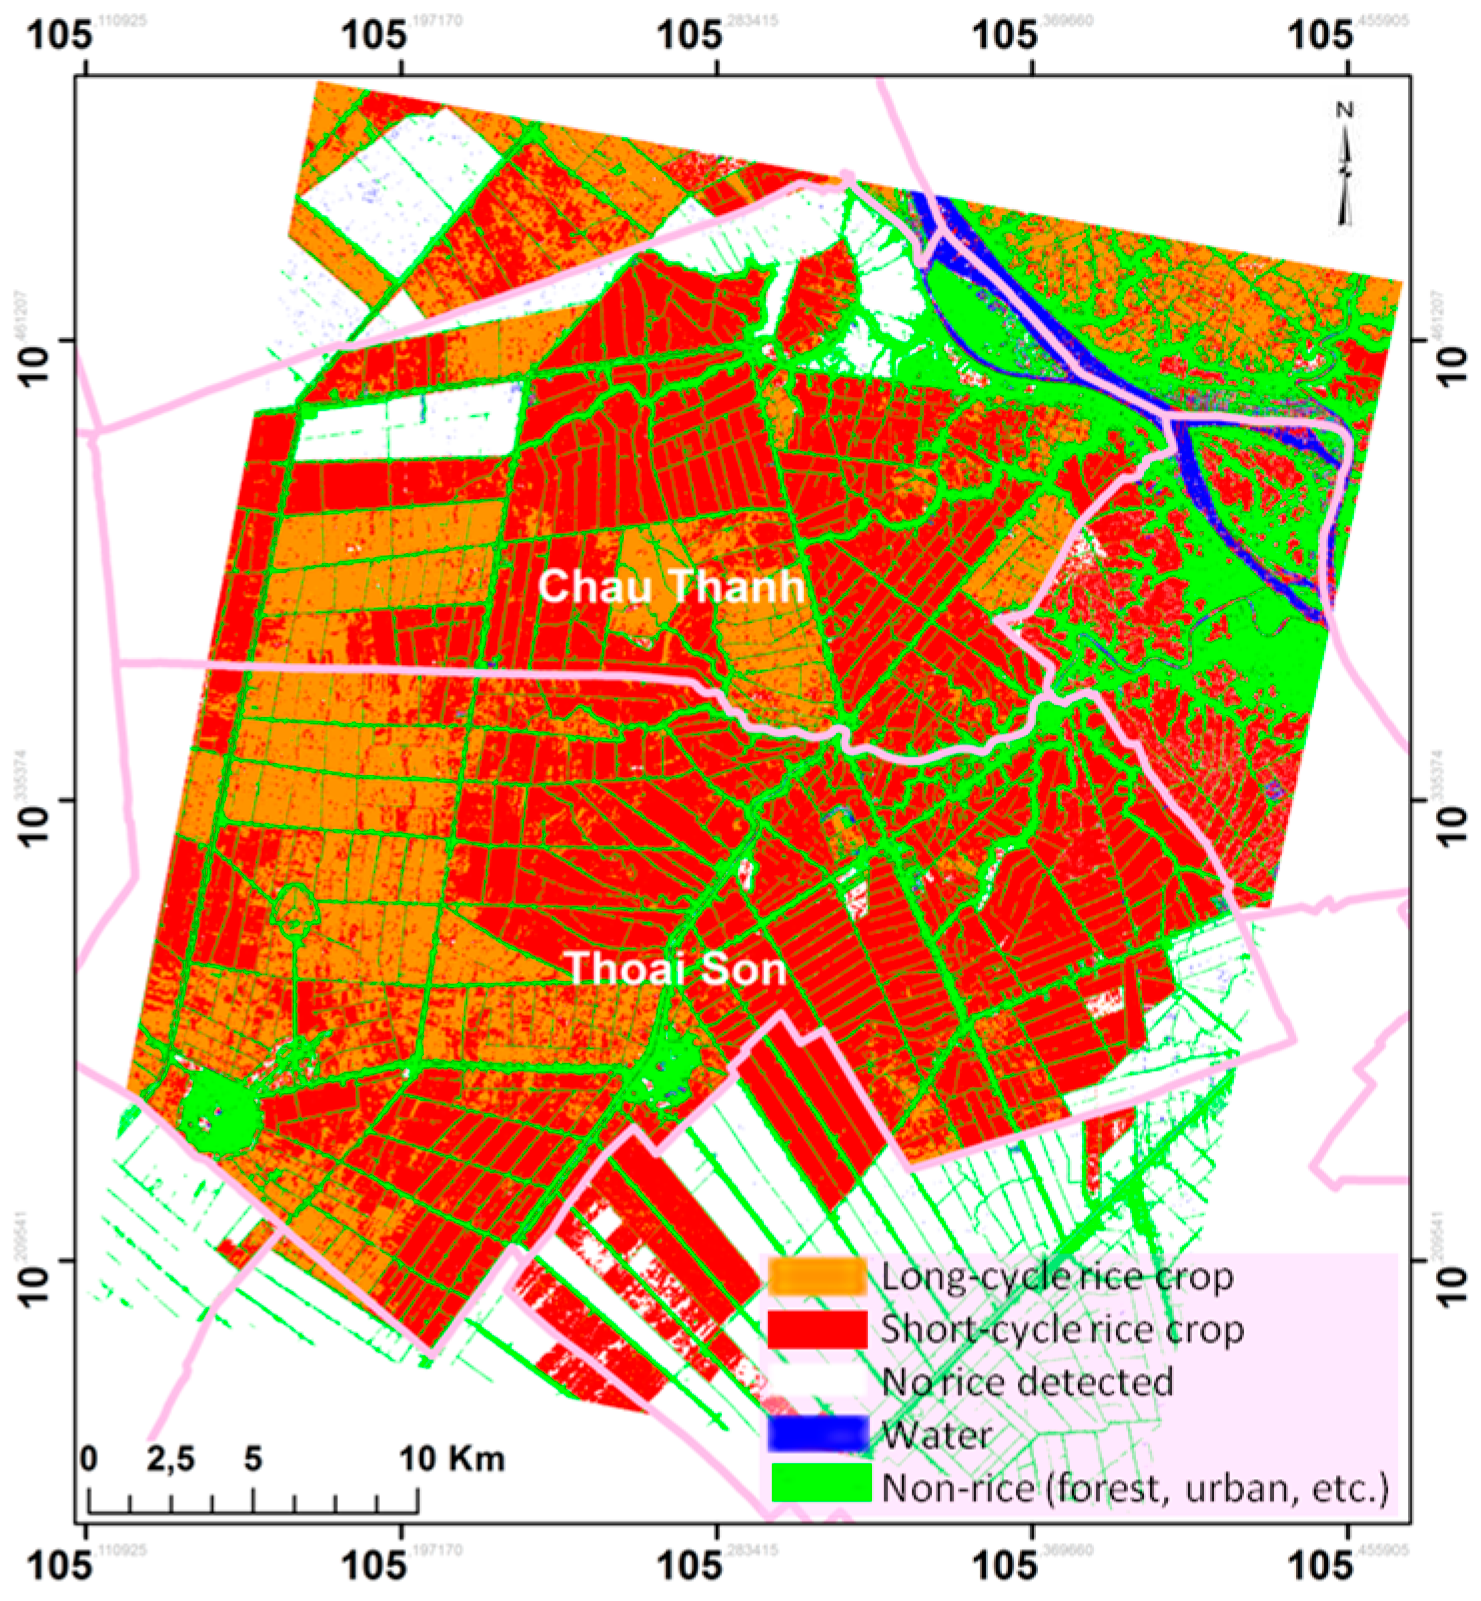
4.3. Long/Short Cycle Rice Mapping
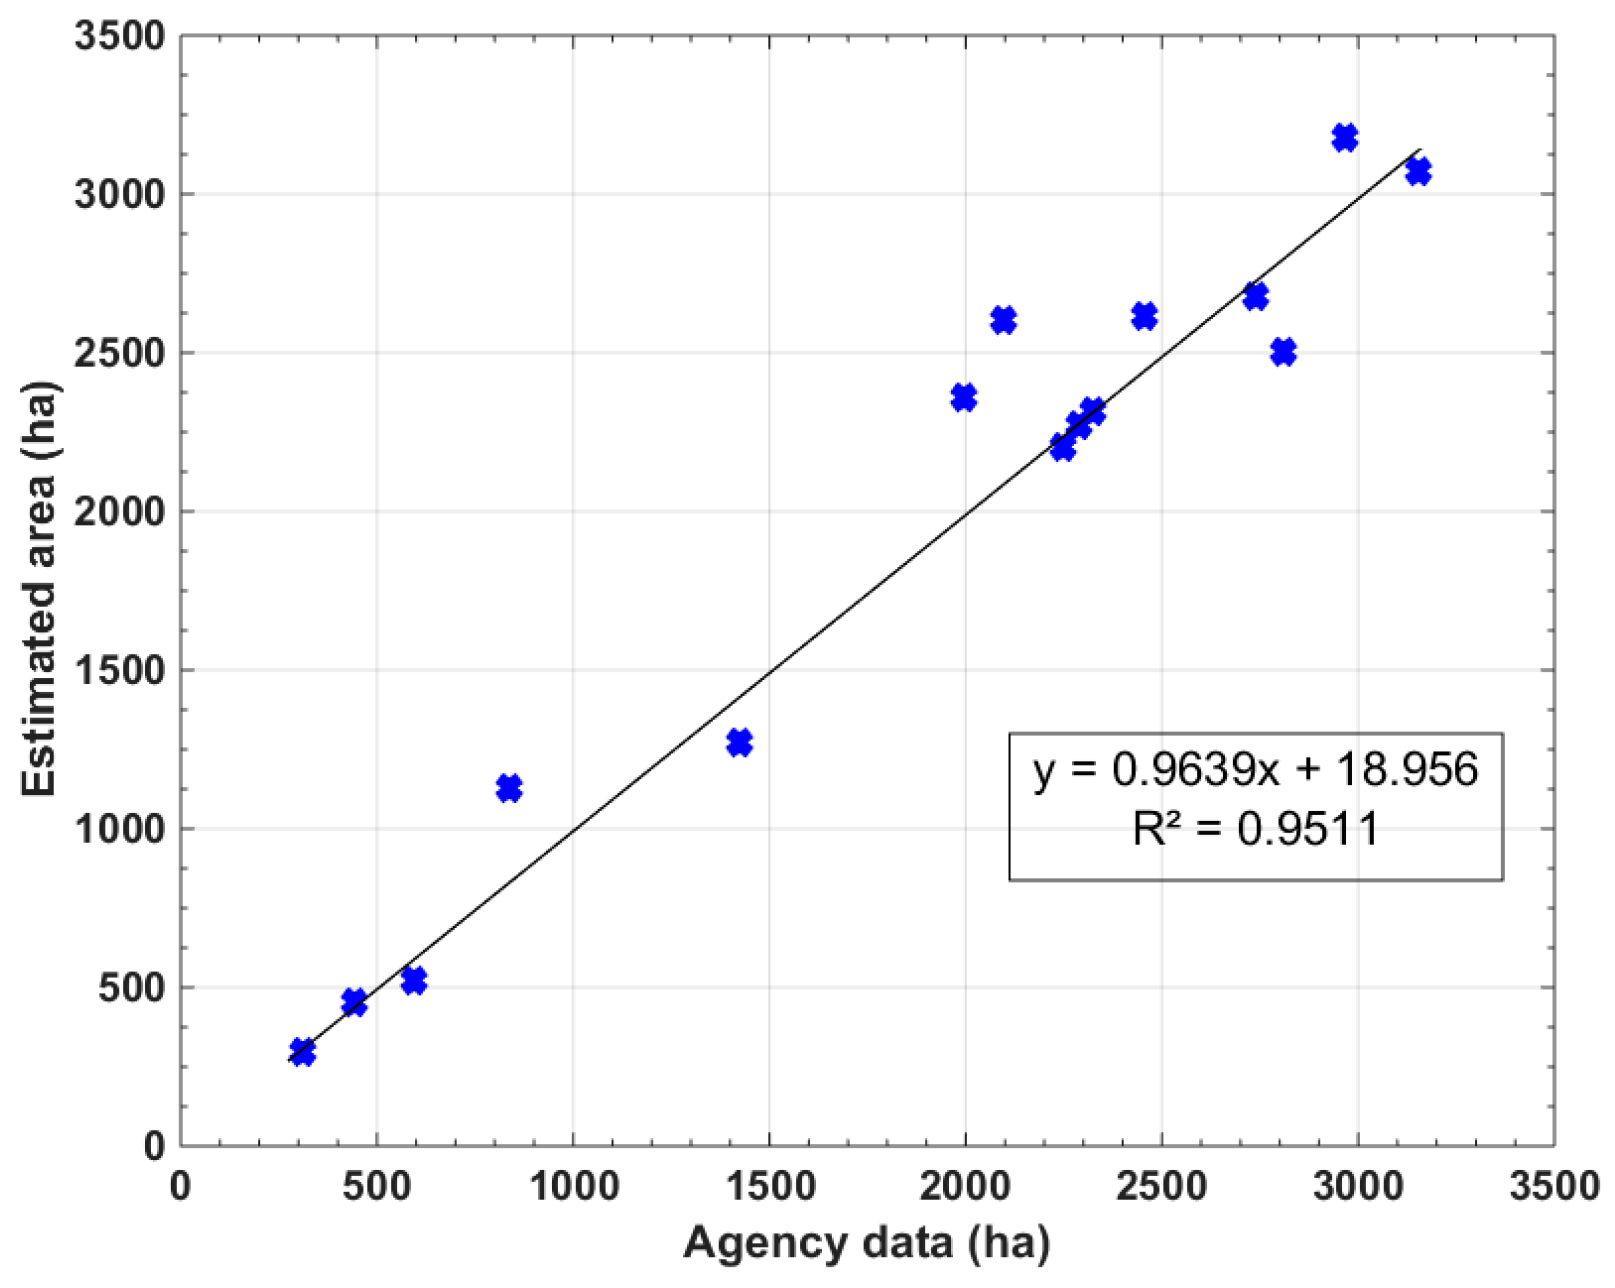
4.4. Accuracy Assessment
4.5. Discussions
5. Conclusions
- (1)
- As indicated by previous studies, the HH/VV ratio can be used for mapping of actual rice grown area after at least three satellite data acquisitions;
- (2)
- The polarization ratio HH/VV is close to 0 dB at the tillering stage (about 20 days) when the plant loses its vertical structure. The result was exploited to retrieve the sowing date. For this purpose, data need to be acquired with relatively short repeat cycle for interpolation of the backscatter temporal curve at the 0 dB crossing line. For a 12 day repeat cycle for example, the sowing date could be retrieved 1 month after the beginning of the season;
- (3)
- The differences in the value and the timing of the maximum of HH/VV ratio between the long-cycle and short-cycle rice after sowing are used to discriminate among the two varieties. Long-cycle rice ratio can reach maximum values of more than 10 dB at around 60 days after sowing, whereas it is less than 8 dB for the short-cycle rice at around 50 days after sowing. In addition, knowing the sowing dates and the rice varieties, the maturity phase and the harvest timing can be predicted;
Supplementary Materials
Acknowledgments
Author Contributions
Conflicts of Interest
References
- Rice Market Monitor. Available online: http://www.fao.org/3/a-i4147e.pdf (accessed on 2 November 2014).
- Mosleh, M.K.; Hassan, Q.K.; Chowdhury, E.H. Application of remote sensors in mapping rice area and forecasting its production: A review. Sensors 2015, 15, 769–791. [Google Scholar] [CrossRef] [PubMed]
- Kuenzer, C.; Knauer, K. Remote sensing of rice crop areas. Int. J. Remote Sens. 2013, 34, 2101–2139. [Google Scholar] [CrossRef]
- Le Toan, T.; Ribbes, F.; Wang, L.F.; Floury, N.; Ding, K.H.; Kong, J.A. Rice crop mapping and monitoring using ERS-1 data based on experiment and modeling results. IEEE Trans. Geosci. Remote Sens. 1997, 35, 41–56. [Google Scholar] [CrossRef]
- Ribbes, F.; Le Toan, T. Rice field mapping and monitoring with RADARSAT data. Int. J. Remote Sens. 1999, 20, 745–765. [Google Scholar] [CrossRef]
- Shao, Y.; Fan, X.; Liu, H.; Xiao, J.; Ross, S.; Brisco, B.; Brown, R.; Staples, G. Rice monitoring and production estimation using multitemporal RADARSAT. Remote Sens. Environ. 2001, 76, 310–325. [Google Scholar] [CrossRef]
- Bouvet, A.; Le Toan, T.; Dao, N.L. Monitoring of the Rice Cropping System in the Mekong Delta Using ENVISAT/ASAR Dual Polarisation Data. IEEE Trans. Geosci. Remote Sens. 2009, 47, 517–526. [Google Scholar] [CrossRef]
- Bouvet, A.; Le Toan, T. Use of ENVISAT/ASAR wide-swath data for timely rice fields mapping in the Mekong River Delta. Remote Sens. Environ. 2011, 115, 1090–1101. [Google Scholar] [CrossRef]
- Lam-Dao, N.; Le Toan, T.; Apan, A.; Bouvet, A.; Young, F.; Le-Van, T. Effects of changing cultural practices on C-band SAR backscatter using Envisat ASAR data in the Mekong River Delta. J. Appl. Remote Sens. 2009, 3, 33563. [Google Scholar]
- Torbick, N.; Chowdhury, D.; Salas, W.; Qi, J. Monitoring Rice Agriculture across Myanmar Using Time Series Sentinel-1 Assisted by Landsat-8 and PALSAR-2. Remote Sens. 2017, 9, 119. [Google Scholar] [CrossRef]
- Yuzugullu, O.; Marelli, S.; Erten, E.; Sudret, B.; Hajnsek, I. Determining Rice Growth Stage with X-Band SAR: A Metamodel Based Inversion. Remote Sens. 2017, 9, 460. [Google Scholar] [CrossRef]
- Lopez-Sanchez, M.J.; Vicente-Guijalba, F.; Erten, E.; Campos-Taberner, M.; Garcia-Haro, J.F. Retrieval of vegetation height in rice fields using polarimetric SAR interferometry with TanDEM-X data. Remote Sens. Environ. 2017, 192, 30–44. [Google Scholar] [CrossRef]
- Setiyono, D.T.; Holecz, F.; Khan, N.I.; Barbieri, M.; Quicho, E.; Collivignarelli, F.; Maunahan, A.; Gatti, L.; Romuga, G.C. Synthetic Aperture Radar (SAR)-based paddy rice monitoring system: Development and application in key rice producing areas in Tropical Asia. In IOP Conference Series: Earth and Environmental Science; IOP Publishing: Bristol, UK, 2017; Volume 54, p. 012015. [Google Scholar]
- Le Toan, T.; Laur, H.; Mougin, E.; Lopes, A. Multitemporal and dual-polarization observations of agricultural vegetation covers by X-band SAR images. IEEE Trans. Geosci. Remote Sens. 1989, 27, 709–718. [Google Scholar] [CrossRef]
- Bouman, B.A.M. Crop parameter estimation from ground-based x-band (3-cm wave) radar backscattering data. Remote Sens. Environ. 1991, 37, 193–205. [Google Scholar] [CrossRef]
- Lopez-Sanchez, J.M.; Cloude, S.R.; Ballester-Berman, J.D. Rice phenology monitoring by means of SAR polarimetry at X-band. IEEE Trans. Geosci. Remote Sens. 2012, 50, 2695–2709. [Google Scholar] [CrossRef]
- Lopez-Sanchez, M.J.; Ballester-Berman, D.J.; Hajnsek, I. First results of rice monitoring practices in Spain by means of time series of TerraSAR-X dual-pol images. IEEE J. Sel. Top. Appl. Earth Obs. Remote Sens. 2011, 4, 412–422. [Google Scholar] [CrossRef]
- Nelson, A.; Setiyono, T.; Rala, A.B.; Quicho, E.D.; Raviz, J.V.; Abonete, P.J.; Maunahan, A.A.; Carcia, C.A.; Bhatti, H.Z.M.; Villano, L.S.; et al. Towards an operational SAR-based rice monitoring system in Asia: Examples from 13 demonstration sites across Asia in the RIICE project. Remote Sens. 2014, 6, 10773–10812. [Google Scholar] [CrossRef]
- Corcione, V.; Nunziata, F.; Mascolo, L.; Migliaccio, M. A study of the use of COSMO-SkyMed SAR PingPong polarimetric mode for rice growth monitoring. Int. J. Remote Sens. 2016, 37, 633–647. [Google Scholar] [CrossRef]
- Inoue, Y.; Sakaiya, E.; Wang, C. Capability of C-band backscattering coefficients from high-resolution satellite SAR sensors to assess biophysical variables in paddy rice. Remote Sens. Environ. 2014, 140, 257–266. [Google Scholar] [CrossRef]
- Nguyen, D.; Clauss, K.; Cao, S.; Naeimi, V.; Kuenzer, C.; Wagner, W. Mapping Rice Seasonality in the Mekong Delta with Multi-Year Envisat ASAR WSM Data. Remote Sens. 2015, 7, 15868–15893. [Google Scholar] [CrossRef]
- Liew, S.C.; Kam, S.-P.; Tuong, T.-P.; Chen, P.; Minh, V.Q.; Lim, H. Application of multitemporal ERS-2 synthetic aperture radar in delineating rice cropping systems in the Mekong River Delta, Vietnam. IEEE Trans. Geosci. Remote Sens. 1998, 36, 1412–1420. [Google Scholar] [CrossRef]
- Kurosu, T.; Fujita, M.; Chiba, K. The identification of rice fields using multi-temporal ERS-1 C band SAR data. Int. J. Remote Sens. 1997, 18, 2953–2965. [Google Scholar] [CrossRef]
- Inoue, Y.; Sakaiya, E.; Wang, C. Potential of X-band images from high-resolution satellite SAR sensors to assess growth and yield in paddy rice. Remote Sens. 2014, 6, 5995–6019. [Google Scholar] [CrossRef]
- General Statistics Office of Viet Nam. Available online: https://www.gso.gov.vn/ (accessed on 29 December 2016).
- An Giang Department of Agriculture and Rural Development. Available online: http://www.angiang.gov.vn/wps/portal/ (accessed on 29 December 2016).
- Ho Chi Minh City Food Joint Stock Company. Available online: http://www.foodcosa.vn/index.php/vi/tin-noi-bo-01/239-t-ng-h-p-th-tru-ng-lua-g-o-ngay-23–03 (accessed on 10 January 2017).
- Erten, E.; Lopez-Sanchez, J.M.; Yuzugullu, O.; Hajnsek, I. Retrieval of agricultural crop height from space: A comparison of SAR techniques. Remote Sens. Environ. 2017, 187, 130–144. [Google Scholar] [CrossRef]
- Rignot, E.J.M.; van Zyl, J.J. Change detection techniques for ERS-1 SAR data. IEEE Trans. Geosci. Remote Sens. 1993, 31, 896–906. [Google Scholar] [CrossRef]
- Bruniquel, J.; Lopes, A. Multi-variate optimal speckle reduction in SAR imagery. Int. J. Remote Sens. 1997, 18, 603–627. [Google Scholar] [CrossRef]
- Quegan, S.; Yu, J.J. Filtering of multichannel SAR images. IEEE Trans. Geosci. Remote Sens. 2001, 39, 2373–2379. [Google Scholar] [CrossRef]
- Lin, Y.-C.; Sarabandi, K. Electromagnetic scattering model for a tree trunk above a tilted ground plane. IEEE Trans. Geosci. Remote Sens. 1995, 33, 1063–1070. [Google Scholar]
- Lopez-Sanchez, J.M.; Ballester-Berman, J.D.; Paya, S.; Cazcarra, V.; Navarro, V.D. An advanced electromagnetic model for rice fields at X-band: Development and interpretation of dual-pol TerraSAR-X images. In Proceedings of the 8th European Conference on Synthetic Aperture Radar (EUSAR), Aachen, Germany, 7–10 June 2010; pp. 754–757. [Google Scholar]
- Xiao, X.; Boles, S.; Frolking, S.; Li, C.; Babu, J.Y.; Salas, W.; Moore, B., III. Mapping paddy rice agriculture in South and Southeast Asia using multi-temporal MODIS images. Remote Sens. Environ. 2006, 100, 95–113. [Google Scholar] [CrossRef]
- De Bernardis, C.; Vicente-Guijalba, F.; Martinez-Marin, T.; Lopez-Sanchez, J.M. Contribution to real-time estimation of crop phenological states in a dynamical framework based on NDVI time series: Data fusion with SAR and temperature. IEEE J. Sel. Top. Appl. Earth Obs. Remote Sens. 2016, 9, 3512–3523. [Google Scholar] [CrossRef]
- Guan, X.; Huang, C.; Liu, G.; Meng, X.; Liu, Q. Mapping rice cropping systems in Vietnam using an NDVI-based time-series similarity measurement based on DTW distance. Remote Sens. 2016, 8, 19. [Google Scholar] [CrossRef]
- Inoue, Y.; Kurosu, T.; Maeno, H.; Uratsuka, S.; Kozu, T.; Dabrowska-Zielinska, K.; Qi, J. Season-long daily measurements of multifrequency (Ka, Ku, X, C, and L) and full-polarization backscatter signatures over paddy rice field and their relationship with biological variables. Remote Sens. Environ. 2002, 81, 194–204. [Google Scholar] [CrossRef]
- Bouvet, A.; le Toan, T.; Floury, N.; Macklin, T. An end-to-end error model for classification methods based on temporal change or polarization ratio of SAR intensities. IEEE Trans. Geosci. Remote Sens. 2010, 48, 3521–3538. [Google Scholar] [CrossRef]
- Boschetti, M.; Stroppiana, D.; Brivio, P.A.; Bocchi, S. Multi-year monitoring of rice crop phenology through time series analysis of MODIS images. Int. J. Remote Sens. 2009, 30, 4643–4662. [Google Scholar] [CrossRef]
- De Bernardis, C.G.; Vicente-Guijalba, F.; Martinez-Marin, T.; Lopez-Sanchez, J.M. Particle Filter Approach for Real-Time Estimation of Crop Phenological States Using Time Series of NDVI Images. Remote Sens. 2016, 8, 610. [Google Scholar] [CrossRef]
- De Bernardis, C.G.; Vicente-Guijalba, F.; Martinez-Marin, T.; Lopez-Sanchez, J.M. Estimation of Key Dates and Stages in Rice Crops using Dual-Polarisation SAR Time Series and a Particle Filtering Approach. IEEE J. Sel. Top. Appl. Earth Obs. Remote Sens. 2015, 8, 1008–1018. [Google Scholar]
- Olofsson, P.; Foody, M.G.; Herold, M.; Stehman, V.S.; Woodcock, E.C.; Wulder, A.M. Good practices for estimating area and assessing accuracy of land change. Remote Sens. Environ. 2014, 148, 42–57. [Google Scholar] [CrossRef]


| Rice crop season | Sowing/Transpanting | Harvest |
|---|---|---|
| Winter-Spring | Nov-Dec | Mar-Apr |
| Summer-Autumn | Apr-May | Jul-Aug |
| Autumn-Winter | Jul-Sep | Oct-Dec |
| Rainy season | Jul-Sep | Nov-Jan |
| General Parameters | Plant Height (cm) | |||||||||
|---|---|---|---|---|---|---|---|---|---|---|
| Plot | Sowing D. | Harvest D. | Variety | 20130830 | 20130904 | 20130913 | 20130926 | 20131006 | 20131017 | 20131028 |
| 1 | 20130816 | 20131110 | 50404 | 15.21 | 29.7 | 45.6 | 48.3 | 54.2 | 71.8 | 64.6 |
| 2 | 20130808 | 20131106 | 50404 | 18.0 | 33.0 | 43.0 | 54.24 | 58.8 | 68.4 | 65 |
| 3 | 20130811 | 20131107 | 50404 | 21.66 | 45.0 | 44.56 | 48.72 | 62.2 | 75.6 | 69.4 |
| Plot | Sowing Date | Harvest Date | Plot | Sowing Date | Harvest Date |
|---|---|---|---|---|---|
| 1 | 20130816 | 20131110 | 21 | 20130820 | 20131128 |
| 2 | 20130808 | 20131106 | 22 | 20130907 | 20131217 |
| 3 | 20130811 | 20131107 | 23 | 20130814 | 20131110 |
| 4 | 20130819 | 20131113 | 24 | 20130819 | 20131113 |
| 5 | 20130815 | 20131112 | 25 | 20130822 | 20131120 |
| 6 | 20130814 | 20131109 | 26 | 20130821 | 20131116 |
| 7 | 20130802 | 20131106 | 27 | 20130824 | 20131118 |
| 8 | 20130825 | 20131207 | 28 | 20130810 | 20131114 |
| 9 | 20130810 | 20131108 | 29 | 20130806 | 20131111 |
| 10 | 20130818 | 20131128 | 30 | 20130814 | 20131120 |
| 11 | 20130828 | 20131130 | 31 | 20130816 | 20131121 |
| 12 | 20130803 | 20131110 | 32 | 20130810 | 20131116 |
| 13 | 20130904 | 20131217 | 33 | 20130812 | 20131113 |
| 14 | 20130825 | 20131117 | 34 | 20130808 | 20131119 |
| 15 | 20130821 | 20131116 | 35 | 20130808 | 20131110 |
| 16 | 20130817 | 20131118 | 36 | 20130809 | 20131112 |
| 17 | 20130819 | 20131126 | 37 | 20130815 | 20131124 |
| 18 | 20130818 | 20131128 | 38 | 20130803 | 20131102 |
| 19 | 20130820 | 20131113 | 39 | 20130818 | 20131108 |
| 20 | 20130819 | 20131128 | 40 | 20130815 | 20131108 |
| Commune Name | An Binh | Binh Thanh | Dinh My | Dinh Thanh | My Phu Dong | Phu Thuan | Thoai Giang | Nui Sap | Oc Eo | Phu Hoa | Vinh Khanh | Vinh Phu | Vinh Trach | Vinh Chanh | Vong Dong |
|---|---|---|---|---|---|---|---|---|---|---|---|---|---|---|---|
| Estimated area (ha) | 2274 | 2313 | 3178 | 2613 | 2676 | 1131 | 2203 | 455 | 522 | 294 | 2500 | 3069 | 1269 | 2357 | 2601 |
| Agency area (ha) | 2287 | 2325 | 2965 | 2454 | 2740 | 835 | 2248 | 442 | 592 | 310 | 2810 | 3153 | 1424 | 1996 | 2096 |
| Percentage error (%) | −0.55 | −0.52 | 6.70 | 6.09 | −2.39 | 26.19 | −2.03 | 2.82 | −13.5 | −5.5 | −12.39 | −2.73 | −12.19 | 15.31 | 19.42 |
© 2018 by the authors. Licensee MDPI, Basel, Switzerland. This article is an open access article distributed under the terms and conditions of the Creative Commons Attribution (CC BY) license (http://creativecommons.org/licenses/by/4.0/).
Share and Cite
Phan, H.; Le Toan, T.; Bouvet, A.; Nguyen, L.D.; Pham Duy, T.; Zribi, M. Mapping of Rice Varieties and Sowing Date Using X-Band SAR Data. Sensors 2018, 18, 316. https://doi.org/10.3390/s18010316
Phan H, Le Toan T, Bouvet A, Nguyen LD, Pham Duy T, Zribi M. Mapping of Rice Varieties and Sowing Date Using X-Band SAR Data. Sensors. 2018; 18(1):316. https://doi.org/10.3390/s18010316
Chicago/Turabian StylePhan, Hoa, Thuy Le Toan, Alexandre Bouvet, Lam Dao Nguyen, Tien Pham Duy, and Mehrez Zribi. 2018. "Mapping of Rice Varieties and Sowing Date Using X-Band SAR Data" Sensors 18, no. 1: 316. https://doi.org/10.3390/s18010316
APA StylePhan, H., Le Toan, T., Bouvet, A., Nguyen, L. D., Pham Duy, T., & Zribi, M. (2018). Mapping of Rice Varieties and Sowing Date Using X-Band SAR Data. Sensors, 18(1), 316. https://doi.org/10.3390/s18010316