Development of Optical Fiber Based Measurement System for the Verification of Entrance Dose Map in Pencil Beam Scanning Proton Beam

Abstract
:1. Introduction
2. Materials and Methods
2.1. System Configuration
2.2. PBS Beam Measurement
2.3. Comparison Methods
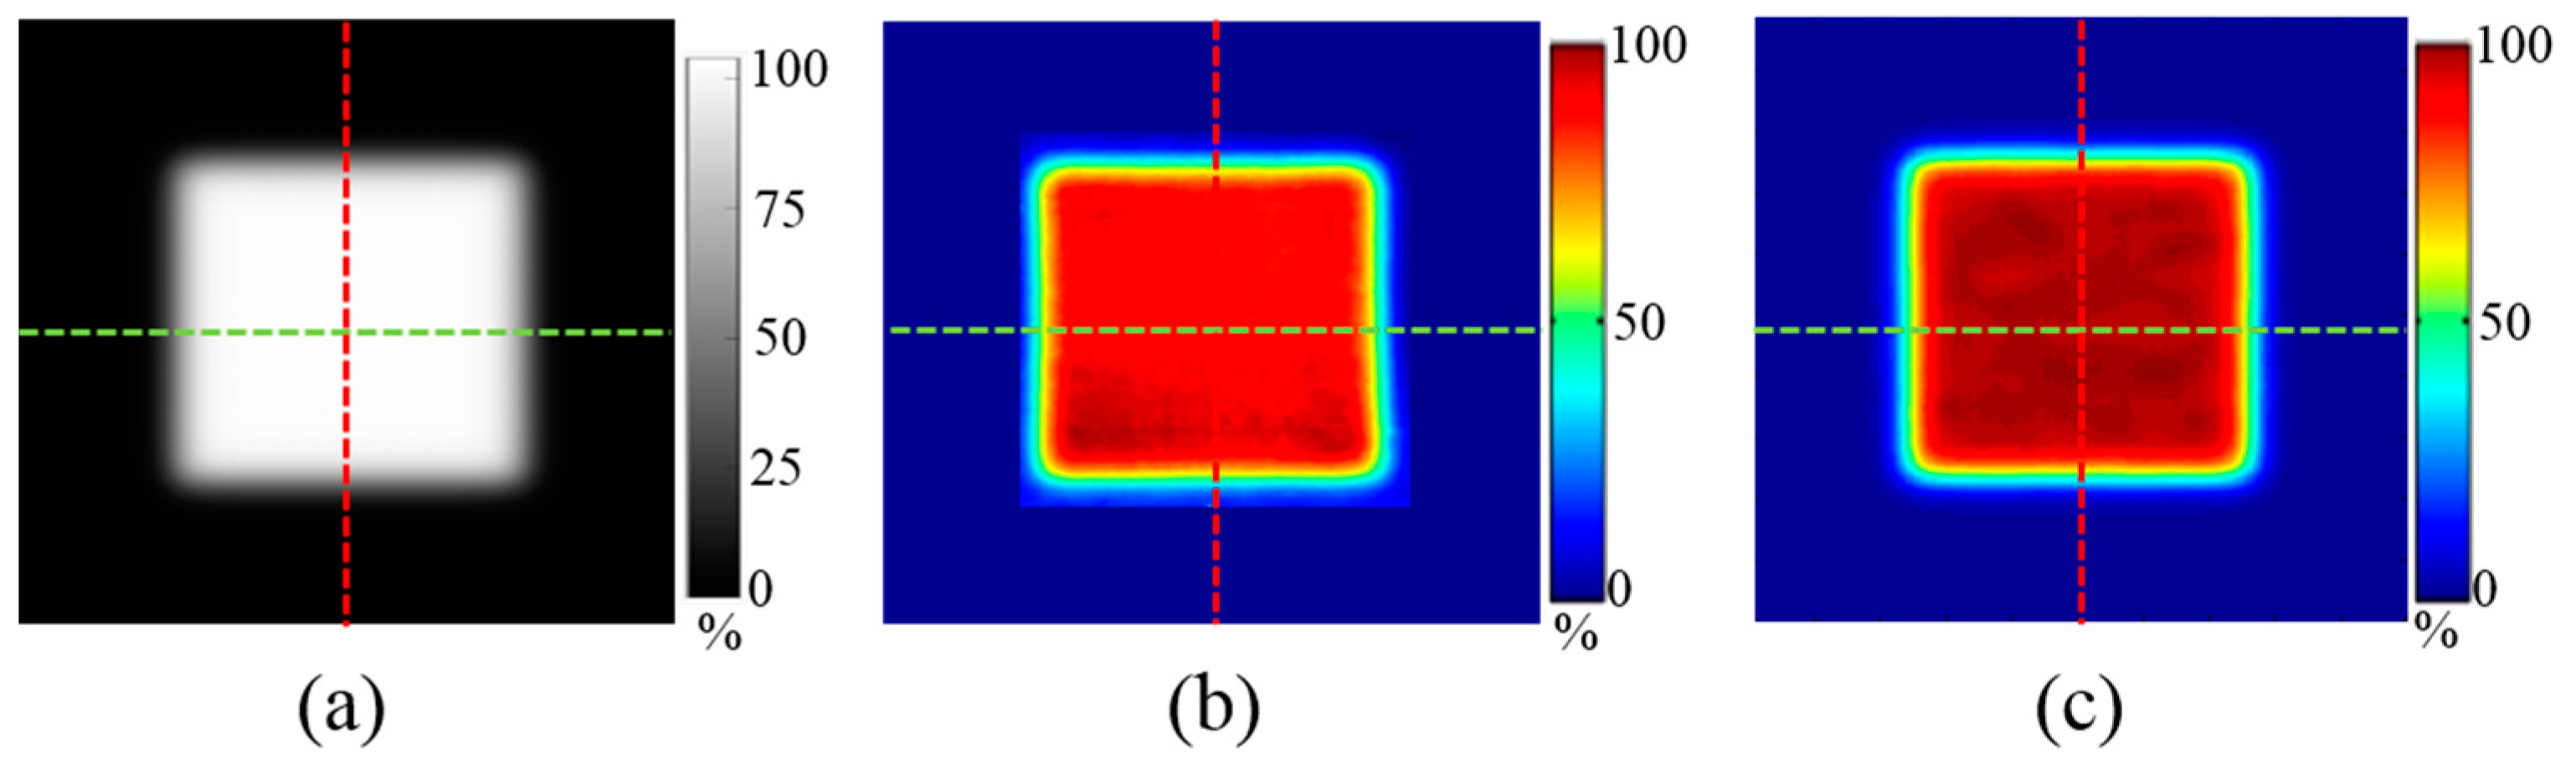
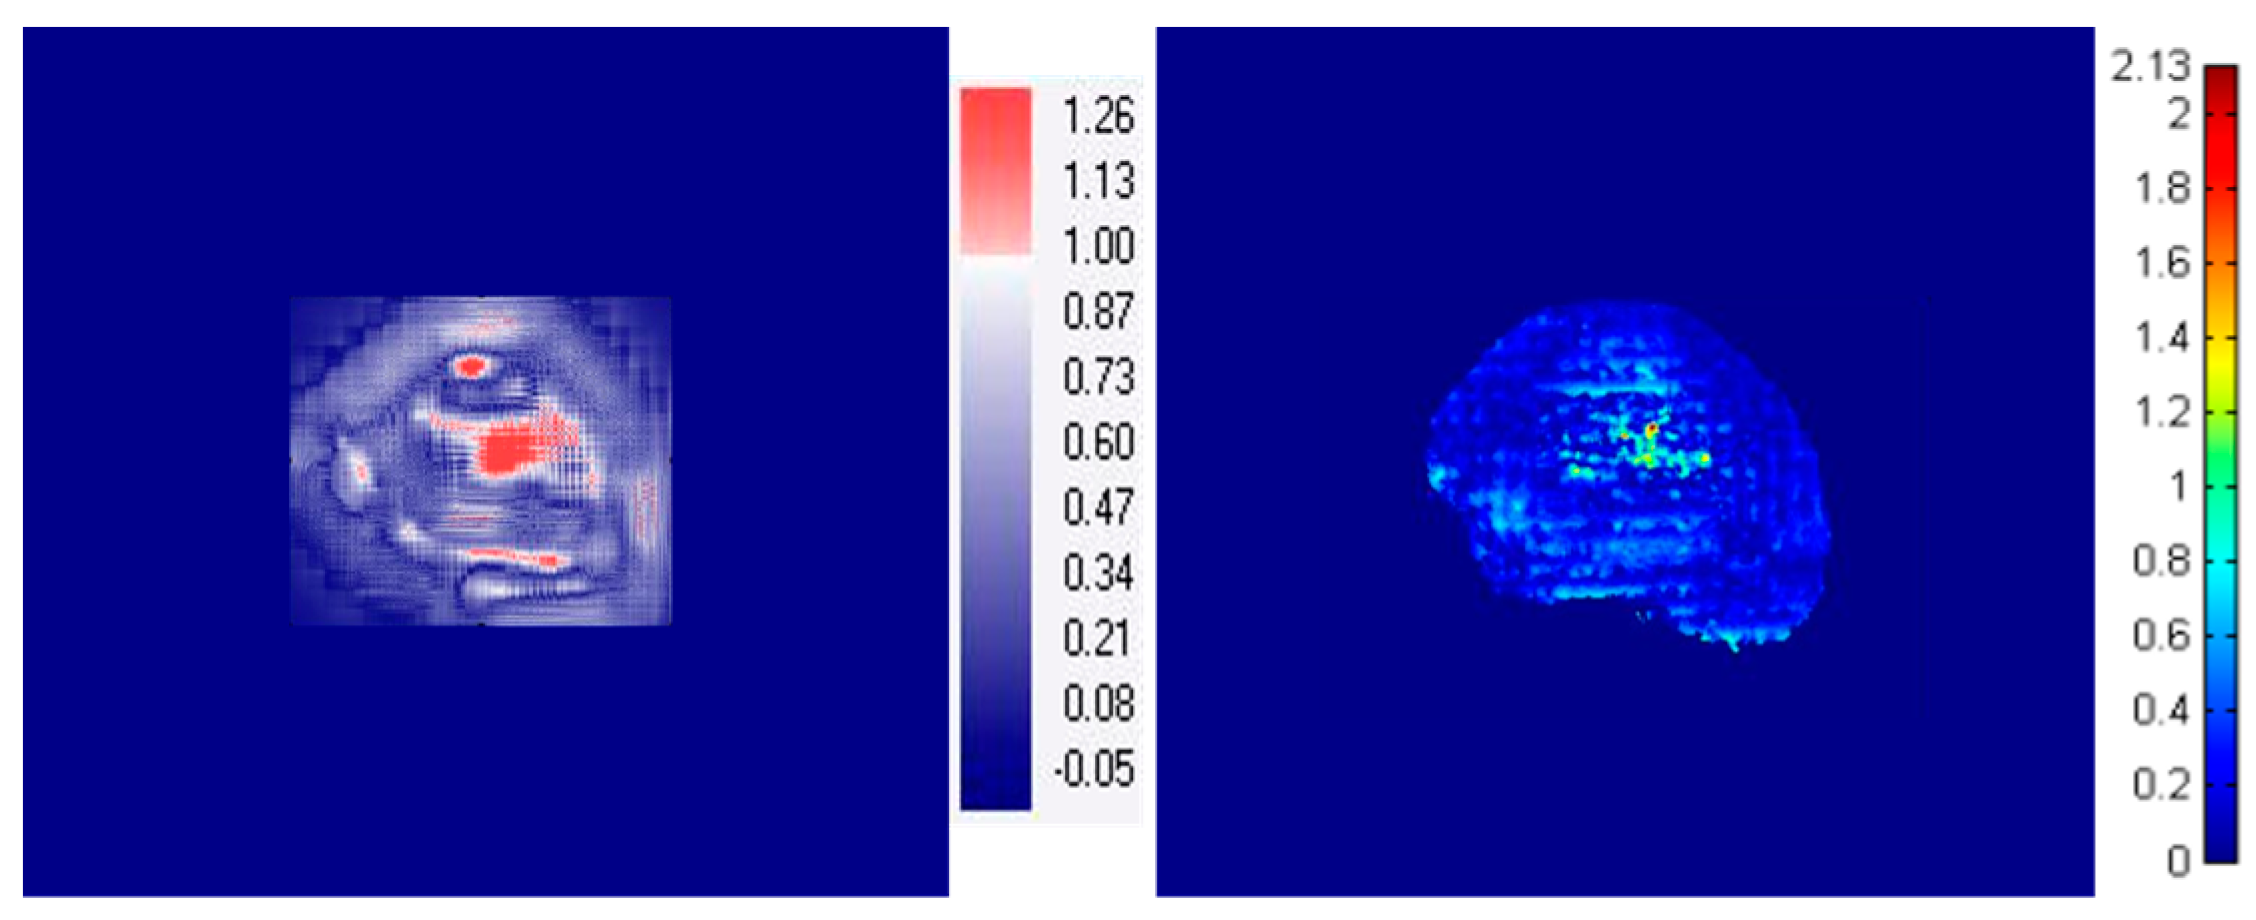
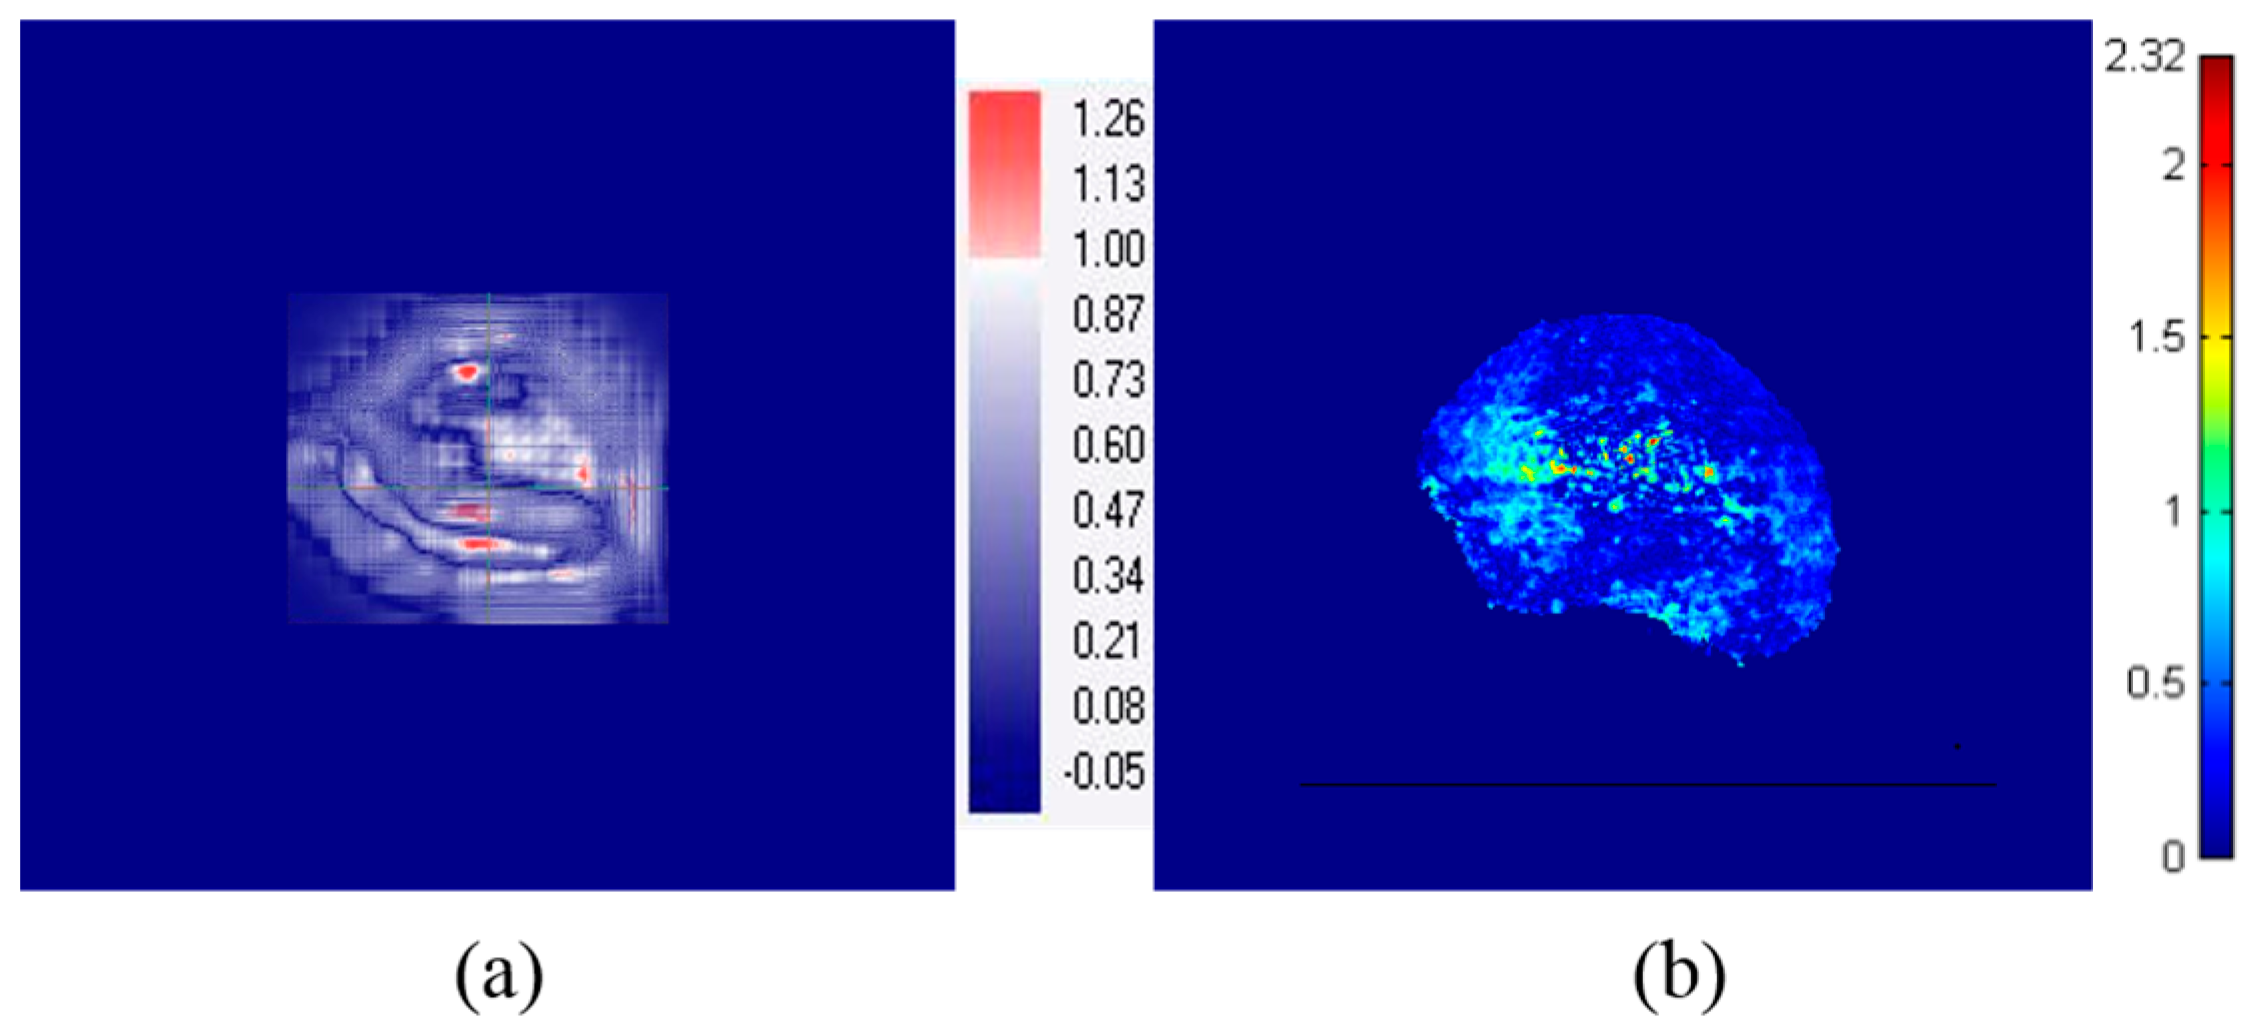
3. Results
4. Discussion
5. Conclusions
Acknowledgments
Author Contributions
Conflicts of Interest
References
- Langer, M.; Leong, J. Optimization of beam weights under dose-volume restrictions. Int. J. Radiat. Oncol. 1987, 13, 1255–1260. [Google Scholar] [CrossRef]
- Mock, U.; Georg, D.; Bogner, J.; Auberger, T.; Pötter, R. Treatment planning comparison of conventional, 3D conformal, and intensity-modulated photon (IMRT) and proton therapy for paranasal sinus carcinoma. Int. J. Radiat. Oncol. 2004, 58, 147–154. [Google Scholar] [CrossRef]
- Yu, C.X. Intensity-modulated arc therapy with dynamic multileaf collimation: An alternative to tomotherapy. Phys. Med. Biol. 1995, 40, 1435. [Google Scholar] [CrossRef] [PubMed]
- Levin, W.; Kooy, H.; Loeffler, J.; DeLaney, T. Proton beam therapy. Br. J. Cancer 2005, 93, 849. [Google Scholar] [CrossRef] [PubMed]
- Paganetti, H.; Niemierko, A.; Ancukiewicz, M.; Gerweck, L.E.; Goitein, M.; Loeffler, J.S.; Suit, H.D. Relative biological effectiveness (RBE) values for proton beam therapy. Int. J. Radiat. Oncol. 2002, 53, 407–421. [Google Scholar] [CrossRef]
- Pedroni, E.; Bacher, R.; Blattmann, H.; Böhringer, T.; Coray, A.; Lomax, A.; Lin, S.; Munkel, G.; Scheib, S.; Schneider, U. The 200-MeV proton therapy project at the Paul Scherrer Institute: Conceptual design and practical realization. Med. Phys. 1995, 22, 37–53. [Google Scholar] [CrossRef] [PubMed]
- Engelsman, M.; Lu, H.M.; Herrup, D.; Bussiere, M.; Kooy, H. Commissioning a passive-scattering proton therapy nozzle for accurate SOBP delivery. Med. Phys. 2009, 36, 2172–2180. [Google Scholar] [CrossRef] [PubMed]
- Smith, A.R. Proton therapy. Phys. Med. Biol. 2006, 51, R491. [Google Scholar] [CrossRef] [PubMed]
- Gillin, M.T.; Sahoo, N.; Bues, M.; Ciangaru, G.; Sawakuchi, G.; Poenisch, F.; Arjomandy, B.; Martin, C.; Titt, U.; Suzuki, K. Commissioning of the discrete spot scanning proton beam delivery system at the University of Texas MD Anderson Cancer Center, Proton Therapy Center, Houston. Med. Phys. 2010, 37, 154–163. [Google Scholar] [CrossRef] [PubMed]
- Kanai, T.; Kawachi, K.; Kumamoto, Y.; Ogawa, H.; Yamada, T.; Matsuzawa, H.; Inada, T. Spot scanning system for proton radiotherapy. Med. Phys. 1980, 7, 365–369. [Google Scholar] [CrossRef] [PubMed]
- Lomax, A. Intensity modulation methods for proton radiotherapy. Phys. Med. Biol. 1999, 44, 185. [Google Scholar] [CrossRef] [PubMed]
- Goulet, M.; Gingras, L.; Beaulieu, L. Real-time verification of multileaf collimator-driven radiotherapy using a novel optical attenuation-based fluence monitor. Med. Phys. 2011, 38, 1459–1467. [Google Scholar] [CrossRef] [PubMed]
- Lin, L.; Qian, J.; Gonzales, R.; Keck, J.; Armour, E.; Wong, J. Su-e-t-483: In vivo dosimetry of conventional and rotational intensity modulated radiotherapy using integral quality monitor (IQM). Med. Phys. 2015, 42, 3445–3446. [Google Scholar] [CrossRef]
- Talamonti, C.; Arilli, C.; Marrazzo, L.; Calusi, S.; Galeotti, C.; Wandel, Y.; Meattini, I.; Scoccianti, S.; Pallotta, S. A new approach in patient QA: Beam delivery check and in-vivo dosimetry during radiotherapy treatment. Phys. Medica 2016, 32, 237–238. [Google Scholar] [CrossRef]
- Thoelking, J.; Sekar, Y.; Fleckenstein, J.; Lohr, F.; Wenz, F.; Wertz, H. Characterization of a new transmission detector for patient individualized online plan verification and its influence on 6MV X-ray beam characteristics. Z. Med. Phys. 2016, 26, 200–208. [Google Scholar] [CrossRef] [PubMed]
- Thoelking, J.; Fleckenstein, J.; Sekar, Y.; Boggula, R.; Lohr, F.; Wenz, F.; Wertz, H. Patient-specific online dose verification based on transmission detector measurements. Radiother. Oncol. 2016, 119, 351–356. [Google Scholar] [CrossRef] [PubMed]
- Arjomandy, B.; Sahoo, N.; Ding, X.; Gillin, M. Use of a two-dimensional ionization chamber array for proton therapy beam quality assurance. Med. Phys. 2008, 35, 3889–3894. [Google Scholar] [CrossRef] [PubMed]
- Rah, J.-E.; Oh, D.H.; Shin, D.; Kim, D.-H.; Ji, Y.H.; Kim, J.W.; Park, S.Y. Dosimetric evaluation of a glass dosimeter for proton beam measurements. Appl. Radiat. Isot. 2012, 70, 1616–1623. [Google Scholar] [CrossRef] [PubMed]
- Reinhardt, S.; Hillbrand, M.; Wilkens, J.; Assmann, W. Comparison of Gafchromic EBT2 and EBT3 films for clinical photon and proton beams. Med. Phys. 2012, 39, 5257–5262. [Google Scholar] [CrossRef] [PubMed]
- Zullo, J.R.; Kudchadker, R.J.; Zhu, X.R.; Sahoo, N.; Gillin, M.T. LiF TLD-100 as a dosimeter in high energy proton beam therapy—Can it yield accurate results? Med. Dosim. 2010, 35, 63–66. [Google Scholar] [CrossRef] [PubMed]
- Darafsheh, A.; Taleei, R.; Kassaee, A.; Finlay, J.C. The visible signal responsible for proton therapy dosimetry using bare optical fibers is not Čerenkov radiation. Med. Phys. 2016, 43, 5973–5980. [Google Scholar] [CrossRef] [PubMed]
- Jang, K.W.; Yoo, W.J.; Shin, S.H.; Shin, D.; Lee, B. Fiber-optic cerenkov radiation sensor for proton therapy dosimetry. Opt. Express 2012, 20, 13907–13914. [Google Scholar] [CrossRef] [PubMed]
- Darafsheh, A.; Taleei, R.; Kassaee, A.; Finlay, J.C. Proton therapy dosimetry using the scintillation of the silica fibers. Opt. Lett. 2017, 42, 847–850. [Google Scholar] [CrossRef] [PubMed]
- Darafsheh, A.; Zhang, R.; Kanick, S.C.; Pogue, B.W.; Finlay, J.C. Spectroscopic separation of čerenkov radiation in high-resolution radiation fiber dosimeters. J. Biomed. Opt. 2015, 20, 095001. [Google Scholar] [CrossRef] [PubMed]
- Son, J.; Kim, M.; Shin, D.; Hwang, U.; Lee, S.; Lim, Y.; Park, J.; Park, S.; Cho, K.; Kim, D.; et al. Development of a novel proton dosimetry system using an array of fiber-optic cerenkov radiation sensors. Radiother. Oncol. 2015, 117, 501–504. [Google Scholar] [CrossRef] [PubMed]
- Low, D.A.; Harms, W.B.; Mutic, S.; Purdy, J.A. A technique for the quantitative evaluation of dose distributions. Med. Phys. 1998, 25, 656–661. [Google Scholar] [CrossRef] [PubMed]


| Horizontal Profile (x-Axis) | Vertical Profile (y-Axis) | |||||||||||
|---|---|---|---|---|---|---|---|---|---|---|---|---|
| Energy | Measured Data (mm) | %Diff. | Measured Data (mm) | %Diff. | ||||||||
| Case | MatriXX | EBT3 Film | FORS | MatriXX vs. FORS | EBT3 Film vs. FORS | MatriXX | EBT3 Film | FORS | MatriXX vs. FORS | EBT3 Film vs. FORS | ||
| FWHM (mm) | 122.6 MeV | #1 | 44.3 | 44.8 | 45.1 | 1.8 | 0.6 | 44.3 | 44.4 | 45.0 | 1.7 | 1.3 |
| #2 | 63.8 | 64.0 | 64.9 | 1.8 | 1.4 | 65.0 | 64.1 | 64.2 | 1.1 | 0.2 | ||
| #3 | 104.8 | 103.7 | 103.9 | 0.9 | 0.2 | 104.4 | 104.4 | 106.0 | 1.5 | 1.5 | ||
| 227.1 MeV | #1 | 43.6 | 44.1 | 44.2 | 1.4 | 0.2 | 44.1 | 43.9 | 44.6 | 1.1 | 1.6 | |
| #2 | 66.4 | 66.4 | 65.3 | 1.7 | 1.6 | 63.4 | 63.8 | 64.1 | 1.2 | 0.5 | ||
| #3 | 103.6 | 104.7 | 104.1 | 0.5 | 0.5 | 104.0 | 104.0 | 104.4 | 0.4 | 0.3 | ||
| Penumbra (mm) | 122.6 MeV | #1 | 16.2 | 16.0 | 16.2 | 0.4 | 1.3 | 16.3 | 15.7 | 16.0 | 1.5 | 2.0 |
| #2 | 16.9 | 16.7 | 16.7 | 1.5 | 0.0 | 16.5 | 16.0 | 16.3 | 1.5 | 1.9 | ||
| #3 | 16.8 | 16.3 | 16.5 | 1.5 | 1.4 | 16.9 | 16.4 | 16.7 | 1.4 | 2.0 | ||
| 227.1 MeV | #1 | 9.8 | 9.5 | 9.6 | 1.6 | 1.8 | 10.0 | 9.7 | 9.8 | 2.0 | 1.1 | |
| #2 | 9.7 | 9.4 | 9.5 | 1.8 | 1.5 | 9.9 | 9.6 | 9.8 | 0.9 | 1.8 | ||
| #3 | 9.7 | 9.5 | 9.7 | 0.3 | 1.8 | 10.0 | 9.8 | 9.9 | 1.0 | 1.5 | ||
| Energy | Tool | Field 1 | Field 2 | Field 3 | Field 4 | Field 5 | Mean |
|---|---|---|---|---|---|---|---|
| 122.6 MeV | MatriXX vs. FORS | 98.4 | 97.1 | 96.4 | 97.1 | 95.1 | 96.8 ± 1.1 |
| EBT3 Film vs. FORS | 97.4 | 95.7 | 95.3 | 97.6 | 97.3 | 96.7 ± 1.0 | |
| 227.1 MeV | MatriXX vs. FORS | 96.2 | 99.6 | 96.2 | 97.5 | 95.7 | 97.0 ± 1.4 |
| EBT3 Film vs. FORS | 96.9 | 96.5 | 91.1 | 96.3 | 97.7 | 95.7 ± 2.3 |
© 2018 by the authors. Licensee MDPI, Basel, Switzerland. This article is an open access article distributed under the terms and conditions of the Creative Commons Attribution (CC BY) license (http://creativecommons.org/licenses/by/4.0/).
Share and Cite
Son, J.; Lee, S.B.; Lim, Y.; Park, S.Y.; Cho, K.; Yoon, M.; Shin, D. Development of Optical Fiber Based Measurement System for the Verification of Entrance Dose Map in Pencil Beam Scanning Proton Beam. Sensors 2018, 18, 227. https://doi.org/10.3390/s18010227
Son J, Lee SB, Lim Y, Park SY, Cho K, Yoon M, Shin D. Development of Optical Fiber Based Measurement System for the Verification of Entrance Dose Map in Pencil Beam Scanning Proton Beam. Sensors. 2018; 18(1):227. https://doi.org/10.3390/s18010227
Chicago/Turabian StyleSon, Jaeman, Se Byeong Lee, Youngkyung Lim, Sung Yong Park, Kwanho Cho, Myonggeun Yoon, and Dongho Shin. 2018. "Development of Optical Fiber Based Measurement System for the Verification of Entrance Dose Map in Pencil Beam Scanning Proton Beam" Sensors 18, no. 1: 227. https://doi.org/10.3390/s18010227
APA StyleSon, J., Lee, S. B., Lim, Y., Park, S. Y., Cho, K., Yoon, M., & Shin, D. (2018). Development of Optical Fiber Based Measurement System for the Verification of Entrance Dose Map in Pencil Beam Scanning Proton Beam. Sensors, 18(1), 227. https://doi.org/10.3390/s18010227