Article

Preparation of Cu2O-Reduced Graphene Nanocomposite Modified Electrodes towards Ultrasensitive Dopamine Detection

1
Hunan Key Laboratory of Biomedical Nanomaterials and Devices, School of Life Science and Chemistry, Hunan University of Technology, Zhuzhou 412007, China
2
Department of Chemistry and Material Science, Hengyang Normal University, Hengyang 421008, China
*
Authors to whom correspondence should be addressed.
These authors contributed equally to this work.
Sensors 2018, 18(1), 199; https://doi.org/10.3390/s18010199
Submission received: 13 December 2017 / Revised: 3 January 2018 / Accepted: 10 January 2018 / Published: 12 January 2018
(This article belongs to the Special Issue Graphene Based Sensors and Electronics)

Abstract

:
Cu2O-reduced graphene oxide nanocomposite (Cu2O-RGO) was used to modify glassy carbon electrodes (GCE), and applied for the determination of dopamine (DA). The microstructure of Cu2O-RGO nanocomposite material was characterized by scanning electron microscope. Then the electrochemical reduction condition for preparing Cu2O-RGO/GCE and experimental conditions for determining DA were further optimized. The electrochemical behaviors of DA on the bare electrode, RGO- and Cu2O-RGO-modified electrodes were also investigated using cyclic voltammetry in phosphate-buffered saline solution (PBS, pH 3.5). The results show that the oxidation peaks of ascorbic acid (AA), dopamine (DA), and uric acid (UA) could be well separated and the peak-to-peak separations are 204 mV (AA-DA) and 144 mV (DA-UA), respectively. Moreover, the linear response ranges for the determination of 1 × 10⁻⁸ mol/L~1 × 10−6 mol/L and 1 × 10⁻⁶ mol/L~8 × 10−5 mol/L with the detection limit 6.0 × 10⁻⁹ mol/L (S/N = 3). The proposed Cu2O-RGO/GCE was further applied to the determination of DA in dopamine hydrochloride injections with satisfactory results.

1. Introduction

Dopamine (DA), a neurotransmitter secreted in the midbrain region called the substantia nigra of the human body, plays a very important role in the functioning of central nervous, hormone, and cardiovascular system. Generally in brain fluids, DA is present in the 10−6 M to 10−8 M range, and abnormal levels of DA eventually lead to several neurological disorders, such as Parkinson’s and Schizophrenia diseases [1]. Hence, it is essential to develop a low cost, effective, and sensitive biosensor for detection of DA. It is well known that electrochemical sensors are an excellent technique due to their rapid response, facile operation, sensitivity, and selectivity [2,3]. However, DA in the human body coexists along with ascorbic acid (AA) and urea acid (UA), which act as potential interfering agents [4,5]. It is essential to eliminate the interference of AA and UA in the detection of DA. In recent years, DA biosensors using various nanomaterials have been reported with a satisfactory detection limit [6,7,8,9,10,11,12,13,14]. However, they suffer from various disadvantages, such as cumbersome synthesis, limited sensitivity, and poor selectivity toward DA.
Cu2O nanoparticles (Cu2O NPs) is a typical p-type semiconductor with narrow band gap of 1.9–2.1 eV. The Cu2O NPs have been widely used in solar cell, photocatalysis, and sensors due to their excellent catalytic performance [15,16,17]. Cu2O NPs-based surfaces have also been applied as efficient CO2 electroreduction materials in previous reports [18,19,20]. However, their poor dispersibility is the major obstacle for electrochemical detection with Cu2O NPs modified electrodes. Recently, graphenes have widely used in electrochemical sensors attributed to their excellent electrical conductivity, high surface area, and good biocompatibility [21,22,23]. The Cu2O/graphene nanocomposites have been developed toward electrochemical detection in recent years. For example, both Zhou and Li groups had prepared the Cu2O/graphene nanocomposites modified glassy carbon electrode (GCE), these nanocomposites show the good photocatalytic performance and high selectivity [24,25]. Jiang and coworkers prepared Cu2O/N-doped graphene nanocomposite modified GCE for detection of H2O2. These nanocomposite materials show wider linear response range and lower detection limit [26]. However, Cu2O/graphene nanocomposite modified electrodes toward the detection of DA have been scarcely reported. Compared with noble metals (Au and Pt), the low cost and easy preparation of Cu2O NPs have gained growing attention in electrocatalytic field. Moreover, reduced graphene oxide (RGO) has been considered as the most promising materials for electrochemical sensing due to their high stability and conductivity among various graphenes. Generally, RGO is synthesized by chemical or hydrothermal reduction of graphene oxide. Compare with these traditional reduction methods, electrochemical reduction is a green and controllable method without using strong reducer [27]. In our previous work, electrochemical reduction was used to prepare the graphene modified acetylene black paste electrode for detection of tryptophan and bisphenol A [28,29,30,31].
Theoretically, the synergistic effect between Cu2O NPs and RGO in Cu2O-RGO/GCE may endow itself with promising advantages of excellent electrocatalytic activity of Cu2O, the large surface area, as well as strong adsorption ability of RGO, and may also improve the selectivity, sensitivity and linear response range of detection of DA. Herein, Cu2O-RGO-modified GCEs were fabricated by facile drop-casting followed by the electrochemical reduction method, and the optimum electrochemical reduction conditions for preparing Cu2O-RGO/GCE and electrochemical detection conditions for determining DA were also investigated. The morphologies of as-prepared Cu2O NPs, RGO and Cu2O-RGO nanocomposites were characterized by scanning electron microscope (SEM). Moreover, the electrochemical behavior of DA on the surface of the Cu2O-RGO/GCE was studied in detail, and various electrochemical parameters, including pH, scan rate, accumulation potential, and time were discussed carefully. Finally, the Cu2O-RGO/GCE was successfully applied in DA detection of real samples.

2. Experimental Section

2.1. Materials and Chemicals

Graphite powder, sodium nitrate (NaNO3), concentrated sulfuric acid (H2SO4), potassium permanganate (KMnO4), hydrogen peroxide (H2O2), copper sulfate pentahydrate (CuSO4·5H2O), polyvinylpyrrolidone (PVP), hydrazine hydrate (N2H4·H2O), potassium ferricyanide (K3Fe(CN)6), potassium ferrocyanide (K4Fe(CN)6), potassium nitrate (KNO3), phosphoric acid (H3PO4), sodium hydroxide (NaOH), hydrochloric acid (HCl), and ethyl alcohol were purchased from Sinopharm Chemical Reagent Co., Ltd. (Shanghai, China). Dopamine (DA) was purchased from Sigma-Aldrich Co (St. Louis, CA, USA). All these reagents were used as received without further treatment, and ultrapure water was used in all experiments (18.2 MΩ).

2.2. Synthesis of Cu2O NPs

Fifty milligrams of CuSO4·5H2O and 24 mg of PVP are dissolved completely in 10 mL of ultrapure water under ultrasound exposure for 30 min. Then, 2 mL of NaOH solution (0.2 M) were added into the above solution. This solution was stirred for 30 min under room temperature, and the blue Cu(OH)2 was formed subsequently. Finally, 6 μL of hydrazine hydrate was added under stirring for 20 min in room temperature. The brick red Cu2O suspensions were obtained by centrifugation under 5000 rpm. After washing by water and ethyl alcohol repeatedly, the Cu2O NPs were prepared as a solution with the concentration of 1 mg/mL.

2.3. Synthesis of Cu2O-GO Composite Nanomaterials

Graphene oxide (GO) was prepared by modified Hummers’ method [32]. Typically, 23 mL of concentrated H2SO4 were cooling down to 0 °C, and 0.5 g of graphite powder and 0.5 g of NaNO3 were added under mechanical stirring. 3.0 g of KMnO4 were added slowly under controlling temperature lower than 5 °C, then the temperature raised to 35 °C under stirring for 2 h to form a mash. Subsequently, 40 mL of water added into the solution slowly under controlling temperature lower than 50 °C, then the temperature was increased to 95 °C for 0.5 h. After adding 100 mL of water, the above solution was added into 20 mL of 30% H2O2 in batches. The as-obtained golden yellow solution was collected by suction filtration in time, the precipitate was washed by 150 mL of hydrochloric acid (1:10) and 150 mL of H2O, respectively. The GO was obtained by drying under 50 °C vacuum overnight. Finally, 100 mg of GO were dispersed in 100 mL of water under ultrasound application for 2 h, the supernatant was obtained with the concentration of 1 mg/mL after centrifugation. 1 mL of Cu2O solution (1 mg/mL) was added 20 mL of GO solution under ultrasound for 2 h, and the Cu2O-GO composite nanocomposites were obtained.

2.4. Fabrication of Cu2O-RGO-Modified GCE

Firstly, the GCE was polished by α-Al2O3 with different fine sizes (1.0 μm, 0.3 μm, and 0.05 μm), then was immersed in ethyl alcohol and water under ultrasound application for 1 min, respectively. The Cu2O-RGO/GCEs were fabricated via drop-casting of the Cu2O-RGO dispersion on the GCE, followed by an electrochemical reduction process. For comparison, reduced graphene oxide-modified GCEs (RGO/GCE) were also prepared similarly.

2.5. Characterization

Scanning electron microscopy (SEM, Hitachi S-3000N, Tokyo, Japan) was used to photograph SEM images at 30 kV. The electrochemical behaviors of as-prepared samples were tested by electrochemical workstation (CHI660E, Shanghai Chenhua Instrument Co. LTD., Shanghai, China) and Polarographic Analyzer (JP-303E, Chengdu Instrument Factory, Chengdu, China).

2.6. Electrochemical Experiments

All electrochemical experiments including cyclic voltammetry (CV), second-order derivative linear sweep voltammetry (SDLSV), and electrochemical impedance spectroscopy (EIS) were carried out with a standard three-electrode system, using bare or modified GCEs, platinum wire electrode, and saturated calomel electrode (SCE) as working counter, counter electrode and reference electrodes, respectively. The electrochemical response was performed using CV on Cu2O-RGO/GCE in a freshly prepared 0.1 M PBS containing 1 × 10⁻⁵ mol/L DA. The EIS was measured at their open circuit voltage with 5 mV amplitude, using 5 × 10⁻³ mol/L [Fe(CN)6]3−/4− as redox probe solution. The frequency ranged from 1 × 10⁵ Hz to 0.1 Hz. The sensing performance of DA on Cu2O-RGO/GCE was investigated using SDLSV in a 10 mL electrochemical cell containing 0.1 M PBS. Both the CVs and SDLSV were recorded at a scan rate of 100 mV/s, after a suitable accumulation period under stirring at 500 rpm and a 5 s rest. The potential scan ranges were −0.2 to 1.0 V for CV and 0–1.1 V for the SDLSV. The CV was measured by CHI 660E electrochemical workstation (Chenhua Instrument Co. Ltd., Shanghai, China), and SDLSV was recorded by a JP-303E Polarographic Analyzer (Chengdu Instrument Company, Chengdu, China).

2.7. Analysis of Real Samples

Dopamine hydrochloride injection samples were purchase from Aladdin Reagent Co. (Shanghai, China). Two milliliter dopamine hydrochloride injections (containing dopamine hydrochloride 2 mg) were diluted to 100 mL with 0.1 M PBS (pH = 3.5) to obtain DA diluent. Then dopamine hydrochloride injection samples with various concentration were prepared by adding a certain amount of DA diluent and diluting with 0.1 M PBS (pH = 3.5) in a 10 mL volumetric flask. The content of dopamine in the dopamine hydrochloride injections was measured using SDLSV by the standard addition method under the optimal detection conditions.

3. Result and Discussion

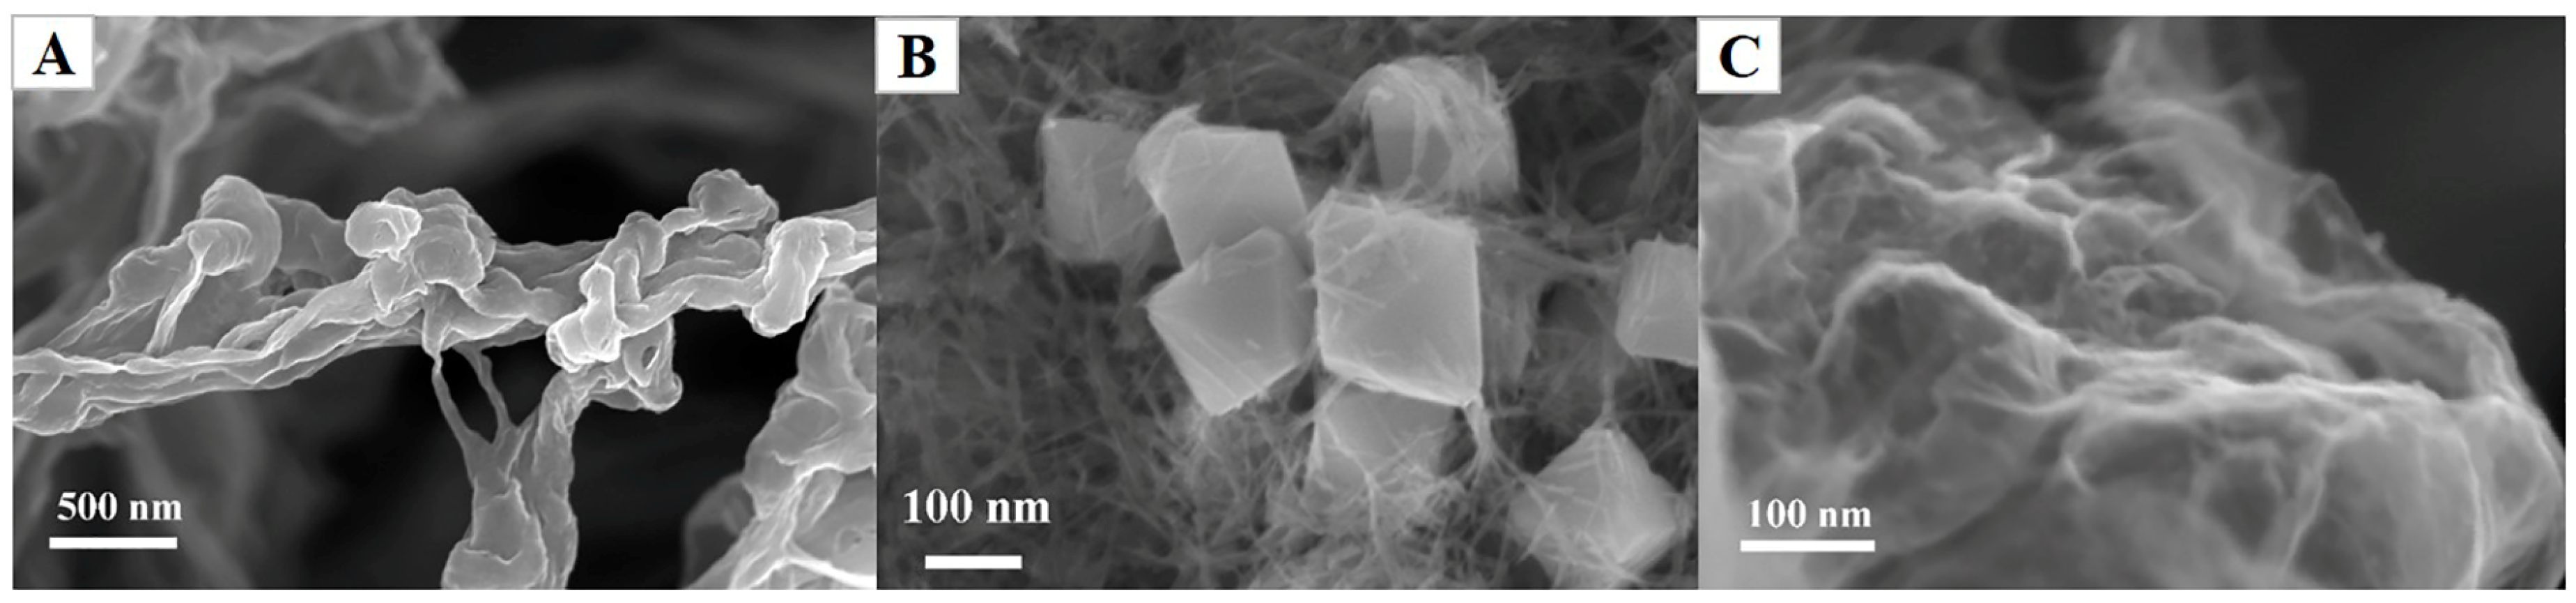
3.1. Morphologic Characterization of Cu2O-GO Nanocomposites

The SEM images of these as-prepared RGO, Cu2O and Cu2O-RGO are depicted in Figure 1A–C, respectively. As shown in Figure 1A, the RGO nanosheets with plicated surface are evident, indicating that the RGO is synthesized successfully. The SEM image of Cu2O nanoparticles is presented in Figure 1B, the octahedron shape of Cu2O with uniform size is observed. Figure 1C shows the SEM image of Cu2O-RGO nanocomposites, where the Cu2O NPs are coated with RGO nanosheets, indicating that the Cu2O NPs are well combined with RGO.

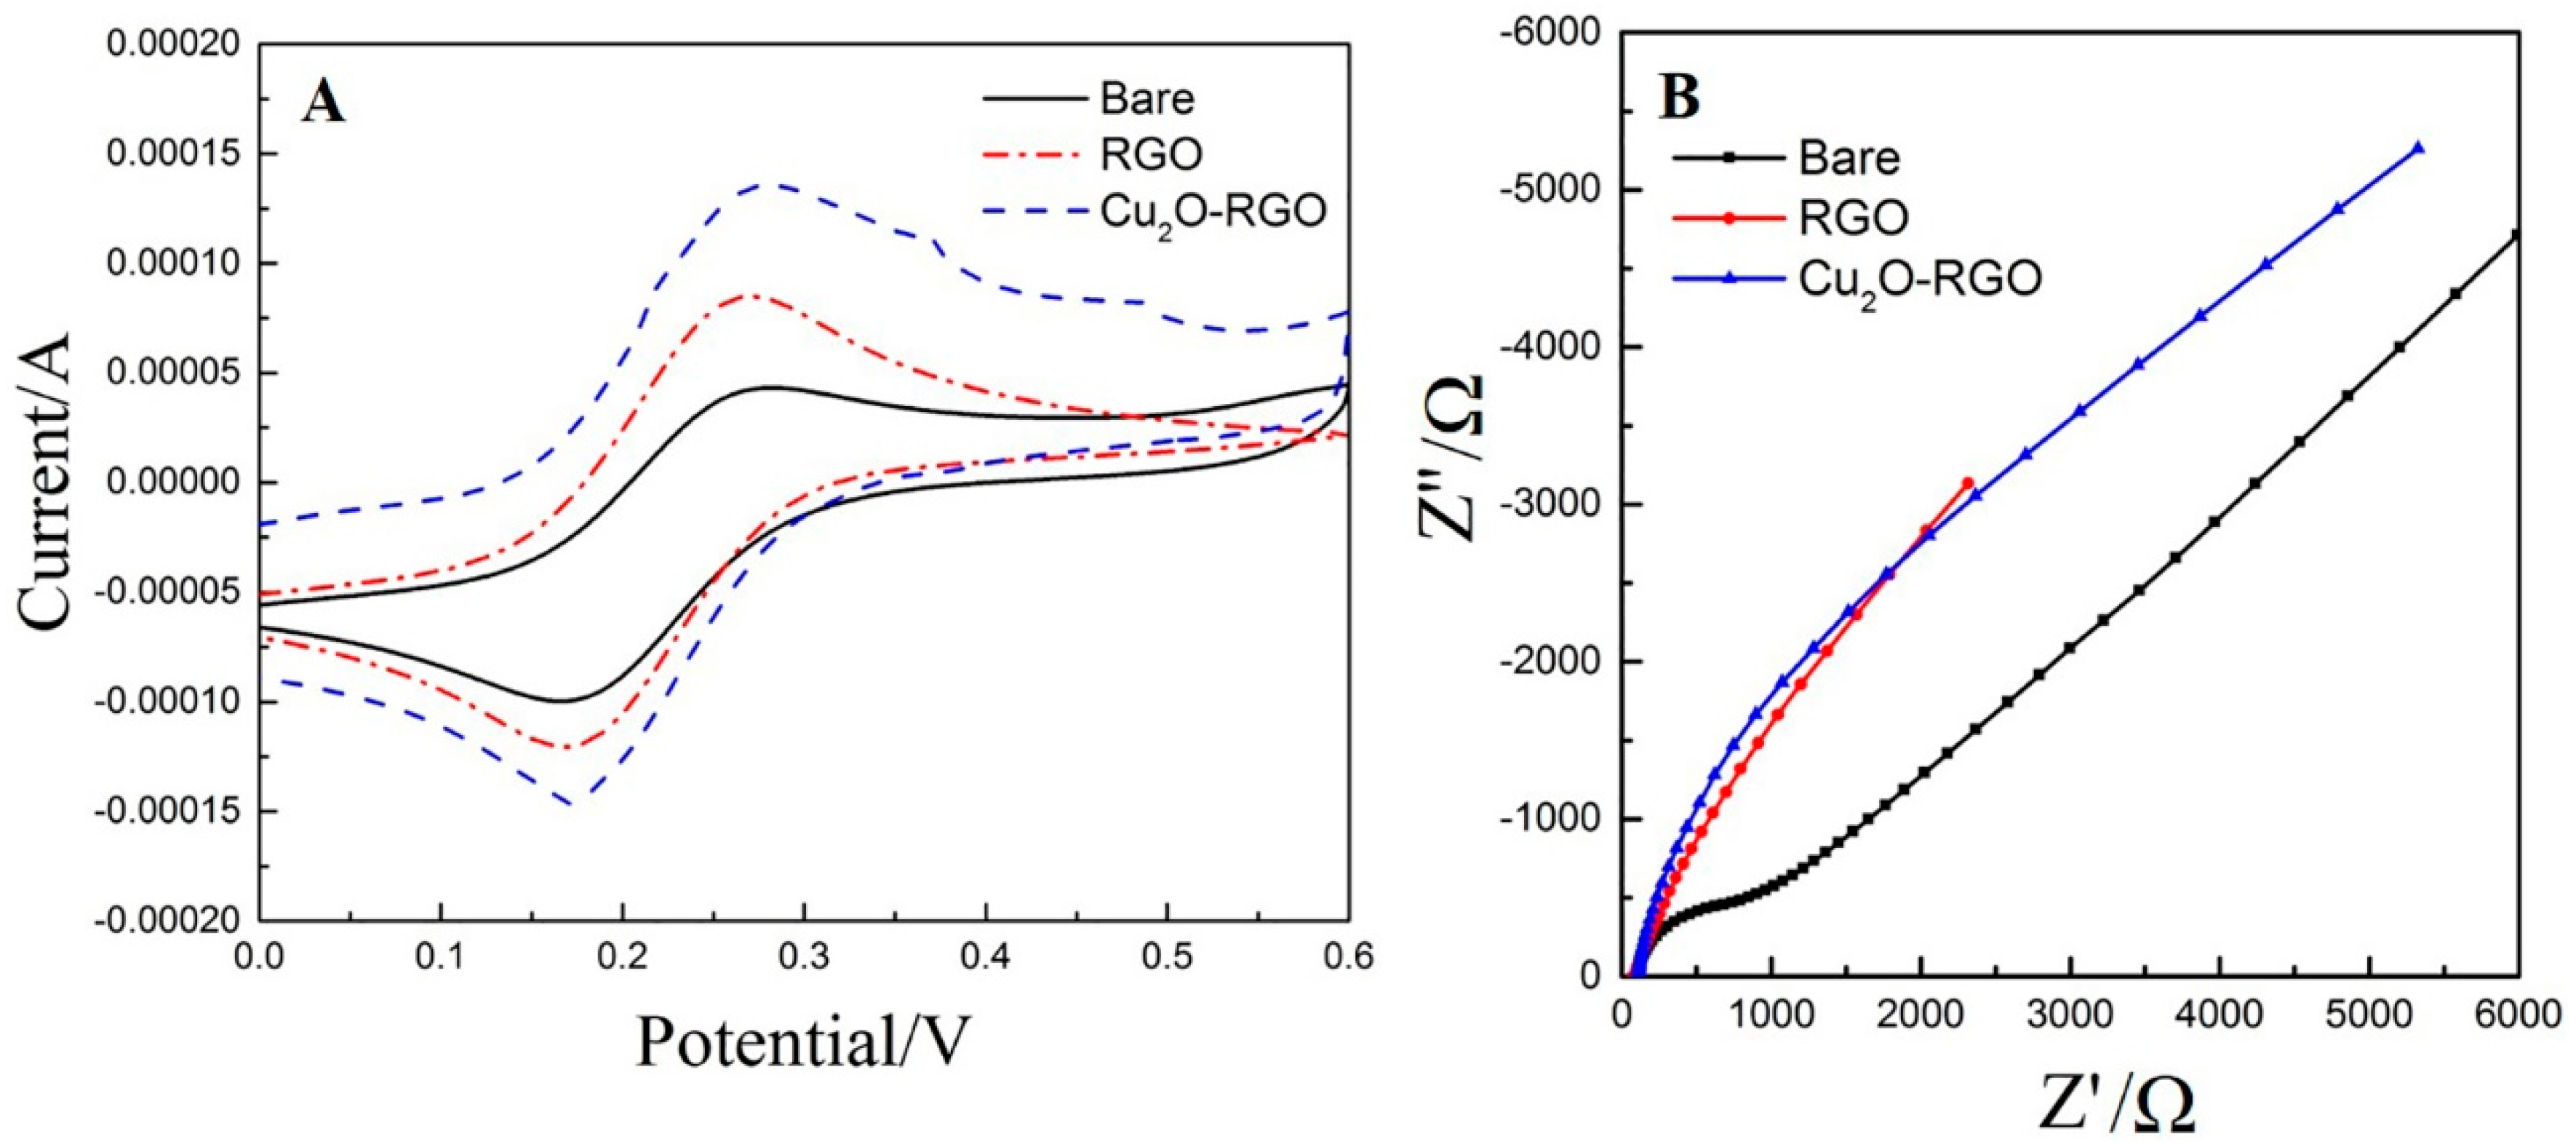
3.2. Electrochemical Characterization

The CV curves of bare or modified GCEs recorded in 5 × 10⁻³ mol/L of [Fe(CN)6]3−/4− solution are presented in Figure 2A. The reduction peak currents of bare GCE, RGO/GCE and Cu2O-RGO/GCE are 8.808 × 10⁻⁵ A, 1.187 × 10⁻⁴ A, and 1.311 × 10⁻⁵ A, respectively. According to Randles-Sevcik equation, the electrochemical active area of bare GCE, RGO/GCE, and Cu2O-RGO/GCE were calculated as 0.075 cm2, 0.101 cm2, and 0.112 cm2, respectively. The electrochemical active area of bare GCE coincides with the geometric area (Φ 3.0 mm, 0.071 cm2), and the electrochemical active area of RGO/GCE and Cu2O-RGO/GCE are 1.3 and 1.5 times of that of bare GCE. This phenomenon is probably related to the large specific surface area of Cu2O and RGO. The increase of electrochemical active area could not only improve the adsorption capacity of DA, but also increase the catalytic sites for DA oxidation. As a result, the electrochemical oxidation of DA was accelerated greatly. Additionally, the electrode interface property is also investigated by electrochemical impedance spectroscopy (EIS), and the results are presented in Figure 2B. The radius of the semicircle in Nyquist plot represent the charge transfer resistance (Rct). The Rct of RGO/CCE is larger than that of Cu2O-RGO/GCE, because the electrical conductivity of Cu2O NPs is poor due to their semiconductive property. However, the Rct of both RGO and Cu2O-RGO nanocomposite-modified electrodes are much lower than that of bare GCE because of the high conductivity of RGO.

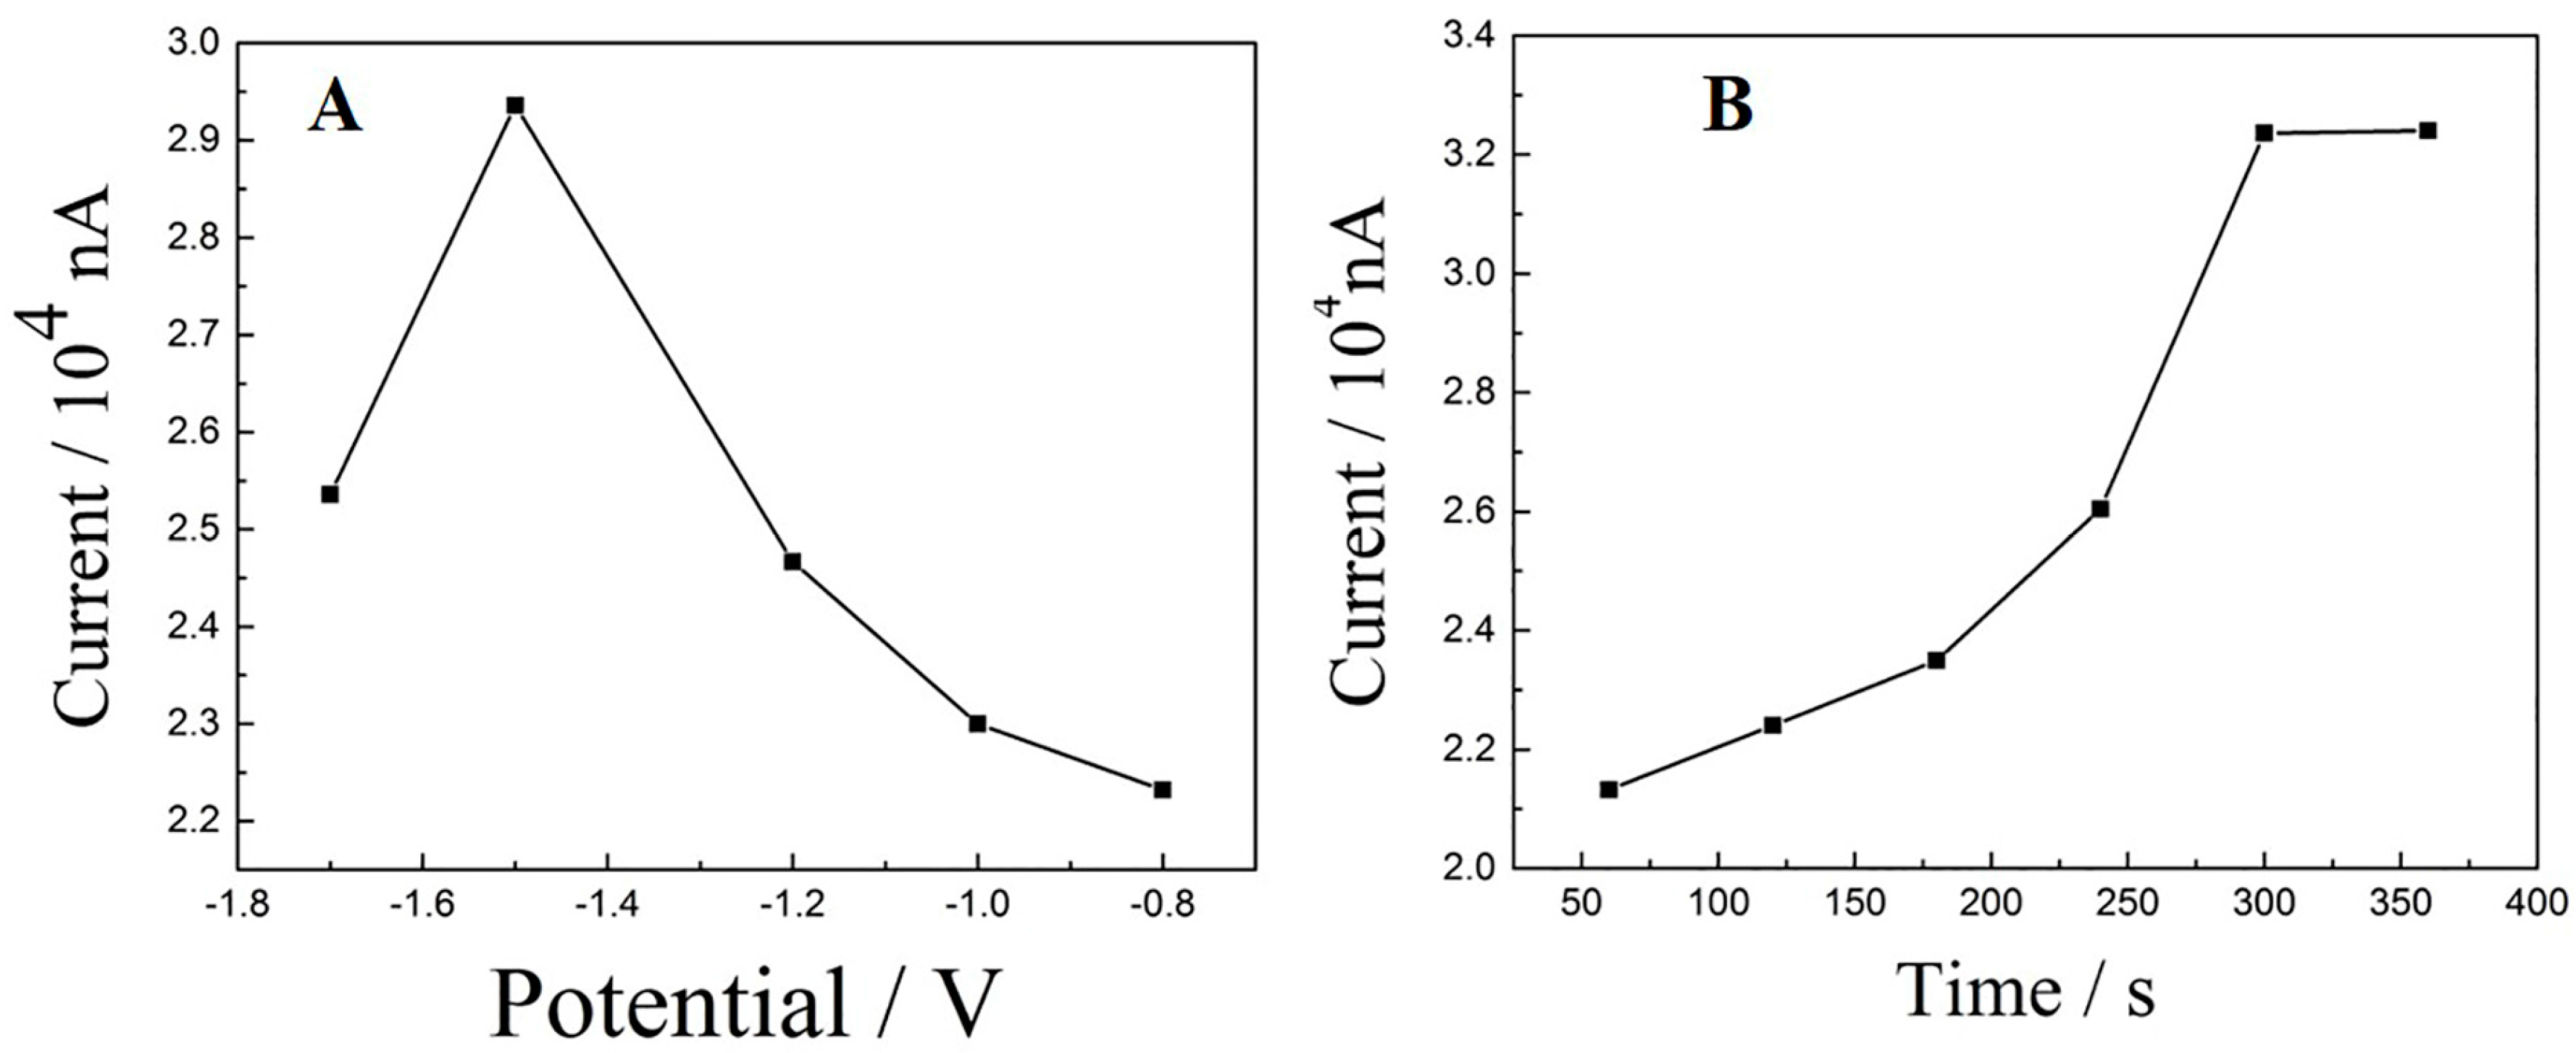
3.3. Optimization of Electrochemical Reduction Condition

In order to seek optimum preparation conditions for Cu2O-RGO/GCE, the electrochemical conditions, including reduction potential, as well as time were further investigated. Generally, the potential range for electrochemical reduction of GO is −1.5V to −1.0 V. In this study, Cu2O-RGO/GCE samples were prepared from Cu2O-GO/GCE by potentiostatic method under various reduction potentials (−1.7 V, −1.5 V, −1.2 V, −1.0 V, and −0.8 V). After reduction for 300 s, the as-prepared Cu2O-RGO/GCEs were used for the detection of DA (1 × 10⁻⁵ mol/L). As shown in Figure 3A, the largest oxidation peaks current (ipa) is obtained when the reduction potential is −1.5 V. Furthermore, the oxidation peaks of various Cu2O-RGO/GCEs fabricated with different reduction time (60 s, 120 s, 180 s, 240 s, 300 s, and 360 s) are also compared, while the reduction potential was fixed as −1.5 V. As shown in Figure 3B, the oxidation peak currents ipa increase gradually when the reduction time increases from 60 s to 300 s, the maximum ipa is obtained in 300 s. Afterwards, ipa remains stable with prolonging the reduction time. As a result, the reduction potential and time for Cu2O-RGO/GCE preparation are suggested as −1.5 V and 300 s, respectively.

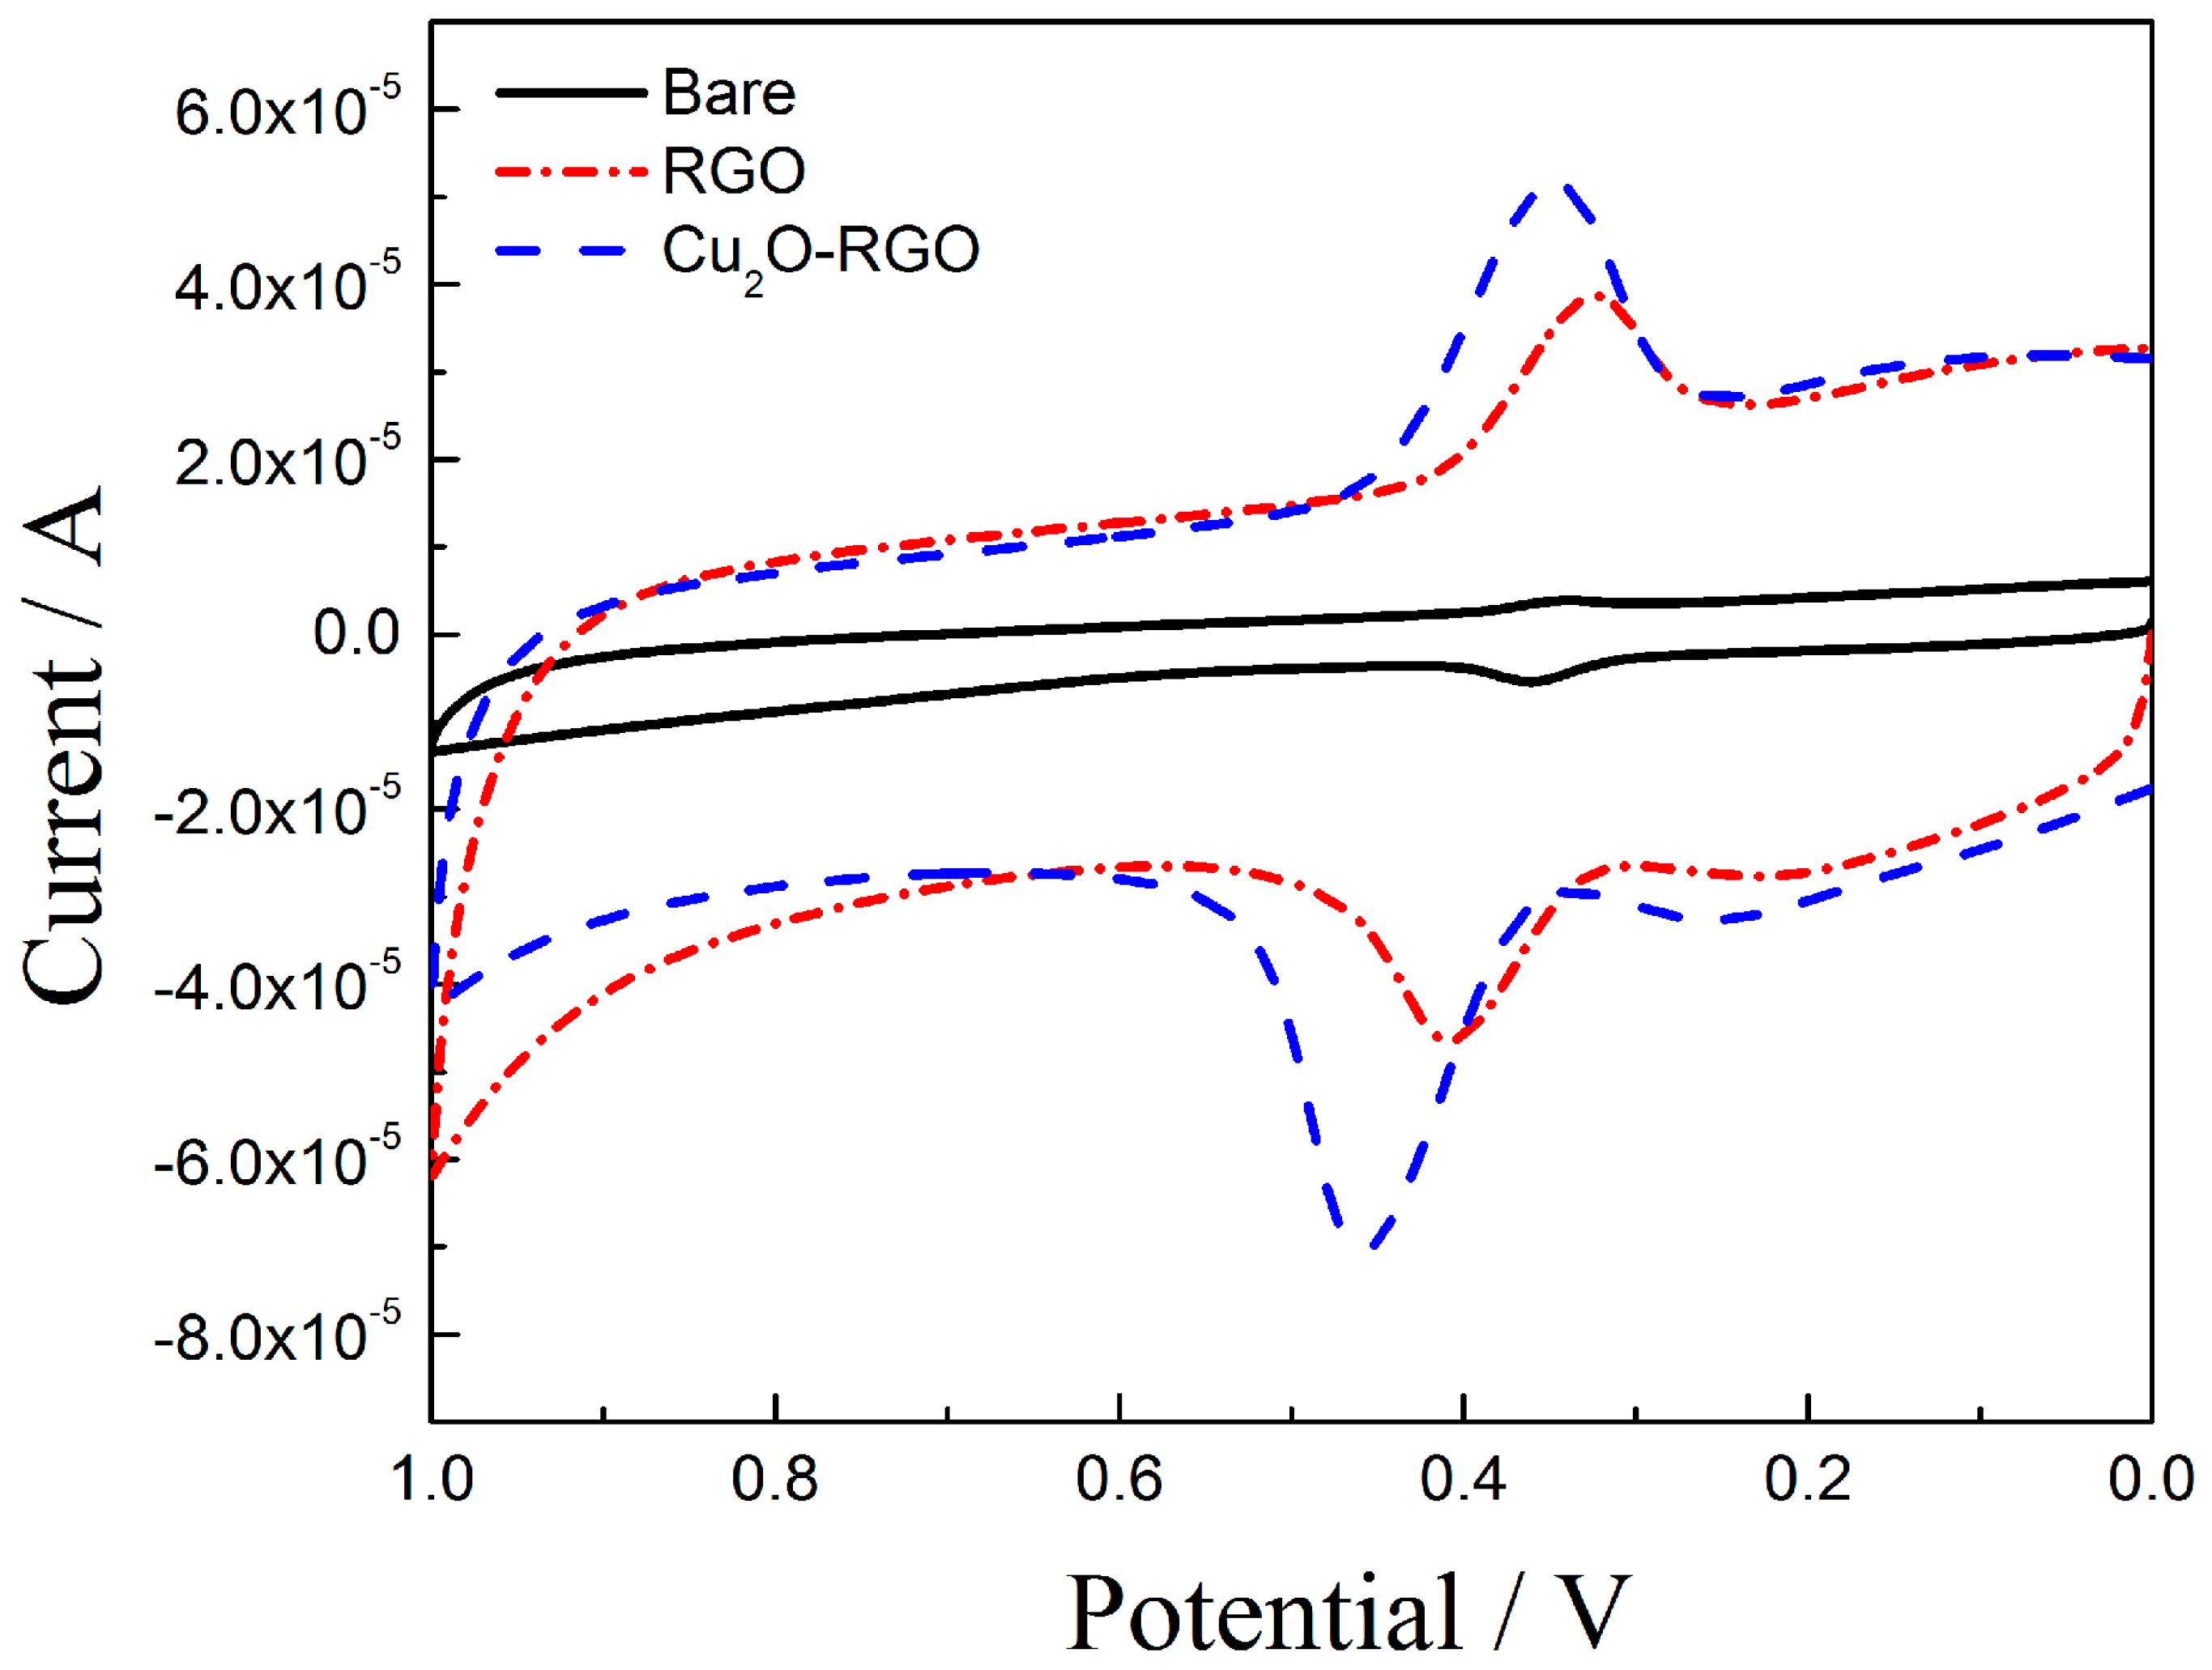
3.4. The DA sensing of Modified Electrodes

The DA sensing of GCE, Cu2O/GCE, and Cu2O-RGO/GCE was investigated using CV recorded at 100 mV/s in the 0.1 M of PBS, and the results are shown in Figure 4. On the bare GCE, both oxidation peak current (ipa = 5.415 μA) and reduction peak current (ipc = 3.899 μA) is very low, indicating a poor electrochemical response of bare electrode. On the RGO/GCE, the ipa and ipc is improved to 36.565 μA and 31.149 μA, respectively. This phenomenon is probably due to the excellent electrical conductivity, large surface area of RGO, and great adsorption capacity of DA. The strong π–π interactions between the phenyl ring of DA and the two dimensional planar carbon structure of RGO is beneficial to increasing the adsorption capacity of DA. Moreover, when Cu2O-RGO/GCE was used as work electrode, the ipa increases to 70.720 μA and ipc increases to 51.558 μA. The peak currents enhanced more distinctly than those of bare GCE and RGO/GCE because of the synergistic effect of Cu2O NPs and RGO combination. Specifically, the RGO with large surface area could increase the adsorption capacity of DA. On the other hand, the electrocatalytic properties of Cu2O NPs could accelerate the electron transfer between Cu+ and Cu2+, and then increase the response current density [33]. Thus, the as-prepared Cu2O-RGO/GCE could be used to detect the DA effectively.

3.5. Optimization of the Detection Condition of DA

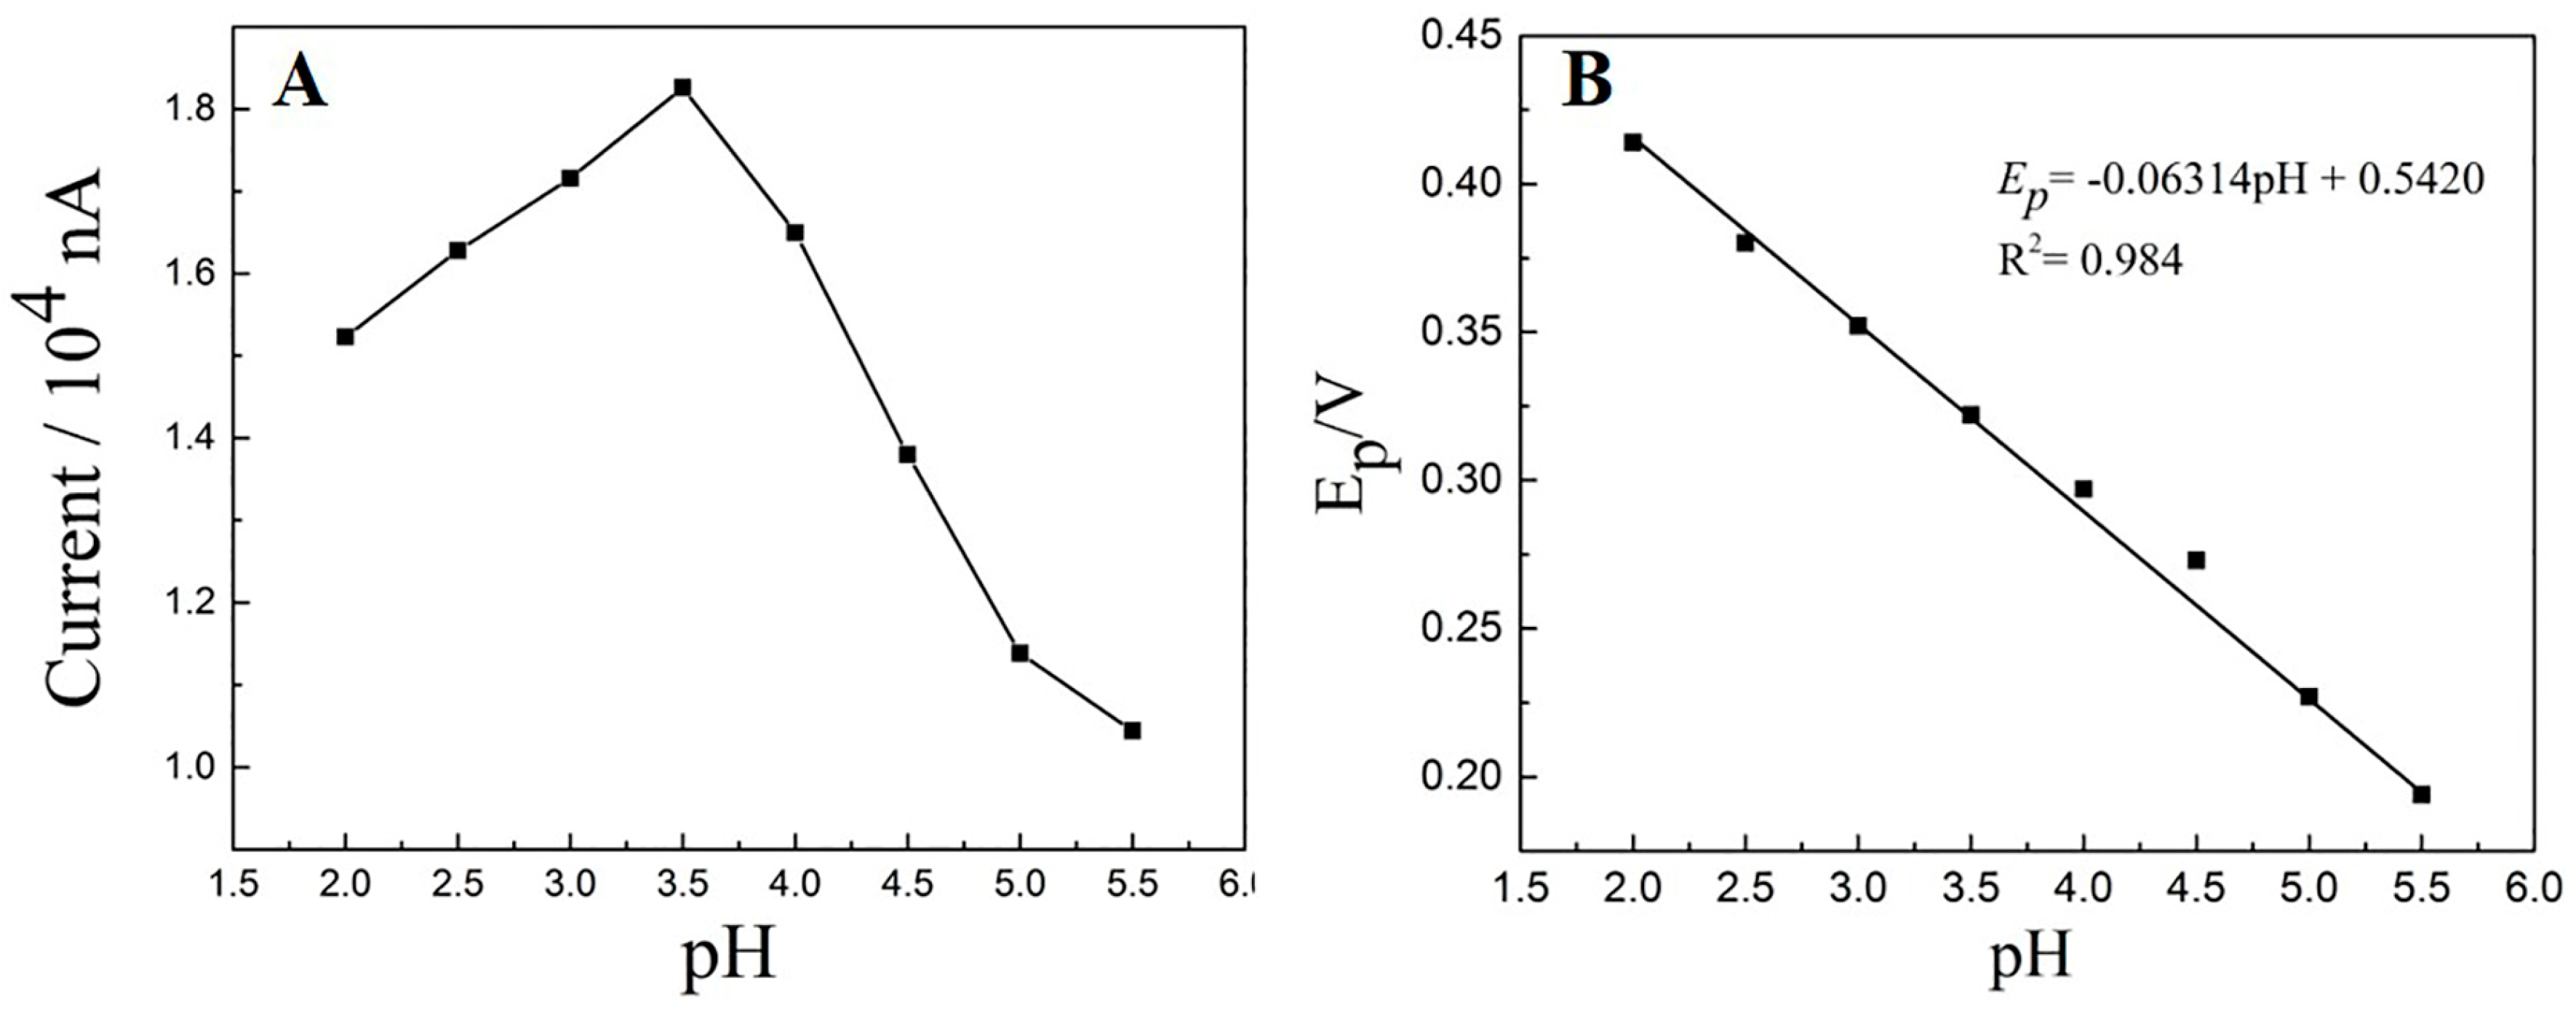
3.5.1. The Influence of pH

The oxidation of DA dependents strongly on pH of medium, so it is well worth optimizing the pH for DA detection. The electrochemical responses of DA were investigated in PBS under different pH (2.0–5.5). The CV curves under different pH values are presented in Figure 5A. At a pH of 3.5, the maximum ipa of DA is obtained. Moreover, the linear relationship between oxidation peak potential Ep and pH is evidently observed at the pH range from 2.0 to 5.5. As shown in Figure 5B, the linear equation is Ep = −0.06314 pH + 0.542 (R2 = 0.984), and the slope is −63 mV/pH, highly closing to theoretical value (−59 mV/pH). It implies that the number of electron and proton participated in electrochemical oxidation process is the same [34].

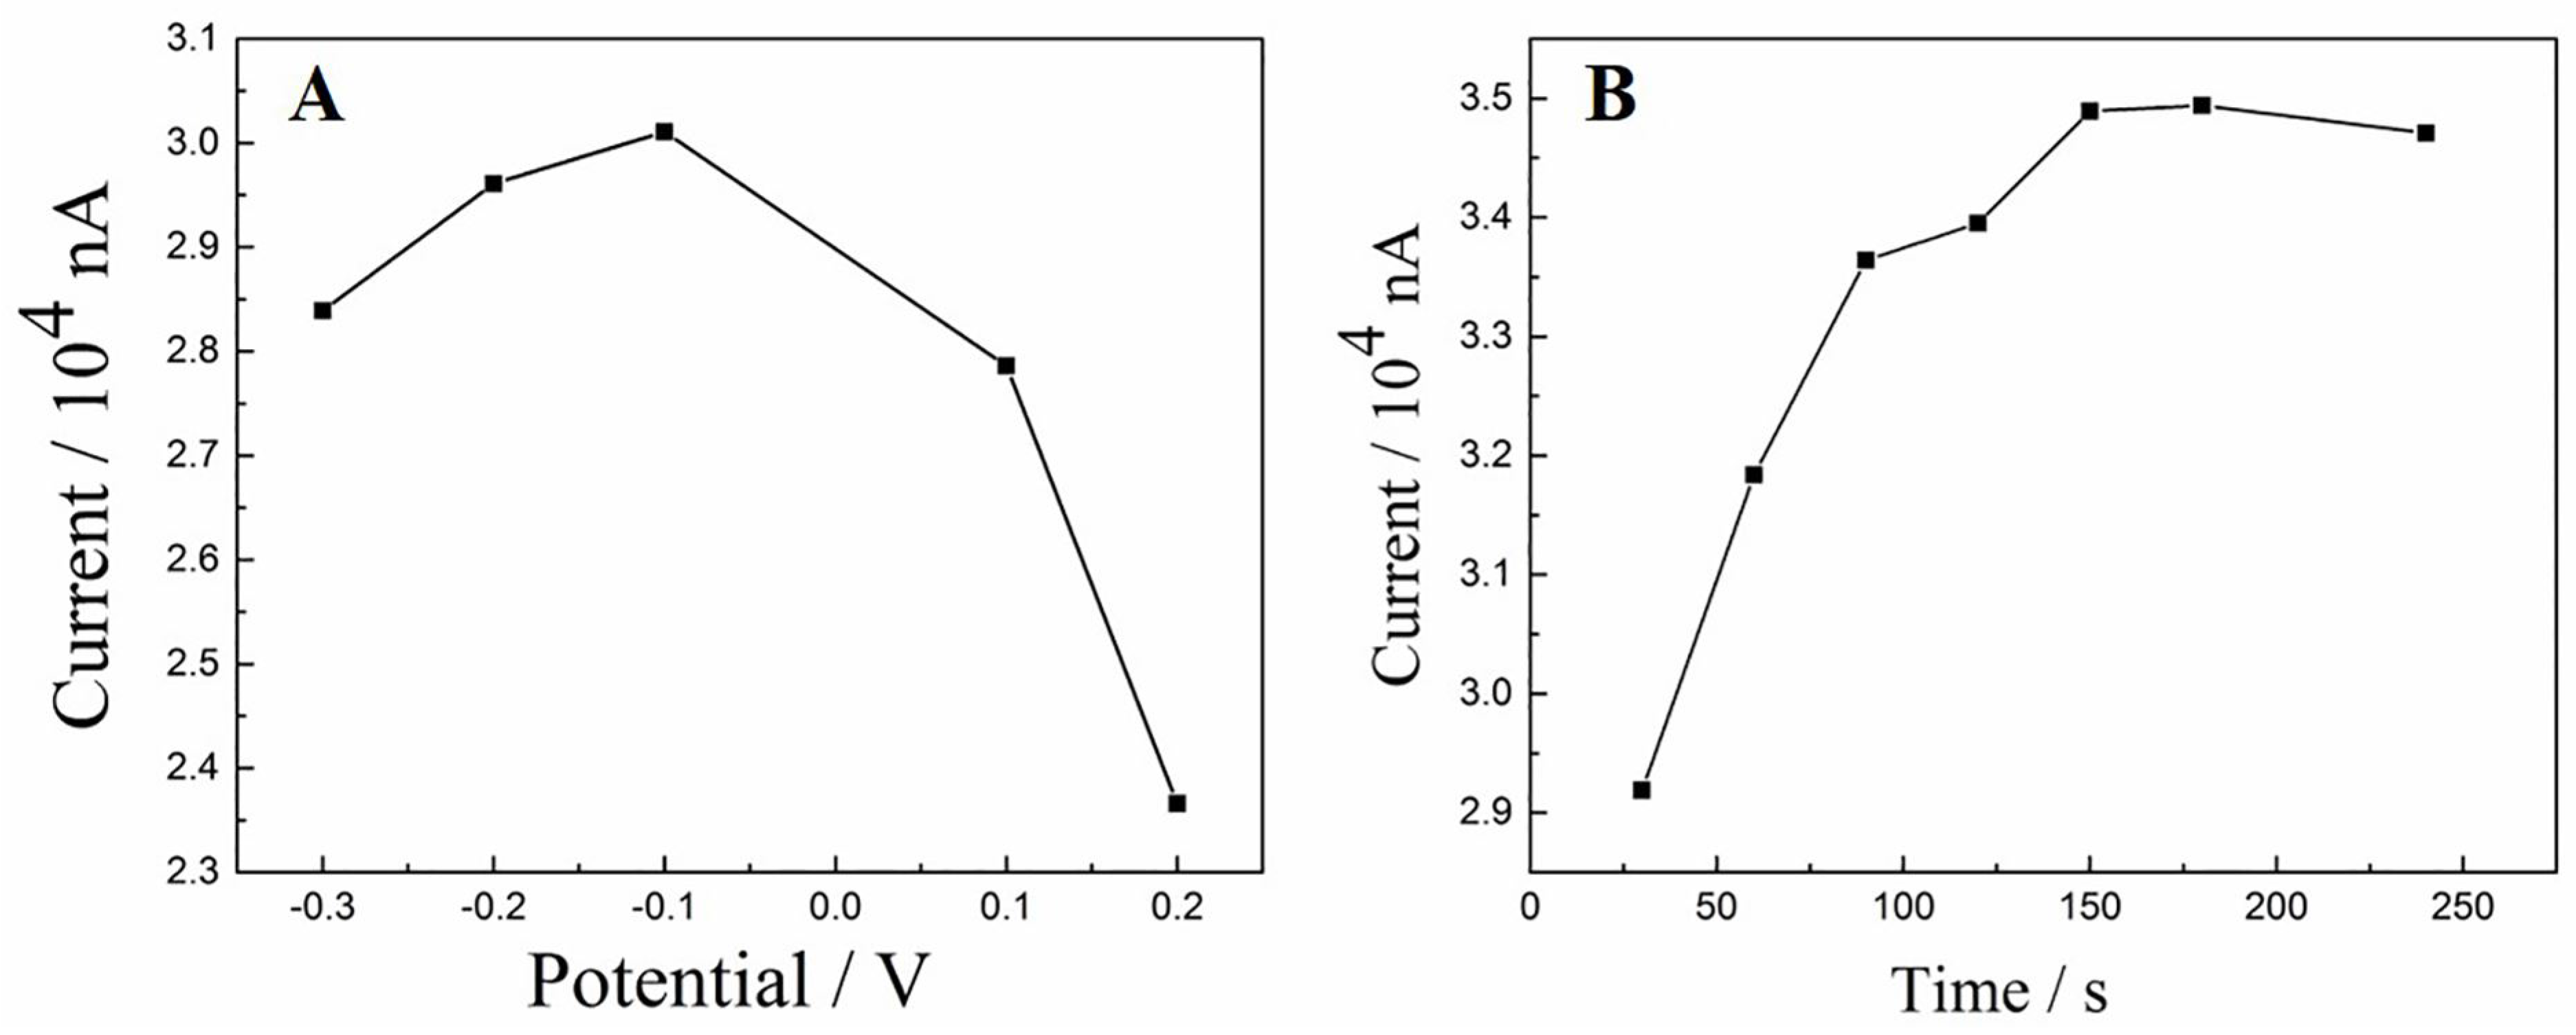
3.5.2. Effect of Accumulation Conditions

The effect of accumulation potential as well as time on the oxidation current of DA obtained at the Cu2O-RGO/GCE were investigated, because the accumulation step is usually a simple and effective method to improve the sensitivity. The oxidation peak currents of 1 × 10⁻⁵ mol/L DA were measured after accumulation process at different accumulation potentials (−0.3 to 0.2 V) for 240 s. As shown in Figure 6A, the largest oxidation peak current appeared at the accumulation potential of −0.1 V, indicating that −0.1 V is the optimal accumulation potential. Afterwards, the various accumulation time is also investigated while the accumulation potential was fixed as −0.1 V. The relationship of accumulation time and oxidation peak current is presented in Figure 6B. With prolonging the accumulation time, the oxidation peak currents increase rapidly in the first 150 s. Afterwards the oxidation peaks current keep stable with further increase of accumulation time. This phenomenon could be ascribed to the saturated adsorption of DA on the electrode surface. Thus, the accumulation time is chosen as 150 s.

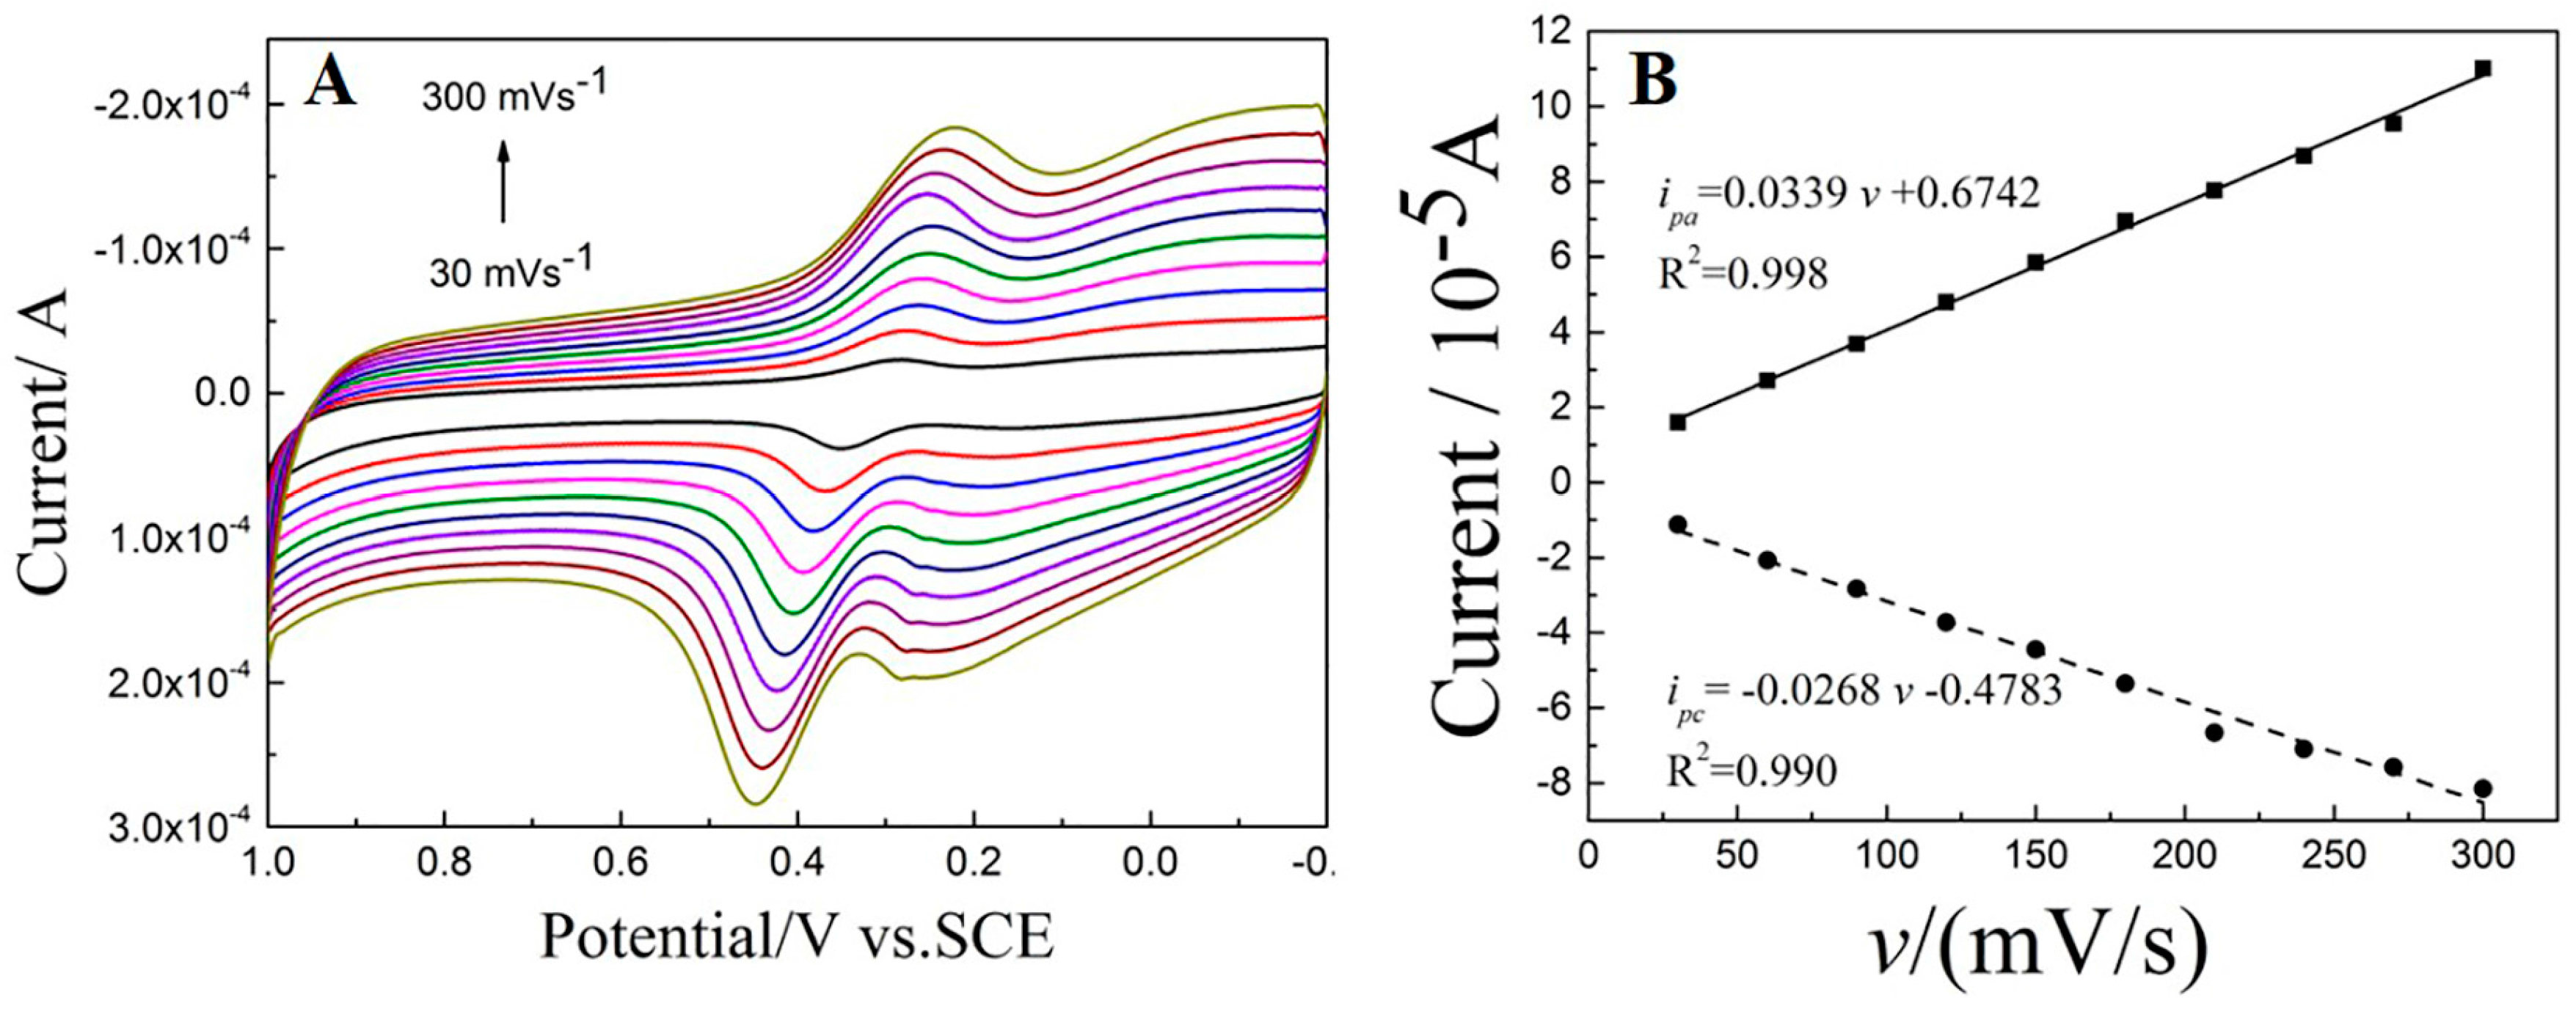
3.5.3. The Influence of Scan Rate

The scan rate is an important parameter that influences the electrochemical response of DA. The electrochemical behaviors were investigated using CV in 1 × 10⁻⁵ mol/L of DA in PBS (0.1 M, pH = 3.5) under different scan rate (30~300 mV/s), and the results are presented in Figure 7A. With the increase of scan rate, both oxidation and reduction peak currents increase evidently. It is noteworthy that the background currents also increase. Figure 7B show the linear relationship between redox peak currents (ipa and ipc) and scan rate (v), corresponding linear equations are ipa = −0.0268 v − 0.4783 (R2 = 0.990) and ipc = 0.0339 v + 0.6742 (R2 = 0.998), respectively. These results suggest that the electrochemical oxidation of DA on the Cu2O-RGO/GCE is an adsorption-controlled process. Thus, accumulation method is applied for increasing the response currents density in subsequent experiment. Although the currents increase with the scan rate rising, the background currents are also improved. Thus, a suitable scan rate is advisable as 100 mV/s for enhancing signal to noise ratio (SNR) and reducing the background current at the same time. Moreover, with the increasing of scan rate, oxidation peak current is shifted positively, and reduction peak current is shifted to negative direction in contrast. This demonstrates that the DA oxidation is a quasi-reversible reaction.

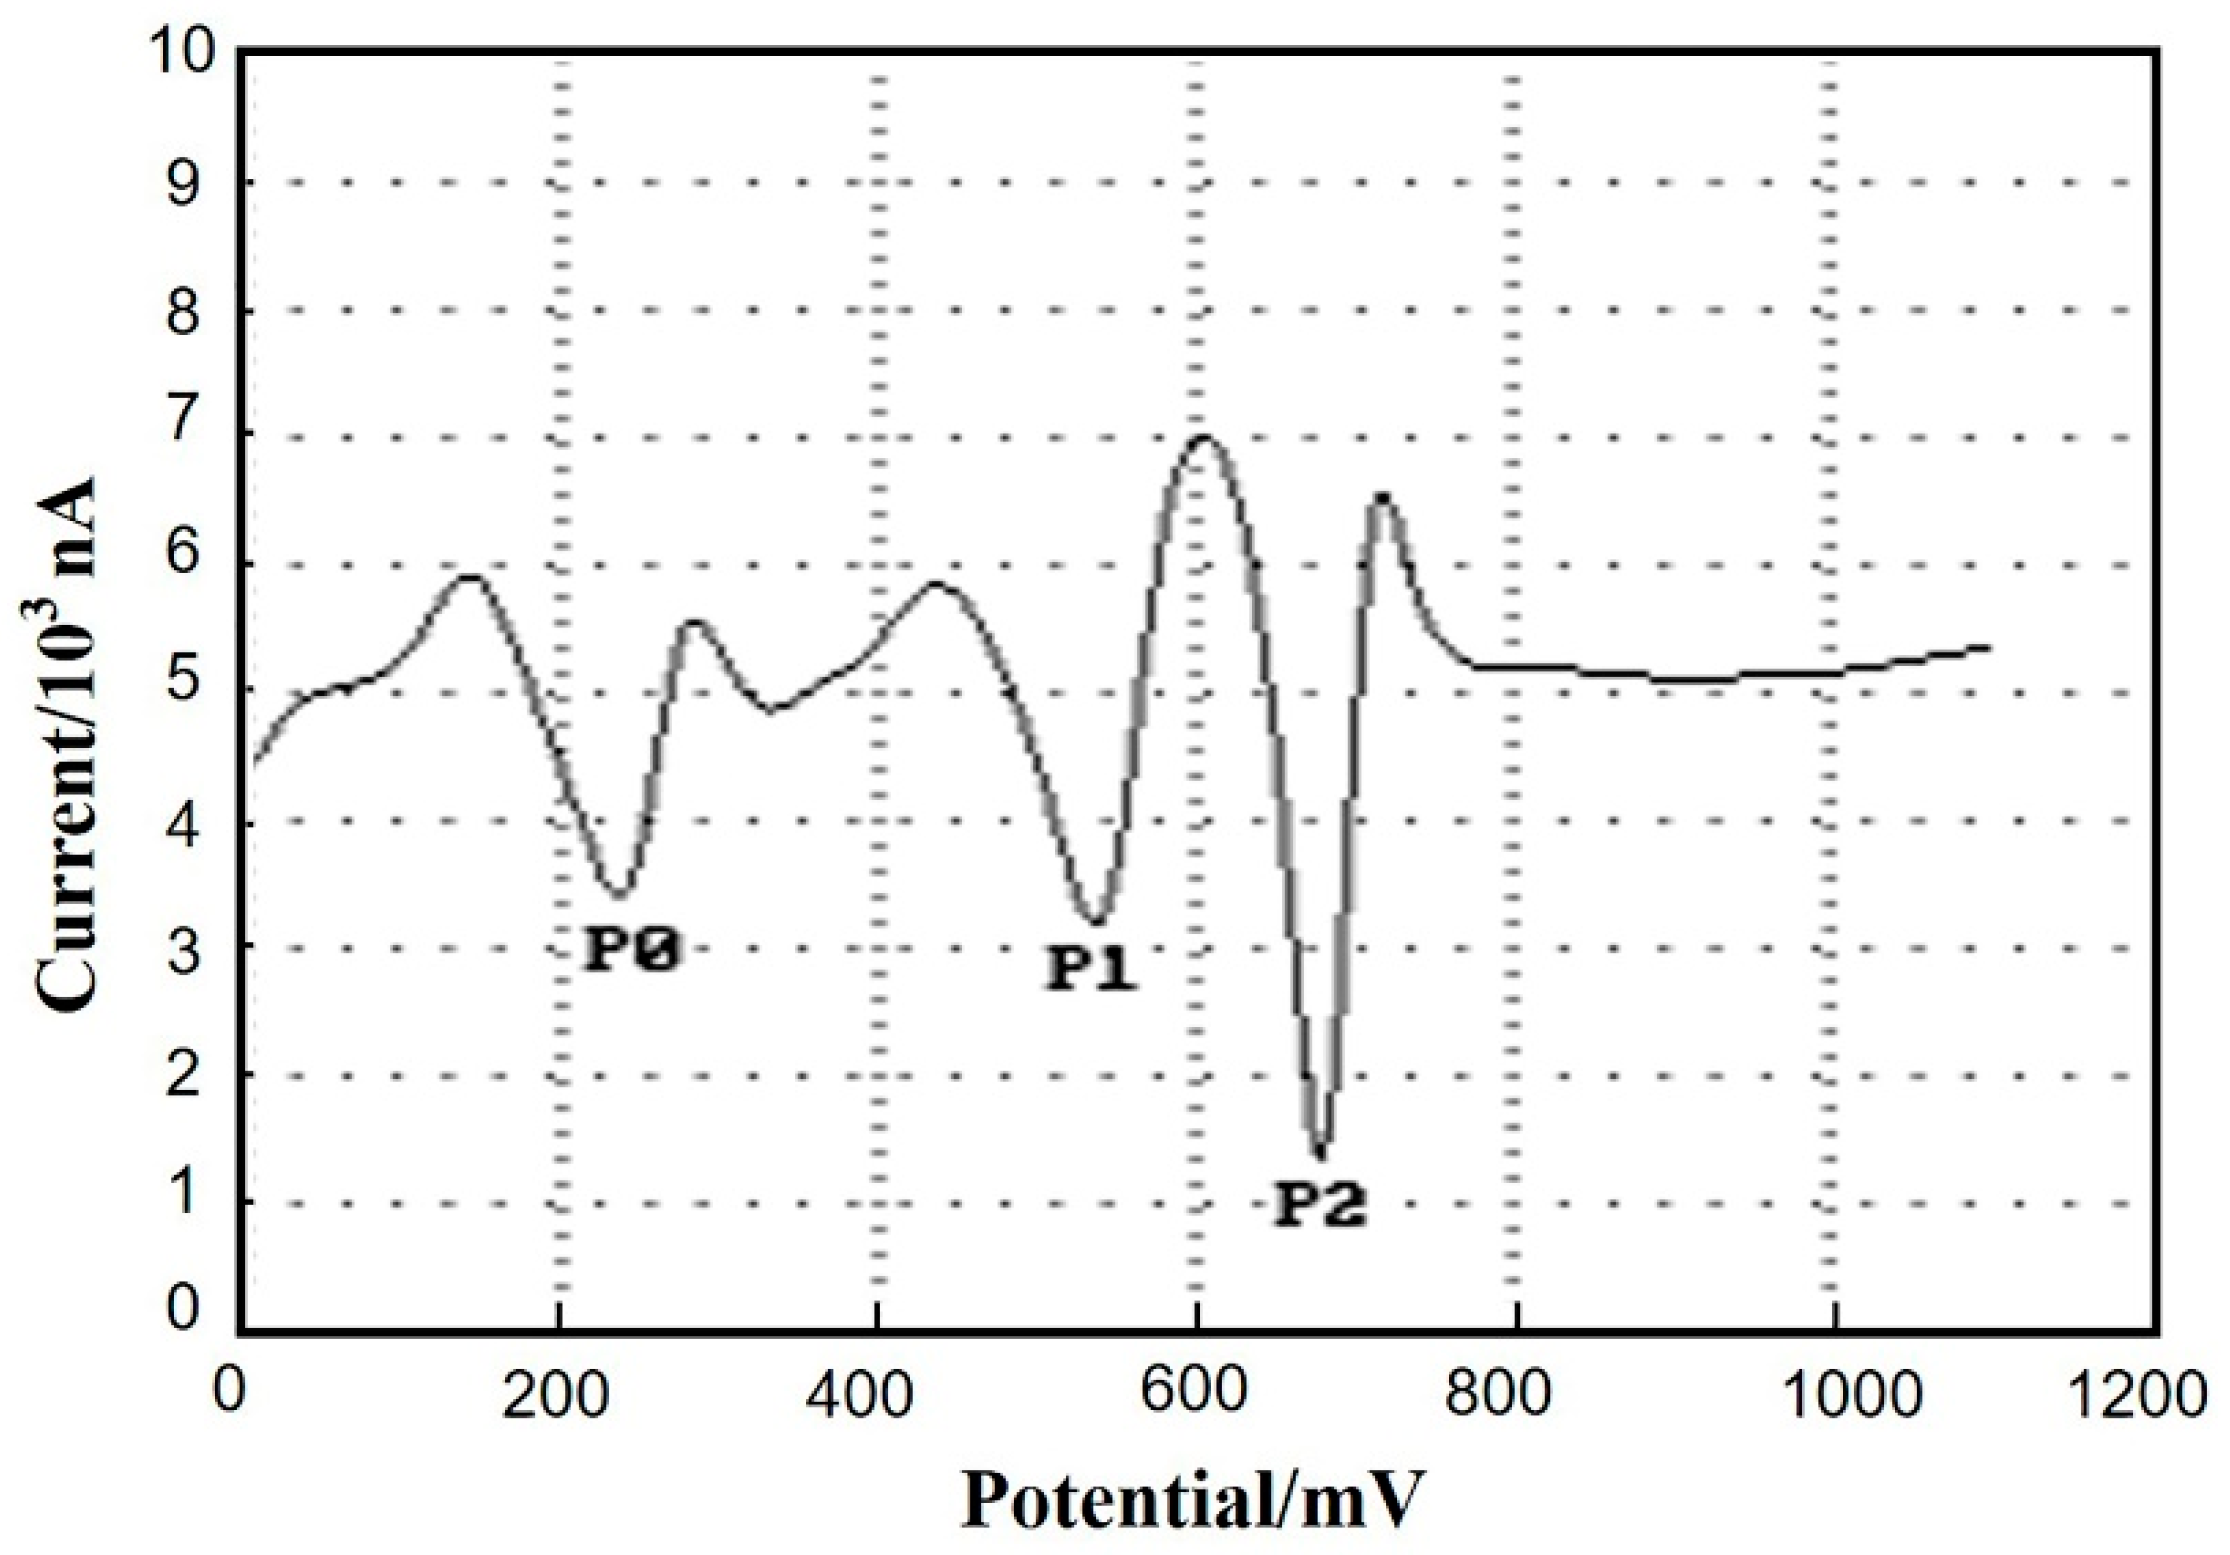
3.6. Interference Studies

As is well known, the DA detection is seriously interfered by AA and UA in human body, since AA and UA often coexist simultaneously in the human body and their response peaks overlap easily. The current responses of DA (2 × 10⁻⁵ mol/L), AA (1 × 10⁻⁵ mol/L), and UA (1 × 10⁻⁵ mol/L) are investigated by SDLSV method in this section. Considering its high resolution and good sensitivity, the SDLSV technique was used for simultaneous detection of DA, AA, and UA. As shown in Figure 8, the oxidation peak currents of AA, DA, and UA are separated each other evidently. P0, P1, and P2 are the peak potentials of AA, DA, and UA, respectively. The potential difference (∆Ep) between AA and DA is 204 mV, and the ∆Ep between DA and UA is 144 mV. Moreover, the intensity of oxidation peak current of DA is still prominent and stable even under the interference of AA and UA. This result indicates that the proposed Cu2O-RGO/GCEs possess good selectivity and anti-interference property due to the synergistic effects of Cu2O-RGO nanocomposities.

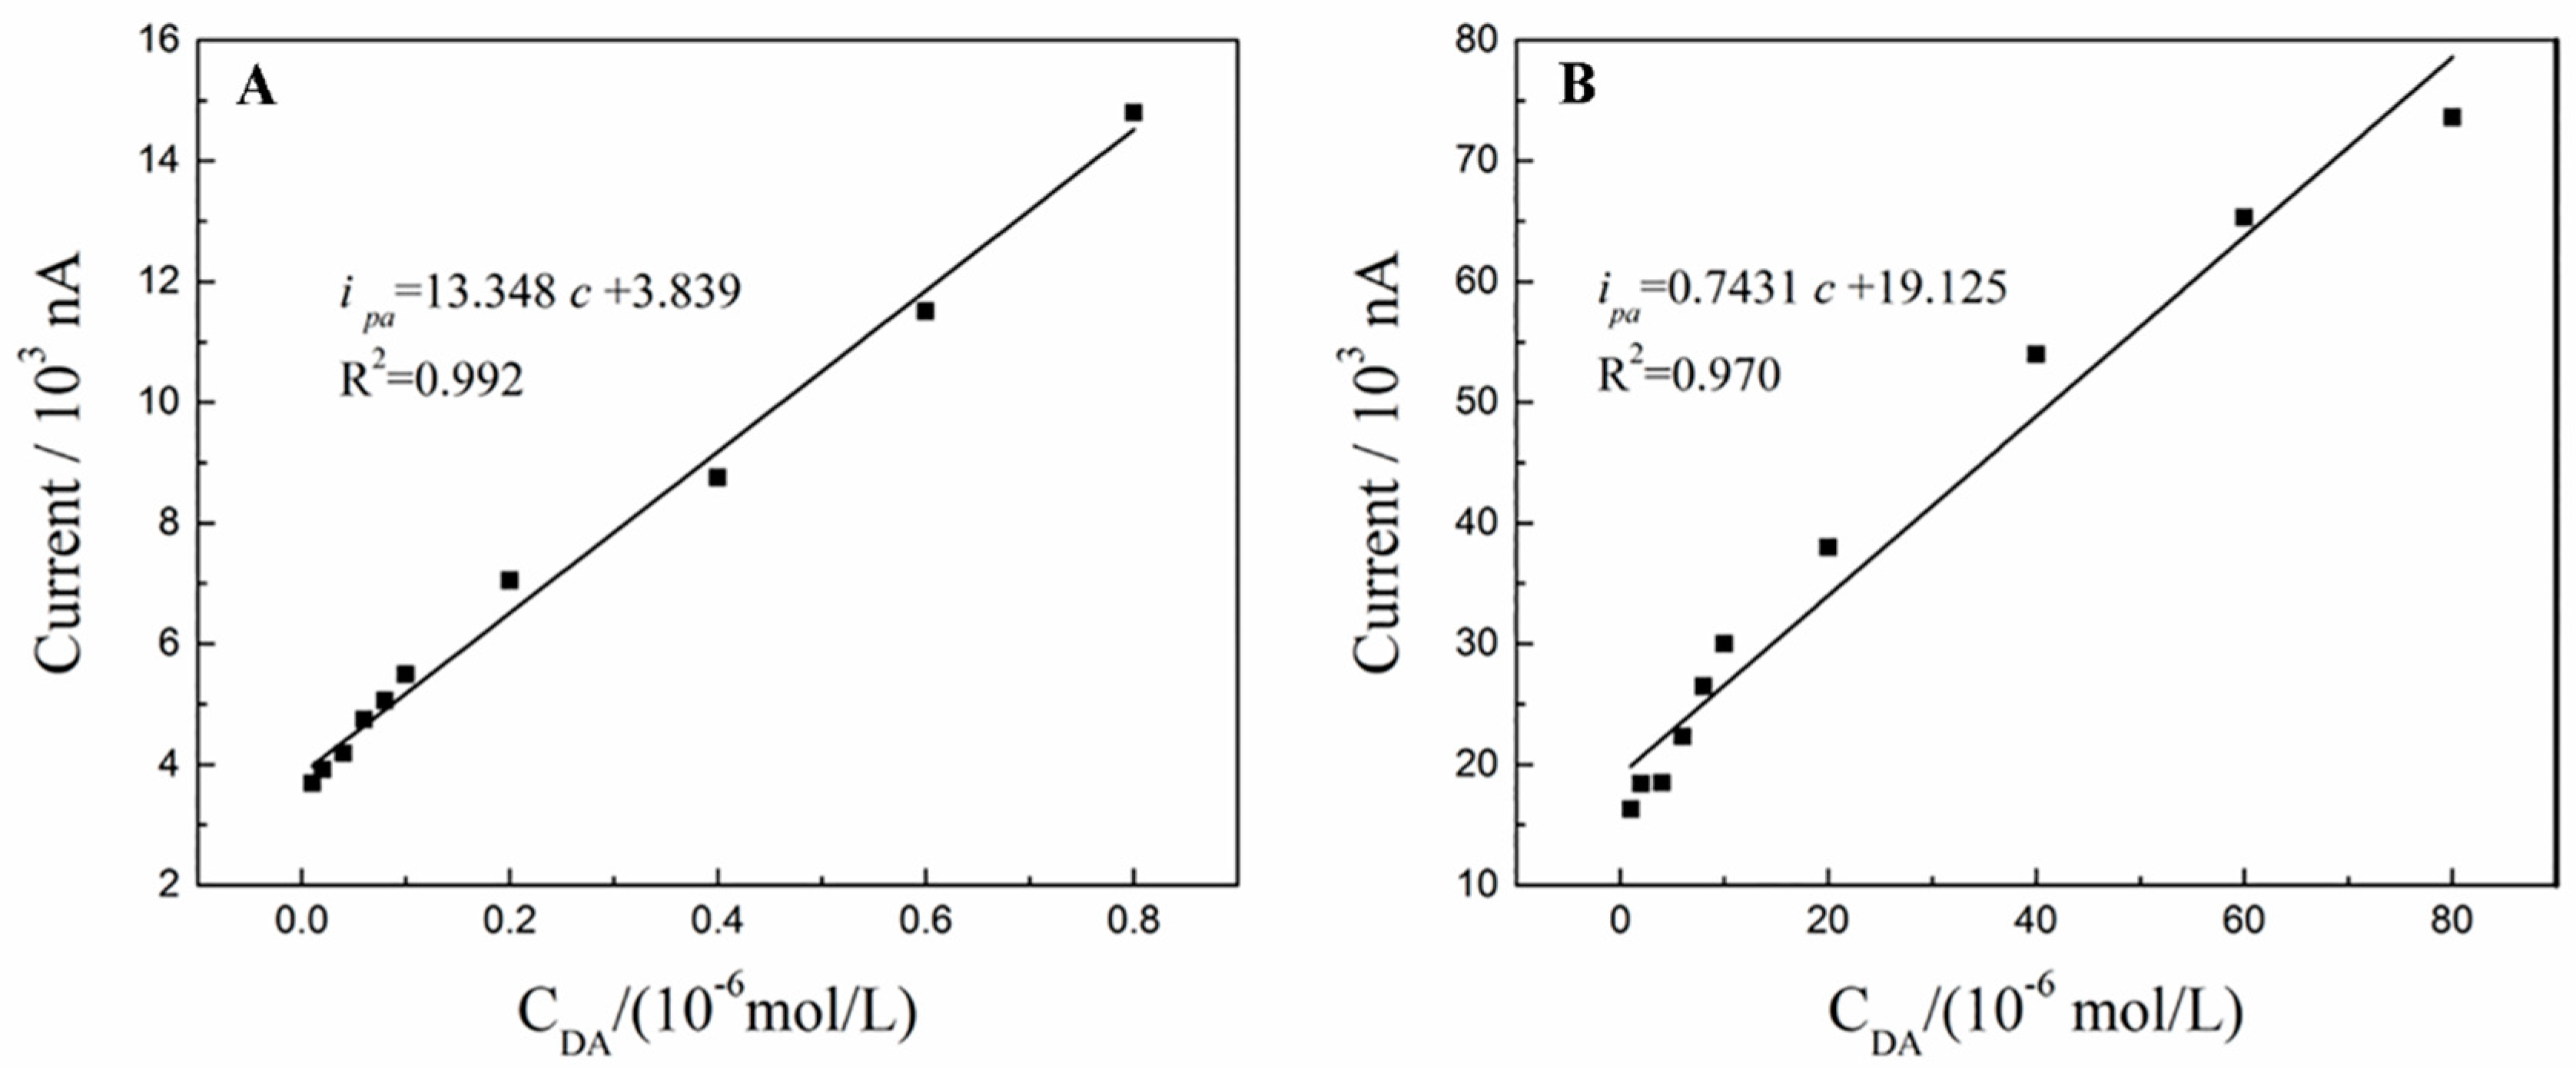
3.7. Calibration Curve and Detection Limit

The quantitative analysis of DA is carried out under the optimal detection conditions. The oxidation peak currents ipa increase as the concentration of DA increases from 1 × 10⁻⁸ mol/L to 1 × 10⁻⁶ mol/L, and the linear relationship between oxidation peak currents ipa and the concentration of DA is obtained as ipa (103 nA) = 13.348 c + 3.839 (R2 = 0.992) (Figure 9A). Furthermore, when the concentration of DA ranges from 1 × 10⁻⁶ mol/L to 8 × 10⁻⁵ mol/L, another linear relationship between oxidation peak currents ipa and the concentration of DA is also obtained as ipa = 0.7431 c + 19.125 (R2 = 0.970) (Figure 9B). ipa is oxidation peak currents, and the unit is 103 nA. c is the concentration of DA, and the unit is 10−6 mol/L. The detection limit (S/N = 3) is estimated as 6.0 × 10⁻⁹ mol/L. The wider linear range and lower detection limit are obtained as compared with previous literature reports [35,36,37,38,39,40] as summarized in Table 1.

3.8. Practical Applications

SDLSV is an extensively used electrochemical technique for biomolecules detection due to its high resolution and sensitivity. Thus, the dopamine hydrochloride injection sample with various concentration was measured by using SDLSV under the optimal conditions. The results of these detections are listed in Table 2, the detection values of DA are well consistent with standard values, and the RSD is −3.20~1.12%. The recovery rate is 96.5~104.4%. These results suggest that the Cu2O-RGO/GCE could be used for DA detection of real samples.

4. Conclusions

In summary, the proposed Cu2O-RGO/GCE are successfully used for DA detection. The optimal reduction conditions for the Cu2O-RGO/GCE fabrication are as follows: reduction potential is −1.5 V, and reduction time is 120 s. After the electrochemical reduction, the Cu2O NPs is observed with well-coated RGO. Moreover, the electrochemical oxidation process of DA occurred on the Cu2O-RGO/GCE is an adsorption-controlled process. The oxidation peaks of AA, DA, and UA are well separated, suggesting high selectivity for DA detection. The Cu2O-RGO/GCE have wide linear range (1 × 10⁻⁸ mol/L~1 × 10−6 mol/L and 1 × 10⁻⁶ mol/L~8 × 10−5 mol/L), and a low detection limit (S/N = 3) of 6.0 × 10⁻⁹ mol/L. Finally, these modified GCE are successfully used for detection of DA in dopamine hydrochloride injections. The facile fabrication in conjunction with rapid response, the low detection limit, and the wide linear range for DA sensing is the advantage of this paper.

Acknowledgments

This work was supported by the NSFC (61703152), Hunan Provincial Natural Science Foundation (2016JJ4010), the doctoral construction program of Hunan University of Technology, Project of Science and Technology Department of Hunan Province (GD16K02), and Zhuzhou Science and Technology Plans (201707-201806).

Author Contributions

Quanguo He and Peihong Deng designed the experiments; Jun Liu and Jing Liang performed the experiments; Guangli Li and Xiaopeng Liu analyzed the data; Quanguo He contributed reagents/materials/analysis tools; Jun Liu and Guangli Li wrote the paper.

Conflicts of Interest

The authors declare no conflict of interest.

References

  1. Liu, A.; Honma, I.; Zhou, H. Amperometric biosensor based on tyrosinase-conjugated polysacchride hybrid film: Selective determination of nanomolar neurotransmitters metabolite of 3,4-dihydroxyphenylacetic acid (DOPAC) in biological fluid. Biosens. Bioelectron. 2005, 21, 809–816. [Google Scholar] [CrossRef] [PubMed]
  2. Ensafi, A.A.; Taei, M.; Khayamian, T.; Arabzadeh, A. Highly selective determination of ascorbic acid, dopamine, and uric acid by differential pulse voltammetry using poly (sulfonazo III) modified glassy carbon electrode. Sens. Actuators B: Chem. 2010, 147, 213–221. [Google Scholar] [CrossRef]
  3. Revin, S.B.; John, S.A. Highly sensitive determination of uric acid in the presence of major interferents using a conducting polymer film modified electrode. Bioelectrochemistry 2012, 88, 22–29. [Google Scholar] [CrossRef] [PubMed]
  4. Moghadam, M.R.; Dadfarnia, S.; Shabani, A.M.H.; Shahbazikhah, P. Chemometric-assisted kinetic–spectrophotometric method for simultaneous determination of ascorbic acid, uric acid, and dopamine. Anal. Biochem. 2011, 410, 289–295. [Google Scholar] [CrossRef] [PubMed]
  5. Li, Y.; Lin, X. Simultaneous electroanalysis of dopamine, ascorbic acid and uric acid by poly (vinyl alcohol) covalently modified glassy carbon electrode. Sens. Actuators B: Chem. 2006, 115, 134–139. [Google Scholar] [CrossRef]
  6. Ulubay, Ş.; Dursun, Z. Cu nanoparticles incorporated polypyrrole modified GCE for sensitive simultaneous determination of dopamine and uric acid. Talanta 2010, 80, 1461–1466. [Google Scholar] [CrossRef] [PubMed]
  7. Tian, X.; Cheng, C.; Yuan, H.; Du, J.; Xiao, D.; Xie, S.; Choi, M.M.F. Simultaneous determination of l-ascorbic acid, dopamine and uric acid with gold nanoparticles–β-cyclodextrin–graphene-modified electrode by square wave voltammetry. Talanta 2012, 93, 79–85. [Google Scholar] [CrossRef] [PubMed]
  8. Habibi, B.; Pournaghi-Azar, M.H. Simultaneous determination of ascorbic acid, dopamine and uric acid by use of a MWCNT modified carbon-ceramic electrode and differential pulse voltammetry. Electrochim. Acta 2010, 55, 5492–5498. [Google Scholar] [CrossRef]
  9. Yang, S.; Li, G.; Yin, Y.; Yang, R.; Li, J.; Qu, L. Nano-sized copper oxide/multi-wall carbon nanotube/Nafion modified electrode for sensitive detection of dopamine. J. Electroanal. Chem. 2013, 703, 45–51. [Google Scholar] [CrossRef]
  10. Fu, L.; Zheng, Y.; Wang, A.; Cai, W.; Deng, B.; Zhang, Z. An Electrochemical Sensor Based on Reduced Graphene Oxide and ZnO Nanorods-Modified Glassy Carbon Electrode for Uric Acid Detection. Arabian J. Sci. Eng. 2016, 41, 135–141. [Google Scholar] [CrossRef]
  11. Wu, D.; Li, Y.; Zhang, Y.; Wang, P.; Wei, Q.; Du, B. Sensitive electrochemical sensor for simultaneous determination of dopamine, ascorbic acid, and uric acid enhanced by amino-group functionalized mesoporous Fe3O4@graphene sheets. Electrochim. Acta 2014, 116, 244–249. [Google Scholar] [CrossRef]
  12. Sajid, M.; Nazal M, K.; Mansha, M.; Mansha, M.; Alsharaa, A.; Jillani S M, S.; Basheeret, C. Chemically modified electrodes for electrochemical detection of dopamine in the presence of uric acid and ascorbic acid: A review. TrAC Trends Anal. Chem. 2016, 76, 15–29. [Google Scholar] [CrossRef]
  13. Krystyna, J.; Pawel, K. New trends in the electrochemical sensing of dopamine. Anal. Bioanal. Chem. 2013, 405, 3753–3771. [Google Scholar]
  14. Hasanzadeh, M.; Shadjou, N.; Guardia, M.D.L. Current advancement in electrochemical analysis of neurotransmitters in biological fluids. TrAC Trends Anal. Chem. 2016, 86, 107–121. [Google Scholar] [CrossRef]
  15. Chatterjee, S.; Pal, A.J. Introducing Cu2O thin films as a hole-transport layer in efficient planar perovskite solar cell structures. J. Phys. Chem. C. 2016, 120, 1428–1437. [Google Scholar] [CrossRef]
  16. Liu, Y.; Zhang, B.; Luo, L.; Chen, X.; Wang, Z.; Wu, E.; Su, D.; Huang, W. TiO2/Cu2O core/ultrathin shell nanorods as efficient and stable photocatalysts for water reduction. Angew. Chem. Int. Ed. 2015, 54, 15260–15265. [Google Scholar] [CrossRef] [PubMed]
  17. Gao, Z.; Liu, J.; Chang, J.; Wu, D.; He, J.; Wang, K.; Xu, F.; Jiang, K. Mesocrystalline Cu2O hollow nanocubes: synthesis and application in non-enzymatic amperometric detection of hydrogen peroxide and glucose. CrystEngComm 2012, 14, 6639–6646. [Google Scholar] [CrossRef]
  18. Albo, J.; Irabien, A. Cu2O-loaded gas diffusion electrodes for the continuous electrochemical reduction of CO2 to methanol. J. Catal. 2015, 343, 232–239. [Google Scholar] [CrossRef]
  19. Albo, J.; Sáez, A.; Garikoitz, B.; Castañoa, P.; Irabienb, A. Methanol electrosynthesis from CO2 at Cu2O/ZnO prompted by pyridine-based aqueous solutions pyridine-based aqueous solutions. J. CO2 Util. 2017, 18, 164–172. [Google Scholar] [CrossRef]
  20. Schizodimou, A.; Kyriacou, G. Acceleration of the reduction of carbon dioxide in the presence of multivalent cations. Electrochim. Acta 2012, 78, 171–176. [Google Scholar] [CrossRef]
  21. Pumera, M.; Ambrosi, A.; Bonanni, A.; Chng, E.L.K.; Poh, H.L. Graphene for electrochemical sensing and biosensing. TrAC Trends Anal. Chem. 2010, 29, 954–965. [Google Scholar] [CrossRef]
  22. Shao, Y.; Wang, J.; Wu, H.; Lin, Y. Graphene Based Electrochemical Sensors and Biosensors: A Review. Electroanalysis 2010, 22, 1027–1036. [Google Scholar] [CrossRef]
  23. Zhang, R.; Chen, W. Recent advances in graphene-based nanomaterials for fabricating electrochemical hydrogen peroxide sensors. Biosens. Bioelectron. 2017, 89, 249–268. [Google Scholar] [CrossRef] [PubMed]
  24. Zhou, D.; Feng J Cai, L.; Fang, Q.; Chen, J.; Wang, A. Facile synthesis of monodisperse porous Cu2O nanospheres on reduced graphene oxide for non-enzymatic amperometric glucose sensing. Electrochim. Acta 2014, 115, 103–108. [Google Scholar] [CrossRef]
  25. Mei, L.; Song, P.; Feng, J.; Shen, J.; Wang, W.; Wang, A. Nonenzymatic amperometric sensing of glucose using a glassy carbon electrode modified with a nanocomposite consisting of reduced graphene oxide decorated with Cu2O. Microchim. Acta 2015, 182, 1701–1708. [Google Scholar] [CrossRef]
  26. Jiang, B.; Wei, X.; Wu, F.; Wu, K.; Chen, L.; Yuan, G.; Dong, C.; Ye, Y. A non-enzymatic hydrogen peroxide sensor based on a glassy carbon electrode modified with cuprous oxide and nitrogen-doped graphene in a nafion matrix. Microchim. Acta 2014, 181, 1463–1470. [Google Scholar] [CrossRef]
  27. Bahr, J.L.; Yang, J.; Kosynkin, D.V.; Bronikowski, M.J.; Smalley, R.E.; Tour, J.M. Functionalization of carbon nanotubes by electrochemical reduction of aryl diazonium salts: a bucky paper electrode. J. Am. Chem. Soc. 2001, 123, 6536–6542. [Google Scholar] [CrossRef] [PubMed]
  28. Deng, P.; Xu, Z.; Zeng, R.; Ding, C. Electrochemical behavior and voltammetric determination of vanillin based on an acetylene black paste electrode modified with graphene–polyvinylpyrrolidone composite film. Food Chem. 2015, 180, 156–163. [Google Scholar] [CrossRef] [PubMed]
  29. Deng, P.; Xu, Z.; Feng, Y. Acetylene black paste electrode modified with graphene as the voltammetric sensor for selective determination of tryptophan in the presence of high concentrations of tyrosine. Mater. Sci. Eng. C 2014, 35, 54–60. [Google Scholar] [CrossRef] [PubMed]
  30. Deng, P.; Xu, Z.; Li, J. Simultaneous voltammetric determination of 2-nitrophenol and 4-nitrophenol based on an acetylene black paste electrode modified with a graphene-chitosan composite. Microchim. Acta 2014, 181, 1077–1084. [Google Scholar] [CrossRef]
  31. Deng, P.; Xu, Z.; Kuang, Y. Electrochemically reduced graphene oxide modified acetylene black paste electrode for the sensitive determination of bisphenol A. J. Electroanal. Chem. 2013, 707, 7–14. [Google Scholar] [CrossRef]
  32. Hummers, W.S., Jr.; Offeman, R.E. Preparation of graphitic oxide. J. Am. Chem. Soc. 1958, 80, 1339. [Google Scholar] [CrossRef]
  33. Xu, F.; Deng, M.; Li, G.; Chen, S.; Wang, L. Electrochemical behavior of cuprous oxide–reduced graphene oxide nanocomposites and their application in nonenzymatic hydrogen peroxide sensing. Electrochim. Acta 2013, 88, 59–65. [Google Scholar] [CrossRef]
  34. Yogeswaran, U.; Chen, S.-M. Multi-walled carbon nanotubes with poly (methylene blue) composite film for the enhancement and separation of electroanalytical responses of catecholamine and ascorbic acid. Sens. Actuators B Chem. 2008, 130, 739–749. [Google Scholar] [CrossRef]
  35. Liu, M.; Chen, Q.; Lai, C.; Zhang, Y.; Deng, J.; Li, H.; Yao, S. A double signal amplification platform for ultrasensitive and simultaneous detection of ascorbic acid, dopamine, uric acid and acetaminophen based on a nanocomposite of ferrocene thiolate stabilized Fe3O4@Au nanoparticles with graphene sheet. Biosens. Bioelectron. 2013, 48, 75–81. [Google Scholar] [CrossRef] [PubMed]
  36. Bagheri, H.; Afkhami, A.; Hashemi, P.; Ghanei, M. Simultaneous and sensitive determination of melatonin and dopamine with Fe3O4 nanoparticle-decorated reduced graphene oxide modified electrode. RSC Adv. 2015, 5, 21659–21669. [Google Scholar] [CrossRef]
  37. Yao, Z.; Yang, X.; Niu, Y.; Wu, F.; Hu, Y.; Yang, Y. Voltammetric dopamine sensor based on a gold electrode modified with reduced graphene oxide and Mn3O4 on gold nanoparticles. Microchim. Acta 2017, 184, 2081–2088. [Google Scholar] [CrossRef]
  38. Wang, Z.; Tang, J.; Zhang, F. Elimination of ascorbic acid and sensitive detection of uric acid at the MnO2 nanorods/graphene-based modified electrode. Int. J. Electrochem. Sci. 2013, 2031, 9967–9976. [Google Scholar]
  39. Liu, S.Q.; Ouyang, G.W.; Dai, G.P.; Luo, T.X.; Liang, Y. Preparation of Nickel Oxide-Reduced Graphene Oxide Nanocomposite Modified Glassy Carbon Electrode and Its Application for the Determination of Dopamine. J. Anal. Sci. 2014, 30, 853–857. [Google Scholar]
  40. He, F.Y.; Liu, M.S.; Zhu, Z.F.; Yang, F.Z.; Sun, G.Y. Electrochemical Behavior and Determination of Dopamine at ZnO Nanorods Intercalated Graphite Modified Electrode. Chin. J. Appl. Chem. 2011, 28, 320–325. [Google Scholar]
Figure 1. SEM images of RGO (A), Cu2O (B) and Cu2O-RGO composite nanoparticles (C).
Sensors 18 00199 g001
Figure 2. Cyclic voltammograms (A) and Nyquist plots (B) of bare GCE, RGO, or Cu2O-RGO-modified GCEs in 5 × 10⁻³ mol/L [Fe(CN)6]3−/4− solution. The CVs was recorded in 0.1 M PBS (pH = 3.5) at the scan rate of 100 mV/s. The Nyquist plots was measured with alternating current (AC) amplitude of 5 mV, from 1 × 10⁵ Hz to 0.1 Hz at their open circuit voltage.
Sensors 18 00199 g002
Figure 3. Optimization of reduction potential (A) and reduction time (B) for electrochemical reduction of Cu2O-GO nanocomposites.
Sensors 18 00199 g003
Figure 4. Cyclic voltamogramms obtain for 1 × 10⁻⁵ mol/L dopamine on bare GCE, RGO/GCE, and Cu2O-RGO/GCE in the presence of 0.1 M PBS (pH = 3.5) as supporting electrolyte. Scan rate: 0.1 V/s.
Sensors 18 00199 g004
Figure 5. (A) The effect of pH on the oxidation peak current of 1 × 10⁻⁵ mol/L DA; and (B) the linear relationship between oxide peak potential and pH.
Sensors 18 00199 g005
Figure 6. The effect of accumulation potential (A) and accumulation time (B) on the oxidation peak current of 1 × 10⁻⁵ mol/L DA.
Sensors 18 00199 g006
Figure 7. The effect of scan rate (v) on the peak current of 1 × 10⁻⁵ mol/L DA. (A) CVs of 1 × 10⁻⁵ mol/L DA on the Cu2O-RGO/GCE recorded in 0.1 M PBS with different scan rates (v); and (B) linear relationship between peak currents and scan rate (v).
Sensors 18 00199 g007
Figure 8. The SDLSV of DA (1 × 10⁻⁵ mol/L) on the Cu2O-RGO/GCE in the presence of AA (1 × 10⁻⁵ mol/L), and UA (1 × 10⁻⁵ mol/L). P0, P1, and P2 denotes the peak potentials of AA, DA, and UA, respectively. Scan potential range: 0~1.1 V; scan rate: 100 mV/s; supporting electrolytes: 0.1 M PBS.
Sensors 18 00199 g008
Figure 9. The linear relationship between the oxidation peak ipa and the concentration of DA in the range of 1 × 10⁻⁸ mol/L~1 × 10−6 mol/L (A) and 1 × 10⁻⁶ mol/L~8 × 10−5 mol/L (B).
Sensors 18 00199 g009
Table 1. Comparison the determination of DA between Cu2O-RGO/GCE and modified electrodes reported in the literature.
Modified ElectrodesLinear Range (M)Detection Limit (M)
Cu2O-RGO/GCE1 × 10−8~1 × 10⁻⁶; 1 × 10⁻⁶~8 × 10−56.0 × 10−9
Fe3O4@Au-Gr/GCE [35]5 × 10⁻⁷~5 × 10−56.5 × 10−7
Fe3O4-RGO/CPE [36]2 × 10⁻⁸~5.8 × 10−66.5 × 10−9
Mn3O4-RGO/GCE [37]1 × 10⁻⁶~1.45 × 10−32.5 × 10−7
MnO2 NR-RGO/GCE [38]5 × 10⁻⁸~4 × 10−41.0 × 10−8
NiO-RGO/GCE [39]5 × 10⁻⁷~3.2 × 10−53.8 × 10−8
ZnO NR-RGO/Graphite [40]5 × 10⁻⁷~1 × 10−42.5 × 10−7
Table 2. The results of determination of dopamine hydrochloride injections (n = 4).
No.Standard Value (μM)Determination Value (μM)Added (μM)Total FoundRecovery (%)RSD (%)
113.1412.7210.0023.16104.4−3.20
227.6327.9430.0056.9196.51.12
348.6247.3850.0096.7798.8−2.25

