Article

A DFT Calculation of Fluoride-Doped TiO2 Nanotubes for Detecting SF6 Decomposition Components

1
State Key Laboratory of Power Transmission Equipment & System Security and New Technology, Chongqing University, Chongqing 400044, China
2
School of Electrical Engineering, Wuhan University, Wuhan 430072, China
*
Author to whom correspondence should be addressed.
Sensors 2017, 17(8), 1907; https://doi.org/10.3390/s17081907
Submission received: 21 July 2017 / Revised: 14 August 2017 / Accepted: 16 August 2017 / Published: 18 August 2017
(This article belongs to the Section Physical Sensors)

Abstract

:
Gas insulated switchgear (GIS) plays an important role in the transmission and distribution of electric energy. Detecting and analyzing the decomposed components of SF6 is one of the important methods to realize the on-line monitoring of GIS equipment. In this paper, considering the performance limits of intrinsic TiO2 nanotube gas sensor, the adsorption process of H2S, SO2, SOF2 and SO2F2 on fluoride-doped TiO2 crystal plane was simulated by the first-principle method. The adsorption mechanism of these SF6 decomposition components on fluorine-doped TiO2 crystal plane was analyzed from a micro perspective. Calculation results indicate that the order of adsorption effect of four SF6 decomposition components on fluoride-doped TiO2 crystal plane is H2S > SO2 > SOF2 > SO2F2. Compared with the adsorption results of intrinsic anatase TiO2 (101) perfect crystal plane, fluorine doping can obviously enhance the adsorption ability of TiO2 (101) crystal plane. Fluorine-doped TiO2 can effectively distinguish and detect the SF6 decomposition components based on theoretical analysis.

1. Introduction

Gas insulated switchgear (GIS), with benefits such as small land cover, flexible configuration, high safety, and high reliability, has been widely used in the power system [1]. However, during the long-term operation of GIS equipment, the internal insulation defects may cause partial discharge (PD). SF6 insulating gas in the GIS will decompose into some types of gases like SO2, H2S, SOF2, SO2F2 [2,3,4,5] under the effect of PD. With the decomposition of SF6, aging of GIS equipment and corrosion of metal surface will be accelerated, which ultimately may lead to breakdown of GIS equipment, affecting the stable operation of the power system [6]. Therefore, it is of great importance to detect the SF6 decomposition components in GIS equipment. On one hand, the type of PD can be confirmed by the types of decomposition components; on the other hand, by measuring the contents of decomposition, the level of PD can be determined, even the aging degree of GIS equipment. Therefore, through the monitoring of decomposition components, unnecessary losses can be reduced by timely taking precaution and preventing the breakdown of GIS equipment.
At present, utilizing the gas sensor method to achieve the goal of detecting SF6 decomposition components has advantages of a small detection unit, easy installation process, fast detection speed, and so on. Therefore, it is of great importance to study gas sensitive response of the gas sensors made of different gas-sensing materials. Our team studied the gas-sensing materials such as carbon nanotubes and graphene [7,8,9,10,11,12]. However, it is in the early stage of research, and further research needs to be conducted. At the same time, with the technology of TiO2 nanotube preparation becoming mature, the TiO2 nanotube gas sensor has advantages of high specific surface area and high symmetry, which makes it a research hotspot in the gas detection field. However, the inherent energy gap of TiO2 is comparatively large (more than 3.0 eV), which hinders its wide development. Research shows that the surface of TiO2 nanotubes can be modified by nonmetallic doping to improve its photosensitive, photocatalytic and other properties. Varghese et al [13,14] sputtered a layer of 10 nm thick of Pd on the surface of TiO2 nanotubes by thermal evaporation, which can improve the sensitivity of TiO2 nanotube gas sensor, and reduce the recovery time. More importantly, the improved sensor can detect H2 at room temperature. At present, the study of nitrogen doping in nonmetallic doping has received the most attention [15,16,17,18,19]. The results show that nitrogen doping can reduce the energy gap of TiO2, which makes the electrons in the valence band transition more easily. In addition, many studies have reported that TiO2 is modified by fluorine doping [20,21,22,23]. Fluorine doping does not basically change the size of the TiO2 energy gap, but it can promote the generation of oxygen hole defects, increase the surface acidity and Ti3+, which is beneficial to reducing the recombination rate of electron hole pairs, and thereby improving the photocatalytic activity [24].
With the successful doping of fluorine onto the surface of TiO2 [20,25,26], the study of application of fluorine-doped TiO2 nanomaterials in gas sensing detection is deficient. In this paper, the idea of using fluorine-doped TiO2 nanotubes gas sensor to detect SF6 decomposition components was determined. The adsorption process of H2S, SO2, SOF2 and SO2F2 gas molecules onto fluorine-doped anatase TiO2 (101) perfect crystal plane by first-principle calculation. The calculation parameters include adsorption energy, adsorption distance, charge transfer amount and the density of states. The simulation analysis can provide insight for the practical explanation of fluorine-doped TiO2 nanometer array gas sensor detecting SF6 decomposition gases from the microscopic point of view. Finally, the adsorption results of SO2, SOF2 and SO2F2 under different doping conditions were compared in this paper.

2. Calculation Parameters and Methods

The TiO2 model in this paper is an anatase TiO2 (101) perfect facet model derived directly from the database provided by Materials Studio software, and the size is 3.776 × 3.776 × 9.486 Å, which is the smallest unit of anatase TiO2. The detailed calculation process is as follows: build the anatase TiO2 (101) perfect crystal plane 2 × 2 super-cell model, and the gas molecules of SO2, H2S, SOF2 and SO2F2; optimize these models initially in the Dmol3 module, which can make these micro-structure parameters to maximumly close to the idealization, as shown in Figure 1.; replace one of the O atoms on the surface of the anatase TiO2 (101) perfect crystal plane by F atom; After optimized treatment, the fluorine doped anatase TiO2 (101) perfect crystal plane supercell model (F-doped TiO2) is obtained, as shown in Figure 2; finally, the optimized SO2, H2S, SOF2 and SO2F2 gas molecules with different postures approach respectively close to the surface of the perfect crystal plane of the anatase TiO2 (101) to get a different adsorption system. Different adsorption systems were optimized in order to find a more stable adsorption structure for each gas molecule onto F-doped TiO2.
In this paper, parameters are set as follows when optimizing the calculation. Since the number of atoms contained in the perfect crystal plane model of the anatase TiO2 (101) established in this paper is large, the generalized gradient approximate (GGA) with high calculation accuracy was adopted so as to make the calculated physical and chemical characteristics of the different adsorption system more accurate. The exchange and correlation interaction effect between electrons were represented by the Perdew-Burke-Ernzerhof (PBE) function [27]. The energy convergence tolerance and the energy gradient (max. force) are set to 1.0 × 10⁻⁵ Ha and 0.002 Ha/Å respectively. The atomic displacement (max. displacement) is set to 0.005 Å. The convergence accuracy of the self-consistent field charge density (SCF tolerance) is set to 1.0 × 10⁻⁶ Ha, Brillouin k-point grid (k-point) is set to 2 × 2 × 1; the double Numeric Basis with Polarization (DNP) was used in the atomic orbits calculation with d, p orbital polarization function at the same time so as to make the results more accurate. Considering the influence of the dispersion force, that is, the van der Waals force, the DFT-D (Grimme) algorithm was utilized; in order to improve the efficiency of computation, the direct inversion of iterative subspace (DIIS) is used to improve the convergence rate of the charge density of the self-consistent field.

3. Simulation Results and Analysis

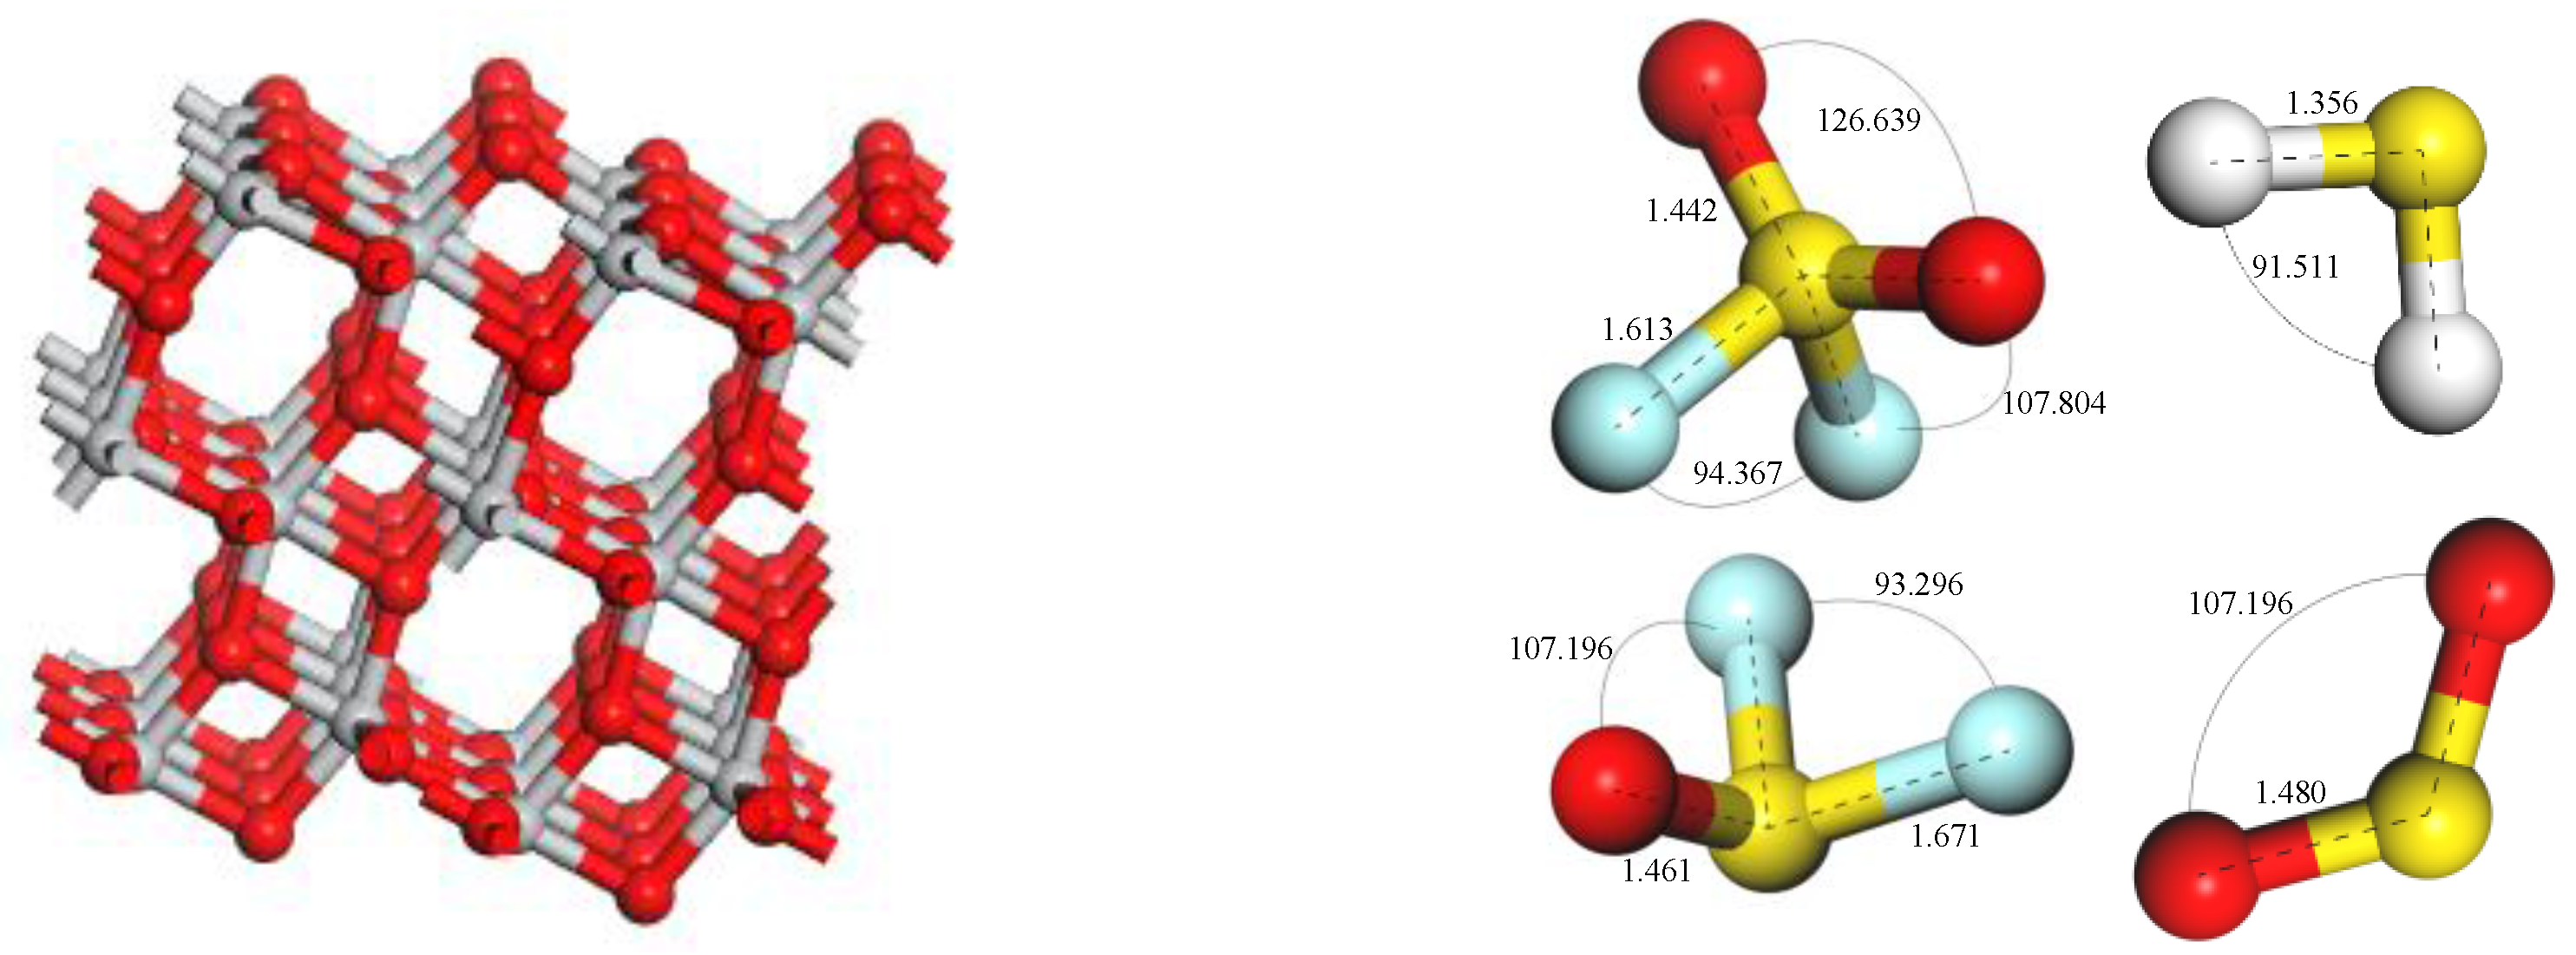
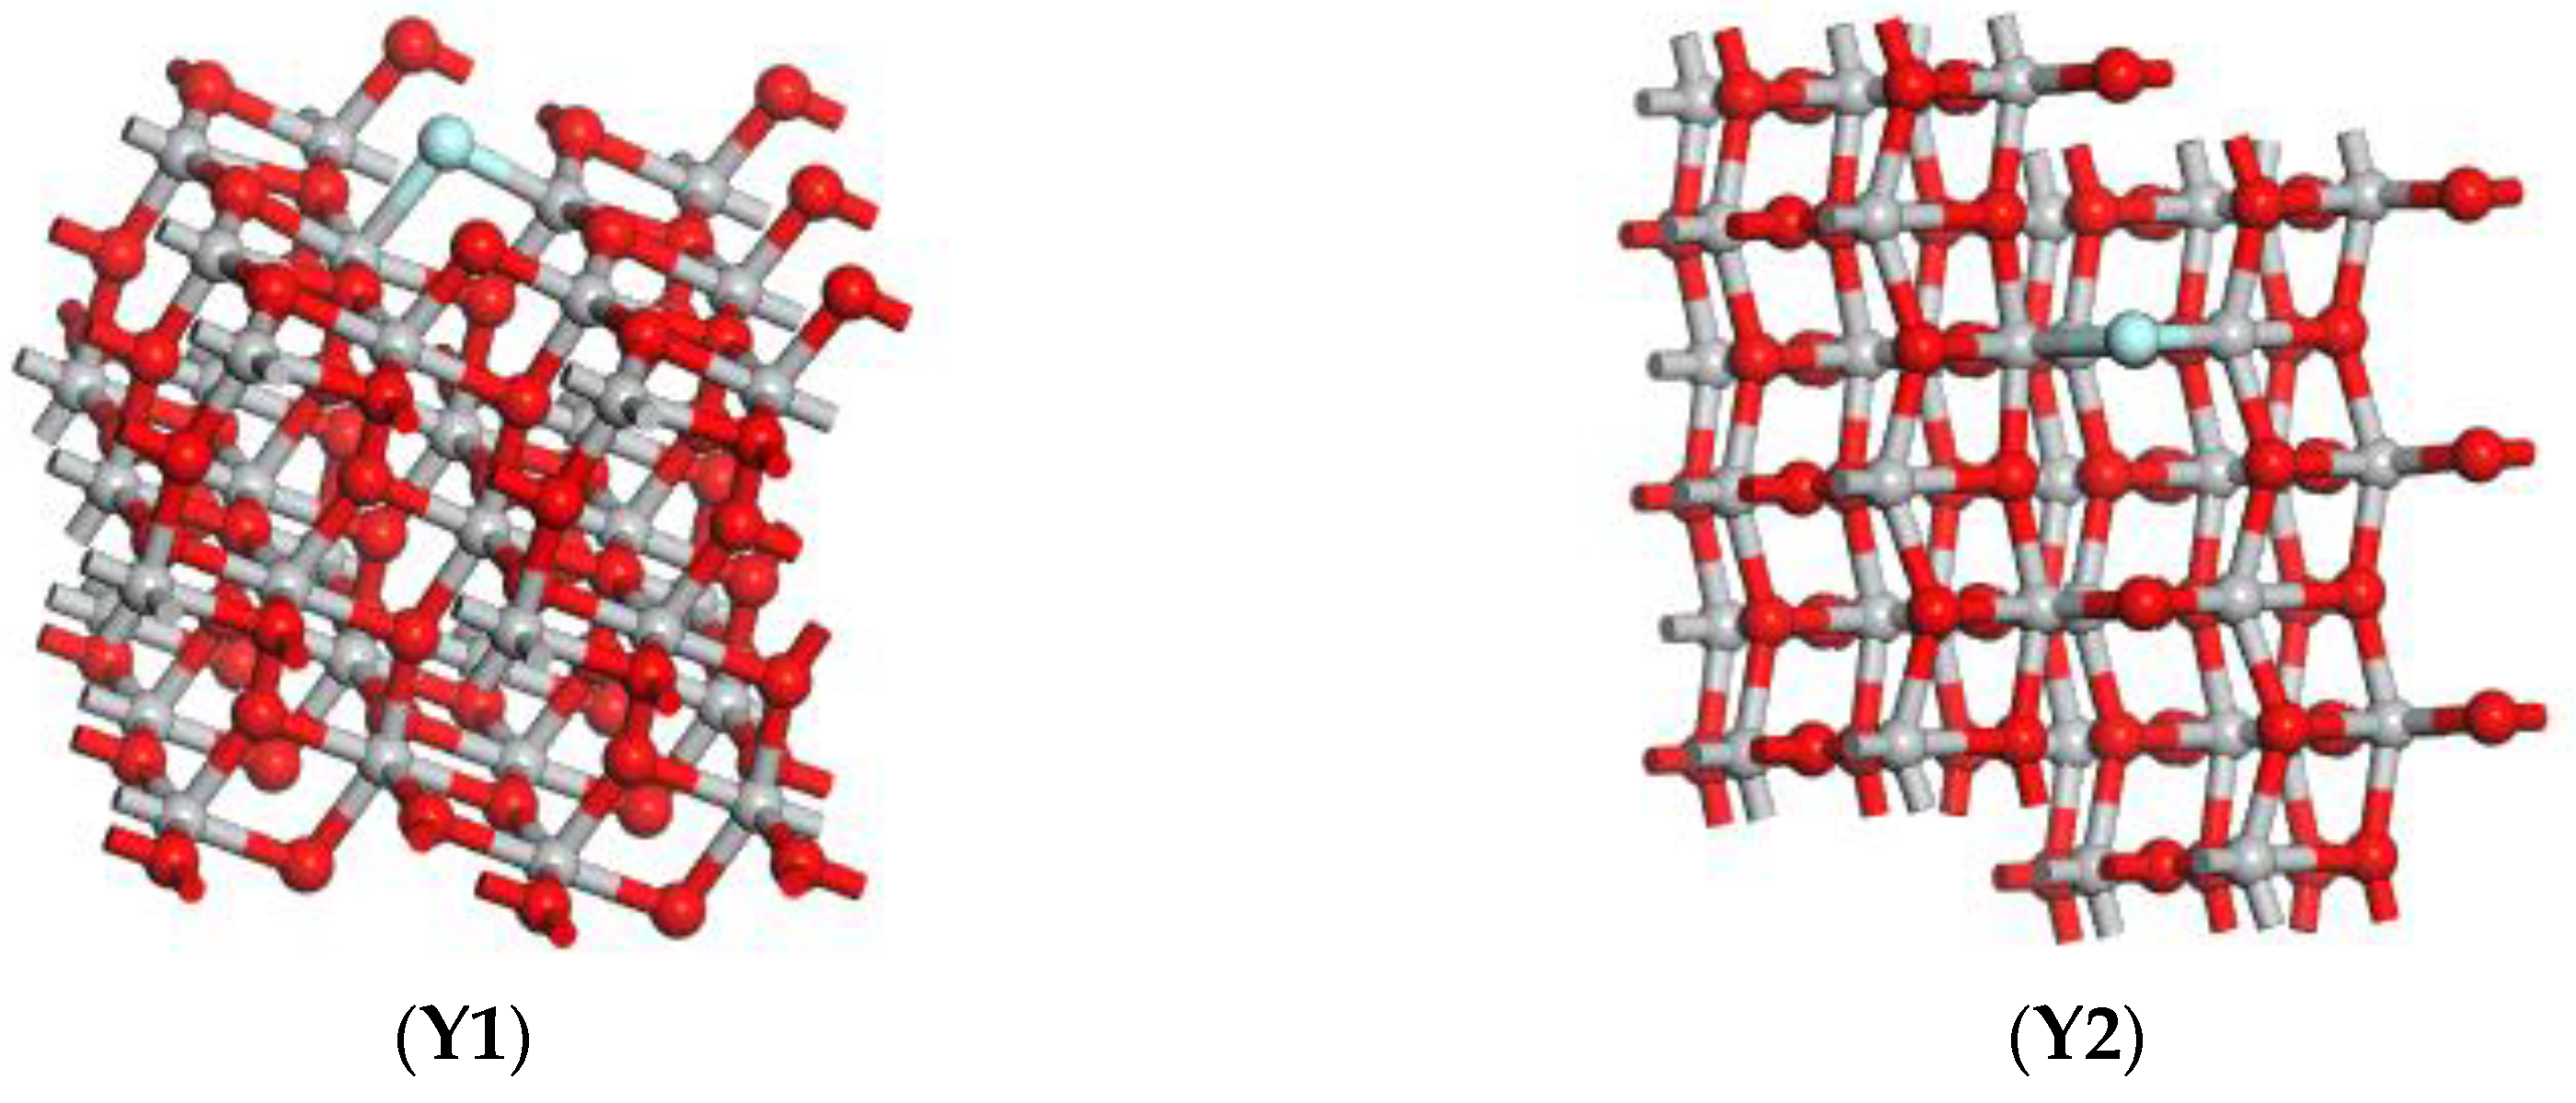
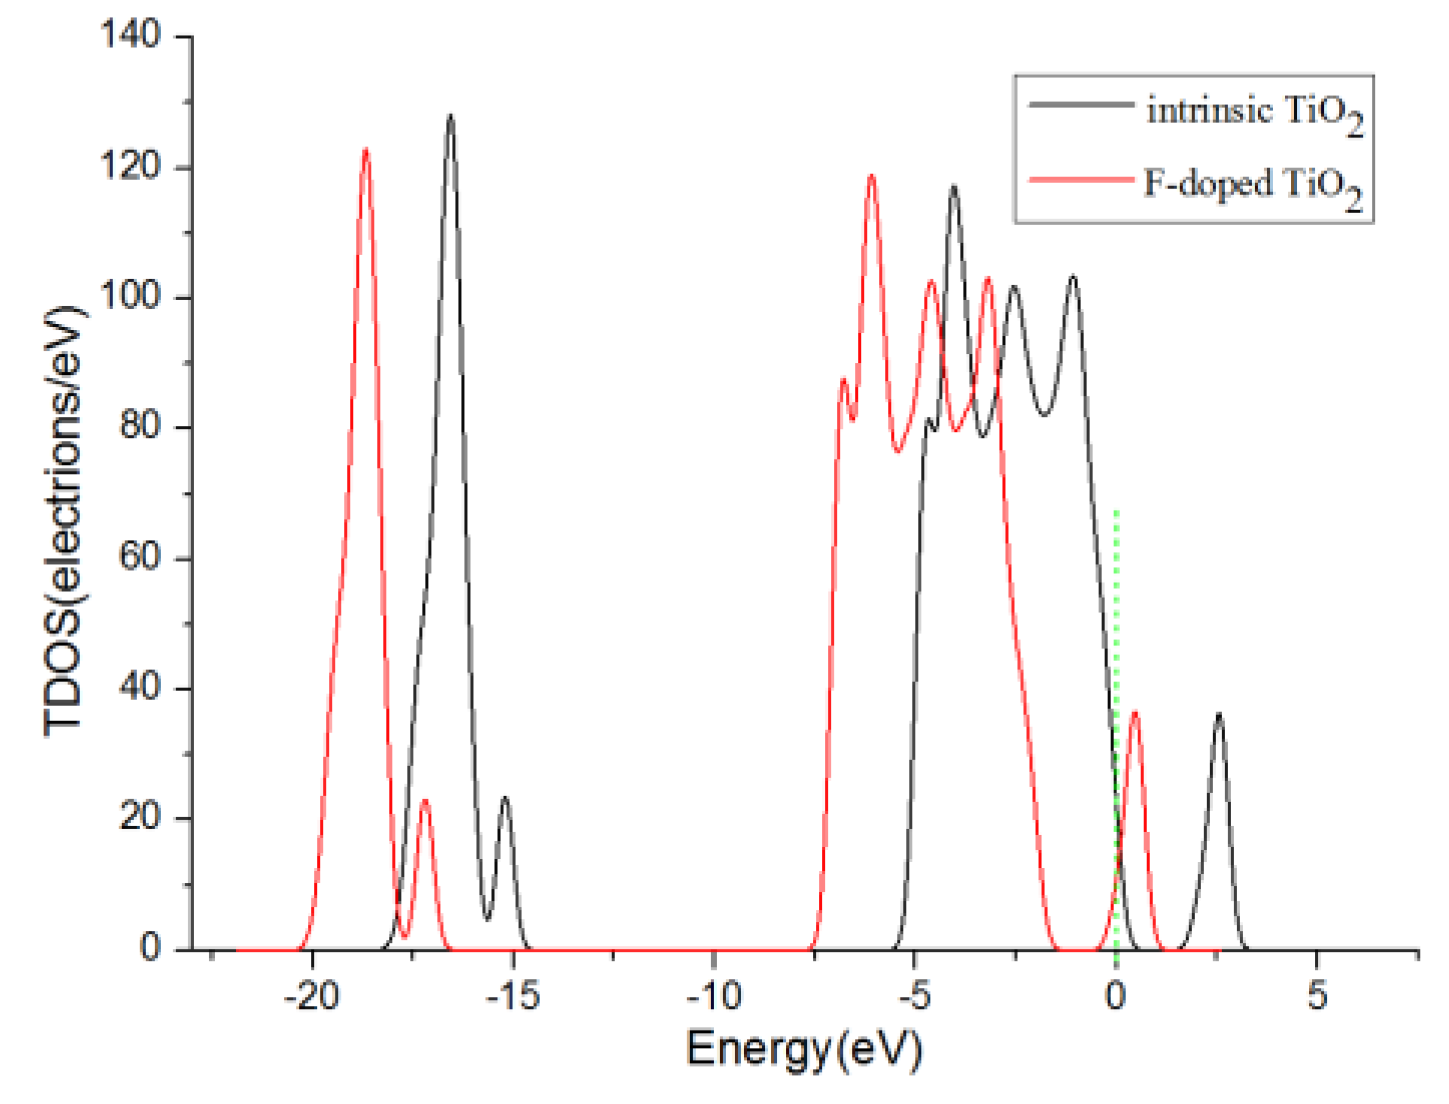
3.1. Establishment of F-Doped TiO2 Model

The F-doped TiO2 model was established based on the perfect crystal plane model. A fluorine atom replaces one of the O atoms on the surface of the anatase TiO2 (101) perfect crystal plane, and F atom combined with Ti atoms to form Ti-F bonds.
Figure 3 shows the curve of the density of states (DOS) of F-doped TiO2 and intrinsic anatase TiO2 (101) perfect crystal plane. It can be seen from the figure that the peak and shape of the density curve almost did not change after the fluorine atom being doped. The doping of the fluorine atoms hardly changes the band gap of TiO2. However, after fluorine element doping, the Ti4+ is converted to Ti3+, and the presence of a certain amount of Ti3+ will reduce the recombination rate of electron hole pairs [28]. Furthermore, fluorine element doping is conducive to the generation of oxygen holes and enhances the mobility of effective electrons [24,29], which can enhance the conductivity of the adsorbent substrate and improve the gas sensing performance of the fluorine-doped TiO2 nano array gas sensor mentioned above.

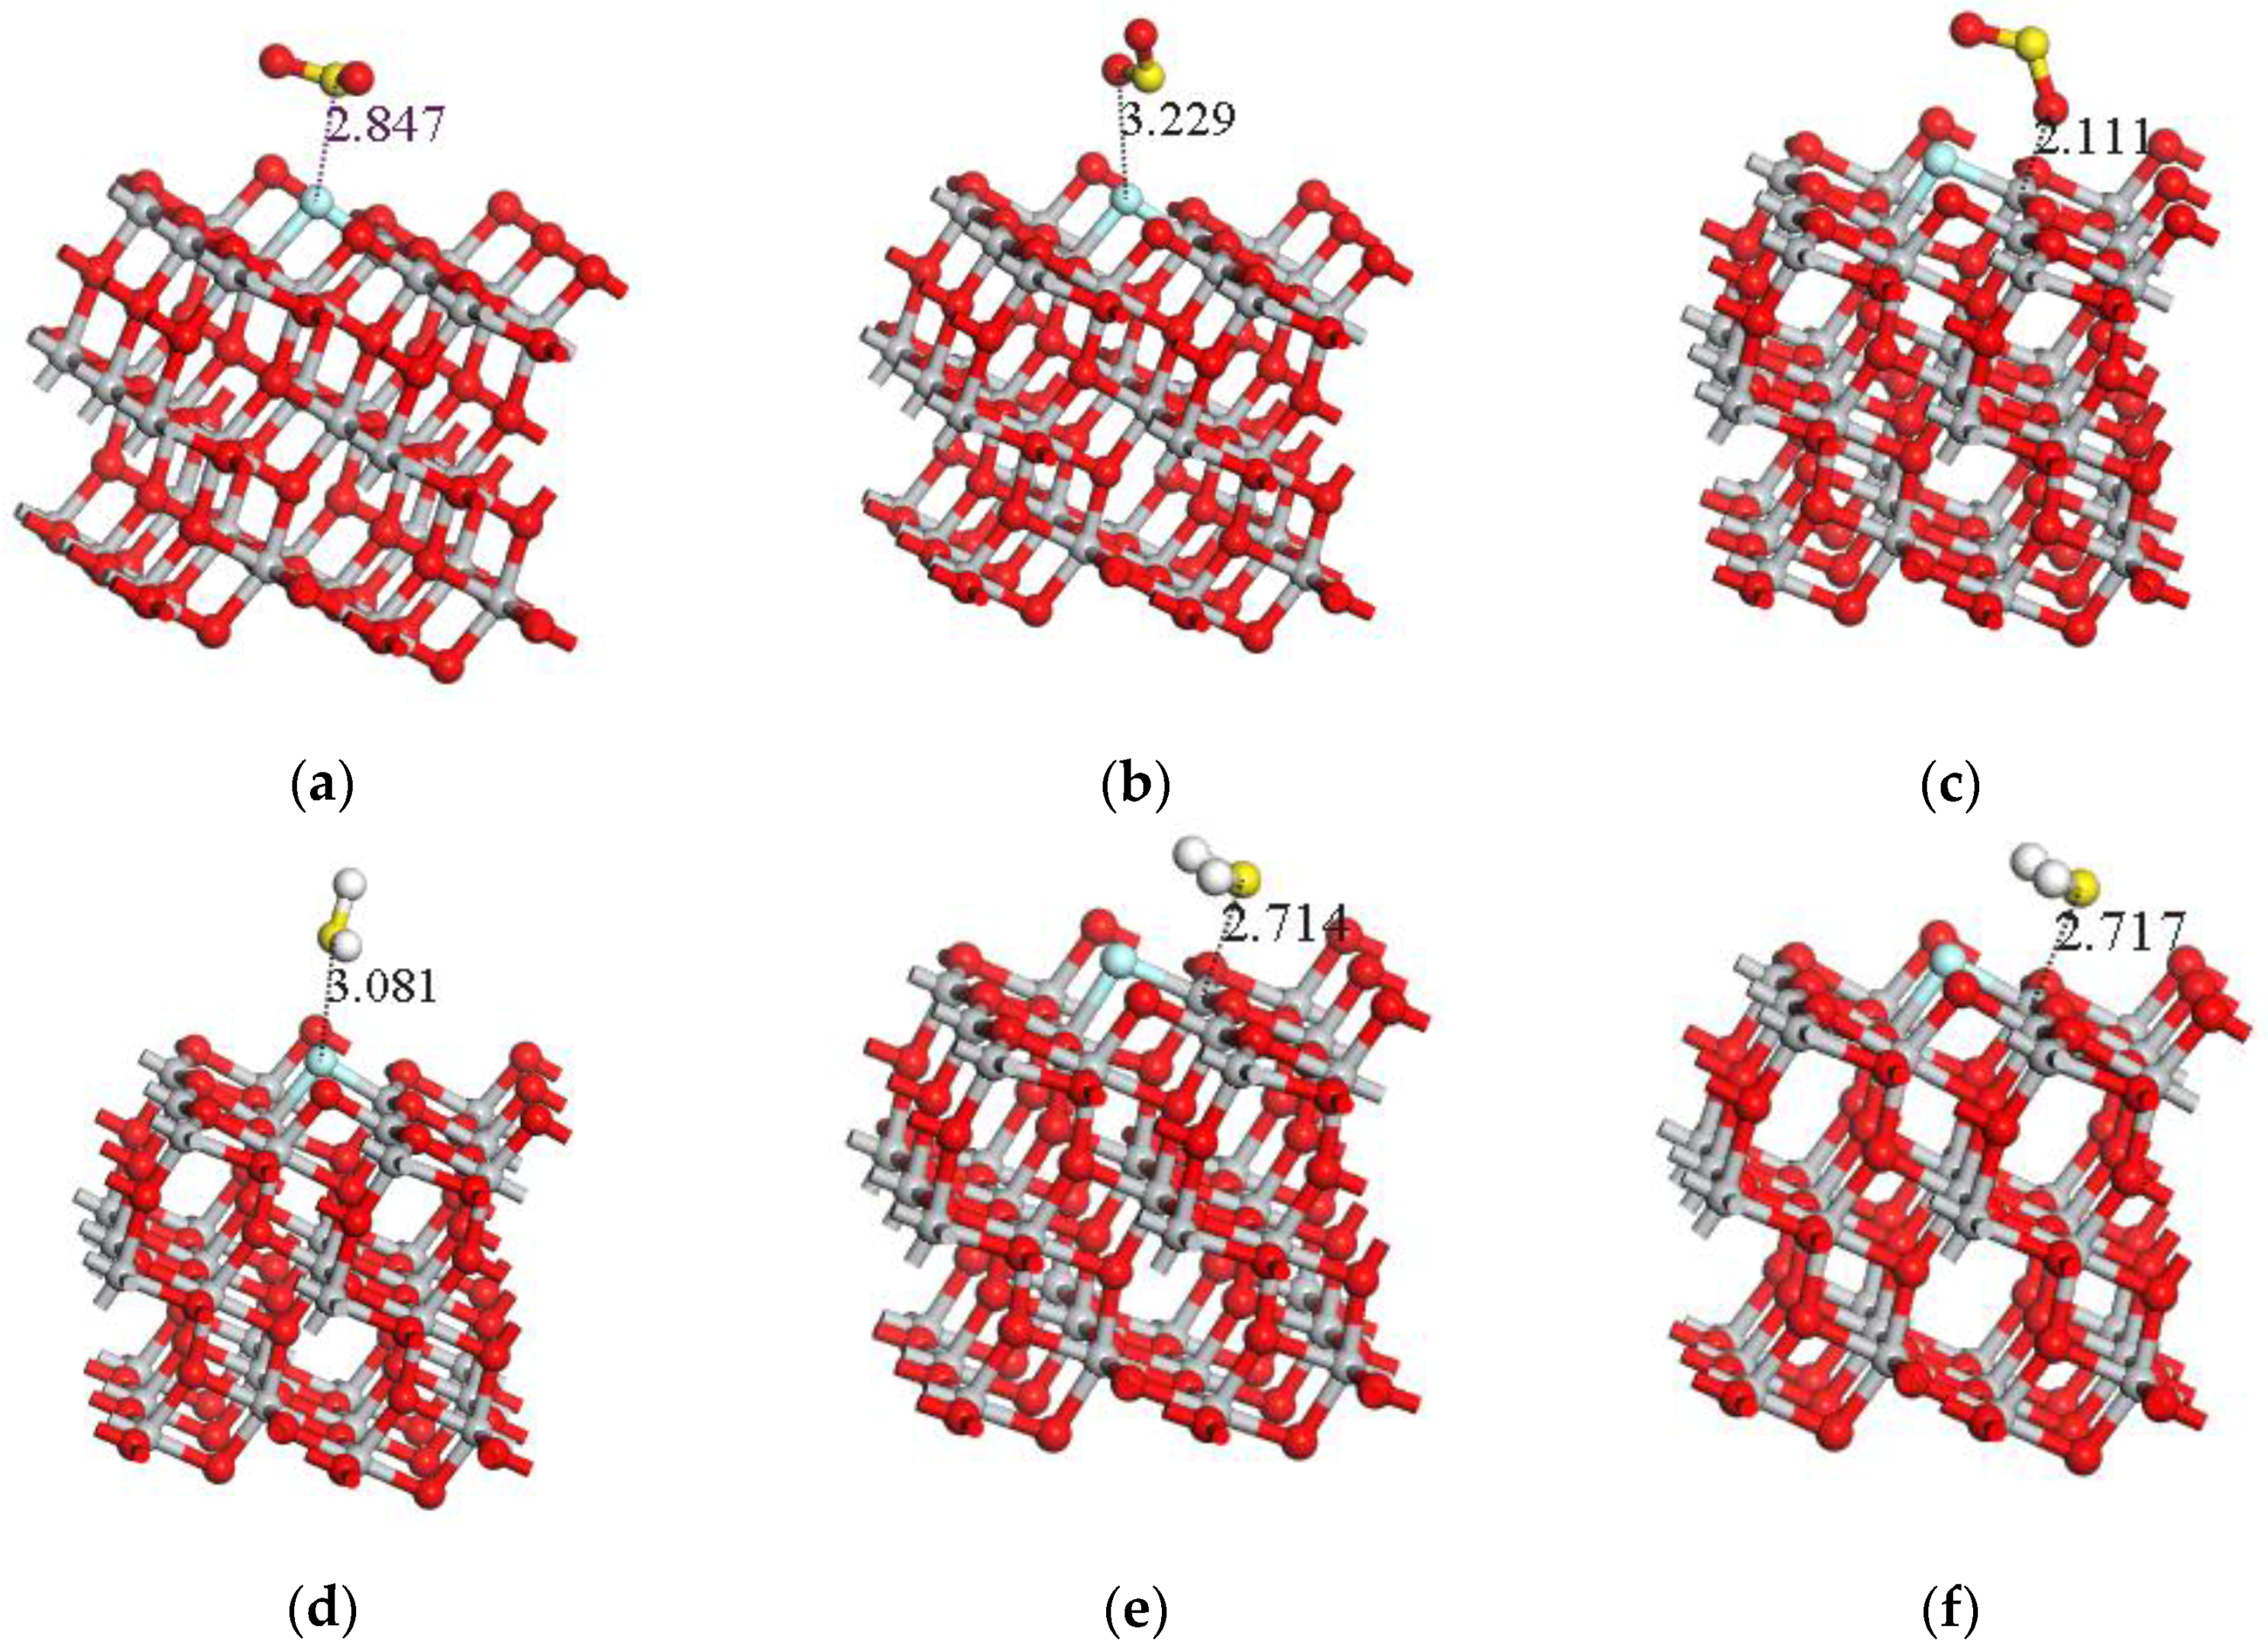
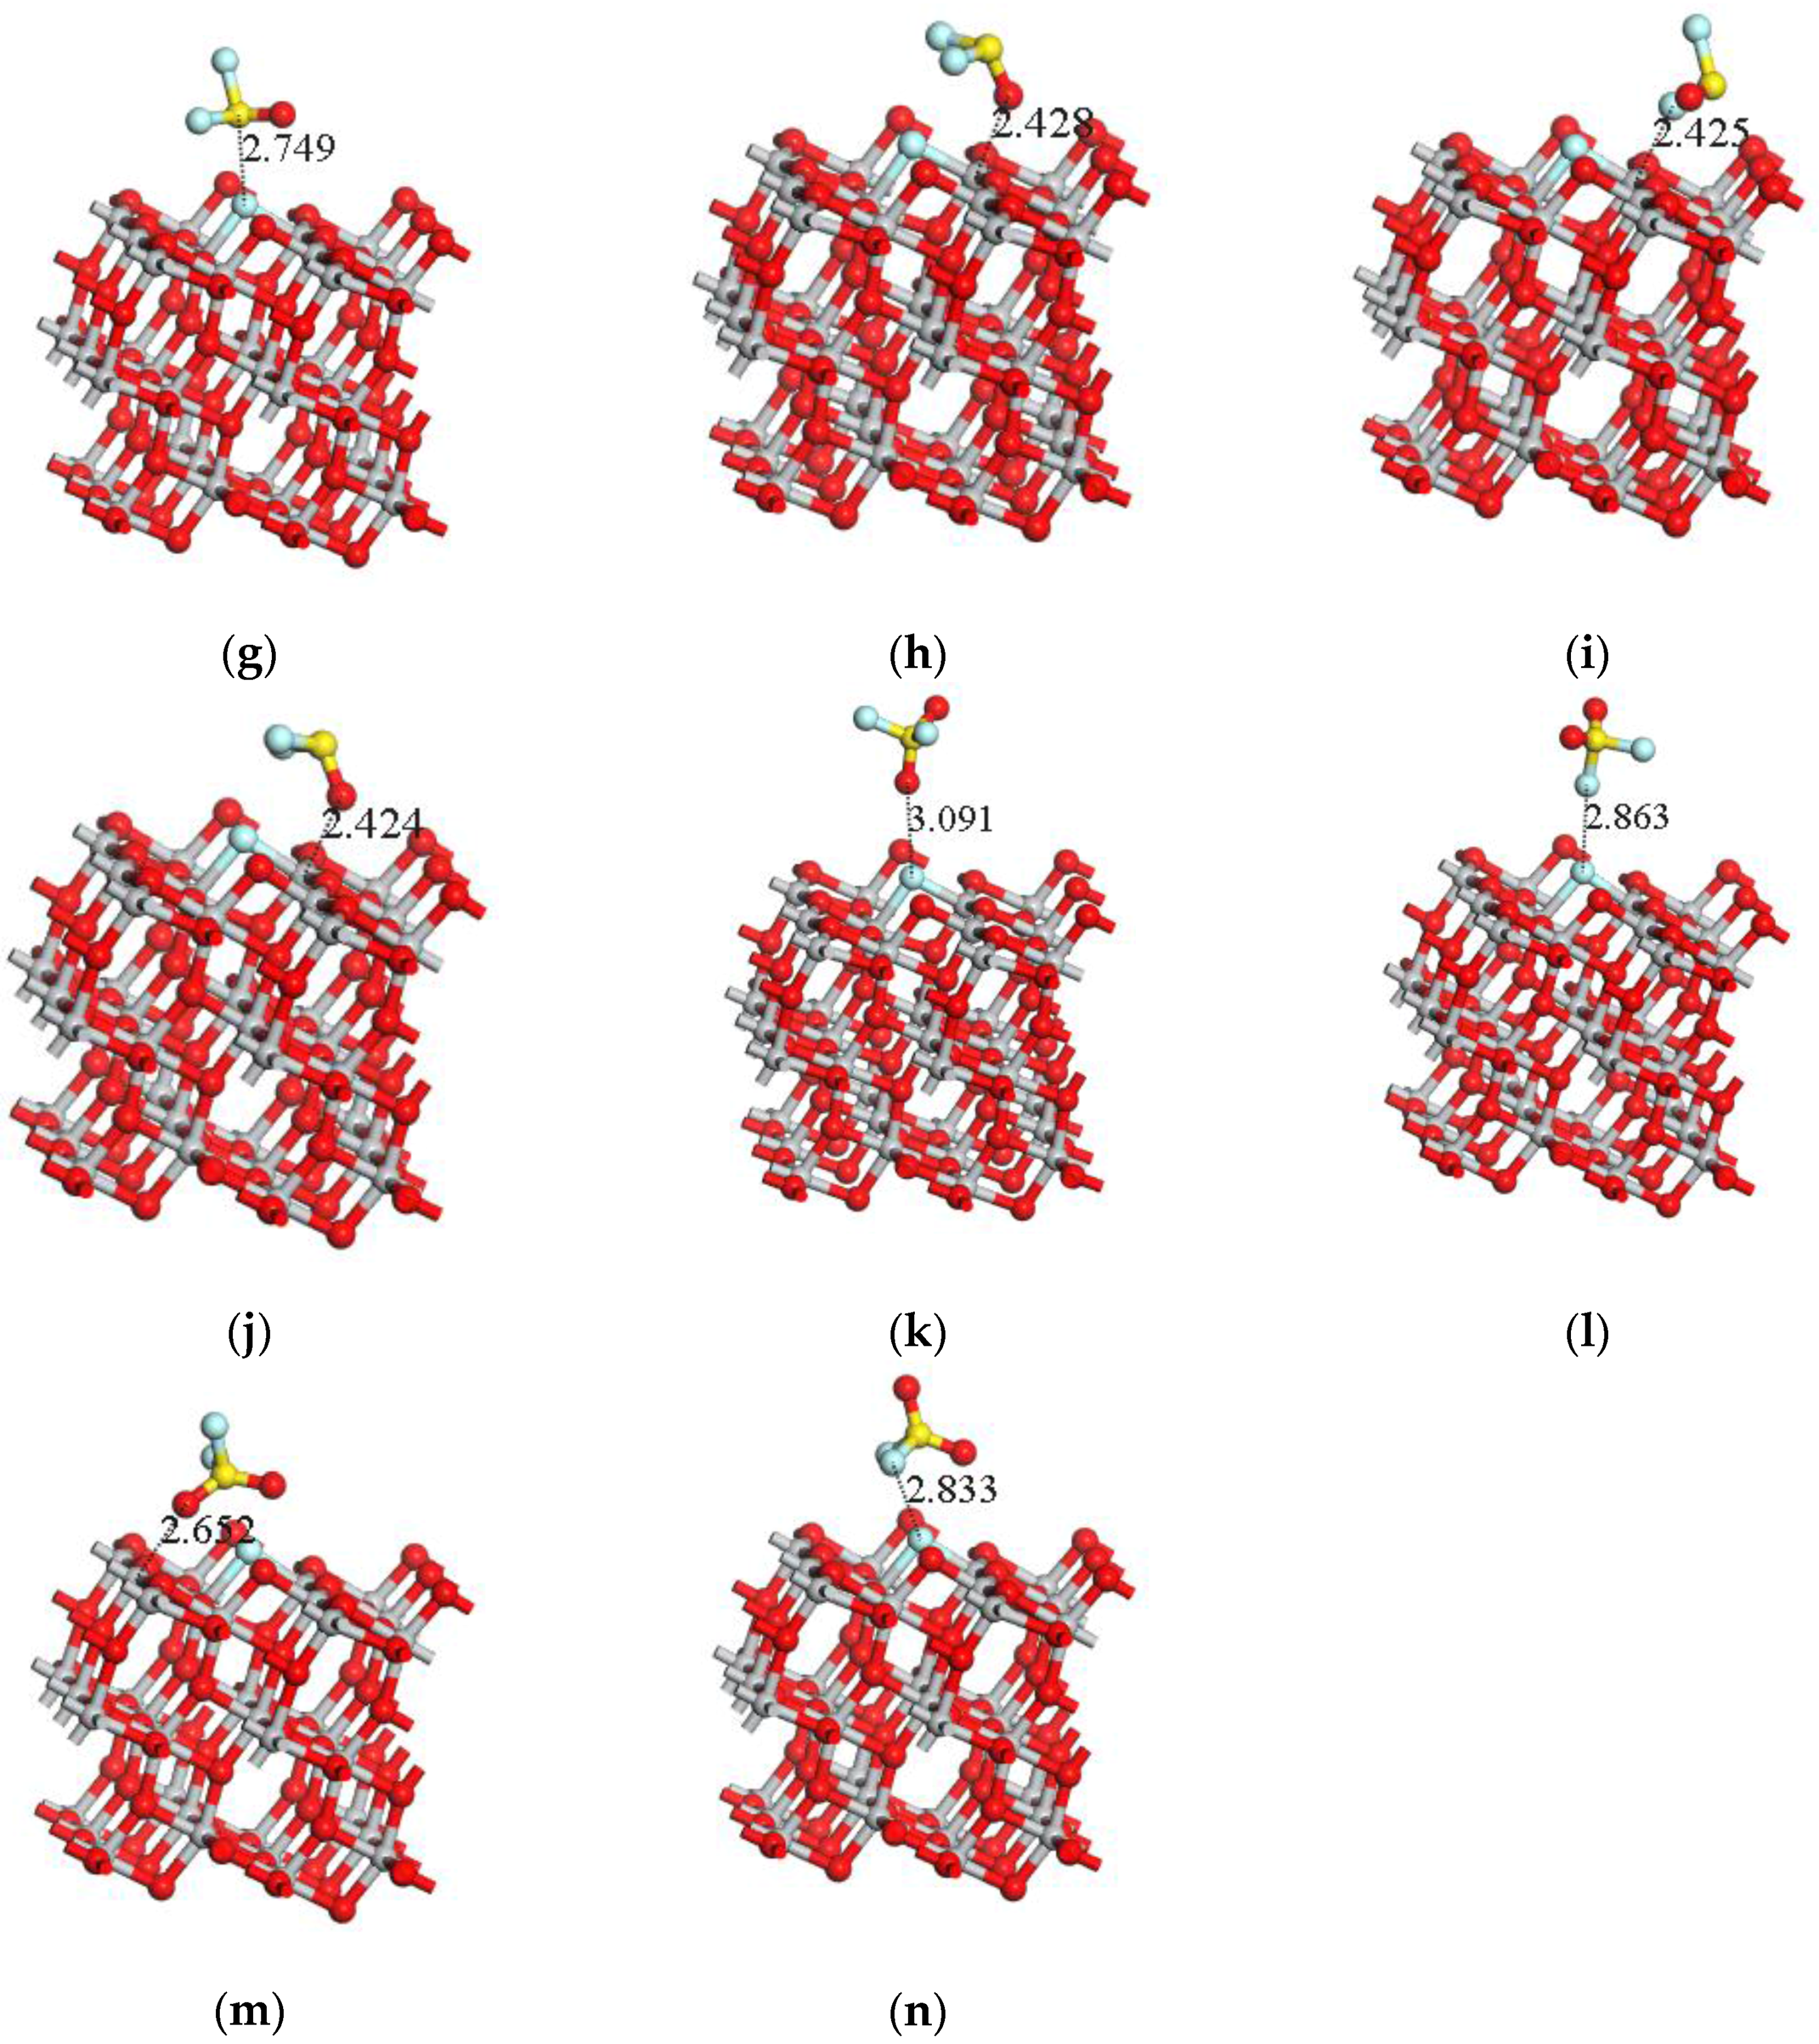
3.2. Parameter Calculation of Different Adsorption Systems

Figure 4 shows the adsorption structure of four gas molecules adsorbed on the F atom of the F-doped TiO2 crystal planes in different ways after complete optimization calculation. Due to the structural characteristics of four gas molecules, the way that the gas molecule adsorbed on the crystal plane was considered. Three situations are considered when the SO2 molecule comes close to the crystal plane in the optimization calculations, that is a single S and O atoms close to the crystal plane and two O atoms simultaneously close to the crystal plane. And the adsorption structures after calculation are shown in Figure 4a–c. Three cases were considered for H2S molecules: the single S, H atoms close to the crystal plane and two H atoms simultaneously close to the crystal plane. The calculated adsorption structures are shown in Figure 4d–f. SOF2 molecules mainly consider four cases: the single S, O, F atoms close to the crystal plane and two F atoms simultaneously close to the crystal plane, the calculated adsorption structure are shown in Figure 4g–j; the SO2F2 molecule is of a tetrahedral structure, and the S atom is inside the structure. So, SO2F2 mainly considers 4 cases: a single O, F atom close to the crystal plane, two O atoms and two F atoms are simultaneously close to the crystal plane, separately. The calculated adsorption structures are shown in Figure 4k–n.
Adsorption energy is the degree of change of total energy before and after the adsorption of gas molecules onto crystal plane, which represents the ability of gas molecules adsorption onto the crystal plane. In this paper, the magnitude of adsorption energy is expressed by Ea, and the formula is as follows:
Ea = Esys − Egas − Esur,
where Esys represents the energy of the whole system after the gas adsorbed on the F-doped TiO2, Egas represents the energy when the gas molecules are present alone, and Esur represents the energy of F-doped TiO2 without the adsorption of gas molecules.
In the adsorption process, besides the change of energy, it may also be accompanied with the electron transfer, which results in the change of the electronic structure of the crystal plane, and shows the changes of electrical properties such as resistance and capacitance at macro level. In practical applications, the gas sensitive response characteristics of gas sensors can be obtained by detecting these electrical characteristics. Therefore, this paper also calculated Mulliken charge distribution of the gas molecules adsorbed onto the F-doped TiO2, to confirm the amount of charge transfer before and after the adsorption of gas molecules onto the crystal plane. The charge transfer Qt is defined as the charge change of gas molecules before and after they are adsorbed onto the F-doped TiO2 crystal plane. If Qt > 0, the electron is transferred from the gas molecule to the crystal plane. On the contrary, if Qt < 0, part of the electrons is transferred from the crystal plane to the gas molecule. Table 1 shows the adsorption energies, adsorption distance and charge transfer of four kinds of gas molecules SO2, H2S, SOF2 and SO2F2 adsorbed onto F-doped TiO2 crystal plane in different postures.
In Table 1, SO2-S-TiO2 represents an adsorption system in which SO2 molecules are close to the F-doped TiO2 crystal plane with single S atom, and others are similar. Ea < 0 indicates that the adsorption of four kinds of molecules onto F-doped TiO2 crystal plane are exothermic. The value of Ea is larger, indicates that the adsorption of gas molecules onto F-doped TiO2 crystal plane is easier, and adsorption structure is more stable.
When H2S gas molecules with a single H atom close to the crystal plane and two H atoms simultaneously close to crystal plane, the adsorption structure after optimization calculation (Figure 4e,f) is almost the same, the calculated adsorption energy (−0.837 eV and −0.836 eV) and the amount of charge transfer (0.267 e and 0.266 e) is almost exactly the same, which is larger than the adsorption energy and charge transfer (−0.209 eV and 0.008 e) of the adsorption with single S atom close to the crystal plane. At the same time, the adsorption distance (2.835 Å) of the adsorption system obtained from H2S gas molecules with single S atom close to the crystal plane should be larger than that of the other two approaching ways (2.714 Å and 2.717 Å). Therefore, the H2S gas molecules are much easier to adsorb onto the crystal plane with a single H atom close to the crystal plane and two H atoms simultaneously close to the F-doped TiO2 crystal plane. When the H2S gas molecules are adsorbed on the crystal plane, the amount of charge transferred to the crystal plane is about 0.266 e, and the macroscopic gas sensitivity of the gas sensor shows the decrease of the impedance.
Similarly, the adsorption reaction of SOF2 gas molecules more easily occurs in three cases: close to the F-doped TiO2 surface with a single O and F atoms and two F atoms at the same time, and the macroscopic sensitivity of the gas sensor shows the decrease of the impedance. SO2 gas molecule reacts easier with two O atoms at the same time when approaching the crystal surface, and the macroscopic gas sensitivity of the gas sensor shows the increase of the impedance. The comparison shows that the adsorption energy of H2S gas molecules onto F-doped TiO2 crystal plane is the highest, which is about two times of that of SOF2, SO2F2. In addition, when the three types of gas molecules, H2S, SOF2 and SO2F2, adsorb onto F-doped TiO2, the macroscopic gas sensitivity of the gas sensor shows the decrease of the impedance. When SO2 gas molecules react onto the F-doped TiO2, the macroscopic gas sensitivity of the gas sensor shows the increase of the impedance. Therefore, theoretically, F-doped TiO2 nanotube array gas sensor can effectively distinguish and detect the four kinds of gases.

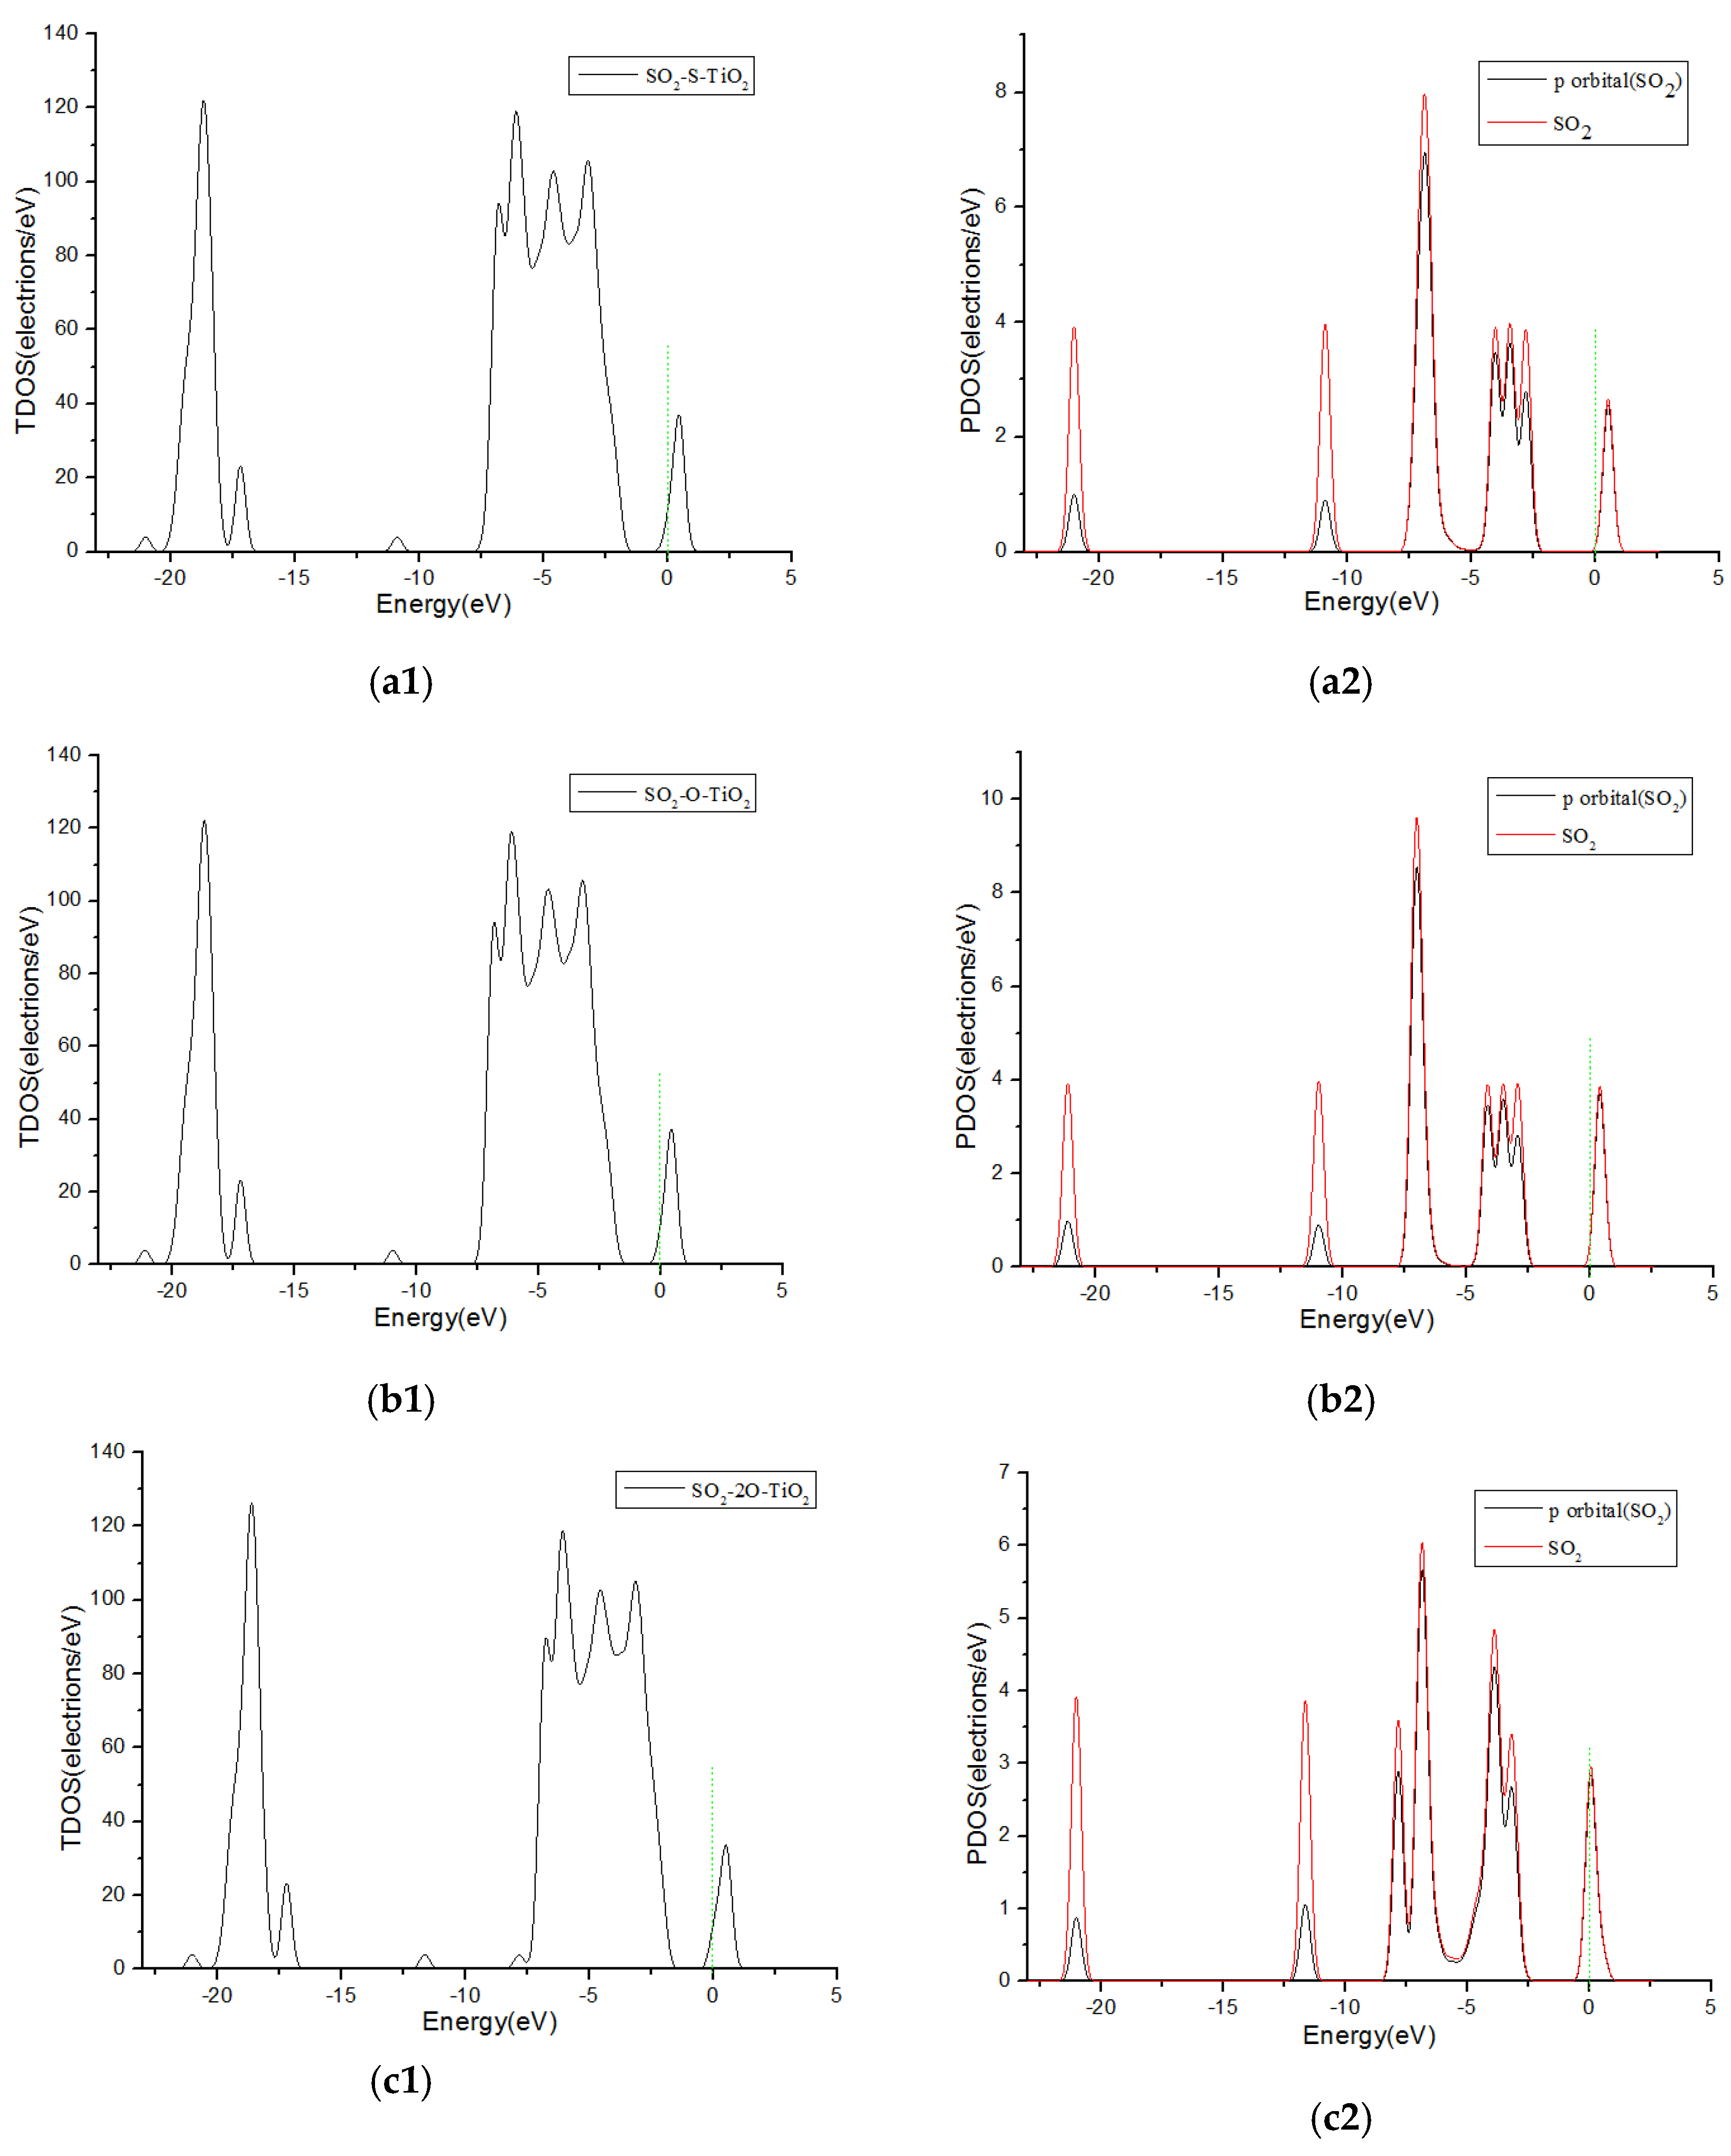
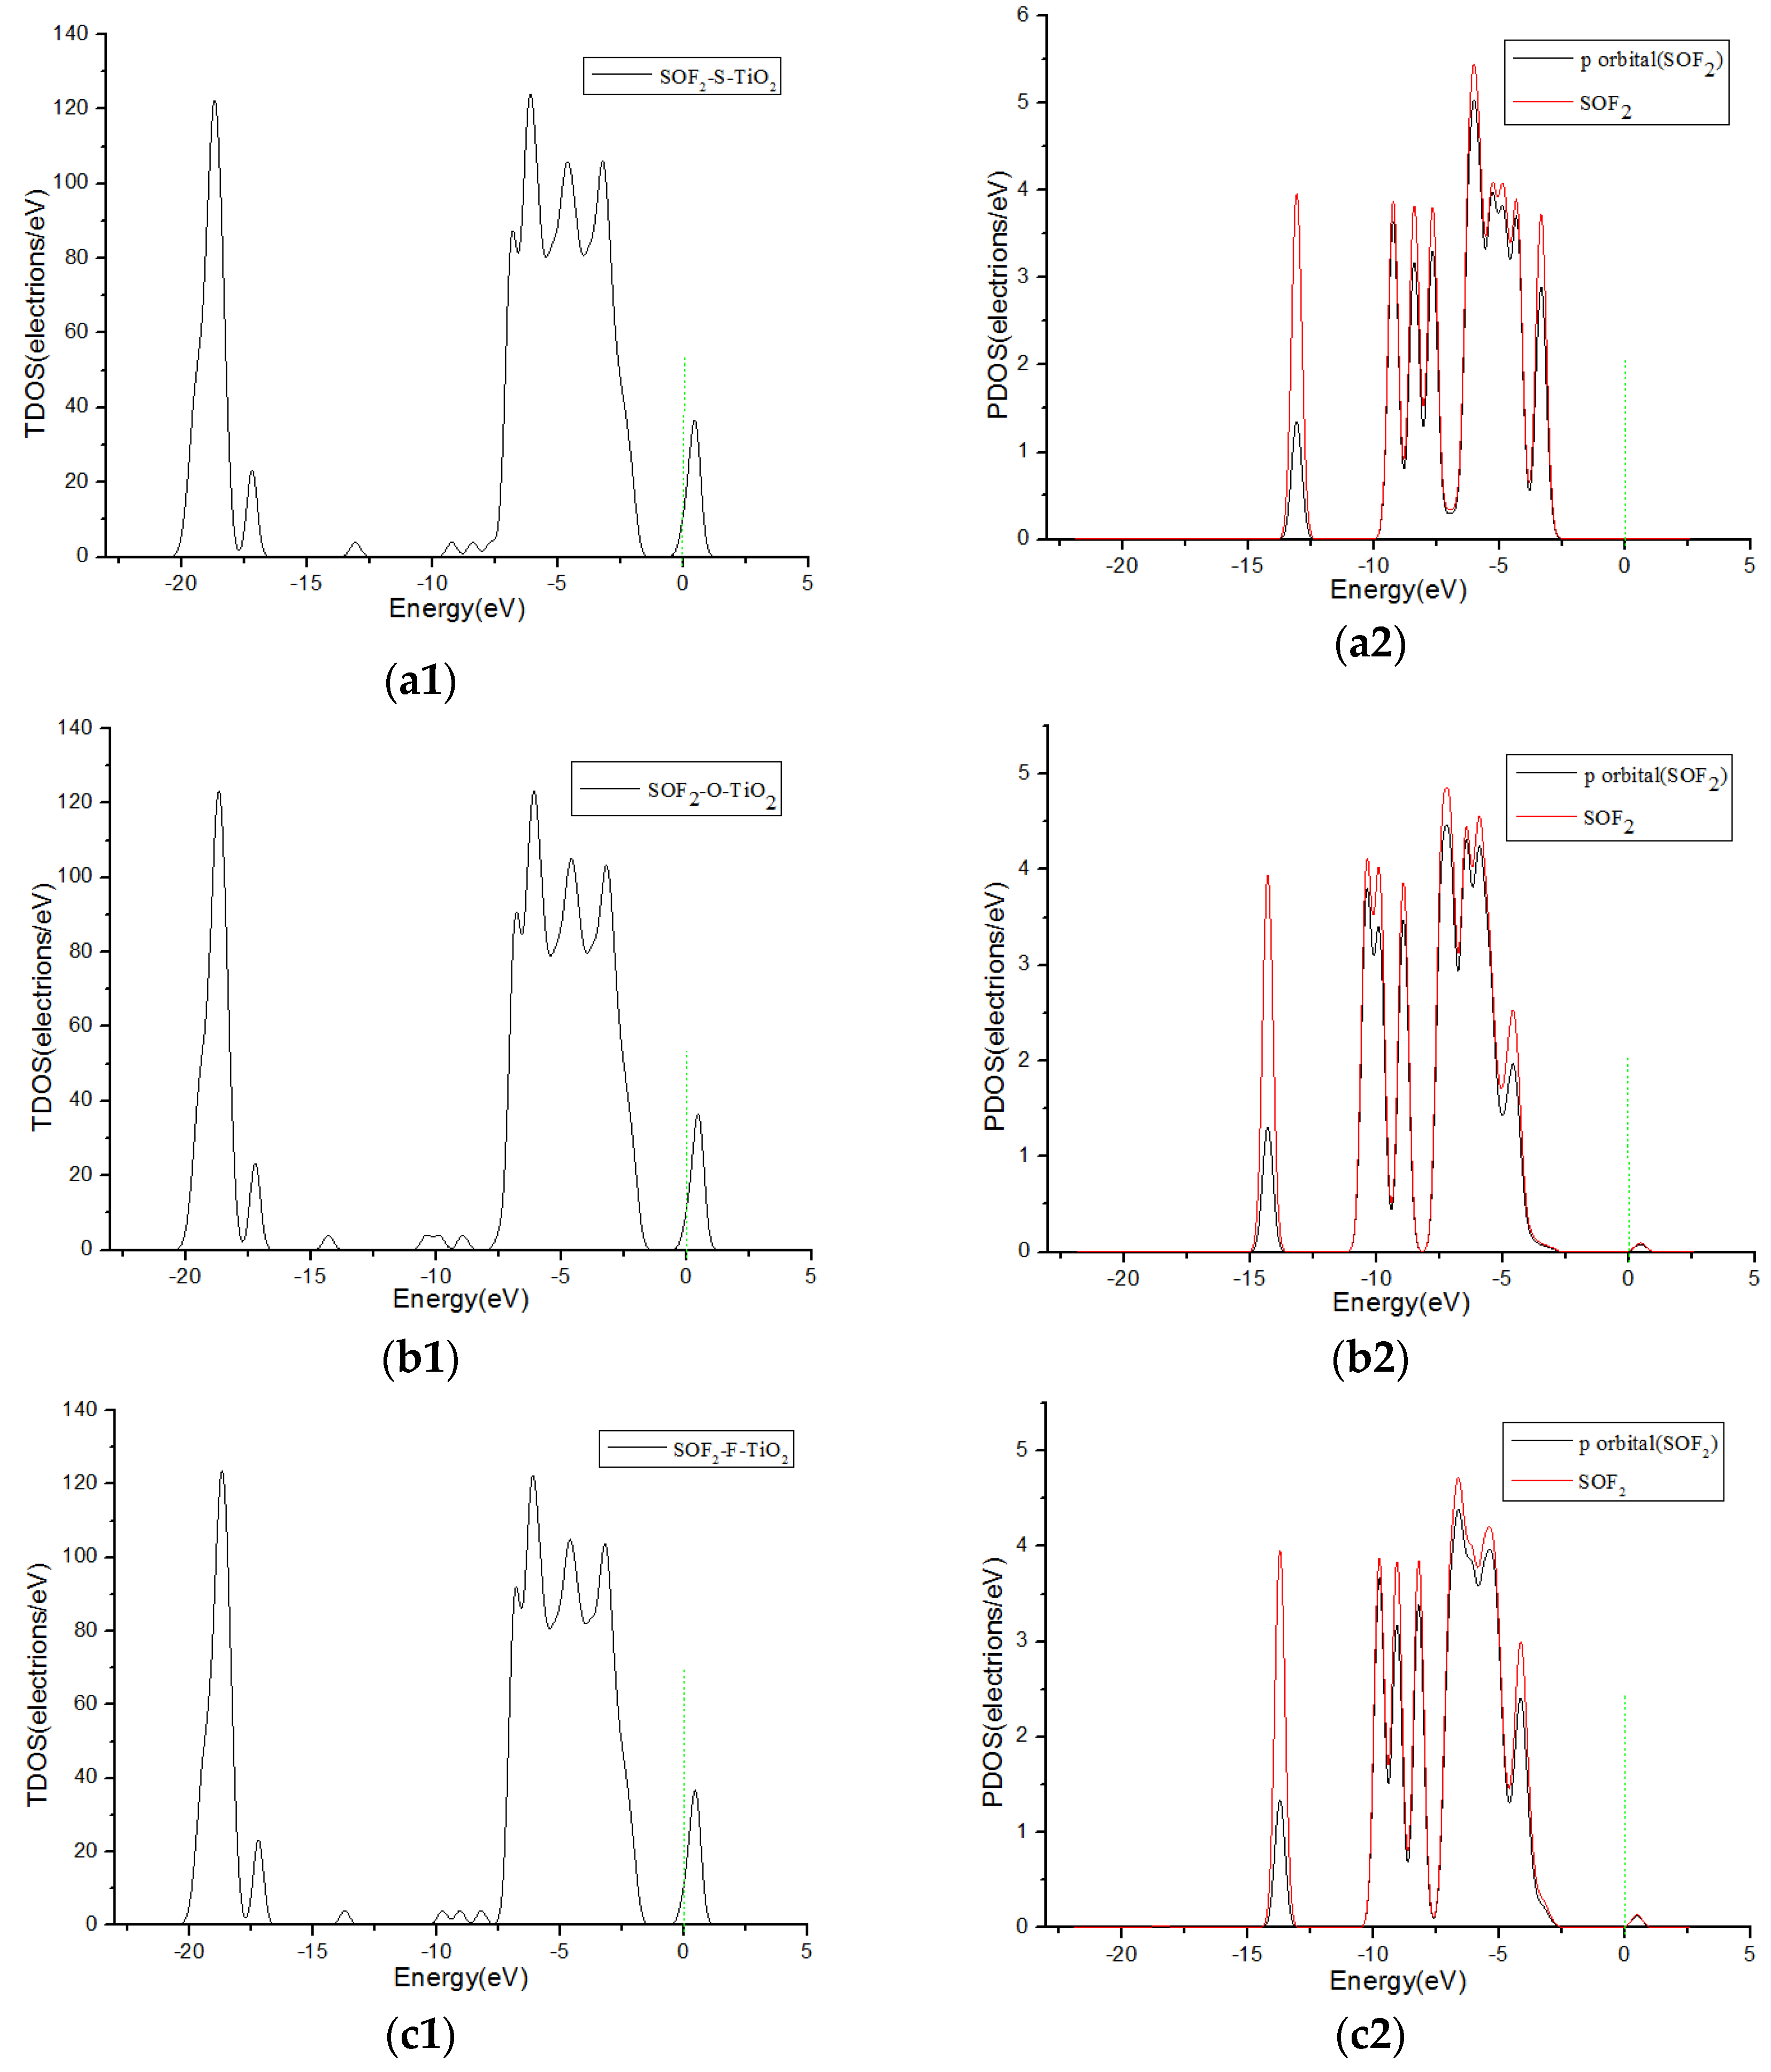
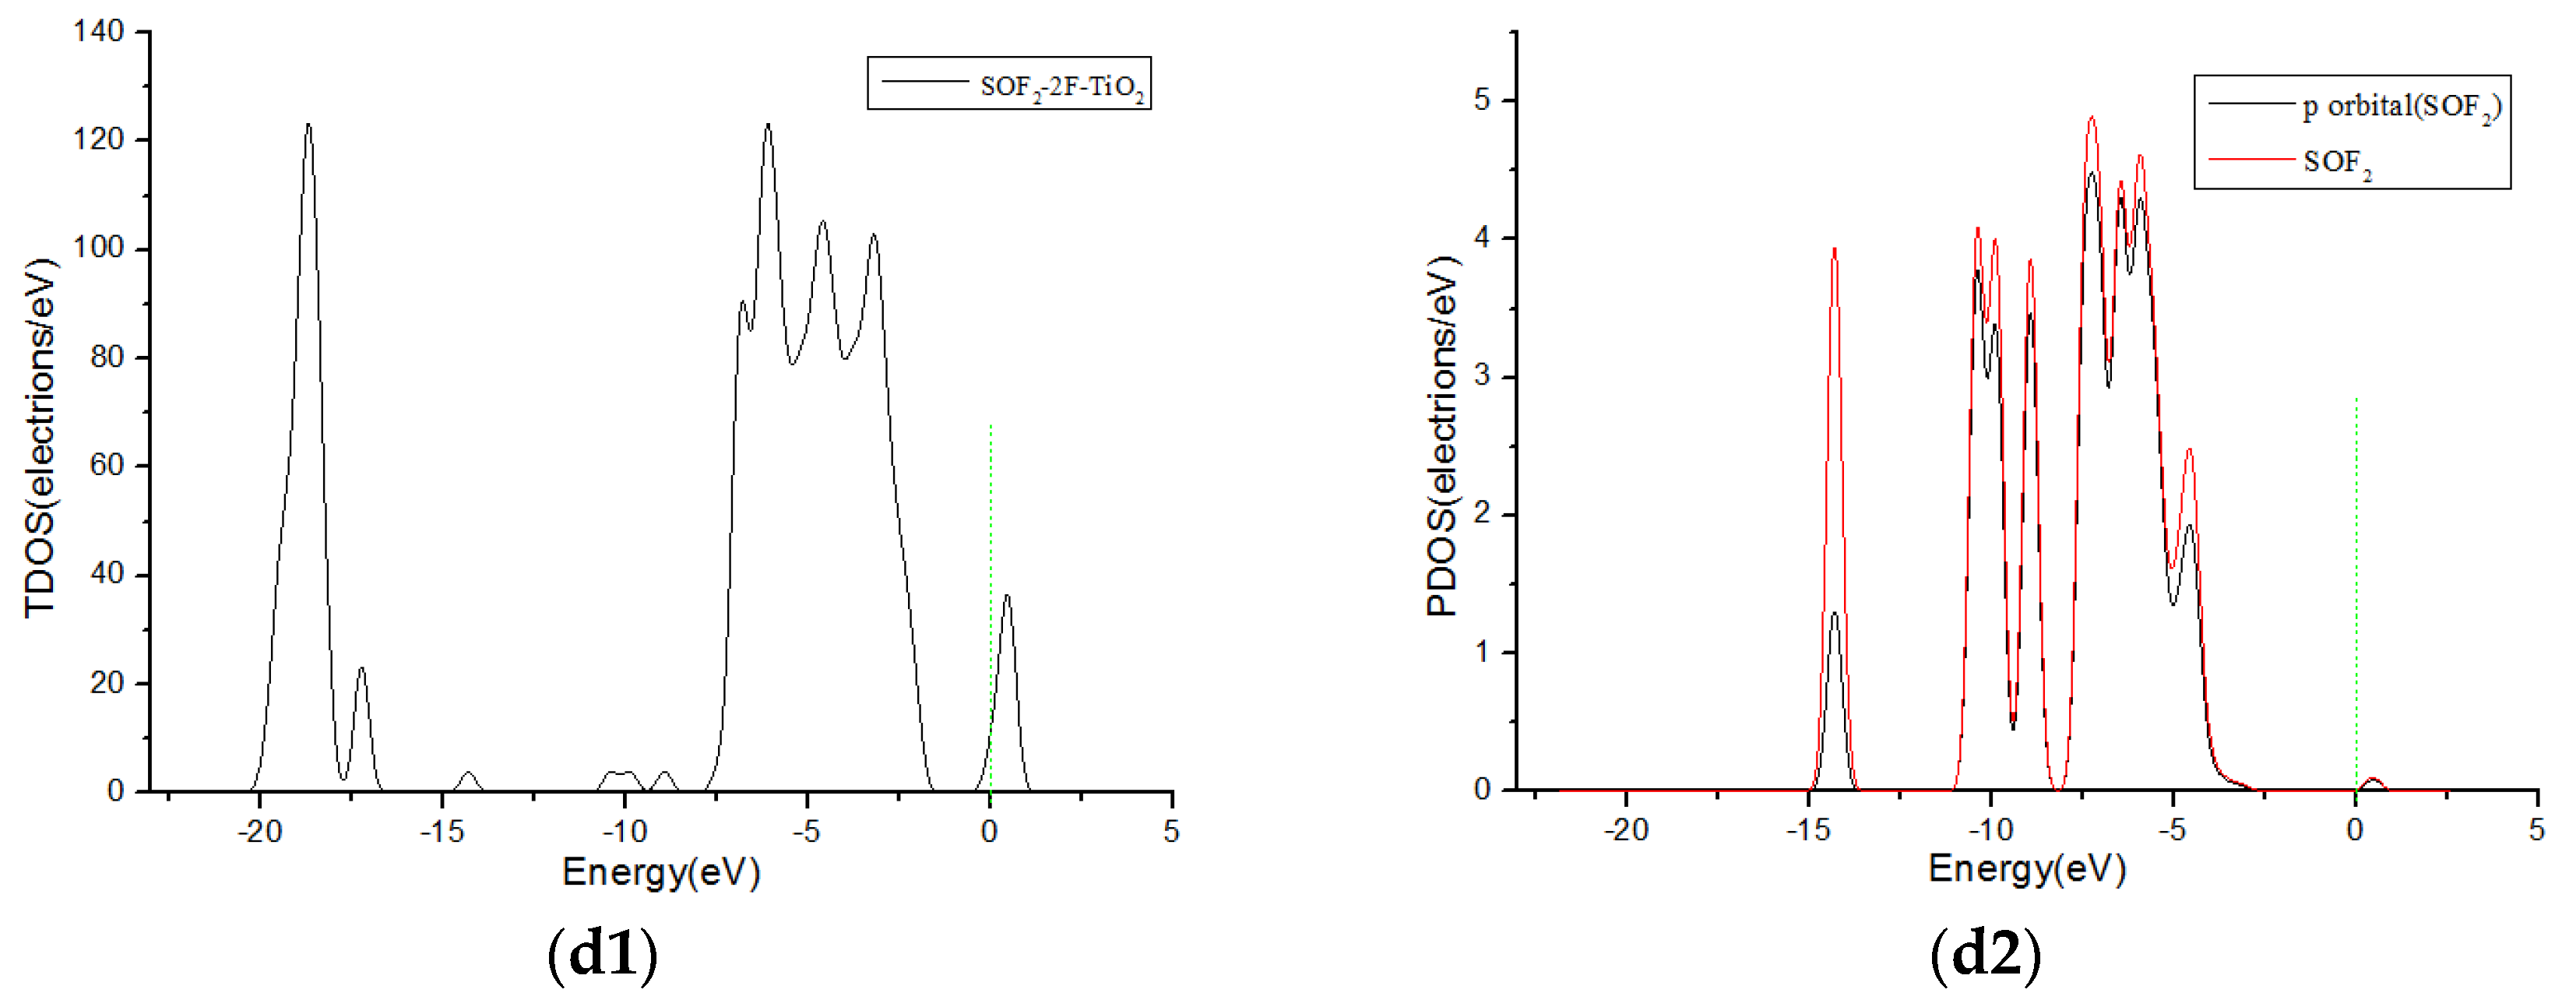
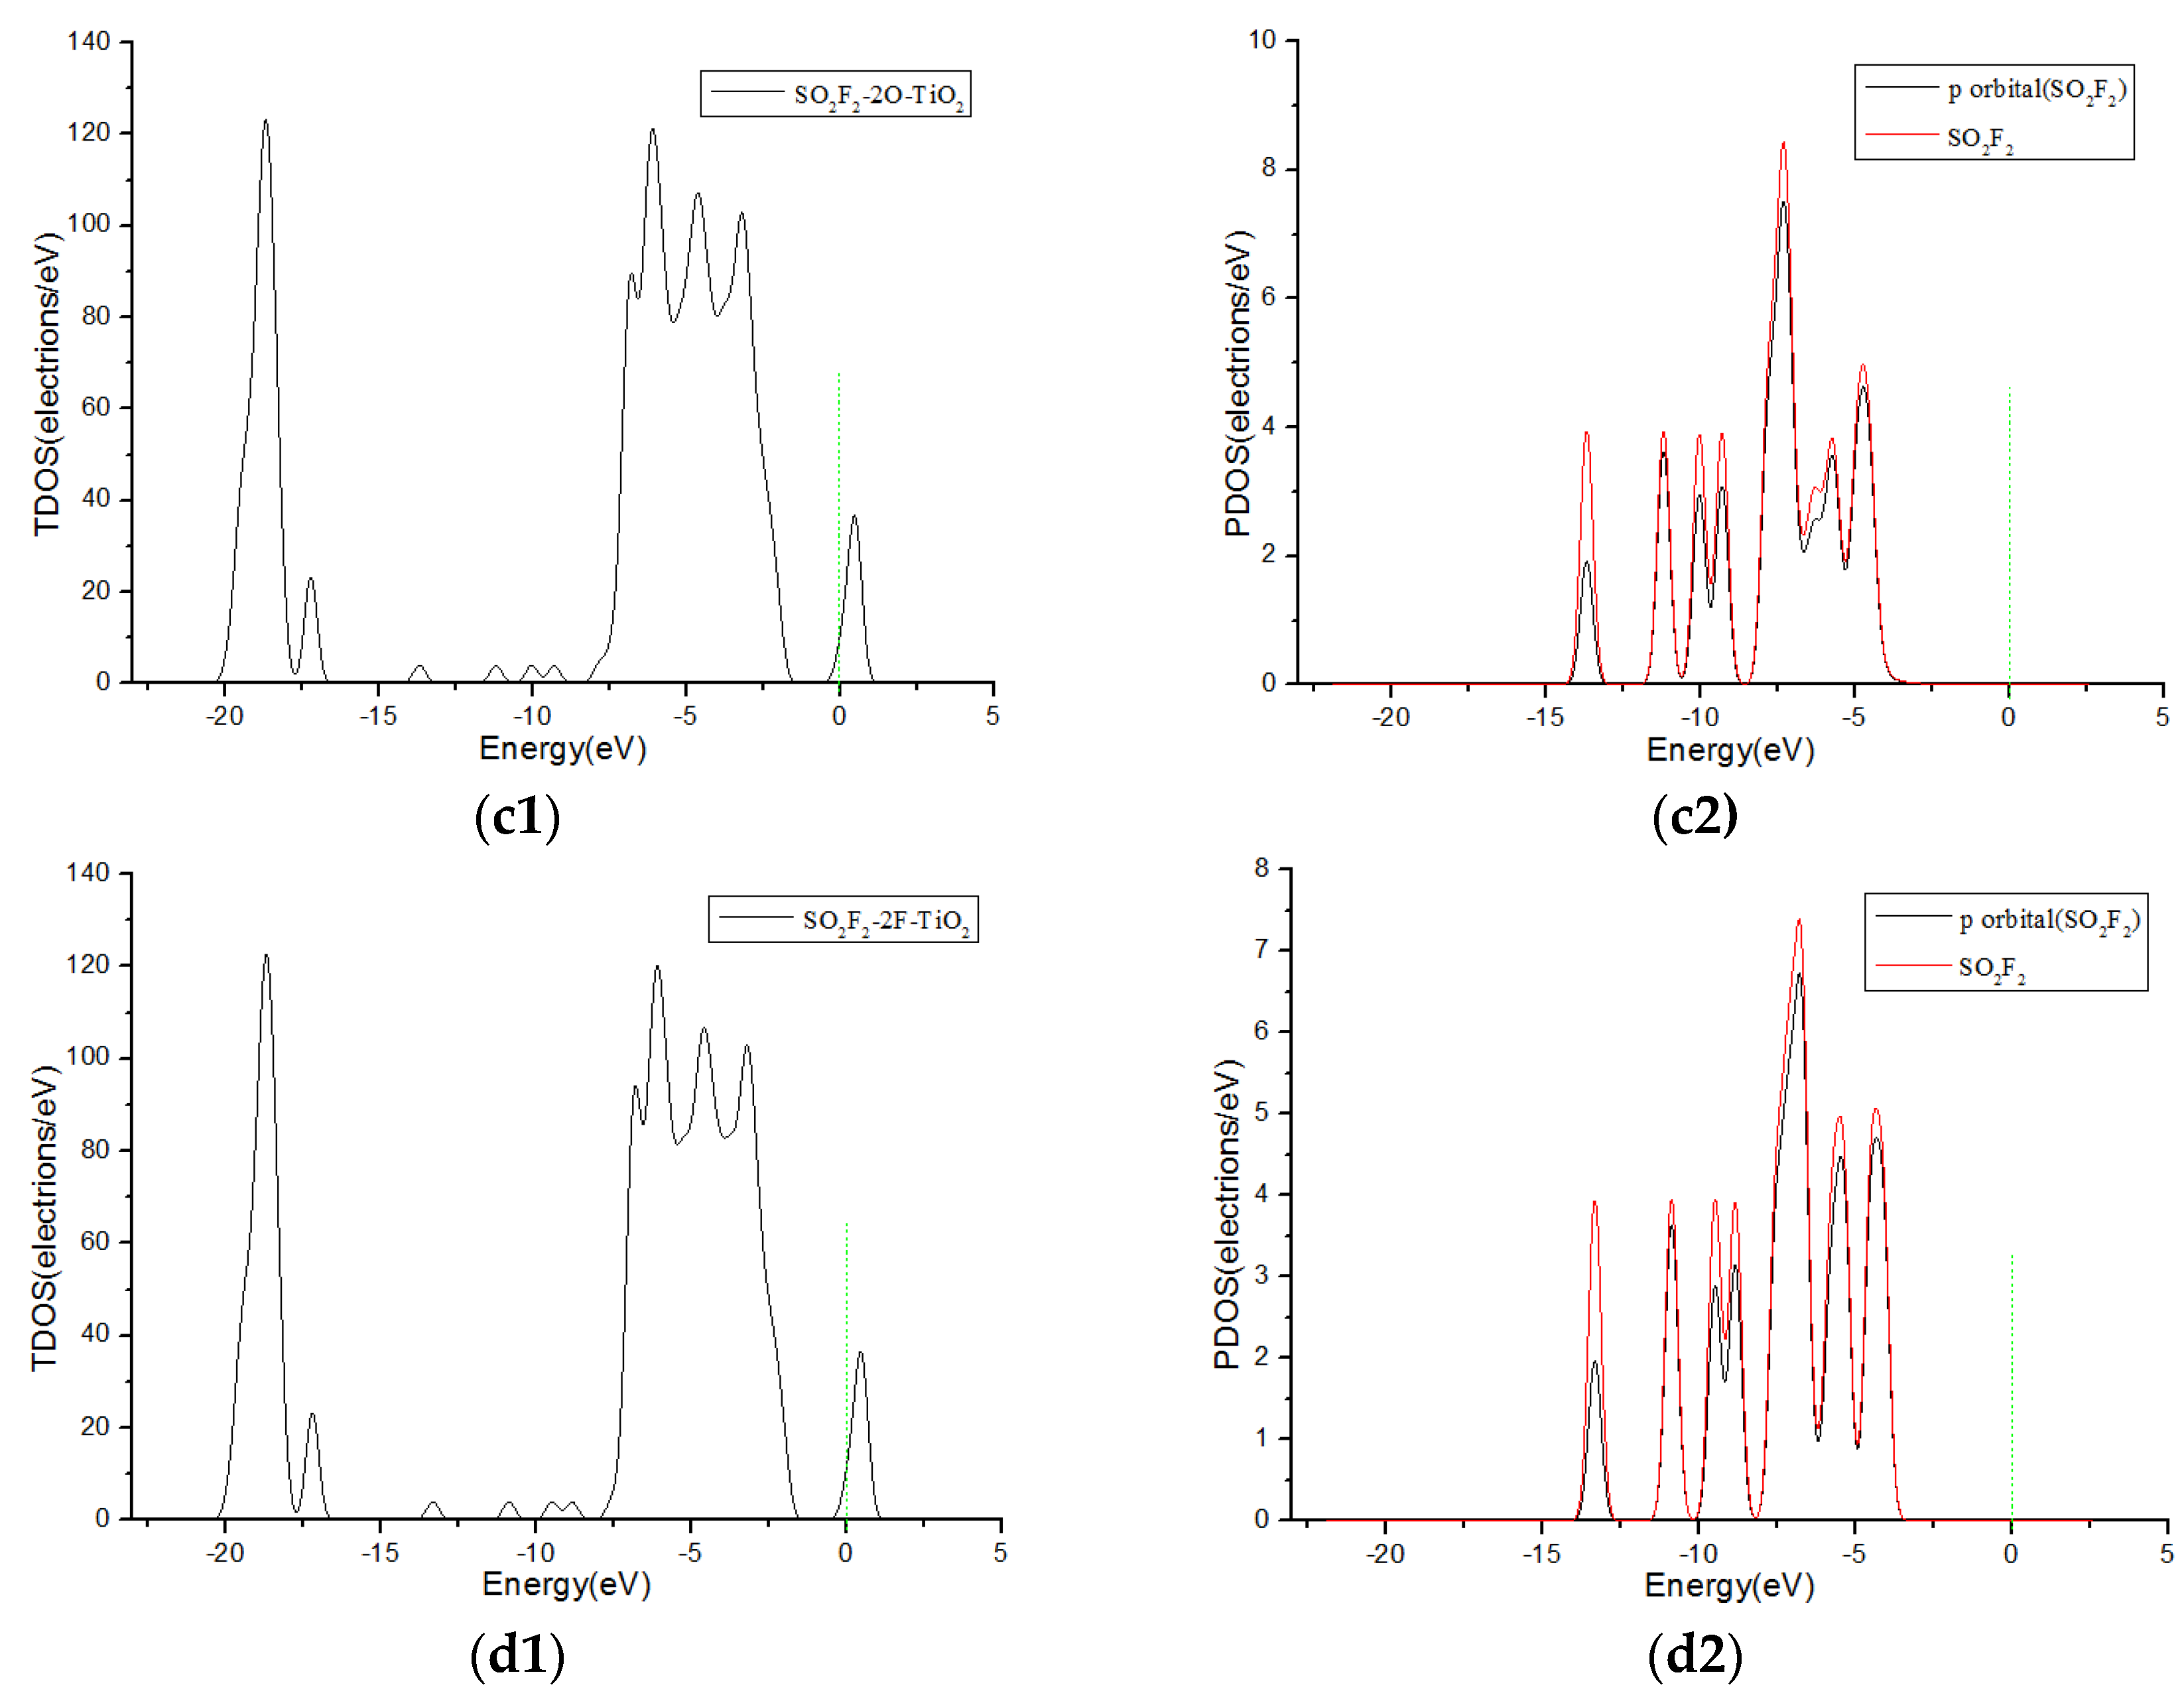
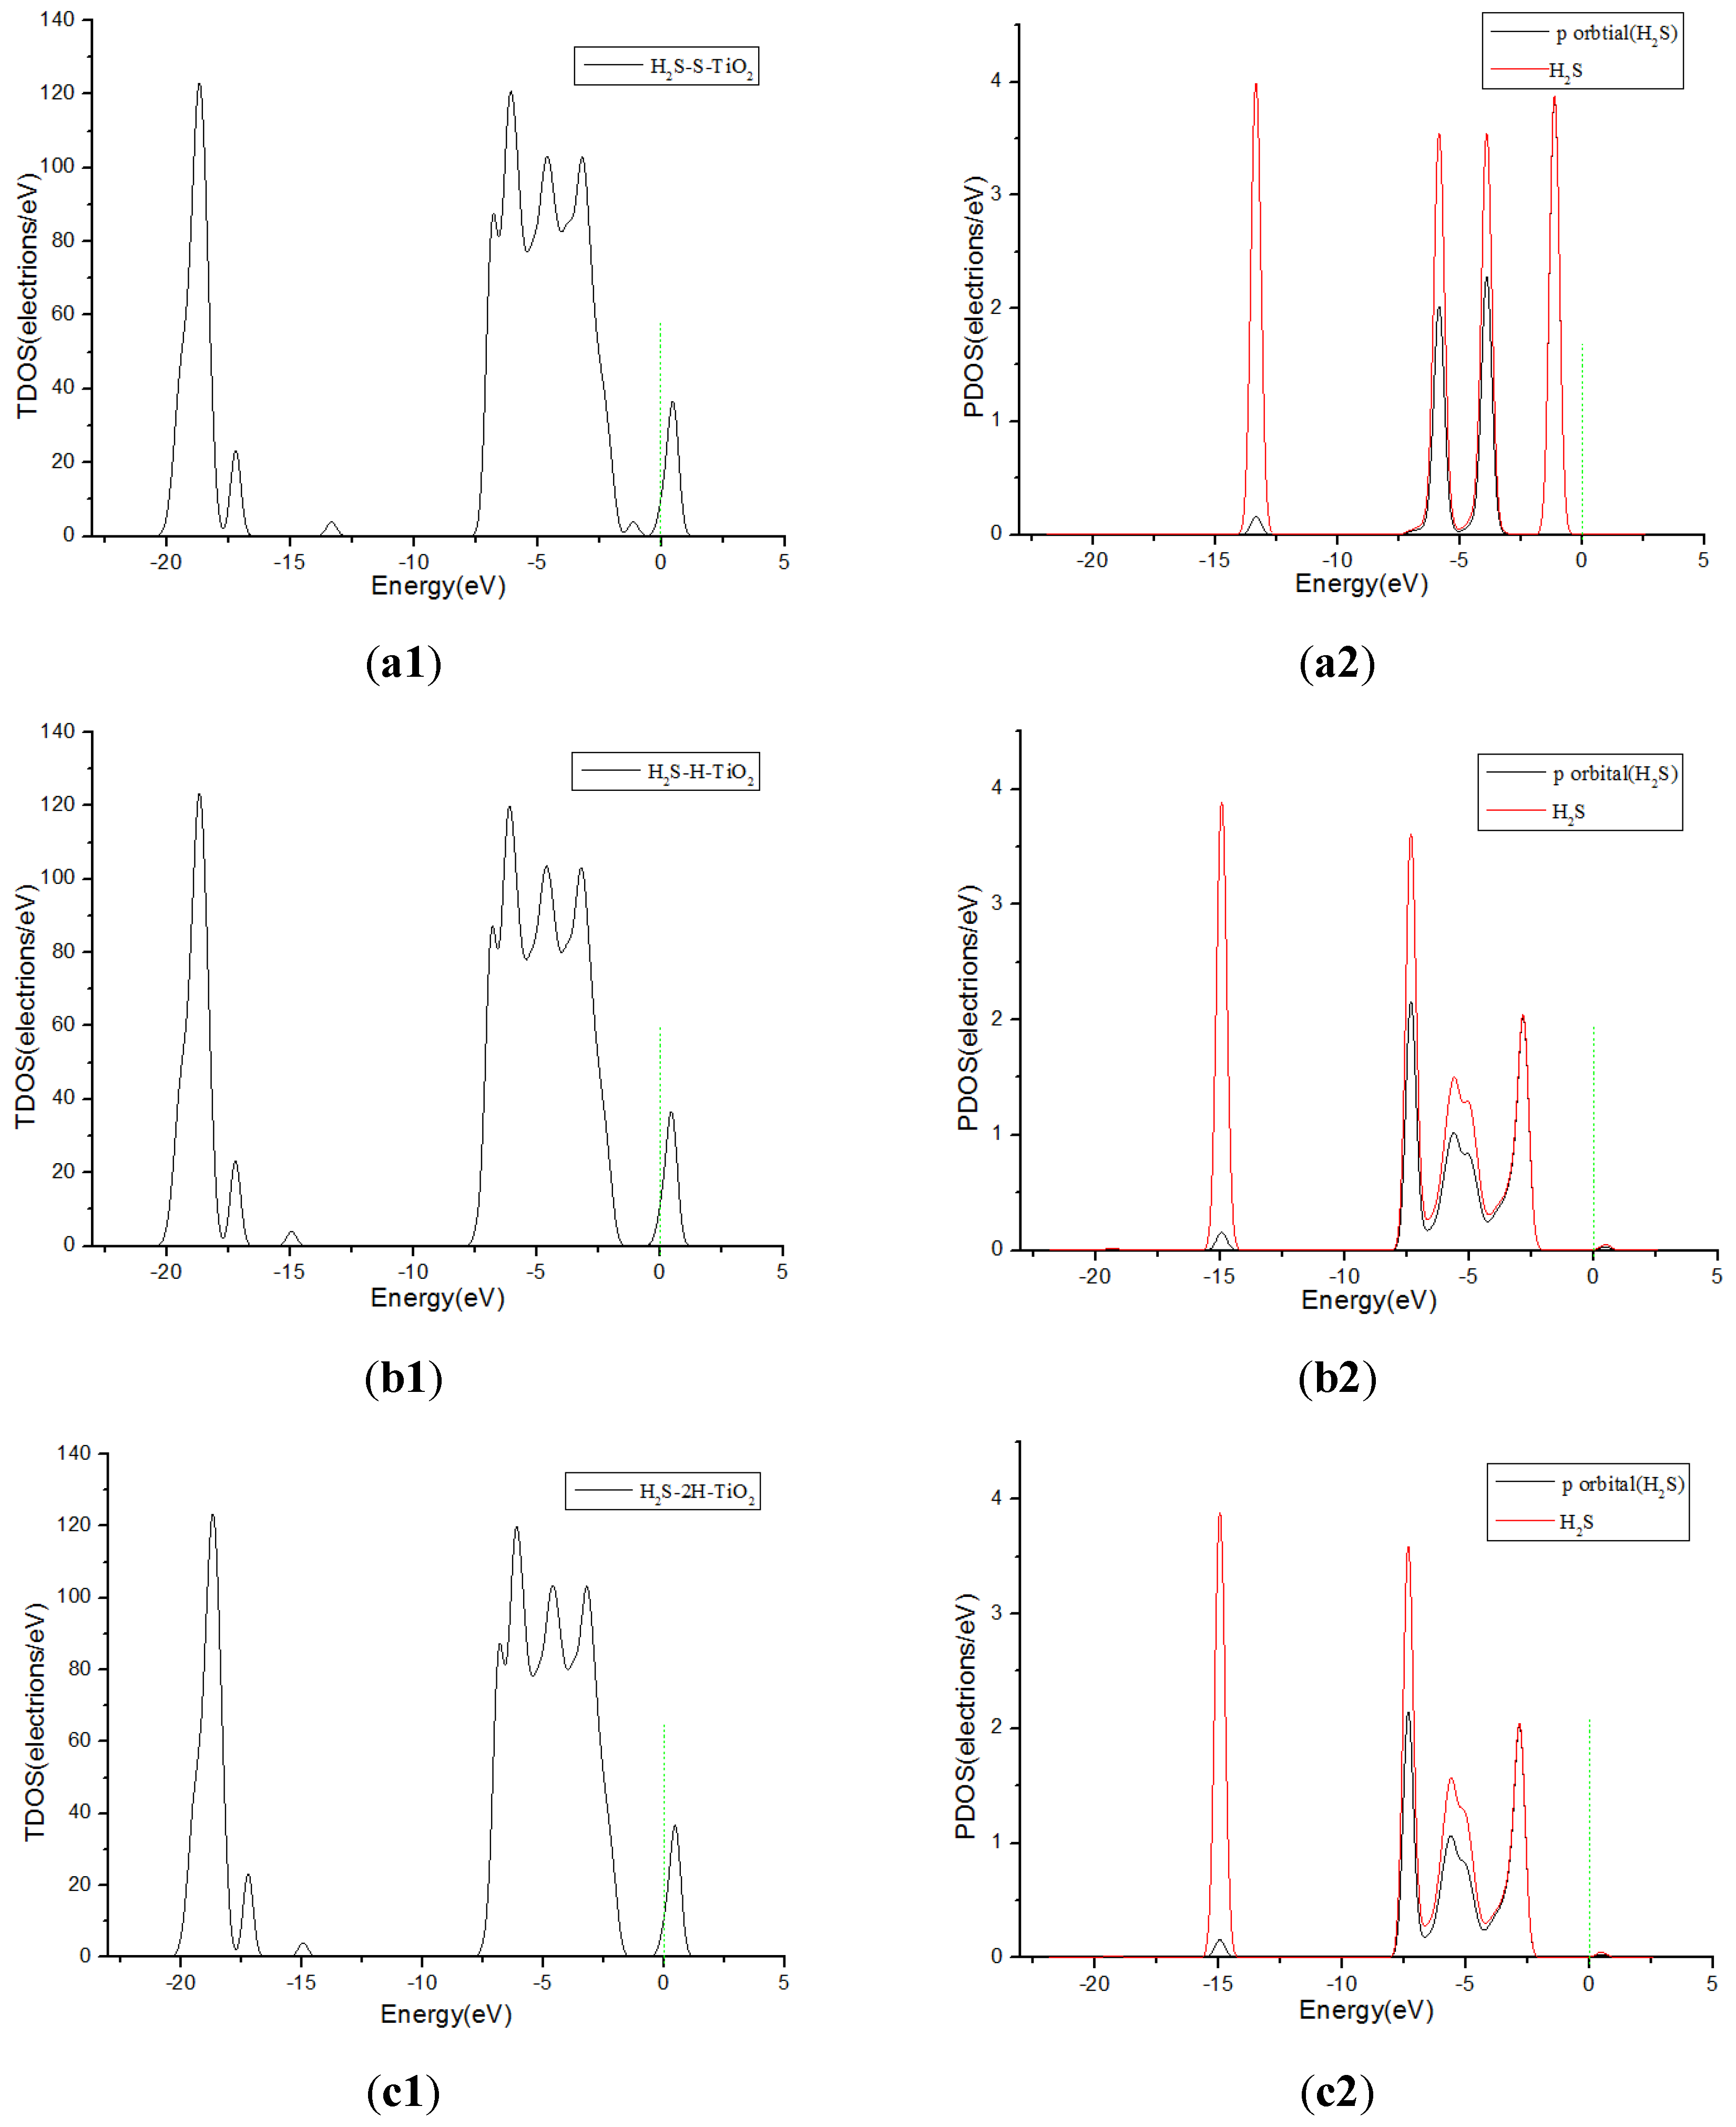
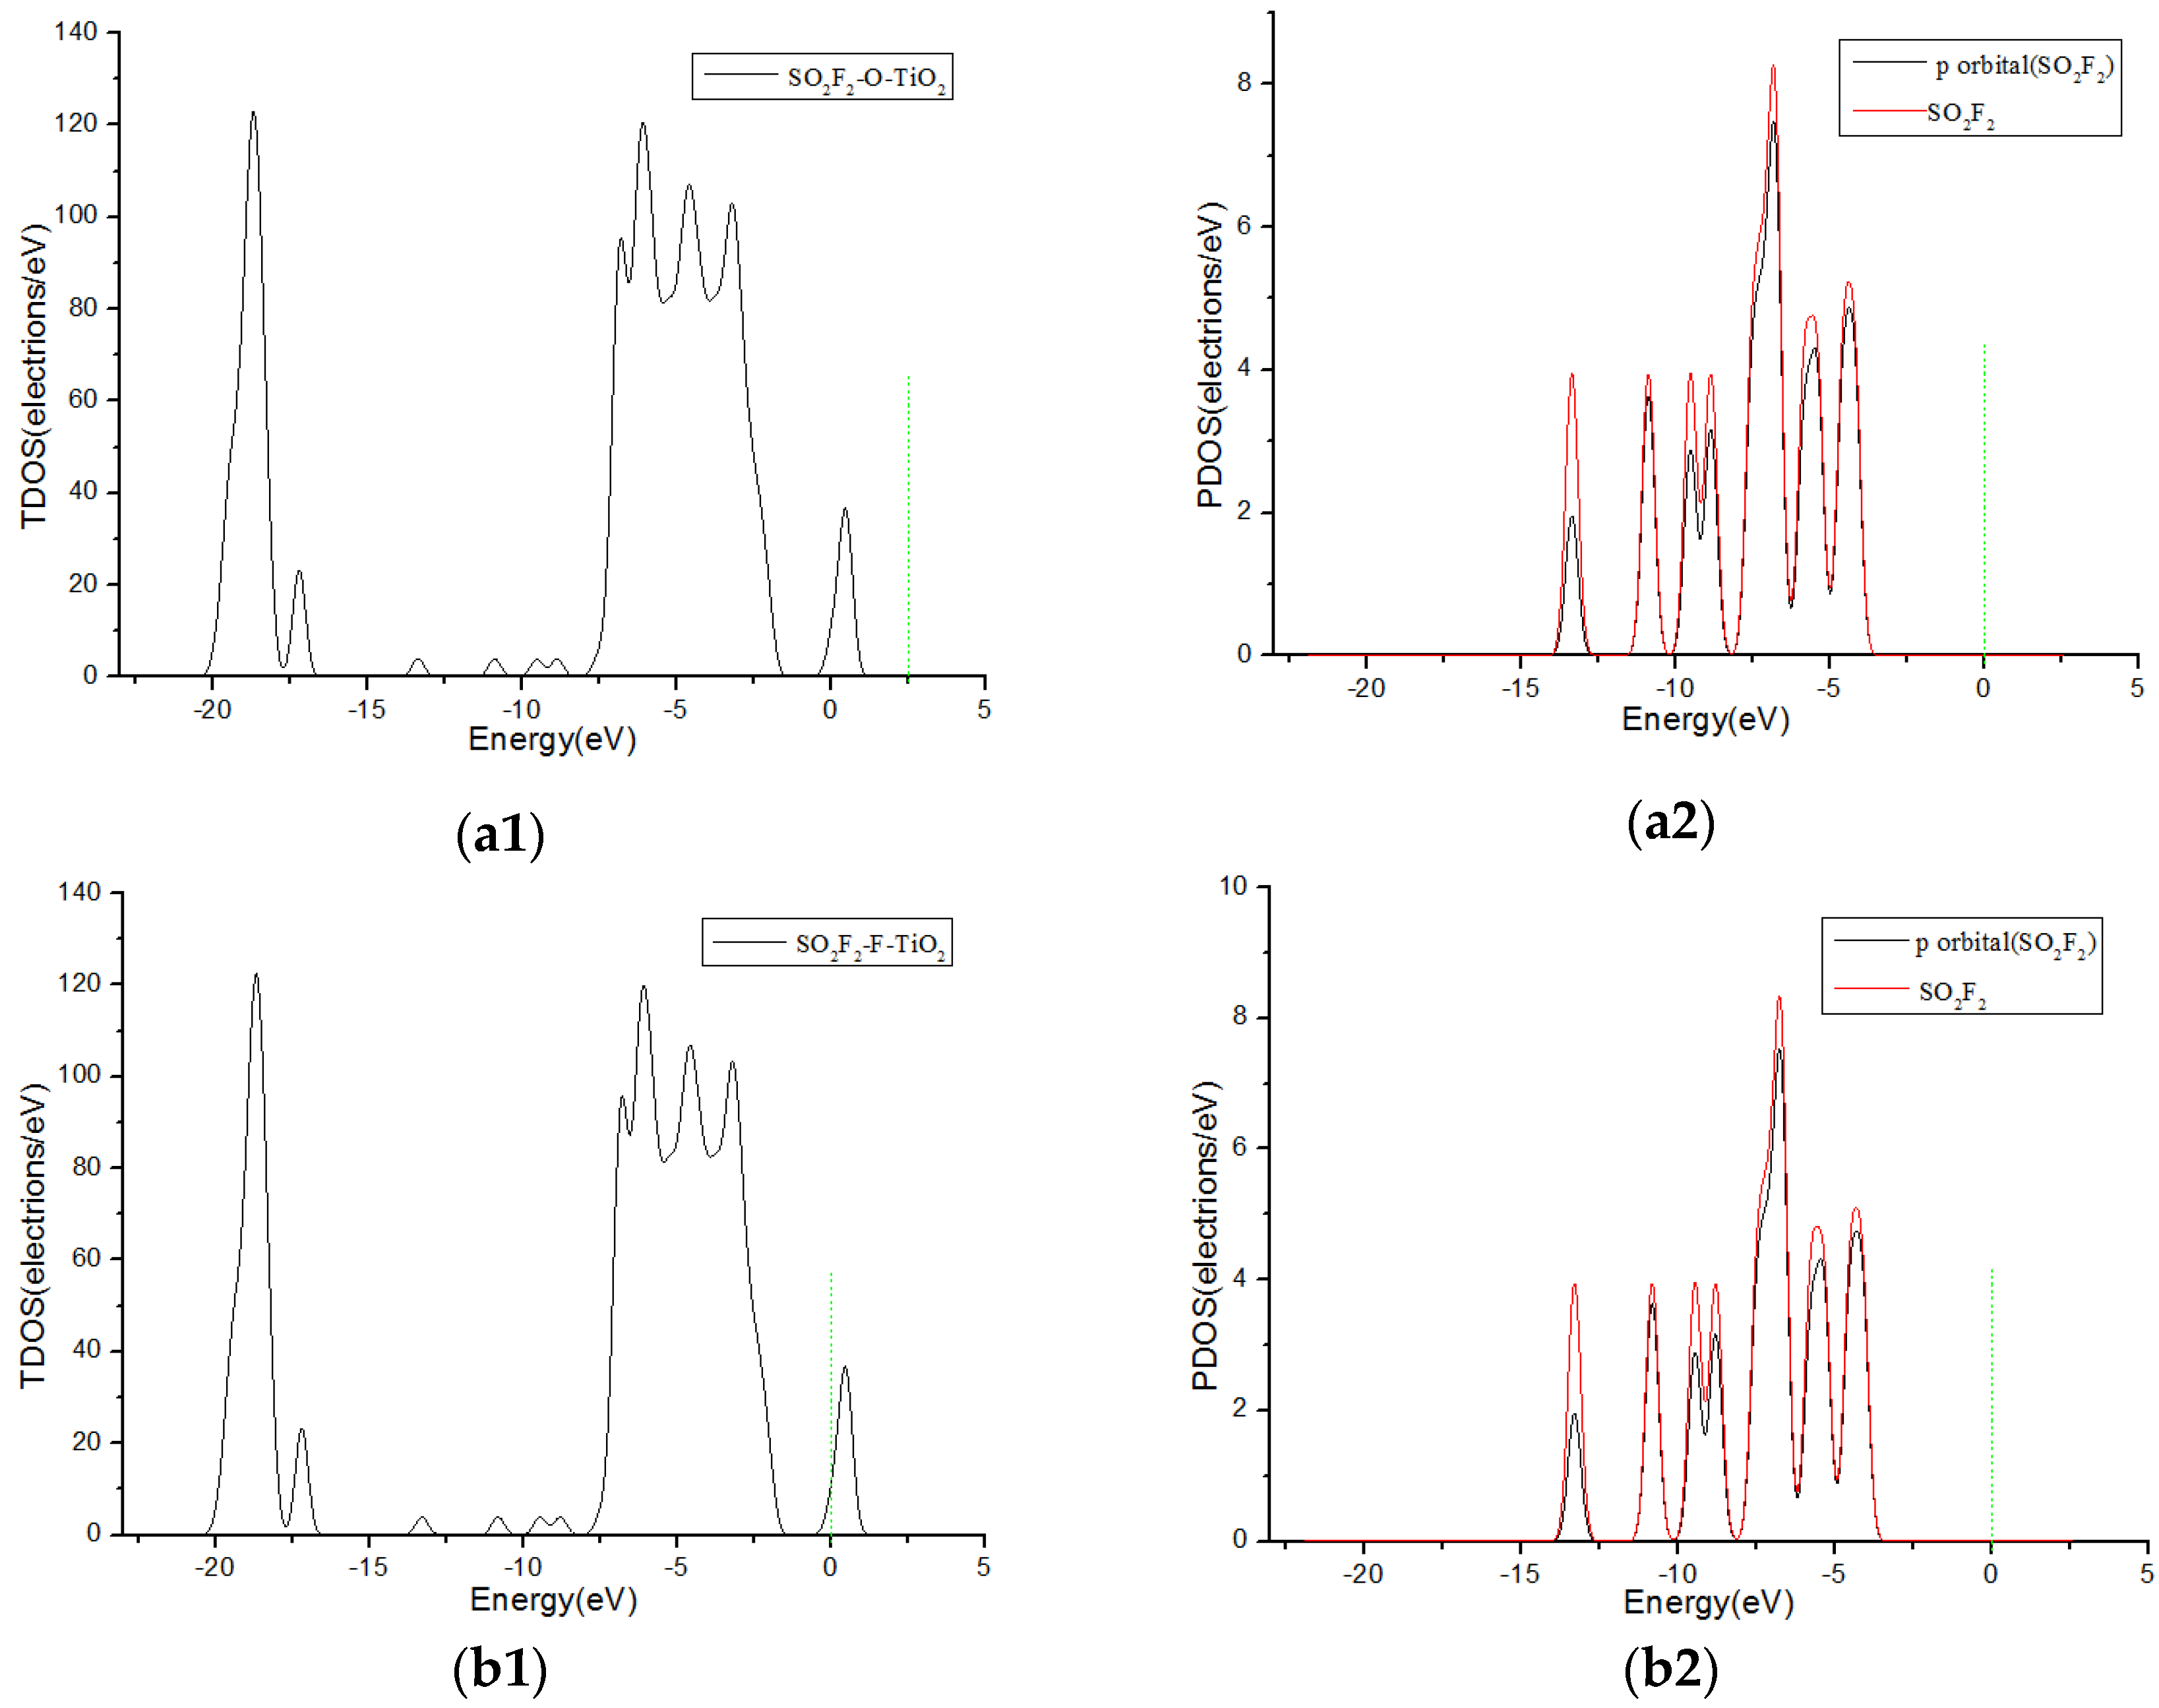
3.3. Analysis of Density of States

When different gas molecules adsorb on the surface of the gas sensor, the resistance of the sensor may change; the fluorine-doped TiO2 nanotube array gas sensor mainly uses this principle to achieve the detection of SF6 decomposition components. So, one of the key parameters in practical applications is the resistance of the sensor and analysis of DOS of the adsorption system can be used to find the reasons from the change in resistance.
Figure 5 shows the total density of states (TDOS) and the partial density of states (PDOS) curves of SO2 molecules adsorbed on F-doped TiO2. Since the contributes of p-orbit of the gas molecule is greatest to DOS, it is also presented in the figure. It can be seen from Figure 5(a1–b2), when the single S atom and the single O atom are close to the F-doped TiO2 crystal plane, the SO2 gas molecules contribute to the DOS of the adsorption system only on the right side of 0 eV. But, It can be seen from Figure 5(c1,c2), when the SO2 molecule close to the crystal plane with two O atoms at the same time, the SO2 molecules have a significant contribution to the DOS of the adsorption system on the both sides of 0 eV. This corresponds to the charge transfer amount (−0.013 e, 0 e and −0.12 e, respectively) when the SO2 molecules are adsorbed in three different ways in Table 1. It is shown that SO2 molecules are more likely to react and adsorb on the crystal plane approaching in the form of with two O atoms. The theoretical analysis shows that SO2 gas obtain electrons when adsorbed onto the fluorine-doped TiO2 nano sensors, and the macroscopic gas-sensing properties show an increase in impedance.
Figure 6 shows TDOS and PDOS curves of H2S molecules adsorbed onto F-doped TiO2. When the H2S gas molecules close to the F-doped TiO2 crystal plane with single S atom, the gas molecules have little contribution to DOS at 0 eV in Figure 6(a1,a2). However, when H2S molecules approach the F-doped TiO2 crystal plane with single H atom and two H atoms at the same time separately, the molecules have a significant contribution to the DOS on the right side of 0 eV in Figure 6(b1–c2). This corresponds to the charge transfer amount (0.008 e, 0.267 e and 0.266 e, respectively) when the H2S molecule close to the crystal plane with single S atom, single H atom and two H atoms at the same time in Table 1. It is shown that H2S molecules are more likely to be adsorbed on the crystal plane approaching in the form of a single H atom and two H atoms at the same time. Similarly, SOF2 gas molecules are more likely to adsorb by single O, single F atom, and two F atoms at the same time when coming close to the crystal plane than by single S atom. The TDOS and PDOS curves of SOF2 adsorption systems are shown in Figure 7. The theoretical analysis shows that H2S and SOF2 gases lose electrons when adsorbed onto the fluorine-doped TiO2 nano sensors, and the macroscopic gas-sensing properties show a decrease in impedance. Furthermore, the changed value of impedance of H2S is bigger than SOF2.
No matter which way the SO2F2 gas molecules approaching the crystal surface, the contribution to the DOS is almost 0 on both sides of 0eV, as shown in Figure 8. It can also be seen from Table 1 that the charge transfer is very small when SO2F2 molecules come close to the F-doped TiO2 crystal plane. The theoretical analysis indicates that the changed value of impedance of SO2F2 is small on the macro level when adsorbed onto the fluorine-doped TiO2 nano sensors. It can be assumed that the selectivity of fluorine-doped TiO2 nanotubes gas sensor to SO2F2 gas is weak.

3.4. Comparison of Adsorption Results under Different Doping Conditions

The reference [30] shows the adsorption results of SO2, SOF2 and SO2F2 onto the intrinsic anatase TiO2 (101) perfect crystal plane. By comparison, the adsorption structure of the three kinds of gas molecules adsorbed on the intrinsic anatase TiO2 (101) perfect crystal plane in the reference is similar to that of Figure 4c,h,m. Therefore, in order to make the comparison results more meaningful, adsorption parameters of adsorption structure in Figure 4c,h,m were chosen to be compared.
After fluorine doping on the anatase TiO2 (101) perfect crystal plane, the adsorption energy and charge transfer amount of the SO2, SOF2 and SO2F2 gas molecules adsorption system obviously increased, and the adsorption distance also decreased correspondingly. In addition, the adsorption energy of SO2 gas molecules adsorbed on F-doped TiO2 crystal plane is −0.617 eV, which indicates that the adsorption of SO2 gas molecules onto the F-doped TiO2 crystal plane was chemical adsorption.
The DOS were also compared and analyzed. In this paper, the corresponding TDOS and PDOS of the adsorption structures of three gas molecules are shown in Figure 5(c1,c2), Figure 7(b1,b2) and Figure 8(c1,c2). It was found that the contribution of SO2 and SOF2 molecules to the PDOS near 0eV significantly increased after fluorine doping, which corresponded to the charge transfer of the adsorption systems in the two cases. Because the crystal shows weak adsorption reaction to SO2F2 gas molecules before and after doping, the contribution of SO2F2 gas molecules to PDOS did not changed much at 0 eV. Through the above analysis, it can be concluded that the adsorption ability of the anatase TiO2 (101) crystal plane to the three gas molecules is enhanced after fluorine doping.
Reference [31] reported modified TiO2 crystal plane by nitrogen doping to detect SF6 decomposition components. It can be seen that SO2 molecules are more likely to adsorb on nitrogen-doped TiO2 crystal plane with S atom. SOF2 is more likely to adsorb on nitrogen-doped TiO2 crystal plane with O and S atoms, respectively. The adsorption of SO2 and SOF2 on nitrogen-doped TiO2 crystal plane is stronger than that on fluorine-doped TiO2 crystal plane. However, when nitrogen-doped TiO2 crystal plane reacts with SO2 and SOF2, the adsorption energy, charge transfer amount and adsorption distance have little difference, and the macro-gas-sensing characteristics all show the decrease of impedance. Therefore, nitrogen-doped TiO2 cannot effectively distinguish SO2 and SOF2. When fluorine-doped TiO2 crystal plane react with SO2, SO2 molecule obtains electrons, and fluorine-doped TiO2 gas sensor macro-gas-sensing characteristics show the increase of impedance. When fluorine-doped TiO2 crystal plane adsorb SOF2, SOF2 molecule loses electrons, and fluorine-doped TiO2 gas sensor macro-gas-sensing characteristics show the decrease of impedance. Although the adsorption of SO2 and SOF2 on fluorine-doped TiO2 crystal plane is weaker than that of nitrogen-doped TiO2 crystal plane, fluorine-doped TiO2 can effectively distinguish SO2 and SOF2.

4. Conclusions

In this paper, one O atom of the anatase TiO2 (101) perfect crystal plane is replaced by one F atom to obtain a fluorine-doped anatase TiO2 (101) perfect crystal plane model. H2S, SO2, SOF2 and SO2F2 of SF6 decomposition components adsorb on the F-doped TiO2 crystal plane in different ways to obtain different adsorption systems, which were then optimized. The adsorption mechanism is obtained by the optimized adsorption parameters. The adsorption results were compared and analyzed with intrinsic and nitrogen doping, with the effects of different doping on adsorption parameters studied. Through the above analysis, the following conclusions are drawn:
(1) Four kinds of gas molecules are close to the crystal plane, which cause gas molecules to be adsorbed on the crystal plane more easily. The adsorption ability of four kinds of gas molecules onto F-doped TiO2 crystal plane is: H2S > SO2 > SOF2 > SO2F2.
(2) The adsorption capacity of TiO2 to SO2, SOF2 and SO2F2 is obviously enhanced after fluorine doping, and the degree of the adsorption to SO2 gas molecules has reached the chemical adsorption.
(3) Based on the change of resistance of fluorine-doped TiO2 sensors on the macro level can effectively distinguish SO2 and SOF2 from theoretical analysis, even though the adsorption of SF6 decomposition components onto nitrogen-doped TiO2 crystal plane is stronger than that on fluorine-doped TiO2 crystal plane.

Acknowledgments

We gratefully acknowledge the financial support from National Natural Science Foundation of P.R. China (project No. 51277188).

Author Contributions

Xiaoxing Zhang designed the project, instructed the research and modified the manuscript. Jun Zhang wrote and modified the manuscript. Fan Liu, Xingchen Dong and Hao Cui modified the manuscript.

Conflicts of Interest

The authors declare no conflict of interest.

References

  1. Zeng, F.; Tang, J.; Fan, Q.; Pan, J.; Zhang, X.; Yao, Q.; He, J. Decomposition characteristics of SF6 under thermal fault for temperatures below 400 °C. IEEE Trans. Dielectr. Electr. Insul. 2014, 21, 995–1004. [Google Scholar] [CrossRef]
  2. Derdouri, A.; Casanovas, J.; Hergli, R.; Grob, R.; Mathieu, J. Study of the decomposition of wet SF6, subjected to 50-Hz ac corona discharges. J. Appl. Phys. 1989, 65, 1852–1857. [Google Scholar] [CrossRef]
  3. Tang, J.; Zeng, F.; Pan, J.; Zhang, X.; Yao, Q.; He, J.; Hou, X. Correlation analysis between formation process of SF6 decomposed components and partial discharge qualities. IEEE Trans. Dielectr. Electr. Insul. 2013, 20, 864–875. [Google Scholar] [CrossRef]
  4. Zeng, F.; Tang, J.; Zhang, X.; Xie, Y.; Yao, Q.; Miao, Y.; Zhang, C. Reconstructing and extracting information on SF6 decomposition characteristic components induced by partial overthermal fault in GIE. IEEE Trans. Dielectr. Electr. Insul. 2016, 23, 183–193. [Google Scholar] [CrossRef]
  5. Casanovas, A.M.; Casanovas, J.; Lagarde, F.; Belarbi, A. Study of the decomposition of SF6 under dc negative polarity corona discharges (point-to-plane geometry): Influence of the metal constituting the plane electrode. Evolution 1992, 72, 3344–3354. [Google Scholar]
  6. Beyer, C.; Jenett, H.; Klockow, D. Influence of reactive SFx, gases on electrode surfaces after electrical discharges under SF6 atmosphere. IEEE Trans. Dielectr. Electr. Insul. 2000, 7, 234–240. [Google Scholar] [CrossRef]
  7. Zhang, X.; Dai, Z.; Wei, L.; Liang, N.; Wu, X. Theoretical calculation of the gas-sensing properties of Pt-decorated carbon nanotubes. Sensors 2013, 13, 15159–15171. [Google Scholar] [CrossRef] [PubMed]
  8. Zhang, X.; Gui, Y.; Dai, Z. A simulation of Pd-doped SWCNTs used to detect SF6, decomposition components under partial discharge. Appl. Surf. Sci. 2014, 315, 196–202. [Google Scholar] [CrossRef]
  9. Zhang, X.; Dai, Z.; Chen, Q.; Tang, J. A DFT study of SO2 and H2S gas adsorption on Au-doped single-walled carbon nanotubes. Phys. Scr. 2014, 89, 065803. [Google Scholar] [CrossRef]
  10. Zhang, X.; Yang, B.; Wang, X.; Luo, C. Effect of Plasma Treatment on Multi-Walled Carbon Nanotubes for the Detection of H2S and SO2. Sensors 2012, 12, 9375–9385. [Google Scholar] [CrossRef] [PubMed]
  11. Zhang, X.; Wu, X.; Yu, L.; Zhou, J. Highly sensitive and selective polyaniline thin-film sensors for detecting SF6, decomposition products at room temperature. Synth. Met. 2015, 200, 74–79. [Google Scholar] [CrossRef]
  12. Zhang, X.; Yu, L.; Wu, X.; Hu, W. Experimental Sensing and Density Functional Theory Study of H2S and SOF2Adsorption on Au-Modified Graphene. Adv. Sci. 2015, 2, 612. [Google Scholar] [CrossRef] [PubMed]
  13. Varghese, O.K.; Gong, D.; Paulose, M.; Ong, K.G.; Grimes, C.A. Hydrogen sensing using titania nanotubes. Sens. Actuators B Chem. 2003, 93, 338–344. [Google Scholar] [CrossRef]
  14. Mor, G.K.; Varghese, O.; Paulose, M.; Mukherjee, N.; Grimes, C. Fabrication of tapered, conical-shaped titania nanotubes. J. Mater. Res. 2003, 18, 2588–2593. [Google Scholar] [CrossRef]
  15. Nakamura, R.; Tomoaki, T.; Nakato, Y. Mechanism for Visible Light Responses in Anodic Photocurrents at N-Doped TiO2 Film Electrodes. J. Phys. Chem. B 2004, 108, 10617–10620. [Google Scholar] [CrossRef]
  16. Valentin, C.D.; Pacchioni, G.; Selloni, A.; Livraghi, S.; Giamello, E. Characterization of paramagnetic species in N-doped TiO2 powders by EPR spectroscopy and DFT calculations. J. Phys. Chem. B 2005, 109, 11414. [Google Scholar] [CrossRef] [PubMed]
  17. Jagadale, T.C.; Takale, S.P.; Sonawane, R.S. N-Doped TiO2 Nanoparticle Based Visible Light Photocatalyst by Modified Peroxide Sol−Gel Method. J. Phys. Chem. C 2008, 112, 14595–14602. [Google Scholar] [CrossRef]
  18. Zhang, J.; Wu, Y.; Xing, M.; Leghari, S.A.K.; Sajjad, S. Development of modified N doped TiO2 photocatalyst with metals, nonmetals and metal oxides. Energ. Environ. Sci. 2010, 3, 715–726. [Google Scholar] [CrossRef]
  19. Yang, G.; Jiang, Z.; Shi, H.; Xiao, T.; Yan, Z. Preparation of highly visible-light active N-doped TiO2 photocatalyst. J. Mater. Chem. 2010, 20, 5301–5309. [Google Scholar] [CrossRef]
  20. Ho, W.; Yu, J.C.; Lee, S. Synthesis of hierarchical nanoporous F-doped TiO2 spheres with visible light photocatalytic activity. Chem. Commun. 2006, 111, 1115–1117. [Google Scholar] [CrossRef] [PubMed]
  21. Yu, C.; Fan, Q.; Xie, Y.; Chen, J.; Shu, Q.; Yu, J.C. Sonochemical fabrication of novel square-shaped F doped TiO2 nanocrystals with enhanced performance in photocatalytic degradation of phenol. J. Hazard. Mater. 2012, 237–238, 38–45. [Google Scholar] [CrossRef] [PubMed]
  22. Huang, D.G.; Liao, S.J.; Dang, Z. Preparation, characterization and photocatalytic performance of anatase F doped TiO2 sol. Acta Chim. Sin. 2006, 64, 1805–1811. [Google Scholar]
  23. Guo, M.; Zhang, X.; Liang, C.; Jia, G. Mechanism of Visible Photoactivity of F-Doped TiO2. Chin. Phys. Lett. 2010, 27, 204–207. [Google Scholar]
  24. Li, D.; Haneda, H.; Labhsetwar, N.K.; Hishita, S.; Ohashi, N. Visible-light-driven photocatalysis on fluorine-doped TiO2, powders by the creation of surface oxygen vacancies. Chem. Phys. Lett. 2005, 401, 579–584. [Google Scholar] [CrossRef]
  25. Hattori, A.; Tada, H. High Photocatalytic Activity of F-Doped TiO2 Film on Glass. J. Sol-Gel Sci. Technol. 2001, 22, 47–52. [Google Scholar] [CrossRef]
  26. Hazra, S.K.; Kim, N.K.; Park, J.; Choi, B.; Lee, S. Gettering by cf4-ar plasma-treated titanium within anodically bonded glass-silicon microcavities. Sens. Mater. 2009, 21, 37–51. [Google Scholar]
  27. Perdew, J.P.; Wang, Y. Accurate and simple analytic representation of the electron-gas correlation energy. Phys. Rev. B 1992, 45, 13244. [Google Scholar] [CrossRef]
  28. Li, D.; Ohashi, N.; Hishita, S.; Kolodiazhnyi, T.; Haneda, H. Origin of visible-light-driven photocatalysis: A comparative study on N/F-doped and N-F-codoped TiO2 powders by means of experimental characterizations and theoretical calculations. J. Solid State Chem. 2005, 178, 3293–3302. [Google Scholar] [CrossRef]
  29. Li, D.; Haneda, H.; Hishita, S.; Ohashi, N.; Labhsetwar, N.K. Fluorine-doped TiO2, powders prepared by spray pyrolysis and their improved photocatalytic activity for decomposition of gas-phase acetaldehyde. J. Fluorine Chem. 2005, 126, 69–77. [Google Scholar] [CrossRef]
  30. Zhang, X.; Chen, Q.; Hu, W.; Zhang, J. A DFT study of SF6 decomposed gas adsorption on an anatase (1 0 1) surface. Appl. Surf. Sci. 2013, 286, 47–53. [Google Scholar] [CrossRef]
  31. Dong, X.; Zhang, X.; Cui, H.; Zhang, J. A first principle simulation of competitive adsorption of SF6 decomposition components on nitrogen-doped anatase TiO2 (101) surface. Appl. Surf. Sci. 2017, 422, 331–338. [Google Scholar] [CrossRef]
Figure 1. Perfect crystal model of intrinsic anatase TiO2 (101) and SO2, H2S, SOF2 and SO2F2 gas molecular models, Ti atom is gray, O atom is red, S atom is yellow, F atom is blue, H atom is white.
Sensors 17 01907 g001
Figure 2. F-doped TiO2 model, (Y1) is the main view of the model, and (Y2) is the top view of the model.
Sensors 17 01907 g002
Figure 3. The curves of the density of states of F-doped TiO2 and intrinsic anatase TiO2 (101) perfect crystal plane, the green short dashed line is Fermi level.
Sensors 17 01907 g003
Figure 4. The adsorption structures of four gas molecules adsorbed on the crystal surface in different ways. (an) are the adsorption structure of four gas molecules adsorbed on the F-doped TiO2 crystal plane in different ways after complete optimization calculation.
Sensors 17 01907 g004aSensors 17 01907 g004b
Figure 5. The total density and partial density of SO2 molecules adsorbed on F-doped TiO2, and the green short dashed line is Fermi level. (a1,a2) are the TDOS and PDOS of SO2-S-TiO2, (b1,b2) are the TDOS and PDOS of SO2-O-TiO2, (c1,c2) are the TDOS and PDOS of SO2-2O-TiO2.
Sensors 17 01907 g005
Figure 6. TDOS and PDOS of H2S molecules adsorbed onto F-doped TiO2, and the green short dashed line is Fermi level. (a1,a2) are the TDOS and PDOS of H2S-S-TiO2, (b1,b2) are the TDOS and PDOS of H2S-H-TiO2, (c1,c2) are the TDOS and PDOS of H2S-2H-TiO2.
Sensors 17 01907 g006
Figure 7. TDOS and PDOS of SOF2 molecules adsorbed onto F-doped TiO2, and the green short dashed line is Fermi level. (a1,a2) are the TDOS and PDOS of SOF2-S-TiO2, (b1,b2) are the TDOS and PDOS of SOF2-O-TiO2,(c1,c2) are the TDOS and PDOS of SOF2-F-TiO2, (d1,d2) are the TDOS and PDOS of SOF2-2F-TiO2.
Sensors 17 01907 g007aSensors 17 01907 g007b
Figure 8. TDOS and PDOS of SO2F2 molecules adsorbed on F-doped TiO2, and the green short dashed line is Fermi level. (a1,a2) are the TDOS and PDOS of SO2F2-O-TiO2, (b1,b2) are the TDOS and PDOS of SO2F2-F-TiO2, (c1,c2) are the TDOS and PDOS of SO2F2-2O-TiO2, (d1,d2) are the TDOS and PDOS of SO2F2-2F-TiO2.
Sensors 17 01907 g008aSensors 17 01907 g008b
Table 1. Adsorption parameters of four gas molecules on the perfect crystal plane of F-doped TiO2.
Adsorption SystemAdsorption StructureAdsorption Energy Ea (eV)Charge transfer Amount Qt (e)Adsorption Distance (Å)
SO2-S-TiO2a−0.173−0.0132.847
SO2-O-TiO2b−0.13203.229
SO2-2O-TiO2c−0.617−0.122.111
H2S-S-TiO2d−0.2090.0082.835
H2S-H-TiO2e−0.8370.2672.714
H2S-2H-TiO2f−0.8360.2662.717
SOF2-S-TiO2g−0.254−0.0172.749
SOF2-O-TiO2h−0.4120.0982.438
SOF2-F-TiO2i−0.5340.0382.425
SOF2-2F-TiO2j−0.4230.0982.424
SO2F2-O-TiO2k−0.04403.091
SO2F2-F-TiO2l−0.051−0.0022.863
SO2F2-2O-TiO2m−0.3980.0462.652
SO2F2-2F-TiO2n−0.198−0.0032.833

