A Framework to Improve Energy Efficient Behaviour at Home through Activity and Context Monitoring


Abstract
1. Introduction
2. Related Work
2.1. Activity Monitoring and Contextual Information for Energy Efficiency
2.2. Real Time Localization Systems and Energy Saving
2.3. Social Computing for Energy Efficiency
3. CAFCLA Approach for Activity Monitoring and Energy Efficiency
3.1. CAFCLA Description
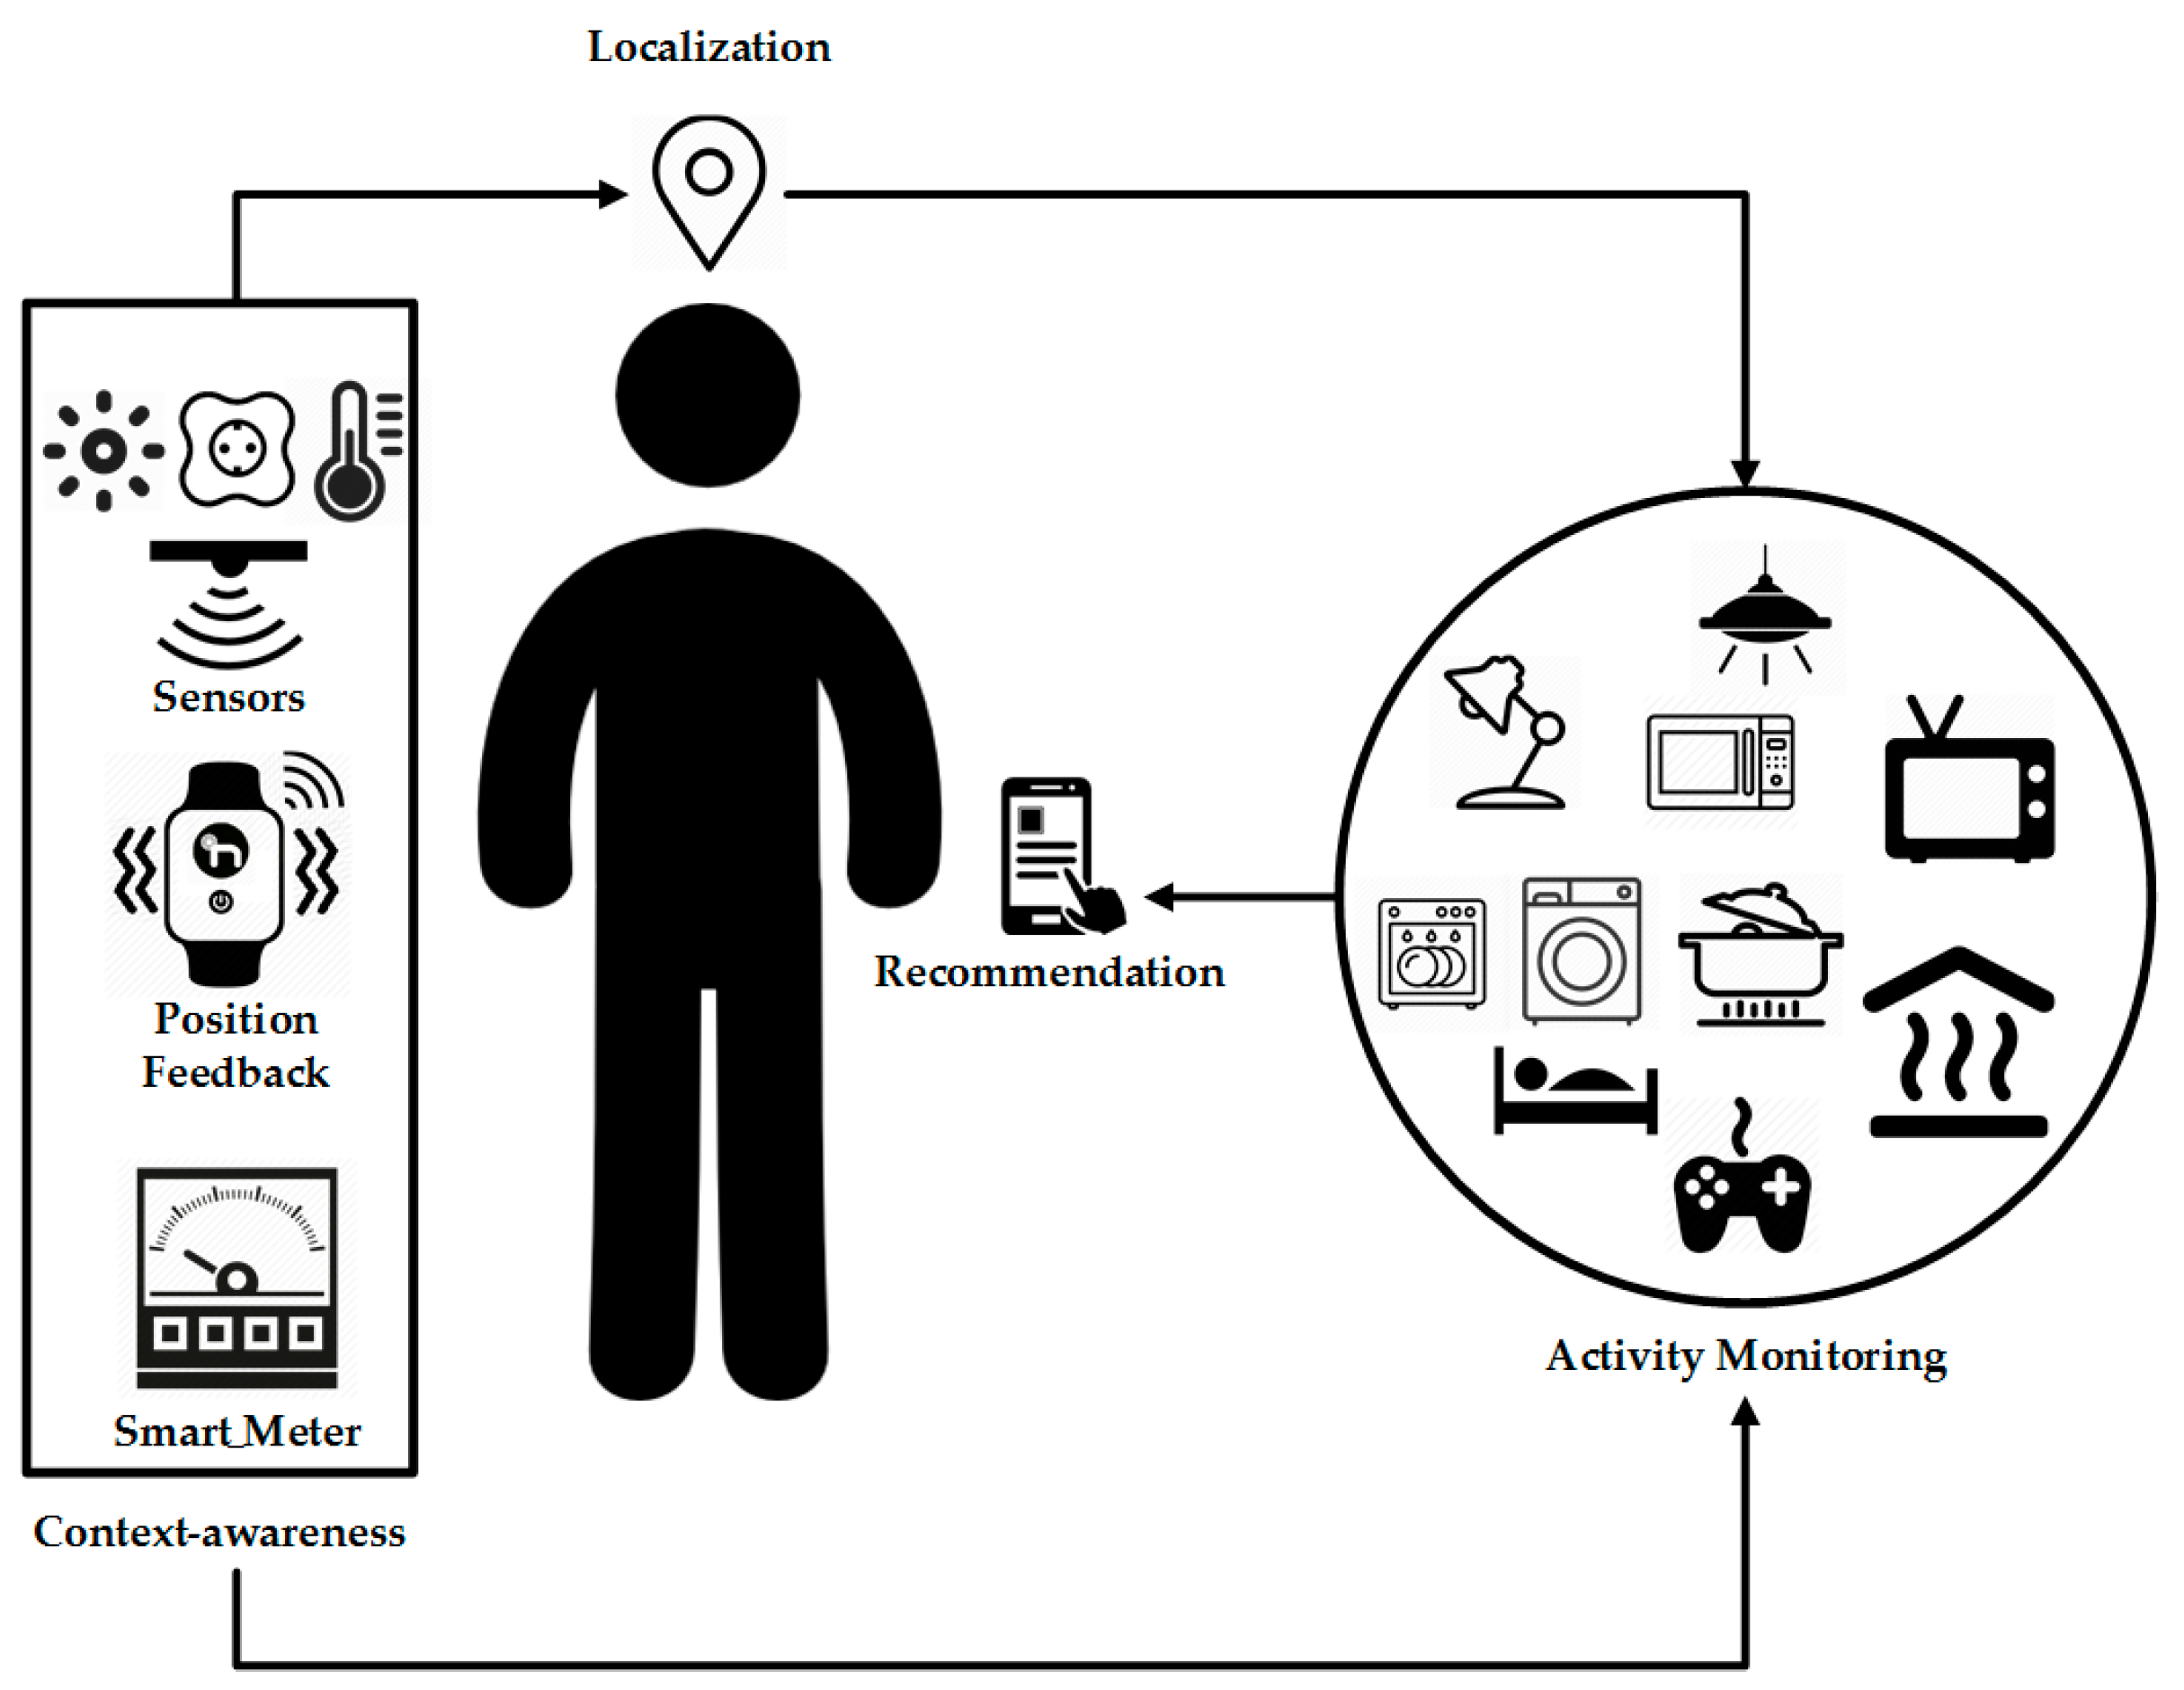
- It obtains contextual information through the implementation of Wireless Sensor Networks which collect data from multiple sources to define the environment. This includes sensors that collect environmental parameters (temperature, humidity or lighting) or data on device usage (the switching of lights and even the status of blinds and windows).
- It implements a Real-Time Localization System that allows users to be identified and tracked at all times. Users’ positions permit identifying patterns of behaviour that help to describe good or bad energy consumption habits.
- It integrates a social machine that provides users with recommendations. The social machine uses virtual organizations of agents to provide the system with intelligence. Monitoring of all contextual parameters, localization and tracking of users, management of communications and data, as well as the generation of recommendations for users encourage the efficient use of energy.
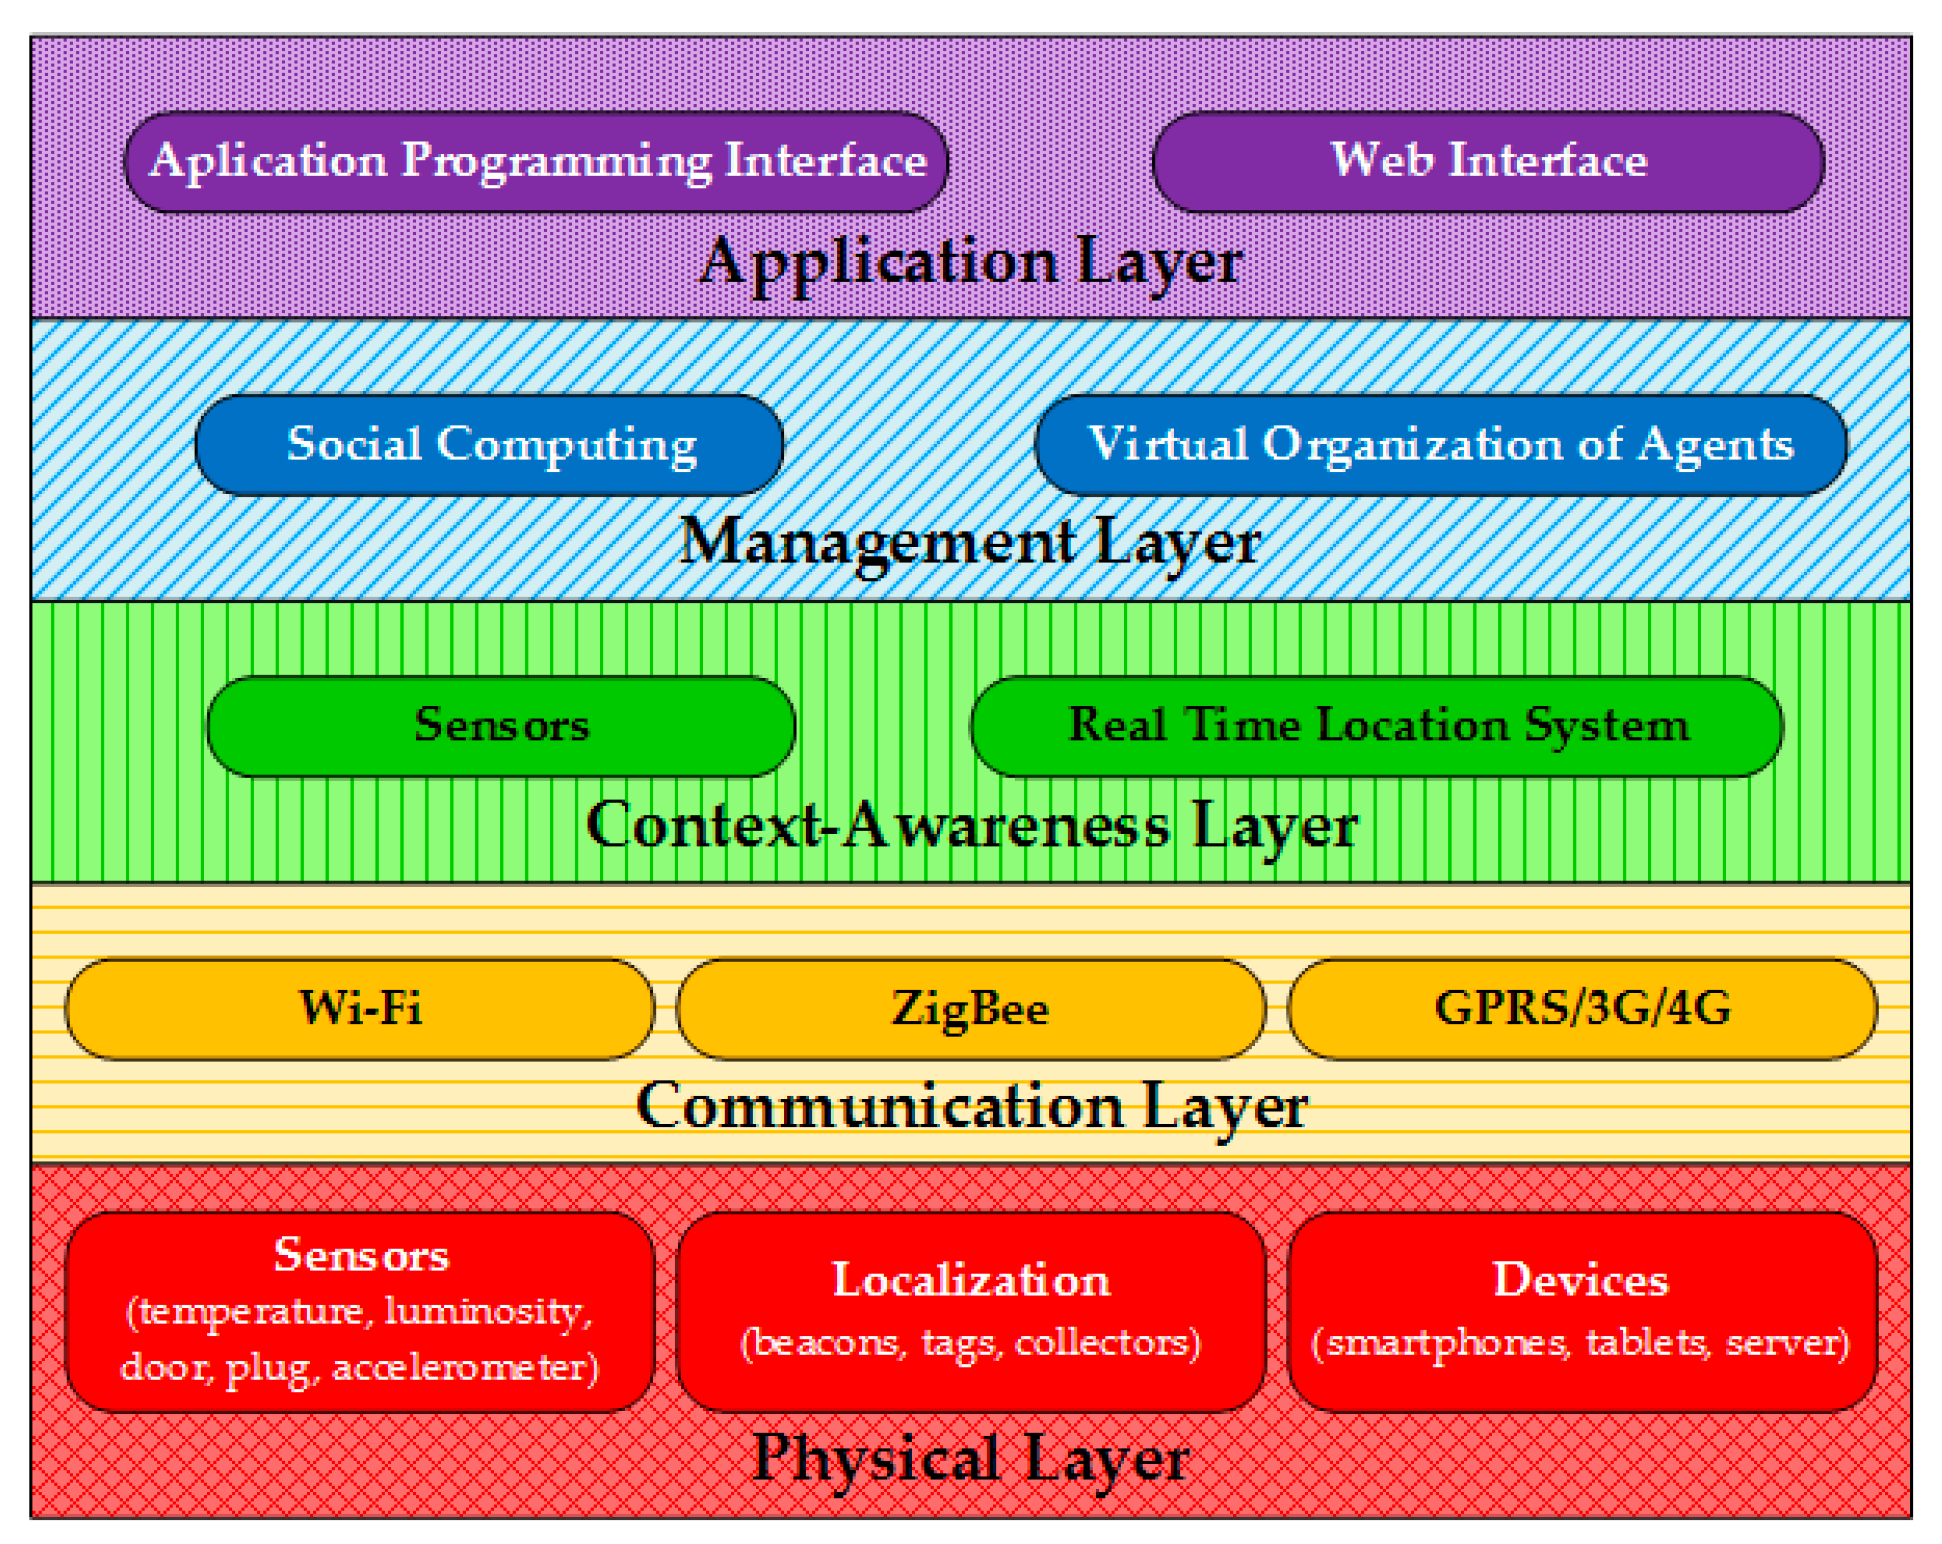
- Physical layer: It is made up of all the devices and infrastructure used by CAFCLA. They can be classified in three different categories:
- ○
- Sensors: The infrastructure that collects all the information needed to characterize the environment, including temperature, lighting, door/window and electricity consumption plug sensors. It also integrates an accelerometer within the localization tag to better identify the level of users’ activity. The wireless sensor network sends all the different physical measures gathered or the consumption of the monitored electrical points through the network.
- ○
- Localization: The process of locating and tracking users requires a set of beacons (anchors) within the house and tags (targets) that identify each user individually. The target sends information with different parameters to the beacons. Similarly, the beacons resend it to the collectors, which, in turn, send it to the server where the parameters are processed and the precise position of users is determined, as well as the level of their activity.
- ○
- Devices: Devices are all the equipment needed by the system that does not produce context-aware or localization data. This includes mobile devices such as smartphones or tablets which serve as an interface and are used to provide users with recommendations. In addition, the server that is deployed to store data and run the management system, including the localization engine and the social machine. Finally, it includes a protocol converter which acts as an intermediary between the sensor and localization infrastructure and the Internet.
- Communication layer: The CAFCLA design allows for the integration of any communication protocol that may be needed. In this case, the framework implements three communication protocols. The converters always implement two communication protocols. At one end, the ZigBee protocol (IEEE 802.15.4) which transmits signals and information to communicate with the localization and sensor infrastructure, and, on the other end, Wi-Fi or GPRS/3G/4G to send and receive data from the server. Finally, mobile devices receive and send information via Wi-Fi or GPRS/3G/4G protocol.
- Context-aware layer: Thanks to the use of CAFCLA and the integrated n-Core platform [33], both the wireless sensor network and the Real-Time Localization System can be deployed using the same physical and logical infrastructure; this simplifies the development of the Context-aware Layer. The n-Core platform consists of a set of hardware devices (RadIOn as beacons (anchors), IOn-E devices as sensors and Quantum v2 as tags (targets), all of them from Nebusens, Salamanca, Spain) and software tools that integrate the ZigBee communication protocol. These devices form a mesh network whose devices collect both contextual information, through sensors, and localization information, through beacons and tags. These data feed the recommendation system presented in Section 4. In addition, one of the major benefits of the platform is the duality of sensor nodes, as they can also act as localization anchors, which reduces the infrastructure of devices for the integration of any use case. Section 3.2 and Section 3.3 provide all the details on the RTLS integrated by CAFCLA.
- Management layer: This layer provides the social, logical and intelligence aspects of the framework. One of its main tasks is to classify the contextual information and correlate this information with the monitored activities. Following the methodology of previous works, such as [42,43,44], eleven recommendations have been predefined to be delivered according to the identification of the users’ activities. The recommendations that have been predefined within this development are as follows:
- Turn off heating if the temperature is over 18 °C.
- Turn off lights if lighting is over 200 lux.
- Turn off heating and lights when the last person leaves the house.
- Turn off lights if there is no movement in certain areas, for example when sitting on the couch watching TV, playing, etc.
- Turn off room lights with no occupancy.
- Turn off heating if no movement is detected at night and the temperature is above 18 °C.
- Optimize the use of the heating schedule by identifying the times in which there are people at home.
- Reduce the use of the washing machine by recommending an appropriate load and a low energy schedule.
- Let us cook together: suggest cooking schedules or joint meals to users.
- Organization of the bathroom: suggest a planned and serialized use of the bathroom to take advantage of the heat and the production of hot water.
- Warn about stand-by consumptions in devices (televisions, consoles, computers, etc.).
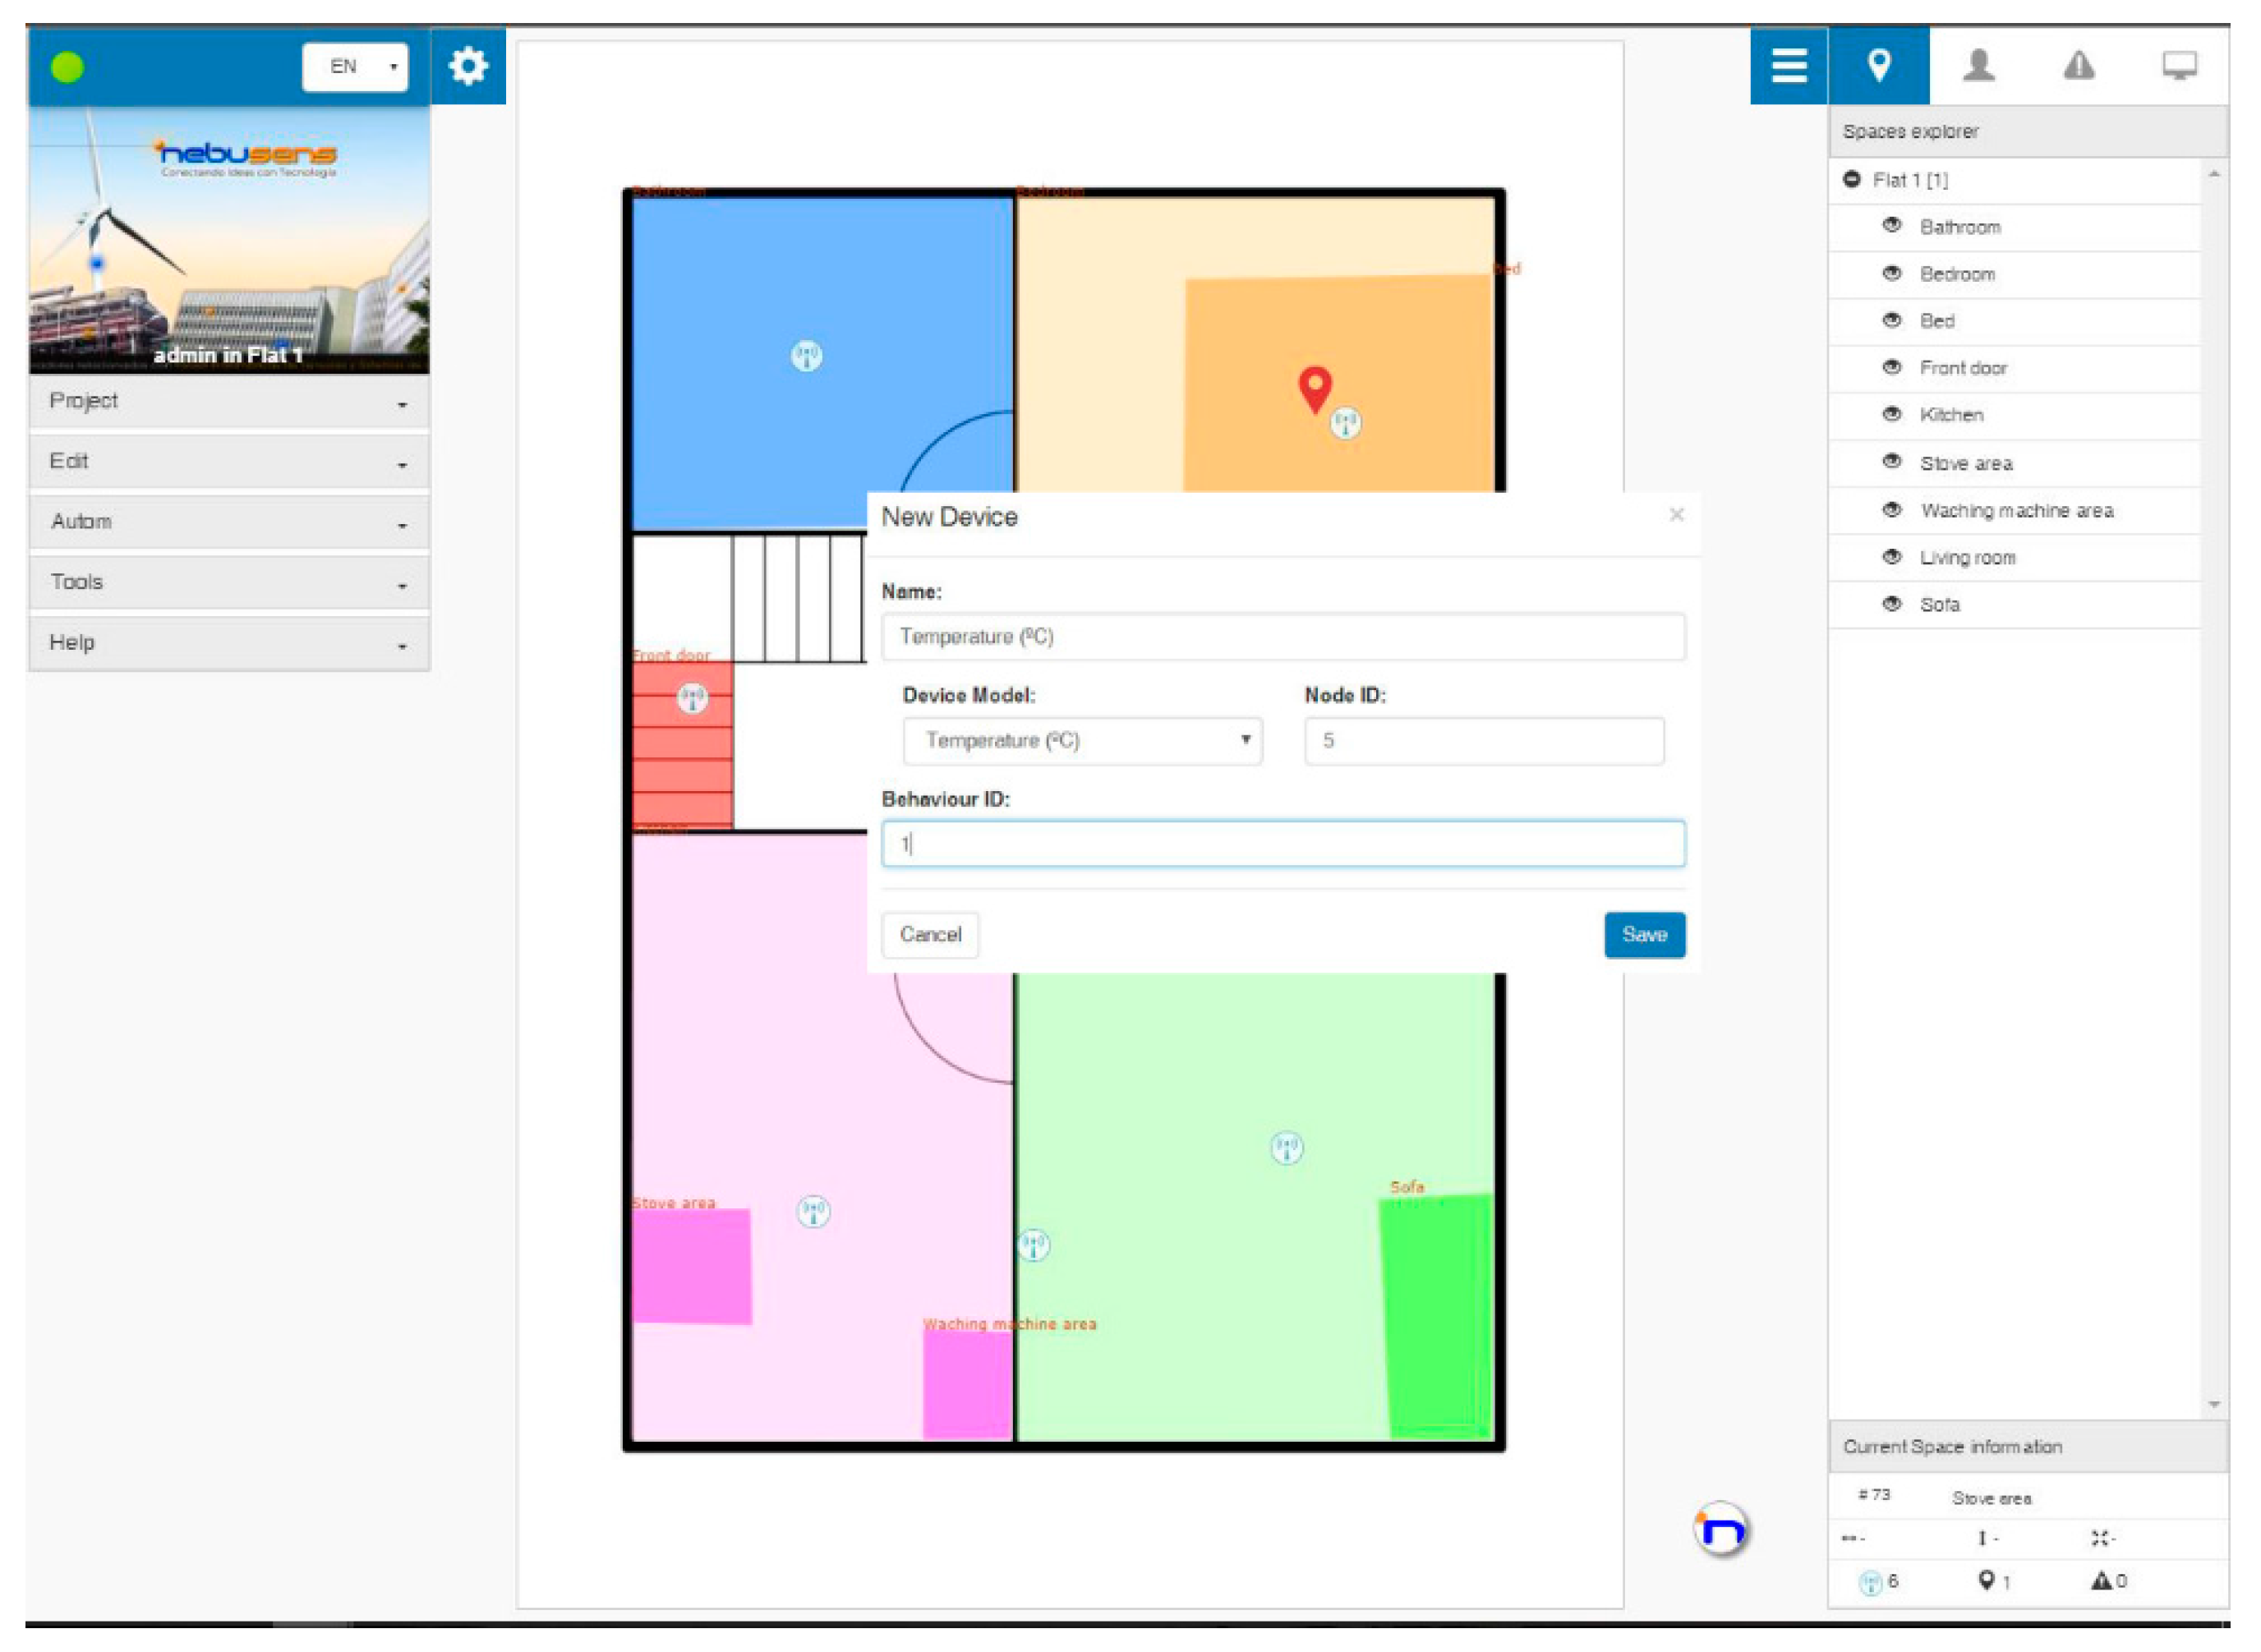
- Application layer: This layer includes tools which configure all the sensors and define the areas of interest, such as beds (to identify when users are sleeping), couch (watching TV, reading, etc.), work areas (washing machine, cooker, etc.), front door, etc. Further, these tools also include mechanisms that define the activities to be identified or the conditions in which a recommendation should be triggered. Figure 3 shows the interface of the context-aware and localization systems, including the menu where new sensors in the system are registered.
3.2. Real-Time Localization via Multilayer Perceptron
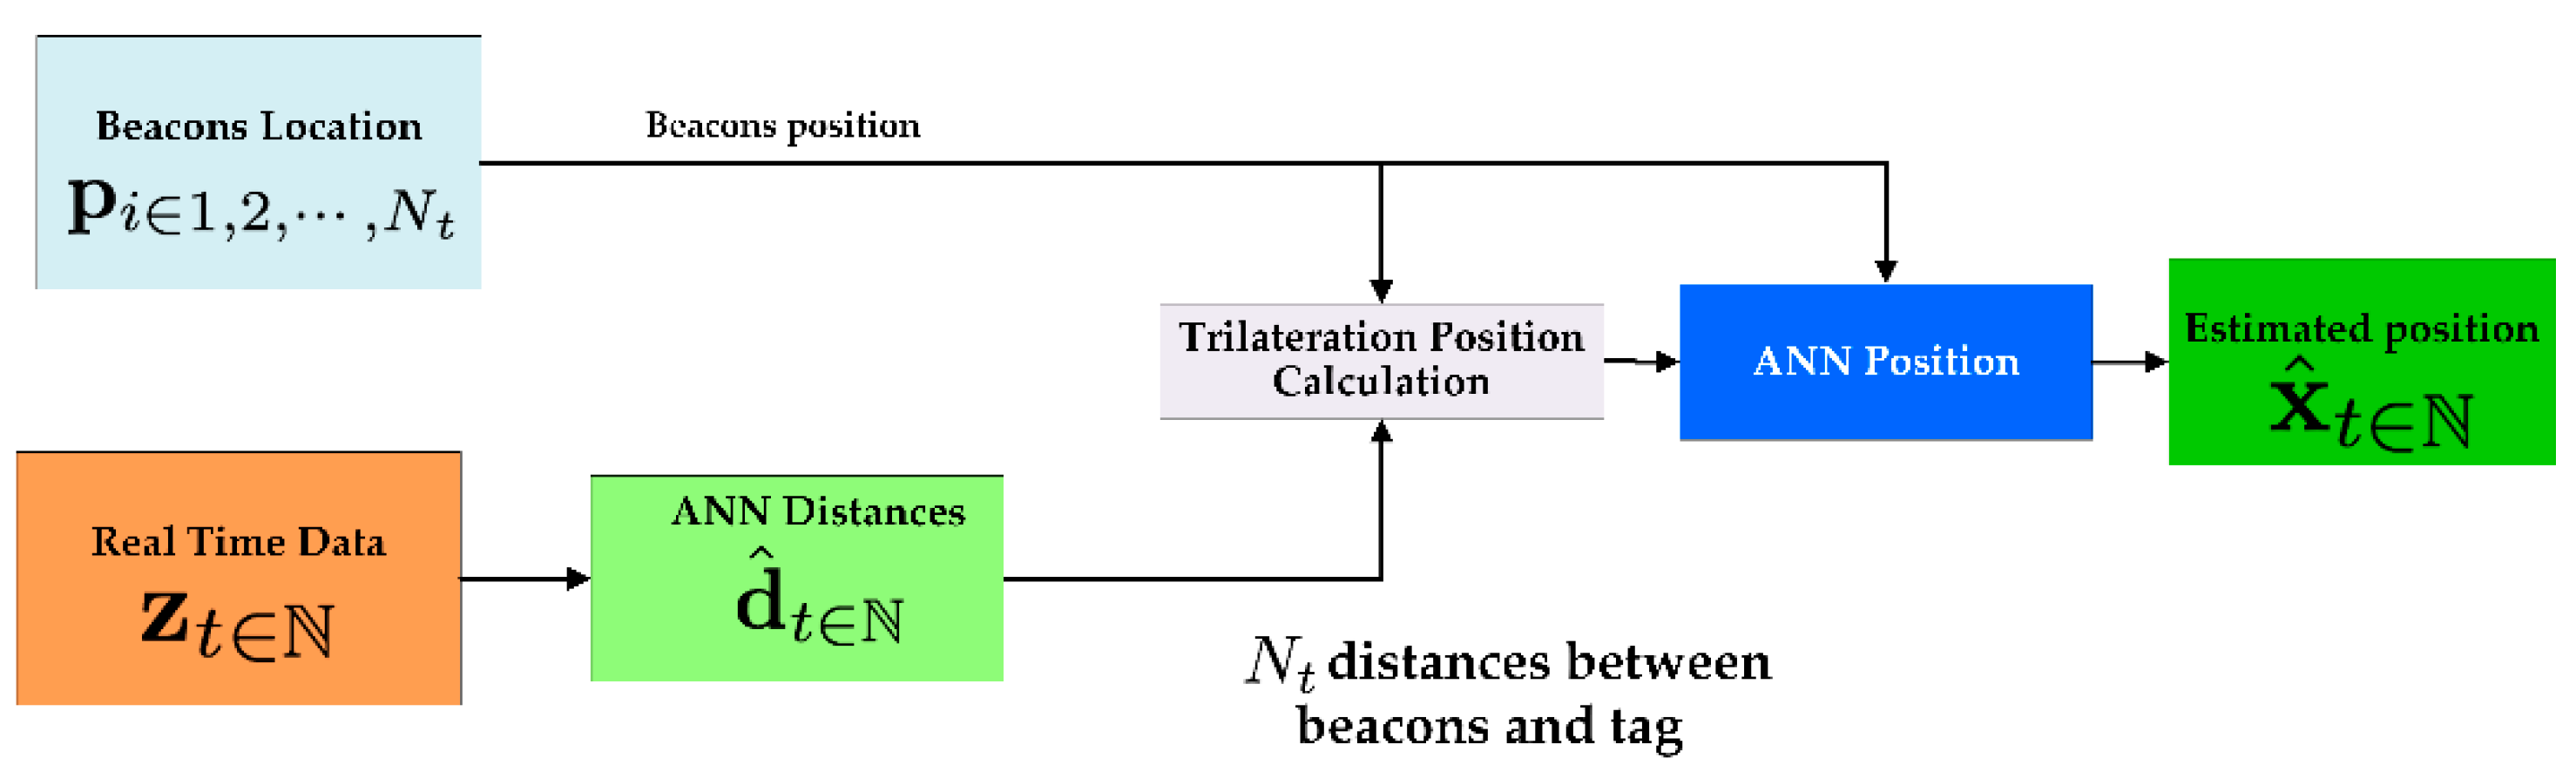
- Distance estimation: During the first phase, the distance between the target and each anchor, , is obtained by using real-time RSSI values, .
- Position estimation: During second phase, the position of the target, , is obtained by using the distance estimates, , makes use of and the position of each beacon within the environment .
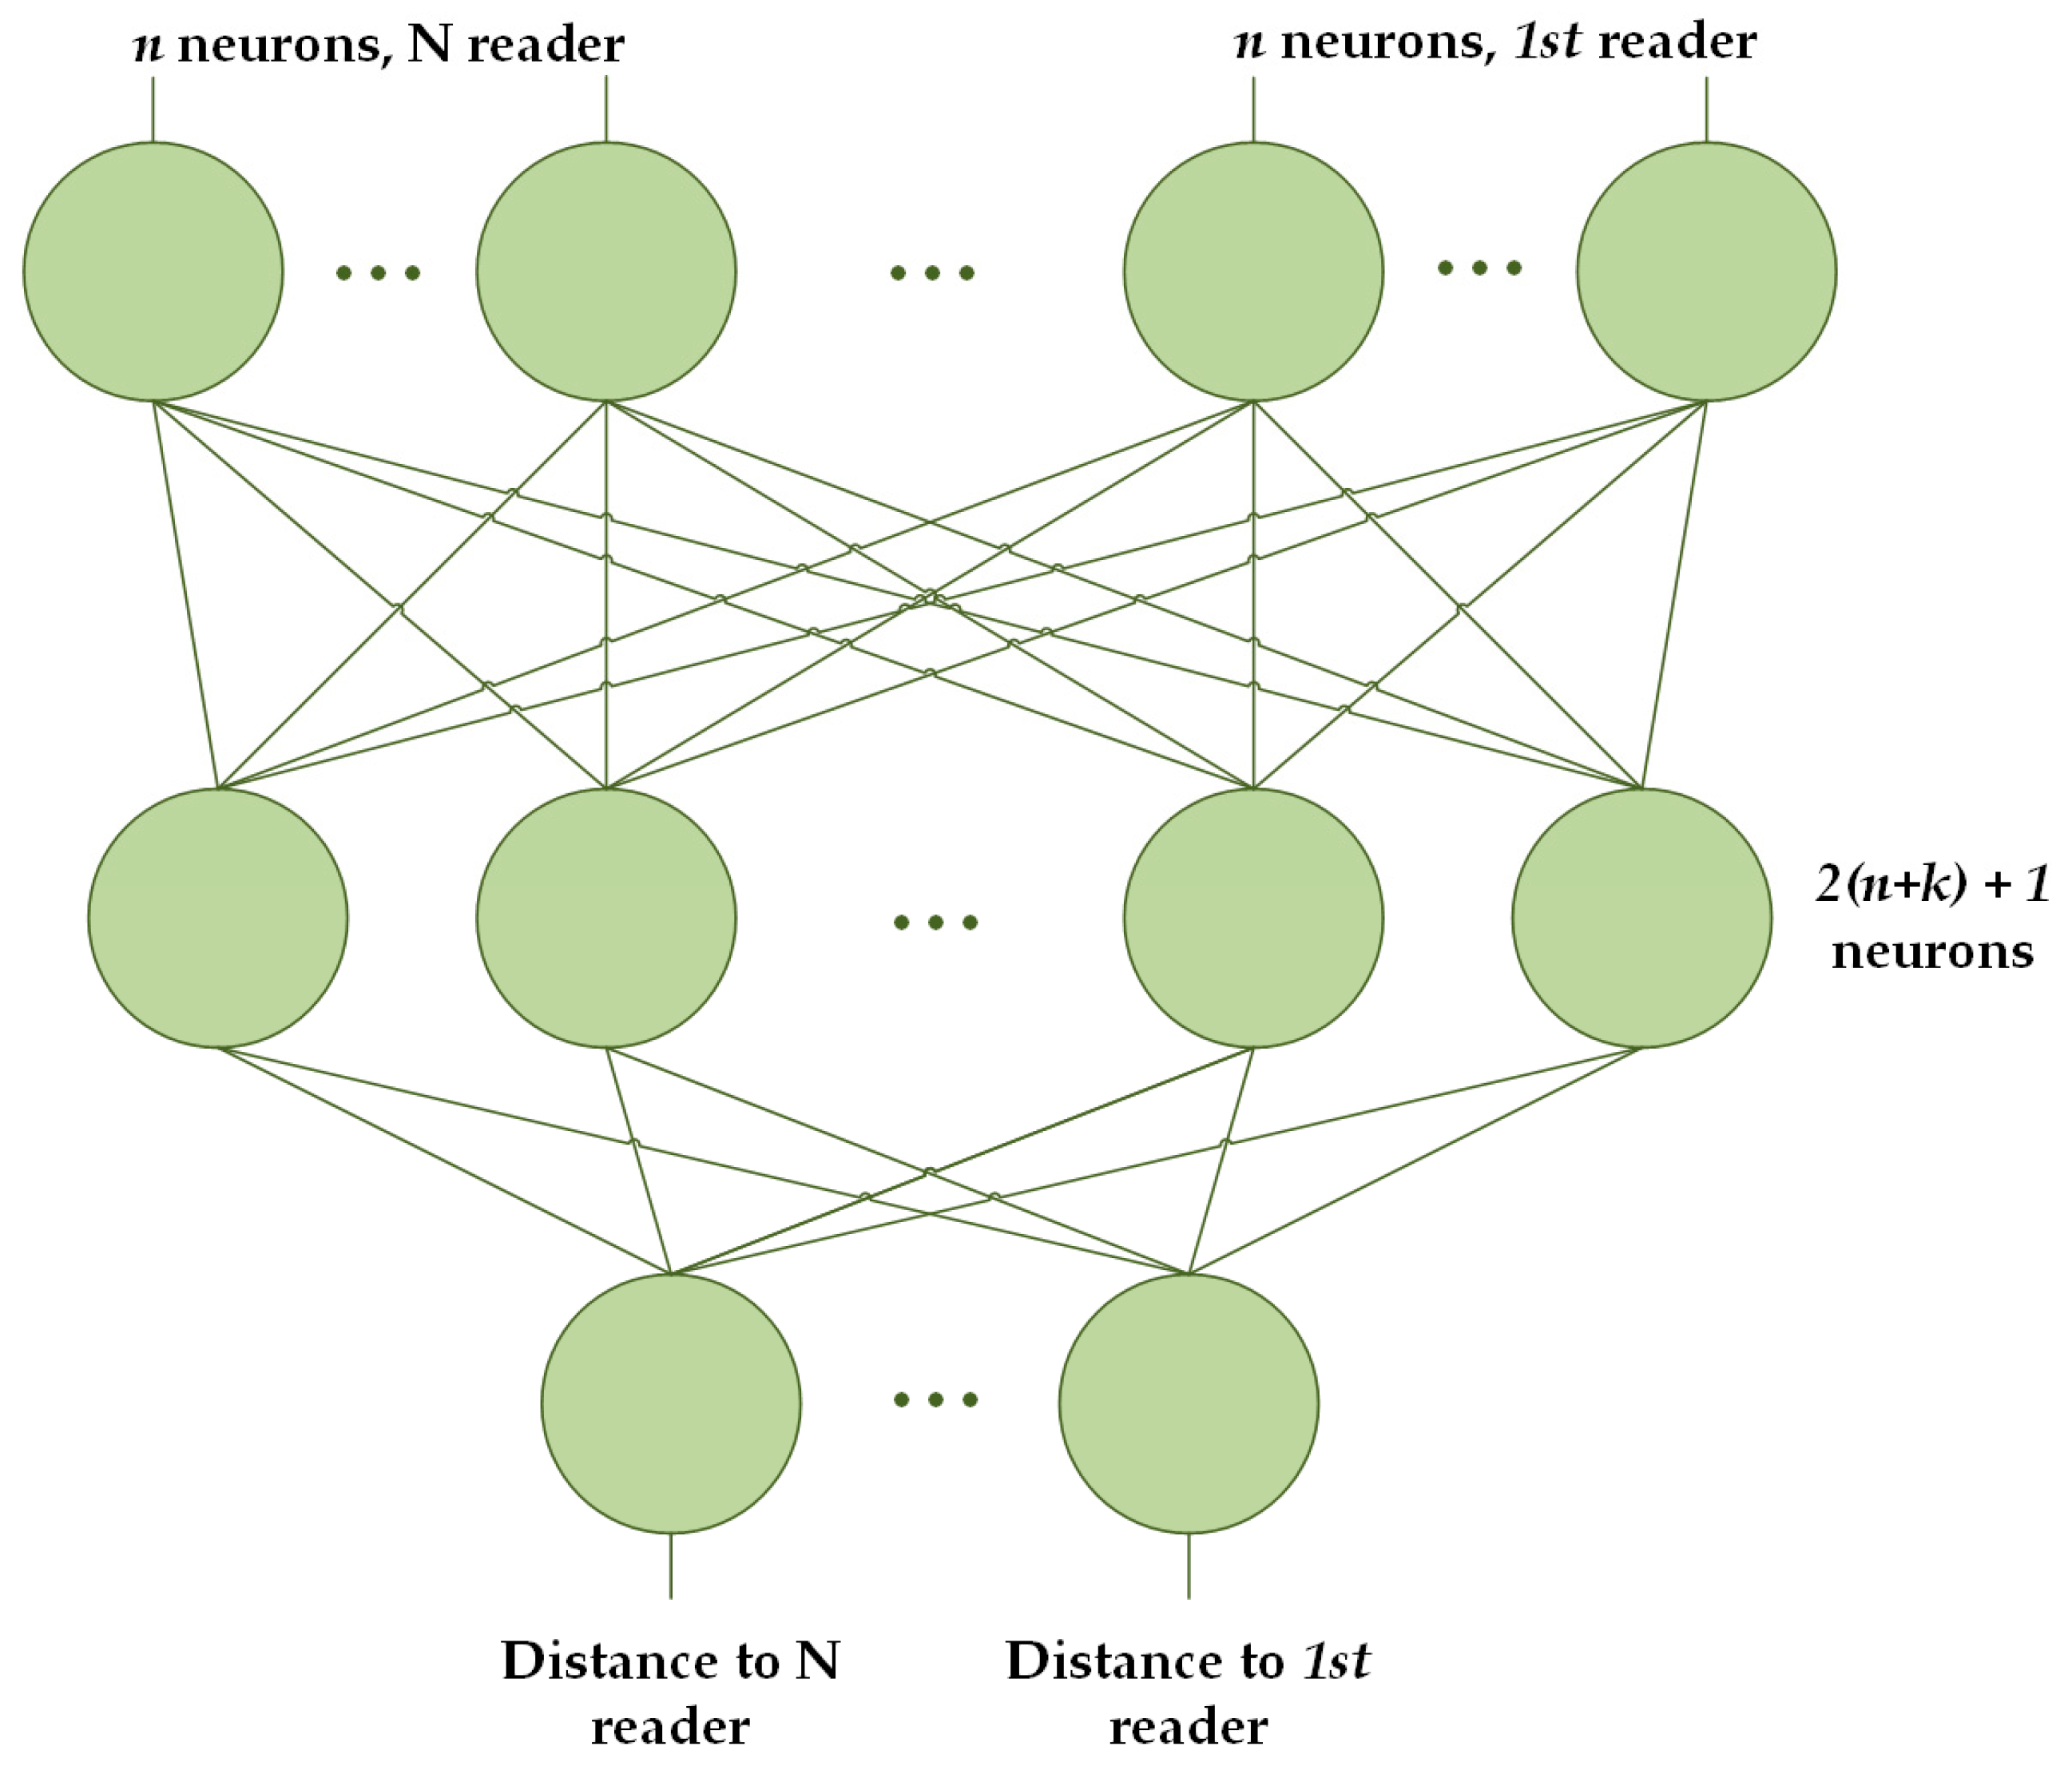
- Distance estimation: During the first phase, the engine calculates the most probable distance between the target and the anchors, , based on the RSSI level, . These values are calculated by using time series applied to ANN (Artificial Neural Network). ANNs permit for the use of time series, making it easier to forecast in situations where the estimation of the position from non-independent values with consecutive samples is not possible. Thus, the ANN is able to forecast a value according to the historical records. More concretely, an MLP (MultiLayer Perceptron) is used to provide a value according to the historical values [62]. Therefore, the neural network in this study is fed with both the current detected RSSI value and the RSSI values detected in previous time instants, . The ANN has been trained considering several anchors at the same time to avoid the multipath effect. It is formed by input neurons, with the lag or number of previous times recorded. The intermediate layer of the Neural Network uses 2 neurons and is configured following the Kolmogorov Theorem [63].Figure 4 shows that the ANN includes a number of input groups equal to the number of anchors considered in the estimation. Finally, the classification of the groups of input neurons is made attending to the current RSSI signal, with the first neuron corresponding to the reader that receives a higher RSSI and the last, the one that receives the lowest.
- Position estimation: The second phase calculates the position of the target, , by using the distances calculated in the first phase, , and the beacons’ fixed location within the environment, . The distance estimates and anchors’ positions are introduced in the second ANN (MLP) that estimates the target’s position from the input data [62,64]. This ANN has been trained by an error back propagation algorithm with positions obtained by the application of a trilateration algorithm to the distance estimates. This algorithm calculates the maximum likelihood (ML) of adaptive distributions based on kernel mixtures [53]:where is the likelihood function of the target’s position for the distance estimate with respect to the th anchor where, for one kernel:where is a kernel function with bandwidth [65].For the trilateration algorithm, we use a Gaussian kernel due to the tractability constraints of the ML. However, by using the ANN, we avoid the high processing times required by other kernels, by dealing with the complexity vs. accuracy trade-off. The number of neurons of the ANN is in the input layer, in the hidden layer, and 1 in the output layer.Figure 5 shows how the problem is resolved in a schematic way. This model will provide the position of the tags within the localization environment, at every second.
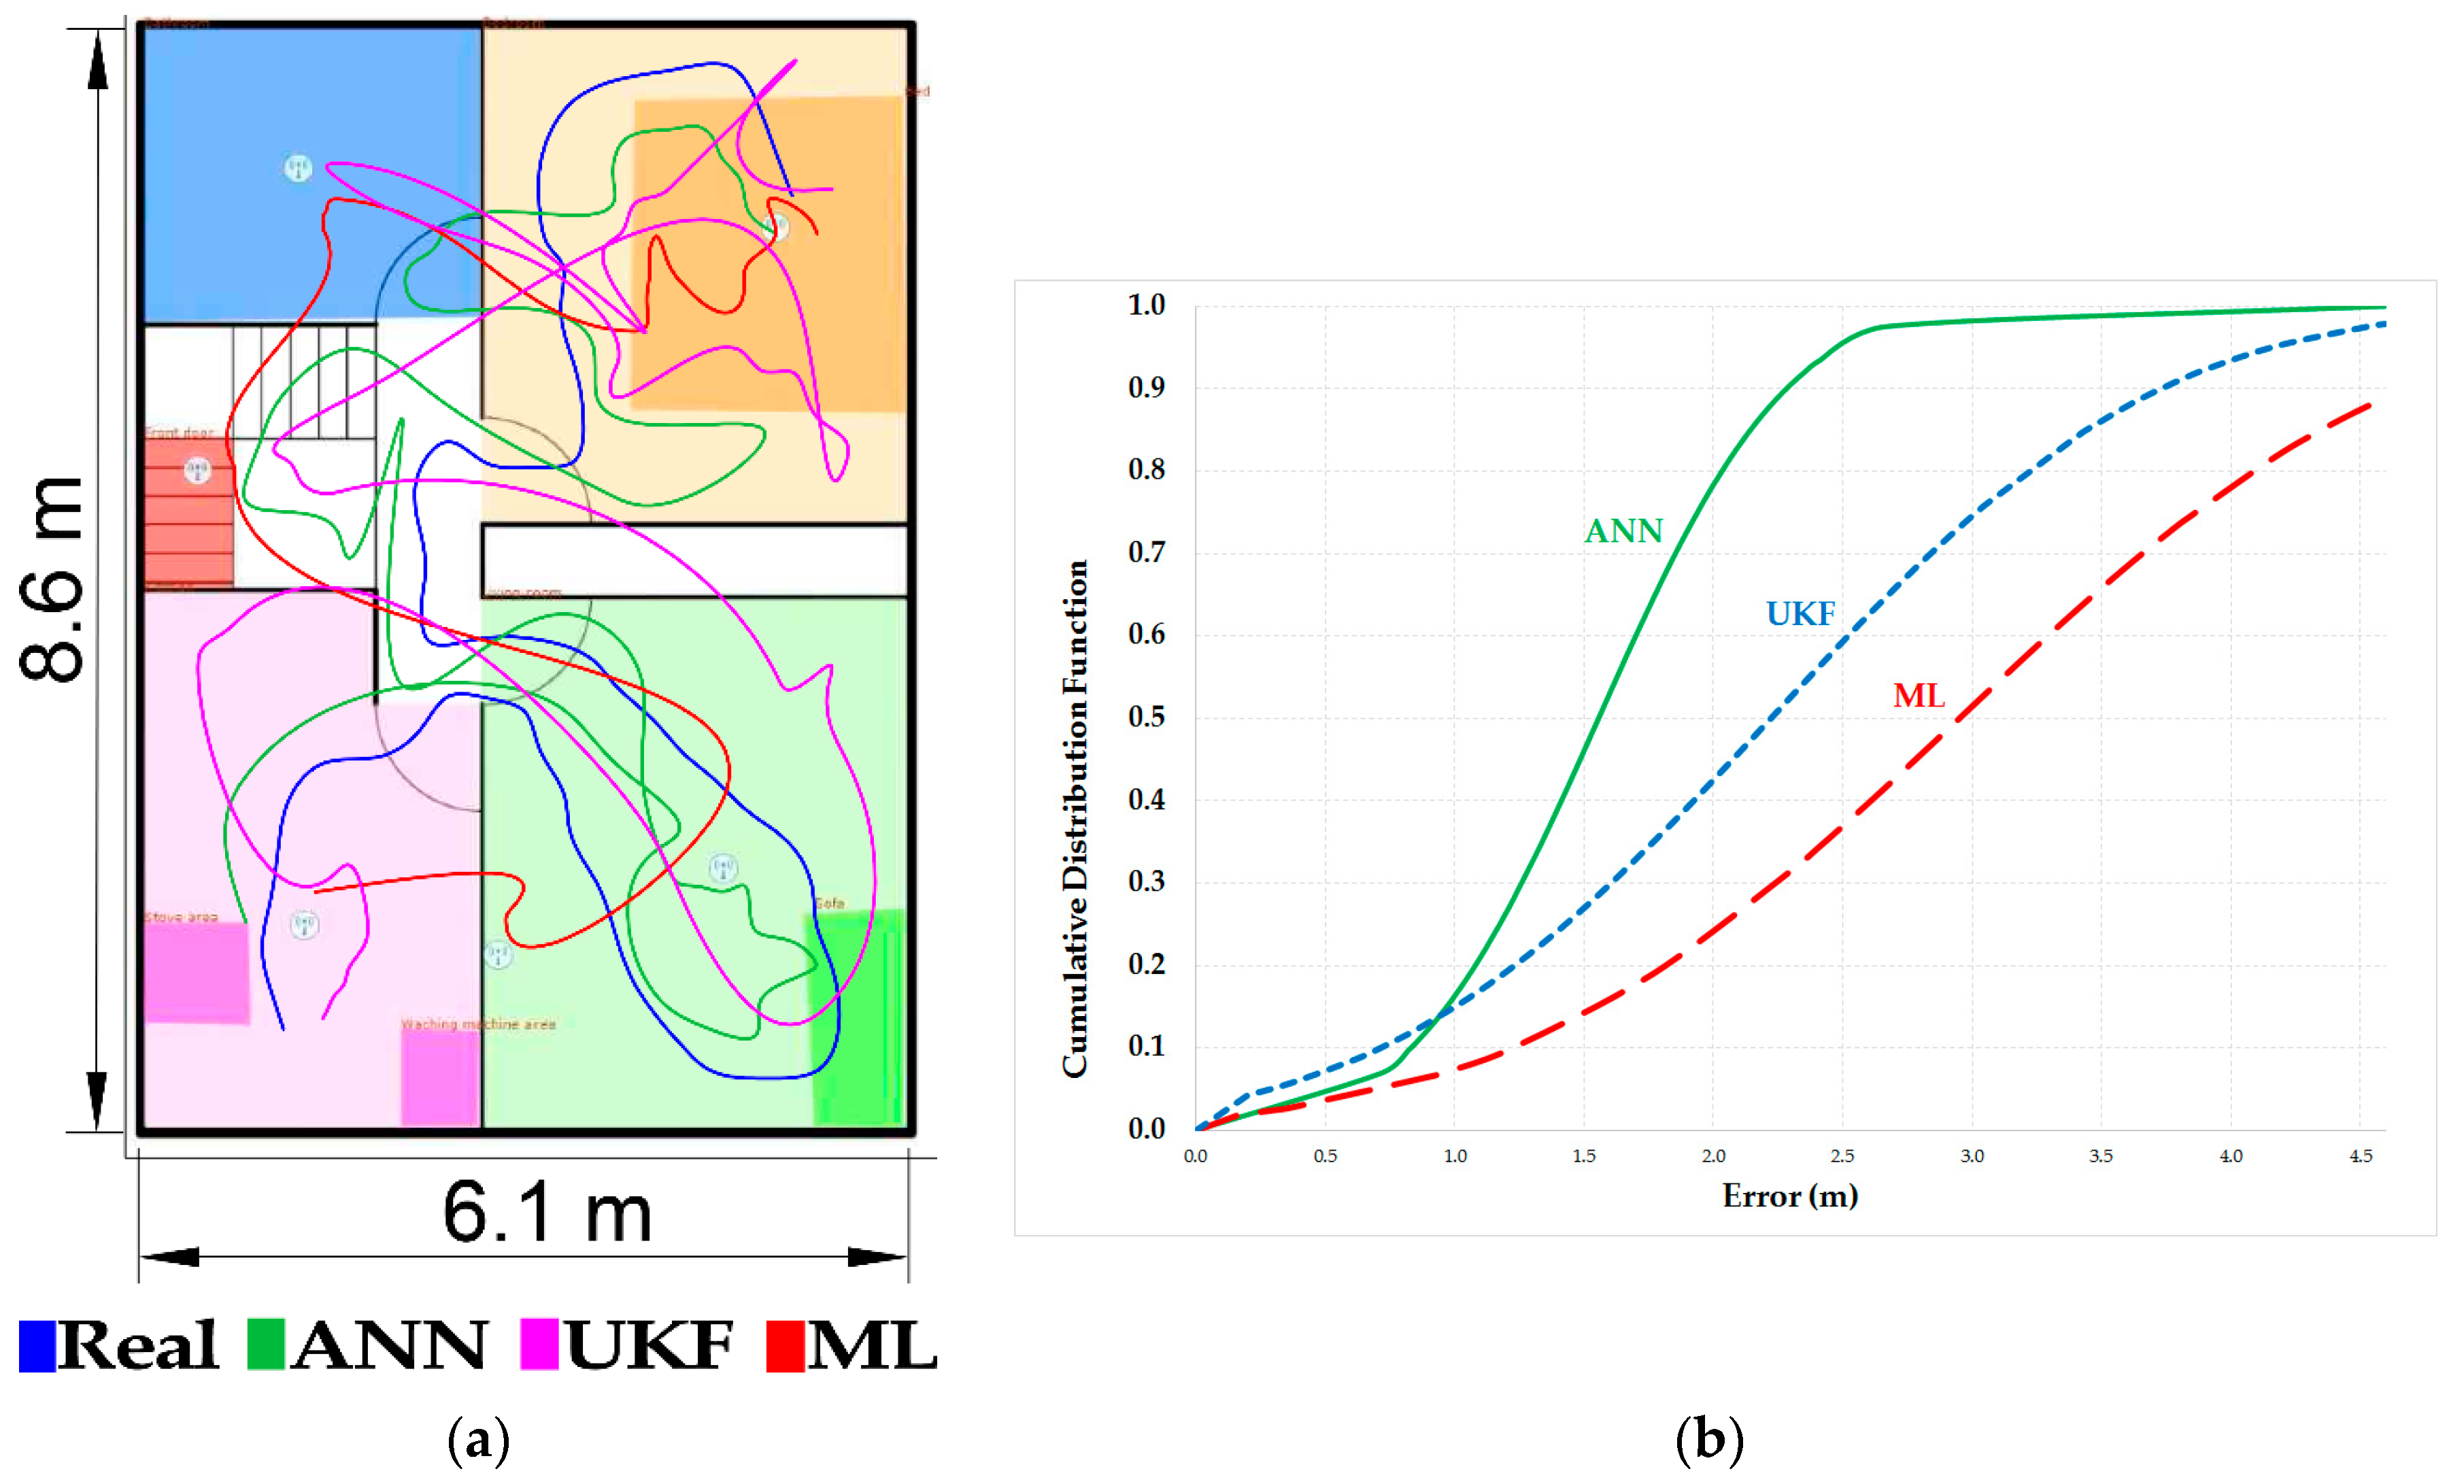
3.3. Integration within CAFCLA and Performance of the RTLS
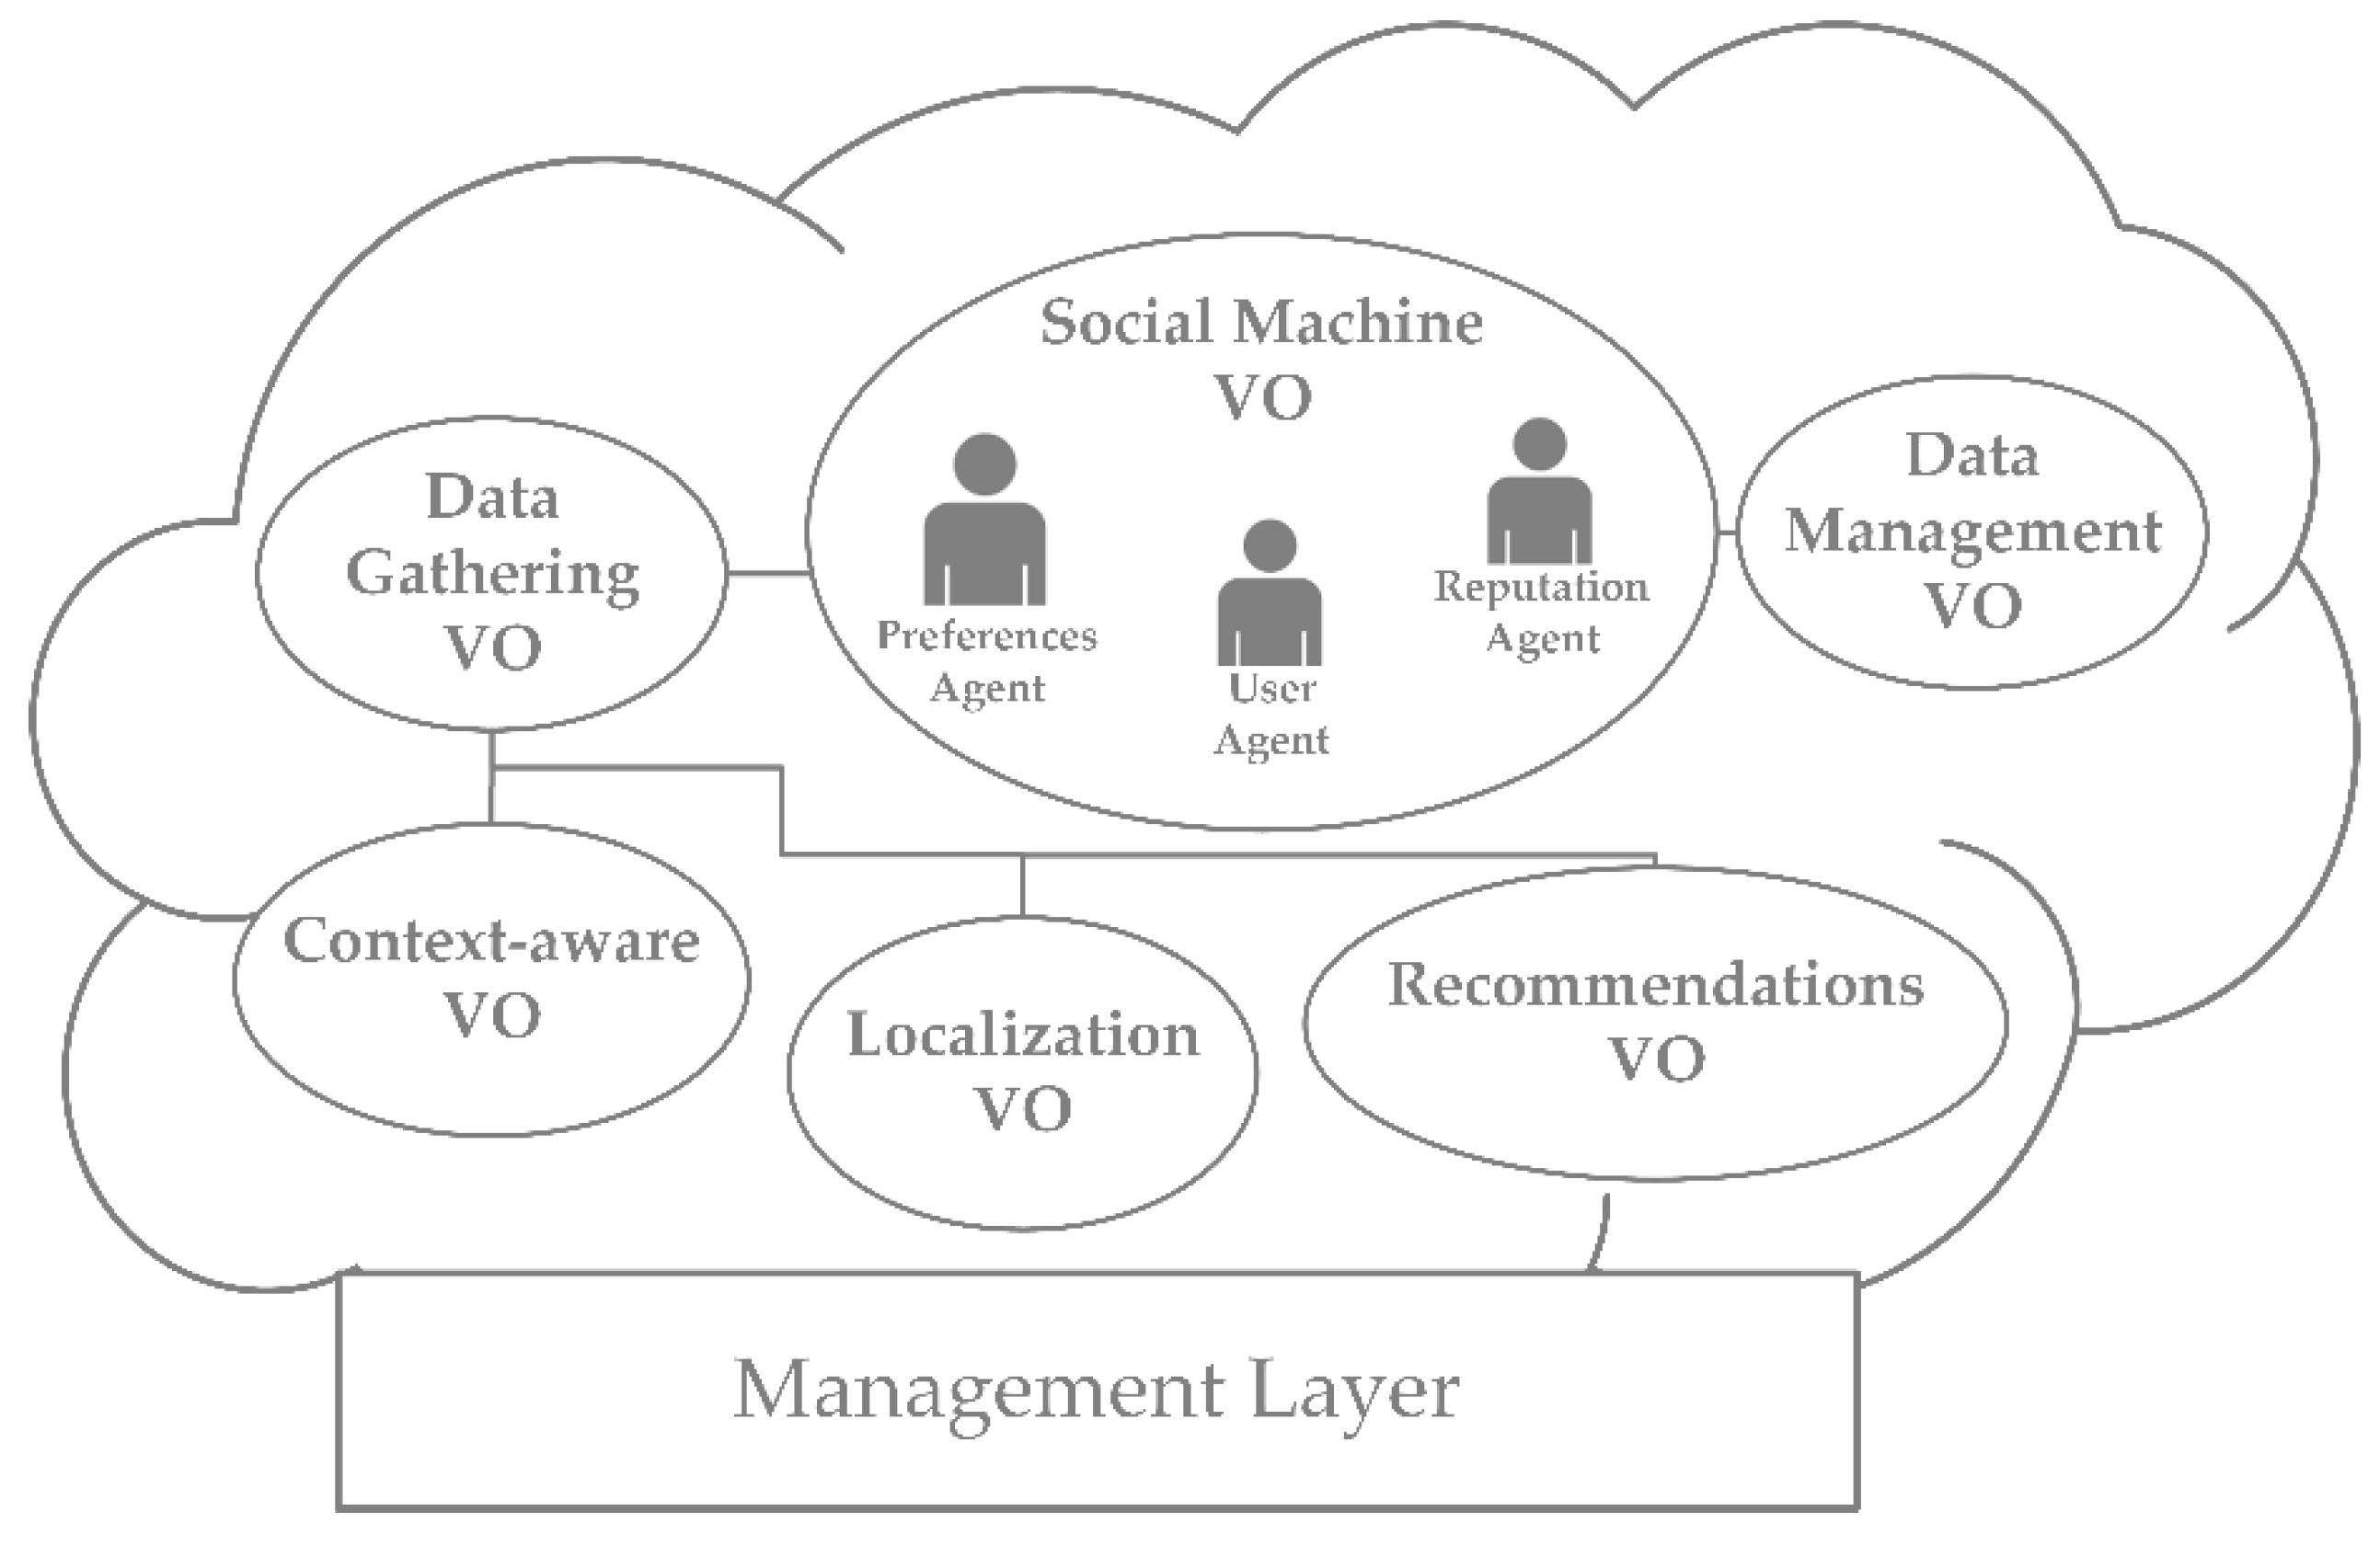
3.4. Energy Efficiency Based on Social Computing
- Localization VO: It collects the RSSI information and implements the localization algorithm. It is coordinated with de Data management VO to update the position of each user in real-time.
- Context-aware VO: It manages all the information gathered by the sensors. It is coordinated with the Data management VO to update the information collected by the sensors.
- Data gathering VO: It is in charge of the management of the data sources and the control of heterogeneous systems such as the localization system, the WSN and other data sources.
- Data management VO: It includes data reception, classification, storage and delivery. It classifies users’ preferences, identifies habits and patterns or the correlation among context-awareness and predefined activities, among others.
- Social machine VO: It manages the interaction among all the agents of the system and the social information extracted from them. The agents implemented in this VO are as follows:
- ○
- User agent: It is responsible for user-user and user-machine interactions. They register all the information that is relevant to the recommendation system.
- ○
- Preferences agent: It analyses the information stored by the data management layer and identifies and classifies energy preferences for each user and their energy saving habits.
- ○
- Reputation agent: It manages the reputation of energy-efficient actions. This reputation is calculated using a Bayesian system that takes binary ratings as inputs [68]: when a recommendation is sent and accepted by the user, if it implies energy savings, then positive rating increases by 1 unit and, if it does not imply energy savings, negative rating increases by 1 unit . The reputation of the th recommendation is calculated using beta probability density function (pdf) and its score is represented by the expected value of the beta pdf. Thus, the beta pdf is expressed using the gamma function, , as:Then, the expected value of the beta distribution is calculated as follows:
- Recommendation VO: It generates personalized recommendations which are sent to users to engage them in using energy more responsibly. It receives information from the reputation agent.
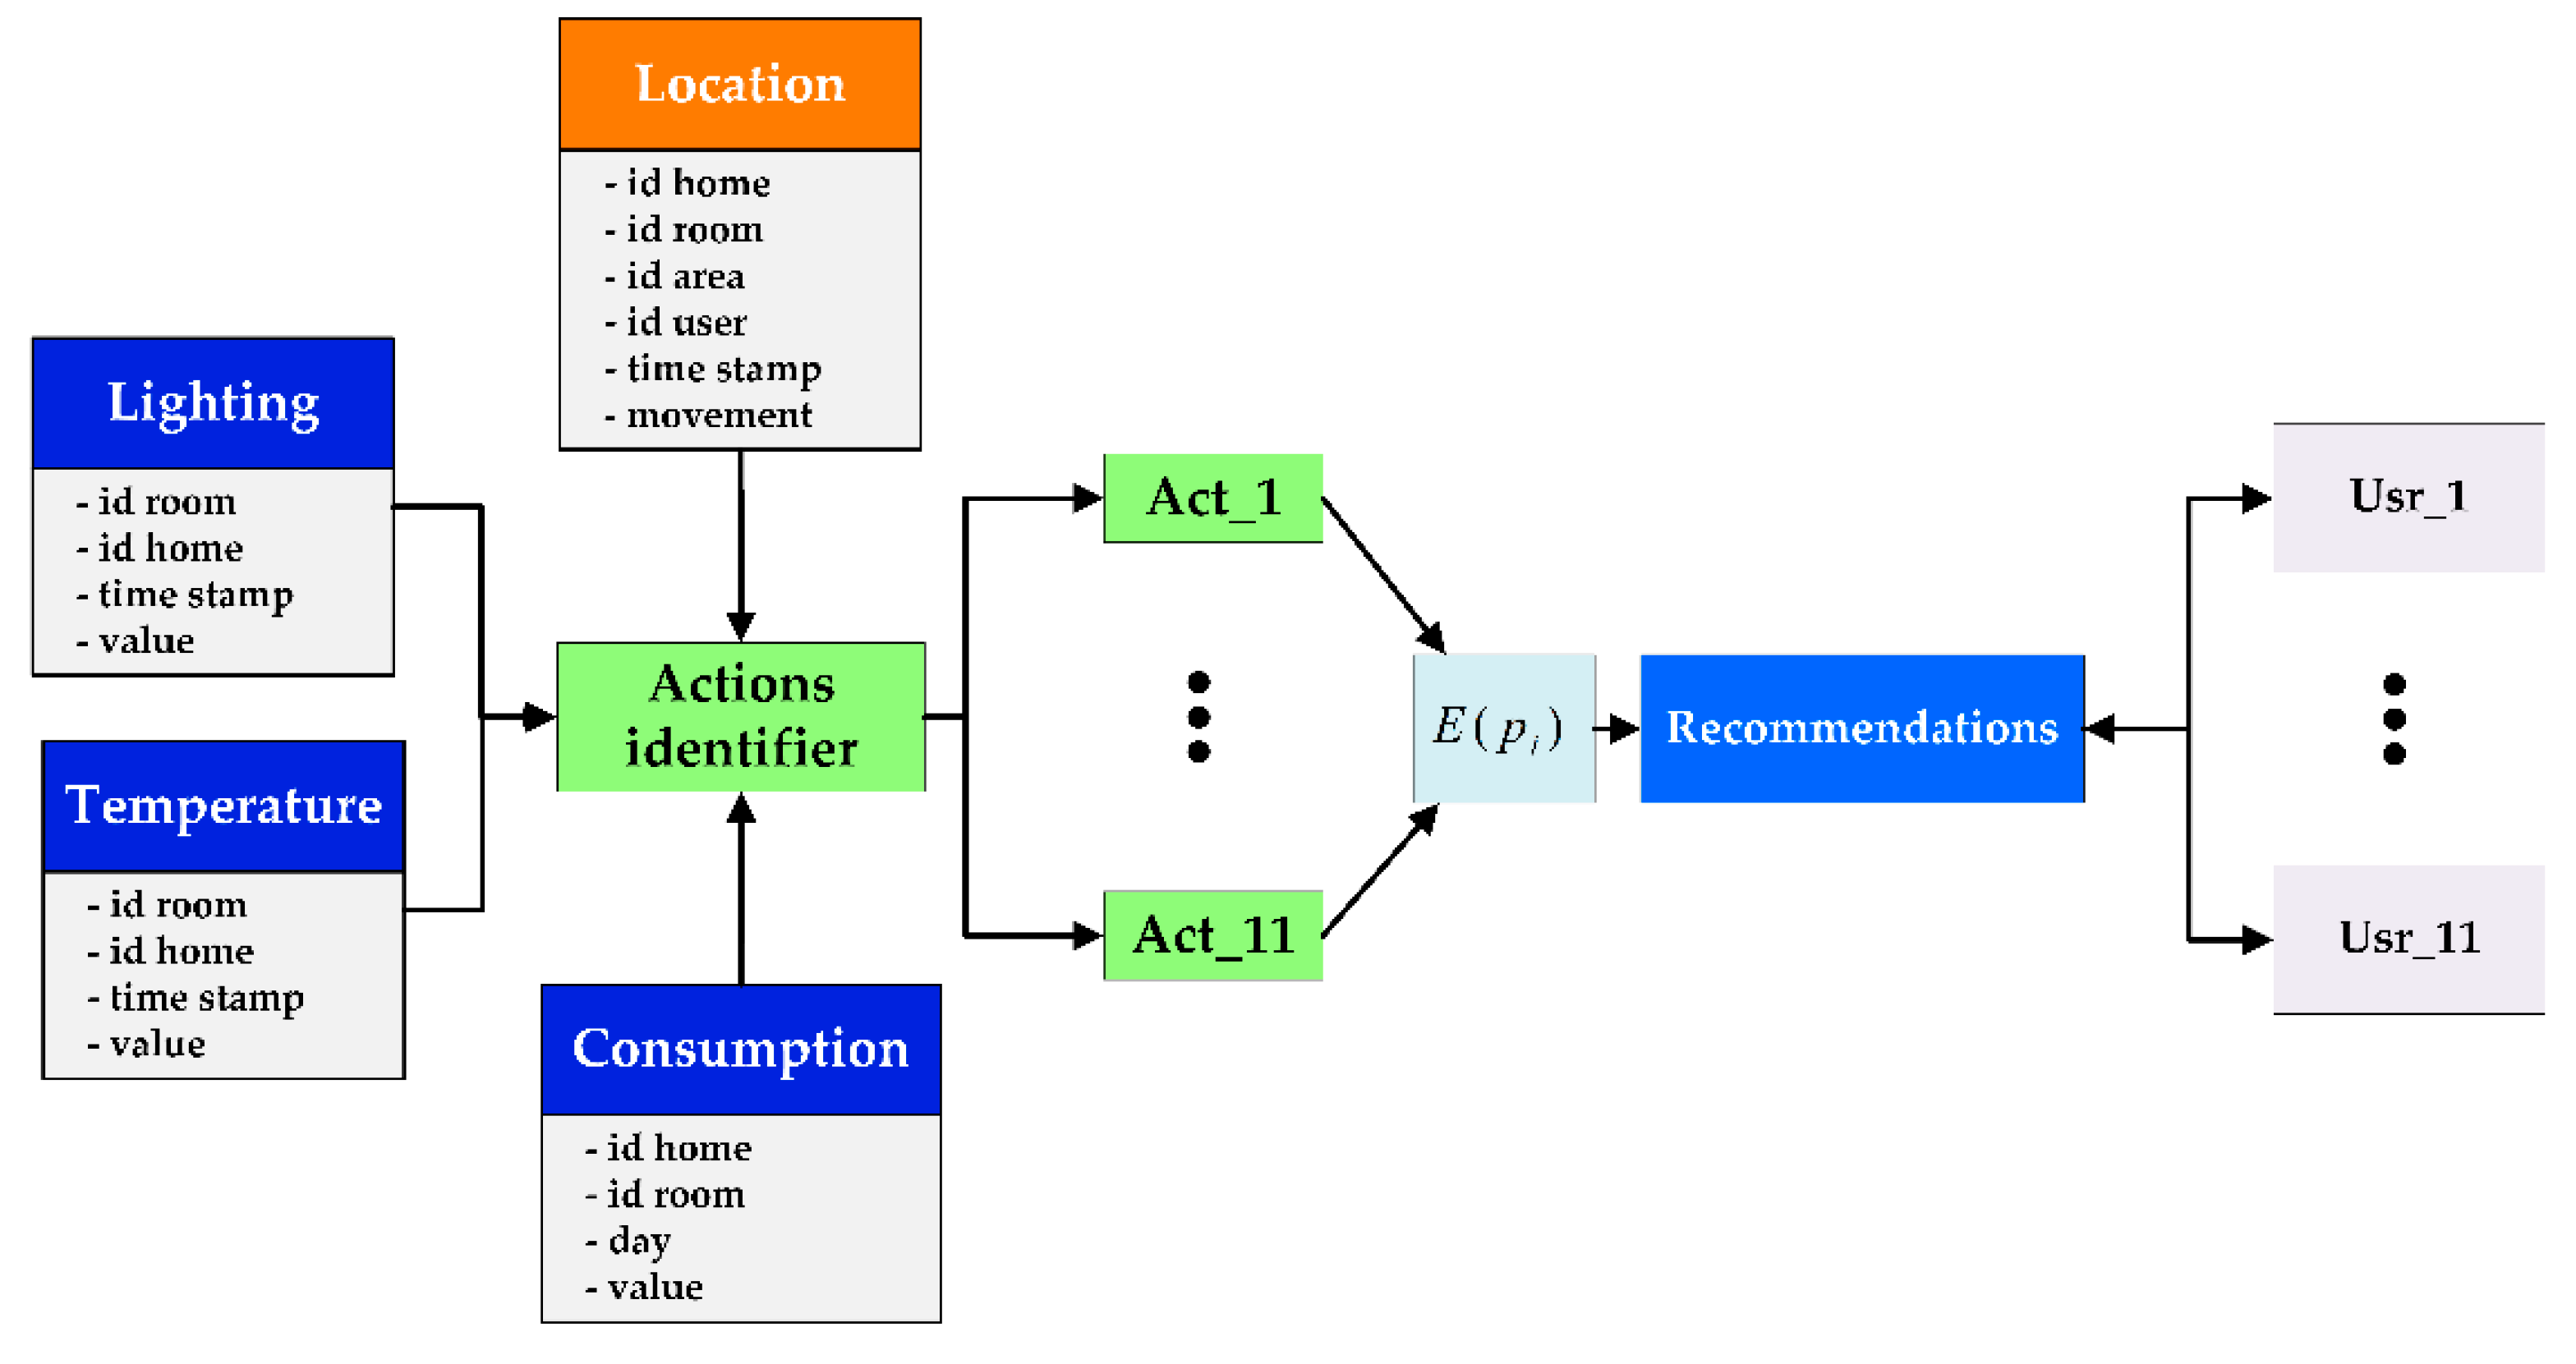
4. Case-Study: Recommendation System for the Enhancement of Energy Saving in Homes
4.1. Description of the Case-Study
4.2. Experimental Results
5. Conclusions
Acknowledgments
Author Contributions
Conflicts of Interest
References
- Barbu, A.D.; Griffiths, N.; Morton, G. Achieving Energy Efficiency through Behaviour Change: What Does It Take? In EEA Technical Report, No 5/2013; European Environment Agency: Copenhagen, Denmark, 2013; ISSN 1725-2237. [Google Scholar]
- Gynther, L.; Lapillone, B; Pollier, K. Monitoring of energy efficiency trends and policies in the EU. An Analysis Based on the ODYSSEE and MURE Databases; E.U. ODYSSEE-MURE Project; Followme Communication: Aigues Vives, France, September 2015. [Google Scholar]
- Hong, T.; Taylor-Lange, S.C.; D’Oca, S.; Yan, D.; Corgnati, S.P. Advances in research and applications of energy-related occupant behavior in buildings. Energy Build. 2016, 116, 694–702. [Google Scholar] [CrossRef]
- Nguyen, T.A.; Aiello, M. Energy intelligent buildings based on user activity: A survey. Energy Build. 2013, 56, 244–257. [Google Scholar] [CrossRef]
- De Meester, T.; Marique, A.-F.; De Herde, A.; Reiter, S. Impacts of occupant behaviours on residential heating consumption for detached houses in a temperate climate in the northern part of Europe. Energy Build. 2013, 57, 313–323. [Google Scholar] [CrossRef]
- Lee, Y.S.; Malkawi, A.M. Simulating multiple occupant behaviors in buildings: An agent-based modeling approach. Energy Build. 2014, 69, 407–416. [Google Scholar] [CrossRef]
- Pothitou, M.; Kolios, A.J.; Varga, L.; Gu, S. A framework for targeting household energy savings through habitual behavioural change. Int. J. Sustain. Energy 2016, 35, 686–700. [Google Scholar] [CrossRef]
- García, Ó.; Alonso, R.S.; Prieto, J.; Corchado, J.M. Energy Efficiency in Public Buildings through Context-Aware Social Computing. Sensors 2017, 17, 823. [Google Scholar] [CrossRef] [PubMed]
- Feng, X.; Yan, D.; Hong, T. Simulation of occupancy in buildings. Energy Build. 2015, 87, 348–359. [Google Scholar] [CrossRef]
- O’Brien, W.; Gunay, H.B. The contextual factors contributing to occupants’ adaptive comfort behaviors in offices—A review and proposed modeling framework. Energy Build. 2014, 77, 77–87. [Google Scholar] [CrossRef]
- Haldi, F.; Robinson, D. The impact of occupants’ behaviour on building energy demand. J. Build. Perform. Simul. 2011, 4, 323–338. [Google Scholar] [CrossRef]
- Aerts, D.; Minnen, J.; Glorieux, I.; Wouters, I.; Descamps, F. A method for the identification and modelling of realistic domestic occupancy sequences for building energy demand simulations and peer comparison. Build. Environ. 2014, 75, 67–78. [Google Scholar] [CrossRef]
- Lynggaard, P.; Skouby, K. Complex IoT Systems as Enablers for Smart Homes in a Smart City Vision. Sensors 2016, 16, 1840. [Google Scholar] [CrossRef] [PubMed]
- Morales, R.; Badesa, F.J.; García-Aracil, N.; Perez-Vidal, C.; Sabater, J.M. Distributed Smart Device for Monitoring, Control and Management of Electric Loads in Domotic Environments. Sensors 2012, 12, 5212–5224. [Google Scholar] [CrossRef] [PubMed]
- Thomas, B.; Cook, D. Activity-Aware Energy-Efficient Automation of Smart Buildings. Energies 2016, 9, 624. [Google Scholar] [CrossRef]
- Bhati, A.; Hansen, M.; Chan, C.M. Energy conservation through smart homes in a smart city: A lesson for Singapore households. Energy Policy 2017, 104, 230–239. [Google Scholar] [CrossRef]
- Moreno, V.; Zamora, M.A.; Skarmeta, A.F. A Low-Cost Indoor Localization System for Energy Sustainability in Smart Buildings. IEEE Sens. J. 2016, 16, 3246–3262. [Google Scholar] [CrossRef]
- D’Aloia, M.; Cortone, F.; Cice, G.; Russo, R.; Rizzi, M.; Longo, A. Improving energy efficiency in building system using a novel people localization system. In Proceedings of the 2016 IEEE Workshop on Environmental, Energy, and Structural Monitoring Systems (EESMS), Bari, Italy, 13–14 June 2016; IEEE: New York, NY, USA, 2016; pp. 1–6. [Google Scholar] [CrossRef]
- Blanco-Novoa, Ó.; Fernández-Caramés, T.M.; Fraga-Lamas, P.; Castedo, L. An Electricity Price-Aware Open-Source Smart Socket for the Internet of Energy. Sensors 2017, 17, 643. [Google Scholar] [CrossRef] [PubMed]
- Macias, E.; Suarez, A.; Lloret, J. Mobile Sensing Systems. Sensors 2013, 13, 17292–17321. [Google Scholar] [CrossRef] [PubMed]
- Klein, L.; Kwak, J.; Kavulya, G.; Jazizadeh, F.; Becerik-Gerber, B.; Varakantham, P.; Tambe, M. Coordinating occupant behavior for building energy and comfort management using multi-agent systems. Autom. Constr. 2012, 22, 525–536. [Google Scholar] [CrossRef]
- Collotta, M.; Pau, G. A solution based on bluetooth low energy for smart home energy management. Energies 2015, 8, 11916–11938. [Google Scholar] [CrossRef]
- Collotta, M.; Pau, G. An innovative approach for forecasting of energy requirements to improve a smart home management system based on BLE. IEEE Trans. Green Commun. Netw. 2017, 1, 112–120. [Google Scholar] [CrossRef]
- D’Oca, S.; Corgnati, S.P.; Buso, T. Smart meters and energy savings in Italy: Determining the effectiveness of persuasive communication in dwellings. Energy Res. Soc. Sci. 2014, 3, 131–142. [Google Scholar] [CrossRef]
- Zhou, K.; Yang, S. Understanding household energy consumption behavior: The contribution of energy big data analytics. Renew. Sustain. Energy Rev. 2016, 56, 810–819. [Google Scholar] [CrossRef]
- Bajo, J.; Campbell, A.T.; Omatu, S.; Carvalho, A.C.; Corchado, J.M. Mobile sensing and social computing. Int. J. Distrib. Sens. Netw. 2016, 12, 8, 155014771666551. [Google Scholar] [CrossRef]
- Moreno-Munoz, A.; Bellido-Outeirino, F.J.; Siano, P.; Gomez-Nieto, M.A. Mobile social media for smart grids customer engagement: Emerging trends and challenges. Renew. Sustain. Energy Rev. 2016, 53, 1611–1616. [Google Scholar] [CrossRef]
- Temmen, J. Smart metering for residential energy efficiency: The use of community based social marketing for behavioural change and smart grid introduction. Renew. Energy 2014, 67, 119–127. [Google Scholar] [CrossRef]
- Zhou, K.; Fu, C.; Yang, S. Big data driven smart energy management: From big data to big insights. Renew. Sustain. Energy Rev. 2016, 56, 215–225. [Google Scholar] [CrossRef]
- Wang, Q.; Taylor, J.E. Energy saving practice diffusion in online networks. Energy Build. 2014, 76, 622–630. [Google Scholar] [CrossRef]
- Vega, A.M.; Santamaria, F.; Rivas, E. Modeling for home electric energy management: A review. Renew. Sustain. Energy Rev. 2015, 52, 948–959. [Google Scholar] [CrossRef]
- Ul Haq, M.A.; Hassan, M.Y.; Abdullah, H.; Rahman, H.A.; Abdullah, M.P.; Hussin, F.; Said, D.M. A review on lighting control technologies in commercial buildings, their performance and affecting factors. Renew. Sustain. Energy Rev. 2014, 33, 268–279. [Google Scholar] [CrossRef]
- Google, I. Nest Thermostat. Available online: https://nest.com/thermostat/meet-nest-thermostat/ (accessed on 11 February 2017).
- Harle, R.K.; Hopper, A. The potential for location-aware power management. In Proceedings of the 10th International Conference on Ubiquitous Computing, Seoul, Korea, 21–24 September 2008; ACM: New York, NY, USA, 2008; pp. 302–311. [Google Scholar]
- Hay, S.; Rice, A. The case for apportionment. In Proceedings of the First ACM Workshop on Embedded Sensing Systems for Energy-Efficiency in Buildings, Berkeley, CA, USA, 3 November 2009; ACM: New York, NY, USA, 2009; pp. 13–18. [Google Scholar]
- Padmanabh, K.; Malikarjuna, V.A.; Sen, S.; Katru, S.P.; Kumar, A.; Vuppala, S.K.; Paul, S. iSense: A wireless sensor network based conference room management system. In Proceedings of the First ACM Workshop on Embedded Sensing Systems for Energy-Efficiency in Buildings, Berkeley, CA, USA, 3 November 2009; ACM: New York, NY, USA, 2009; pp. 37–42. [Google Scholar]
- Wen, Y.J.; Agogino, A.M. Wireless networked lighting systems for optimizing energy savings and user satisfaction. In Proceedings of the Wireless Hive Networks Conference, Austin, TX, USA, 7–8 August 2008; IEEE: New York, NY, USA, 2008; pp. 1–7. [Google Scholar]
- Chen, H.; Chou, P.; Duri, S.; Lei, H.; Reason, J. The design and implementation of a smart building control system. In Proceedings of the IEEE International Conference on e-Business Engineering, Macau, China, 21–23 October 2009; IEEE: New York, NY, USA, 2009; pp. 255–262. [Google Scholar]
- Mozer, M.C. The neural network house: An environment hat adapts to its inhabitants. In Proceedings of the AAAI Spring Symposium on Intelligent Environments; AAAI Press: Menlo Park, CA, USA, 1998; Volume 58. [Google Scholar]
- Gao, G.; Whitehouse, K. The self-programming thermostat: Optimizing setback schedules based on home occupancy patterns. In Proceedings of the First ACM Workshop on Embedded Sensing Systems for Energy-Efficiency in Buildings, Berkeley, CA, USA, 3 November 2009; ACM: New York, NY, USA, 2009; pp. 67–72. [Google Scholar]
- Dong, B.; Andrews, B. Sensor-based occupancy behavioral pattern recognition for energy and comfort management in intelligent buildings. In Proceedings of the IBPSA Conference of Building Simulation, Glasgow, UK, 27–30 July 2009; IBPSA: San Francisco, CA, USA, 2009; pp. 1444–1451. [Google Scholar]
- Hagras, H.; Callaghan, V.; Colley, M.; Clarke, G.; Pounds-Cornish, A.; Duman, H. Creating an ambient-intelligence environment using embedded agents. IEEE Intell. Syst. 2004, 19, 12–20. [Google Scholar] [CrossRef]
- Nguyen, T.A.; Aiello, M. Beyond Indoor Presence Monitoring with Simple Sensors. Proceeding of Pervasive and Embedded Computing and Communication Systems, Rome, Italy, 24–26 February 2012; INSTICC: Setubal, Portugal, 2012; pp. 5–14. [Google Scholar]
- Kim, Y.; Charbiwala, Z.; Singhania, A.; Schmid, T.; Srivastava, M.B. Spotlight: Personal natural resource consumption profiler. In Proceedings of the 5th Workshop on Hot Topics in Embedded Networked Sensors, Charlottesville, Virginia, USA, 2–3 June 2008; ACM Press: New York, NY, USA, 2010. [Google Scholar]
- Anderson, K.; Song, K.; Lee, S.; Lee, H.; Park, M. Energy consumption in households while unoccupied: Evidence from dormitories. Energy Build. 2015, 87, 335–341. [Google Scholar] [CrossRef]
- Lee, S.; Ha, K.; Lee, K. A pyroelectric infrared sensor-based indoor localization-aware system for the smart home. IEEE Trans. Consum. Electron. 2006, 52, 1311–1317. [Google Scholar] [CrossRef]
- Yang, D.; Sheng, W.; Zeng, R. Indoor human localization using PIR sensors and accessibility map. 2015 IEEE International Conference on Cyber Technology in Automation, Control, and Intelligent Systems (CYBER), Shenyang, China, 8–12 June 2015; IEEE: New York, NY, USA; pp. 577–581. [Google Scholar] [CrossRef]
- Lu, J.; Sookoor, T.; Srinivasan, V.; Gao, G.; Holben, B.; Stankovic, J.; Whitehouse, K. The smart thermostat. In Proceedings of the 8th ACM Conference on Embedded Networked Sensor Systems SenSys ‘10, Zurich, Switzerland, 3–5 November 2010; ACM Press: New York, NY, USA, 2010; pp. 211–224. [Google Scholar] [CrossRef]
- Naghiyev, E.; Gillott, M.; Wilson, R. Three unobtrusive domestic occupancy measurement technologies under qualitative review. Energy Build. 2014, 69, 507–514. [Google Scholar] [CrossRef]
- Benezeth, Y.; Laurent, H.; Emile, B.; Rosenberger, C. Towards a sensor for detecting human presence and characterizing activity. Energy Build. 2011, 43, 305–314. [Google Scholar] [CrossRef]
- Balaji, B.; Xu, J.; Nwokafor, A.; Gupta, R.; Agarwal, Y. Sentinel: Occupancy based HVAC actuation using existing WiFi infrastructure within commercial buildings. In Proceedings of the 11th ACM Conference on Embedded Networked Sensor Systems—SenSys ‘13, Roma, Italy, 11–15 November 2013; ACM Press: New York, NY, USA, 2013; pp. 1–14. [Google Scholar]
- Prieto, J.; De Paz, J.F.; Villarrubia, G.; De la Prieta, F.; Corchado, J.M. Unified fingerprinting/ranging localization in harsh environments. International. J. Distrib. Sens. Netw. 2015, 11. [Google Scholar] [CrossRef]
- Prieto, J.; Mazuelas, S.; Bahillo, A.; Fernandez, P.; Lorenzo, R.M.; Abril, E.J. Adaptive data fusion for wireless localization in harsh environments. IEEE Trans. Signal Process. 2012, 60, 1585–1596. [Google Scholar] [CrossRef]
- Pajuelo, P.; Pérez, M.C.; Villadangos, J.M.; Garcia, E.; Gualda, D.; Ureña, J.; Hernández, A. Implementation of indoor positioning algorithms using Android smartphones. In Proceedings of the IEEE 20th Conference on Emerging Technologies & Factory Automation (ETFA), Luxembourg, Luxembourg, 8–11 September 2015; IEEE: New York, NY, USA, 2015; pp. 1–4. [Google Scholar] [CrossRef]
- Corna, A.; Fontana, L.; Nacci, A.A.; Sciuto, D. Occupancy detection via iBeacon on Android devices for smart building management. In Proceedings of the 2015 Design, Automation & Test in Europe Conference & Exhibition, Grenoble, France, 9–13 March 2015; pp. 629–632. [Google Scholar]
- Prieto, J.; Mazuelas, S.; Win, M.Z. Context-aided Inertial Navigation via Belief Condensation. Measurements. IEEE Trans. Signal Process. 2015, 64, 3250–3261. [Google Scholar] [CrossRef]
- García, Ó.; Alonso, R.S.; Tapia, D.I.; Corchado, J.M. CAFCLA: A Framework to Design, Develop, and Deploy AmI-Based Collaborative Learning Applications. In Recent Advances in Ambient Intelligence and Context-Aware Computing; IGI Global: Hershey, PA, USA, 2015; pp. 187–209. [Google Scholar] [CrossRef]
- Villavicencio, C.P.; Schiaffino, S.; Díaz-Pace, J.A.; Monteserin, A. A Group Recommendation System for Movies based on MAS. Adv. Distrib. Comput. Artif. Intell. J. 2016, 5. [Google Scholar] [CrossRef]
- Rodríguez Marín, P.A.; Giraldo, M.; Tabares, V.; Duque, N.; Ovalle, D. Educational Resources Recommendation System for a heterogeneous Student Group. Adv. Distrib. Comput. Artif. Intell. J. 2016, 5. [Google Scholar] [CrossRef]
- Linden, G.; Smith, B.; York, J. Amazon.com recommendations: Item-to-item collaborative filtering. IEEE Internet Comput. 2003, 7, 76–80. [Google Scholar] [CrossRef]
- Barrios-O’Neill, D.; Schuitema, G. Online engagement for sustainable energy projects: A systematic review and framework for integration. Renew. Sustain. Energy Rev. 2016, 54, 1611–1621. [Google Scholar] [CrossRef]
- De Paz, J.F.; Tapia, D.I.; Alonso, R.S.; Pinzón, C.I.; Bajo, J.; Corchado, J.M. Mitigation of the ground reflection effect in real-time locating systems based on wireless sensor networks by using artificial neural networks. Knowl. Inf. Syst. 2013, 1–25. [Google Scholar] [CrossRef]
- Katsuura, H.; Sprecher, D.A. Computational aspects of Kolmogorov’s superposition theorem. Neural Netw. 1994, 7, 455–461. [Google Scholar] [CrossRef]
- LeCun, Y.A.; Bottou, L.; Orr, G.B.; Müller, K.R. Efficient backprop. In Neural Networks: Tricks of the Trade; Springer: Berlin/Heidelberg, Germany, 2012; pp. 9–48. [Google Scholar]
- Rosenblatt, M. Remarks on some nonparametric estimates of a density function. Ann. Math. Stat. 1956, 27, 832–837. [Google Scholar] [CrossRef]
- Julier, S.; Uhlmann, J. Unscented filtering and nonlinear estimation. Proc. IEEE 2004, 92, 401–422. [Google Scholar] [CrossRef]
- Bellifemine, F.; Poggi, A.; Rimassa, G. JADE–A FIPA-compliant agent framework. Proceedings of PAAM, London, UK, 19–21 April 1999; Volume 99, p. 33. [Google Scholar]
- Jøsang, A.; Ismail, R.; Boyd, C. A survey of trust and reputation systems for online service provision. Decis. Support Syst. 2007, 43, 618–644. [Google Scholar] [CrossRef]
- n-Core Platform. Available online: http://www.nebusens.com/en/products/n-core (accessed on 12 March 2017).
- Cloogy. Available online: http://www.cloogy.com/media/30958/brochura_cloogy_residential_en.pdf (accessed on 12 March 2017).


| Consumption | Flat 1 | Flat 2 | Flat 3 | Flat 4 | Flat 5 |
|---|---|---|---|---|---|
| Baseline (kWh) | 496.56 | 561.66 | 545.40 | 601.35 | 654.73 |
| Experiment (kWh) | 387.41 | 470.92 | 470.24 | 493.57 | 549.04 |
| Difference (kWh) | 109.15 | 90.74 | 75.16 | 107.78 | 105.68 |
| Savings (%) | 21.98% | 16.15% | 13.78% | 17.92% | 16.14% |
| Baseline | Experiment | |||||||
|---|---|---|---|---|---|---|---|---|
| Houses | Mean | Std. | Mean | Std. | t | p-Value (2-Tailed) | F | p-Value |
| Flat 1 (kWh) | 16.553 | 2.179 | 12.914 | 2.838 | 5.569 | 0.000 | 1.449 | 0.234 |
| Flat 2 (kWh) | 18.721 | 2.140 | 15.696 | 3.065 | 4.431 | 0.000 | 2.006 | 0.162 |
| Flat 3 (kWh) | 18.179 | 1.761 | 15.674 | 2.733 | 4.219 | 0.000 | 1.853 | 0.179 |
| Flat 4 (kWh) | 20.045 | 2.363 | 16.451 | 2.234 | 6.052 | 0.000 | 0.162 | 0.689 |
| Flat 5 (kWh) | 21.823 | 2.661 | 18.301 | 2.550 | 5.232 | 0.000 | 0.010 | 0.920 |
© 2017 by the authors. Licensee MDPI, Basel, Switzerland. This article is an open access article distributed under the terms and conditions of the Creative Commons Attribution (CC BY) license (http://creativecommons.org/licenses/by/4.0/).
Share and Cite
García, Ó.; Prieto, J.; Alonso, R.S.; Corchado, J.M. A Framework to Improve Energy Efficient Behaviour at Home through Activity and Context Monitoring. Sensors 2017, 17, 1749. https://doi.org/10.3390/s17081749
García Ó, Prieto J, Alonso RS, Corchado JM. A Framework to Improve Energy Efficient Behaviour at Home through Activity and Context Monitoring. Sensors. 2017; 17(8):1749. https://doi.org/10.3390/s17081749
Chicago/Turabian StyleGarcía, Óscar, Javier Prieto, Ricardo S. Alonso, and Juan M. Corchado. 2017. "A Framework to Improve Energy Efficient Behaviour at Home through Activity and Context Monitoring" Sensors 17, no. 8: 1749. https://doi.org/10.3390/s17081749
APA StyleGarcía, Ó., Prieto, J., Alonso, R. S., & Corchado, J. M. (2017). A Framework to Improve Energy Efficient Behaviour at Home through Activity and Context Monitoring. Sensors, 17(8), 1749. https://doi.org/10.3390/s17081749