Article

Detection of Guanine and Adenine Using an Aminated Reduced Graphene Oxide Functional Membrane-Modified Glassy Carbon Electrode

1
School of Life Sciences, Henan University, JinMing Road, Kaifeng 475000, China
2
Institute of Biotechnology, Henan University, Kaifeng 475000, China
3
Department of Ophthalmology and Visual Sciences and Biomedical Engineering, University of Wisconsin School of Medicine and Public Health, Madison, WI 53726, USA
4
Institute of Biochemistry and Biophysics, University of Tehran, Enquelab Avenue, Tehran 13145-1384, Iran
*
Authors to whom correspondence should be addressed.
These authors contributed equally to this work.
Sensors 2017, 17(7), 1652; https://doi.org/10.3390/s17071652
Submission received: 8 June 2017 / Revised: 5 July 2017 / Accepted: 13 July 2017 / Published: 18 July 2017
(This article belongs to the Special Issue Advanced Sensors Based on Carbon Electrodes)

Abstract

:
A new electrochemical sensor based on a Nafion, aminated reduced graphene oxide and chitosan functional membrane-modified glassy carbon electrode was proposed for the simultaneous detection of adenine and guanine. Fourier transform-infrared spectrometry (FTIR), transmission electron microscopy (TEM), and electrochemical methods were utilized for the additional characterization of the membrane materials. The prepared electrode was utilized for the detection of guanine (G) and adenine (A). The anodic peak currents to G and A were linear in the concentrations ranging from 0.1 to 120 μM and 0.2 to 110 μM, respectively. The detection limits were found to be 0.1 μM and 0.2 μM, respectively. Moreover, the modified electrode could also be used to determine G and A in calf thymus DNA.

1. Introduction

Adenine (A) and guanine (G) are vital constituents of deoxyribonucleic acids. They are very important in storing genetic information. Measuring the levels of A and G is important in bioscience and clinical diagnosis, because their quantities can act as important indicators for the diagnosis of various illnesses [1,2,3,4,5].
Numerous technical means are used for such analyses, including chemiluminescence [6], isotope dilution mass spectrometry [7], HPLC [8,9], capillary zone electrophoresis [10], and calorimetry [11]. Among these, the electrochemical methods have many merits compared with the traditional methods including real-time application, high sensitivity, fast response, and low cost [12,13]. However, the analytical sensitivities are usually very low, due to the irreversible adsorption and weak direct electron transfer capacity for both A and G on the surface of conventional electrodes.
In order to overcome the aforementioned shortcomings, many materials are used to modify electrodes, including the carboxylation of multi-walled carbon nanotubes [14], mesoporous carbon [15], and TiO2 nanobelts [16]. Recently, different functional membranes, such as graphene–ionic liquid–chitosan composites [17], graphene–Nafion composite membranes [18], pyridinedicarboxylic acid-graphene composite films [19], ionic liquids coated nanocrystalline zeolite materials [20], ruthenium hexachloroplatinate (RuPtCl6) inorganic membranes [21], titanium dioxide nanofibers-graphene oxide nanosheets nanocomposites [22], multi-walled carbon nanotubes-Fe3O4-polydopamine-Ag nanocomposites [23], carboxymethyl cellulose-halloysite nanotubular-carboxyl-functionalized multi-carbon nanotubes composites [24], and bimemtallic nanoparticles [25,26], are becoming more favorable as they achieve better electrochemical properties.
Recently, graphene oxide, nanofibers, fullerenes, carbon nanotubes, and other carbon allotropes have become important research objects for the improvement of electrochemical biosensing systems. Among them, graphene oxide (GO), combined with its finite dimension and unique structure, has demonstrated various properties such as superior mechanical flexibility, stability, and electrochemical conductivity. These unique properties make it a promising candidate for the fabrication of biosensors used for the detection of desired biomolecules [27,28]. Reduced graphene oxide (RGO) is the chemically reduced form of GO. RGOs possess improved electrical conductivity, and could be applied for the functionalization of desired biomolecules [29,30,31,32]. The main problem now is how to make an evenly dispersed graphene derivative that exhibits its proper performance in the fabrication process for a biosensor.
In the present study, a new electrochemical sensor based on Nafion (NF), aminated reduced graphene oxide (ARGO) and chitosan (CHT) functional membrane was proposed for the simultaneous detection of A and G. ARGO is a reduced graphene oxide covalently linked with piperazine, and is homogeneously dispersed in the membrane. CHT would be helpful to disperse the ARGO in the membrane, increase the surface area, and improve the electrochemical properties for CHT-ARGO compared with ARGO alone. The negatively charged NF may adsorb more positively charged guanine and adenine molecules to enhance the oxidation signals. Finally, the functional membrane-modified glassy carbon electrode (GCE) showed high electro-catalytic properties for the measurement of G and A (Scheme 1).

2. Materials and Methods

2.1. Reagents

CHT (0.5% in water), Adenine (A), Guanine (G), Cytosine (C), Thymine (T), NF (5% in a mixture of alcohols (methanol, ethanol, isopropanol) and water), disodium hydrogen phosphate (Na2HPO4), sodium dihydrogen phosphate (NaH2PO4), and calf thymus DNA were purchased from Sigma (Saint Louis, MO, USA). Aminated reduced graphene oxide (ARGO) was from Shenzhen Nanotech Port Ltd. Co. (Shenzhen, China). All other chemicals were of analytical grade. All solutions were prepared in double-distilled deionized water.

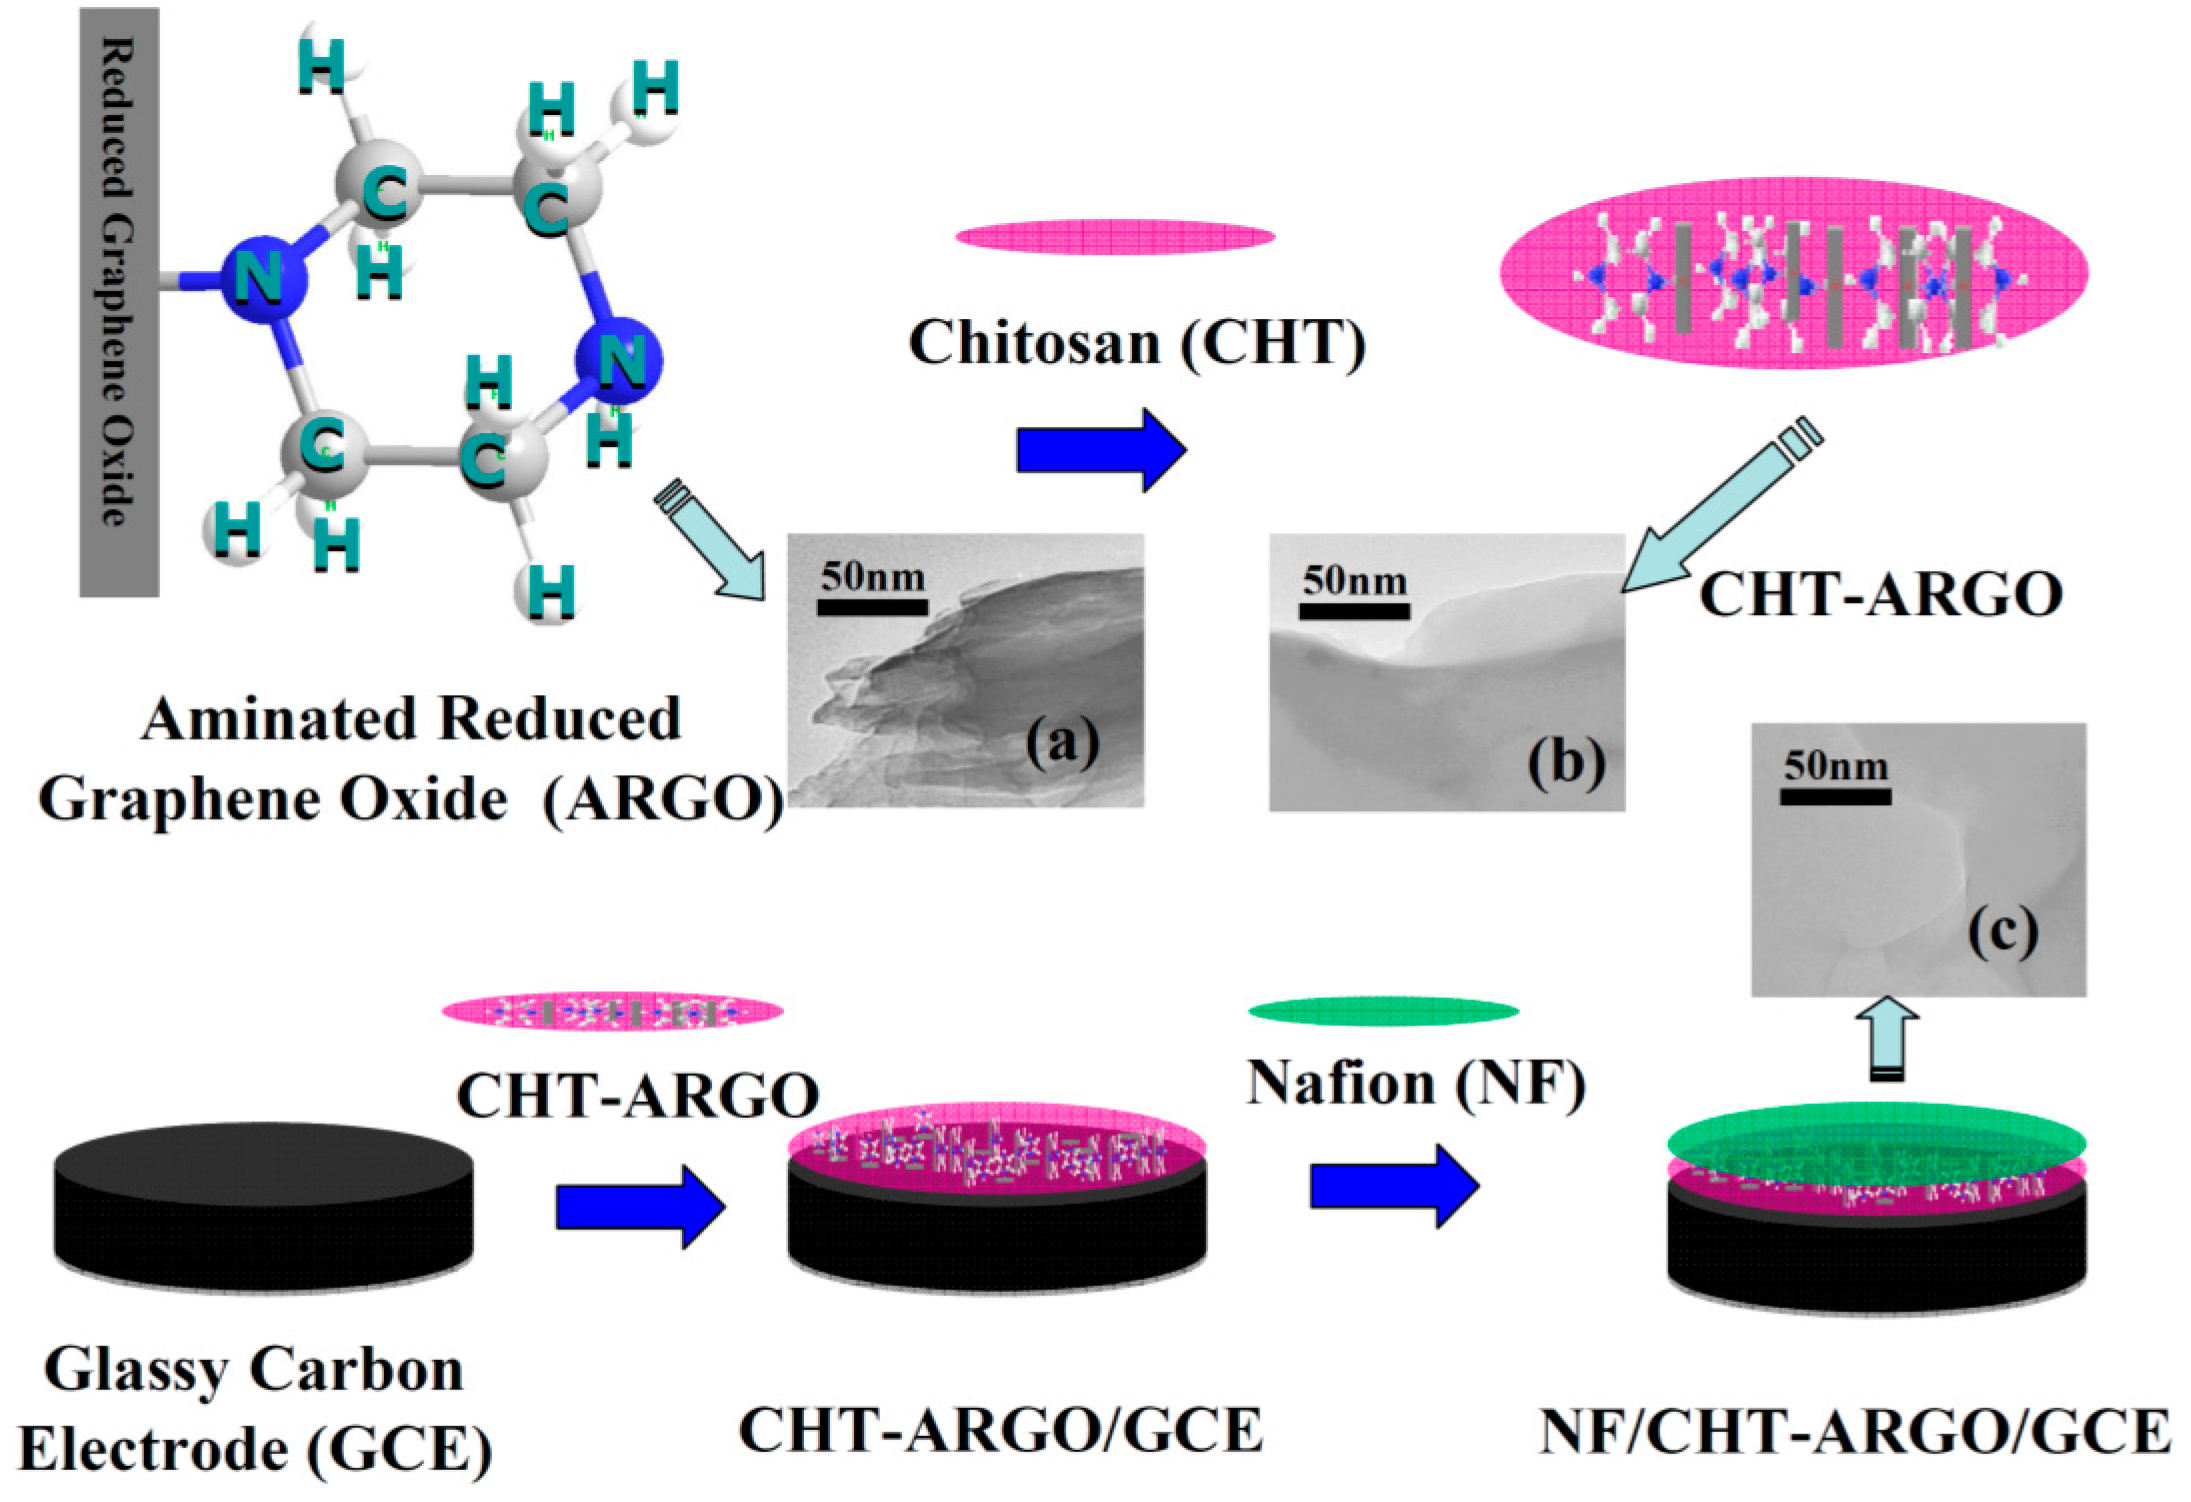
2.2. Fabrication of NF/CHT-ARGO Modified GCE

The procedure for the preparation of the GCE was as previously described [33,34,35]. The GCE was mechanically burnished with alumina (particle sizes: 1 μm, 0.3 μm, and 0.05 μm, respectively). After a electrochemical treatment in 0.2 M sulfuric acid, the GCE was inserted in a phosphate buffer solution (PBS, 50 mM, pH 7.0), and was treated at 1.7 V for 4 min. Then, the GCE was cleaned with water and dried with dry N2 at 25 °C. Afterwards, 3 μL of the equal volume mixture of CHT and ARGO (4 mg/mL) and 2 μL NF were successively added to the electrode surface and dried, respectively.

2.3. Instruments and Detections

An electrochemical workstation (CHI650C, CH Instrument, Austin, TX, USA) was used for electrochemical investigations. A Pt wire, an Ag/AgCl-saturated KCl, and a GCE 3 mm in diameter (CH Instrument, Austin, TX, USA) were used as counter, reference, and working electrodes, respectively. The electrochemical measurements were performed in N2-saturated PBS (phosphate buffer solution, 50 mM pH 7.0) at 25 ± 1 °C.
Fourier transform-infrared spectroscopy was recorded on a Spectrum Two Fourier transform infrared spectrometer (FTIR) (PerkinElmer, Beaconsfield, UK) with a KBr plate.
Electron micrograph images of the samples were evaluated using a TEM (JEM-1400, JEOL, Tokyo, Japan) operating at 80 kV.

2.4. Preparationof the Calf Thymus DNA Sample

The quantity of G and A was determined for the calf thymus DNA hydrolysates [17]. First, 10 mg of the calf thymus DNA was digested with 1 M HCl (3 mL) in a sealed glass bottle. Then, the sample was incubated at 90 °C for approximately 80 min. After adjusting the pH value to 7.0 with 1 M NaOH, 5 mL of the prepared solution was injected to the electrochemical cell for further electrochemical analysis.

2.5. HPLC Analysis on the Real Sample

These analyses were carried out on an HPLC instrument (Waters 1515, Parsippany, NJ, USA) equipped with a UV/Visible Detector Waters 2489. A C18 HPLC column (4.6 × 250 mm, 5 μm particle size) was used as a stationary phase. Sample peaks were analyzed using the Breeze software. The mobile phase was a mixture of methanol 4%-sodium acetate 0.6 M for isocratic elution. All solutions, including the ATGC (four bases) mixed standard samples and calf thymus DNA samples were filtered (0.22 μm filter) before use. The filtered samples (20 μL) were injected into the chromatographic column for analysis. The analysis temperature was maintained at 30 °C, the flow rate was kept constant at 1.0 mL/min, and the wavelength was set at 260 nm for detection [10,11,36].

3. Results

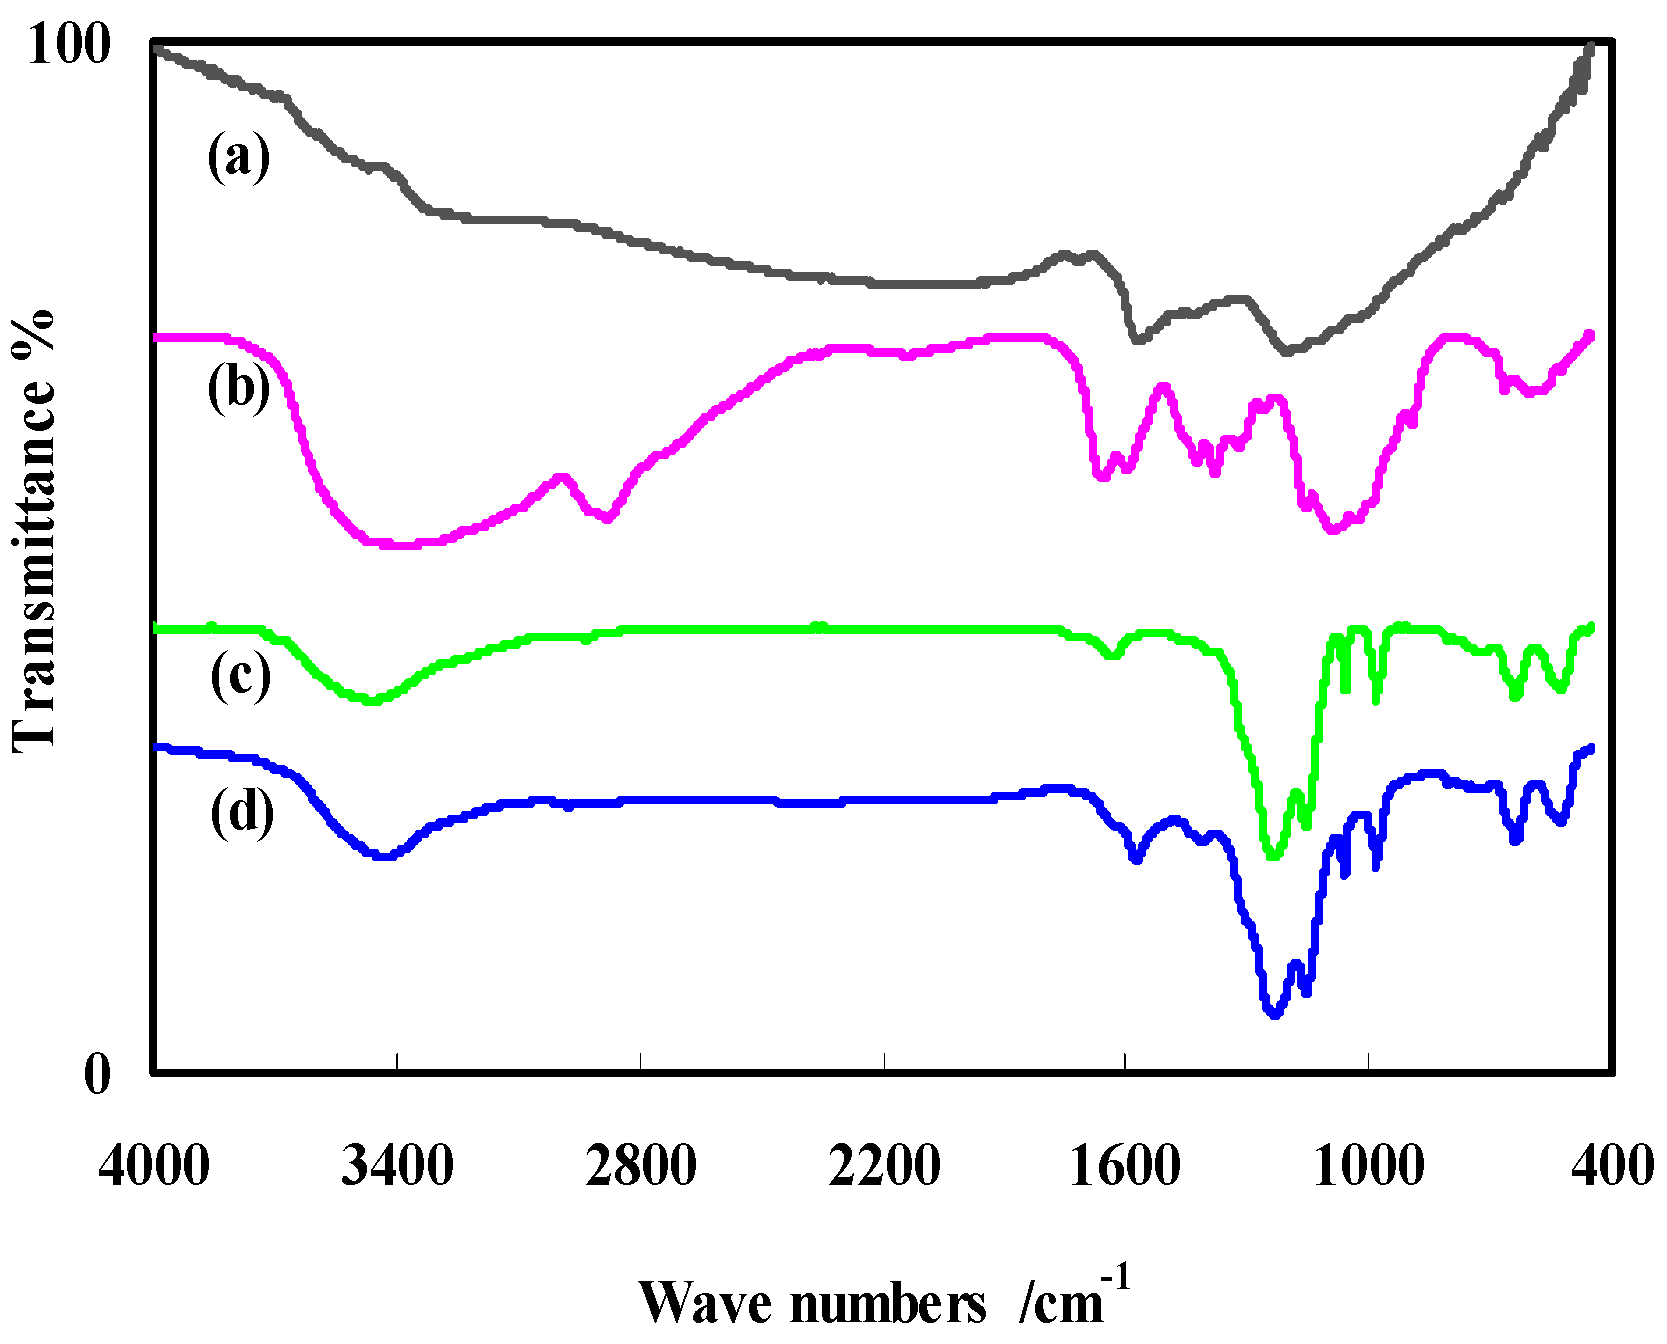
3.1. Microscopic and Structural Studies

The TEM images of ARGO, CHT-ARGO, and NF-CHT-ARGO are shown in Scheme 1a–c, respectively. The ARGO was homogeneously dispersed in CHT (b) and NF-CHT (c), which could help maintaining a larger surface area on the GCE. The effective surface area was significantly increased after being modified with CHT-ARGO compared with ARGO.
The FTIR spectra of ARGO, CHT, NF, and NF-CHT-ARGO are shown in Figure 1 (curves a, b, c, and d, respectively). ARGO exhibited a group of characteristic peaks at around 3203 cm−1, 1550 cm−1, 1432 cm−1, and 1006 cm−1. The presence of the amino groups was evident by the weak peaks at 1432 cm−1 and 1550 cm−1 due to N–H bending (curve a). The abundance of –OH and –NH2 groups, around 3425 cm−1, 1072 cm−1 due to O–H and 1650 cm−1, 1591 cm−1 due to N–H, makes CHT (curve b) a prefect biocompatible material. The characteristic peaks of the –SO3 group of NF at around 1220 cm−1 and 1150 cm−1 appeared in both NF (curve c) and NF-CHT-ARGO (curve d) [17,31,37].

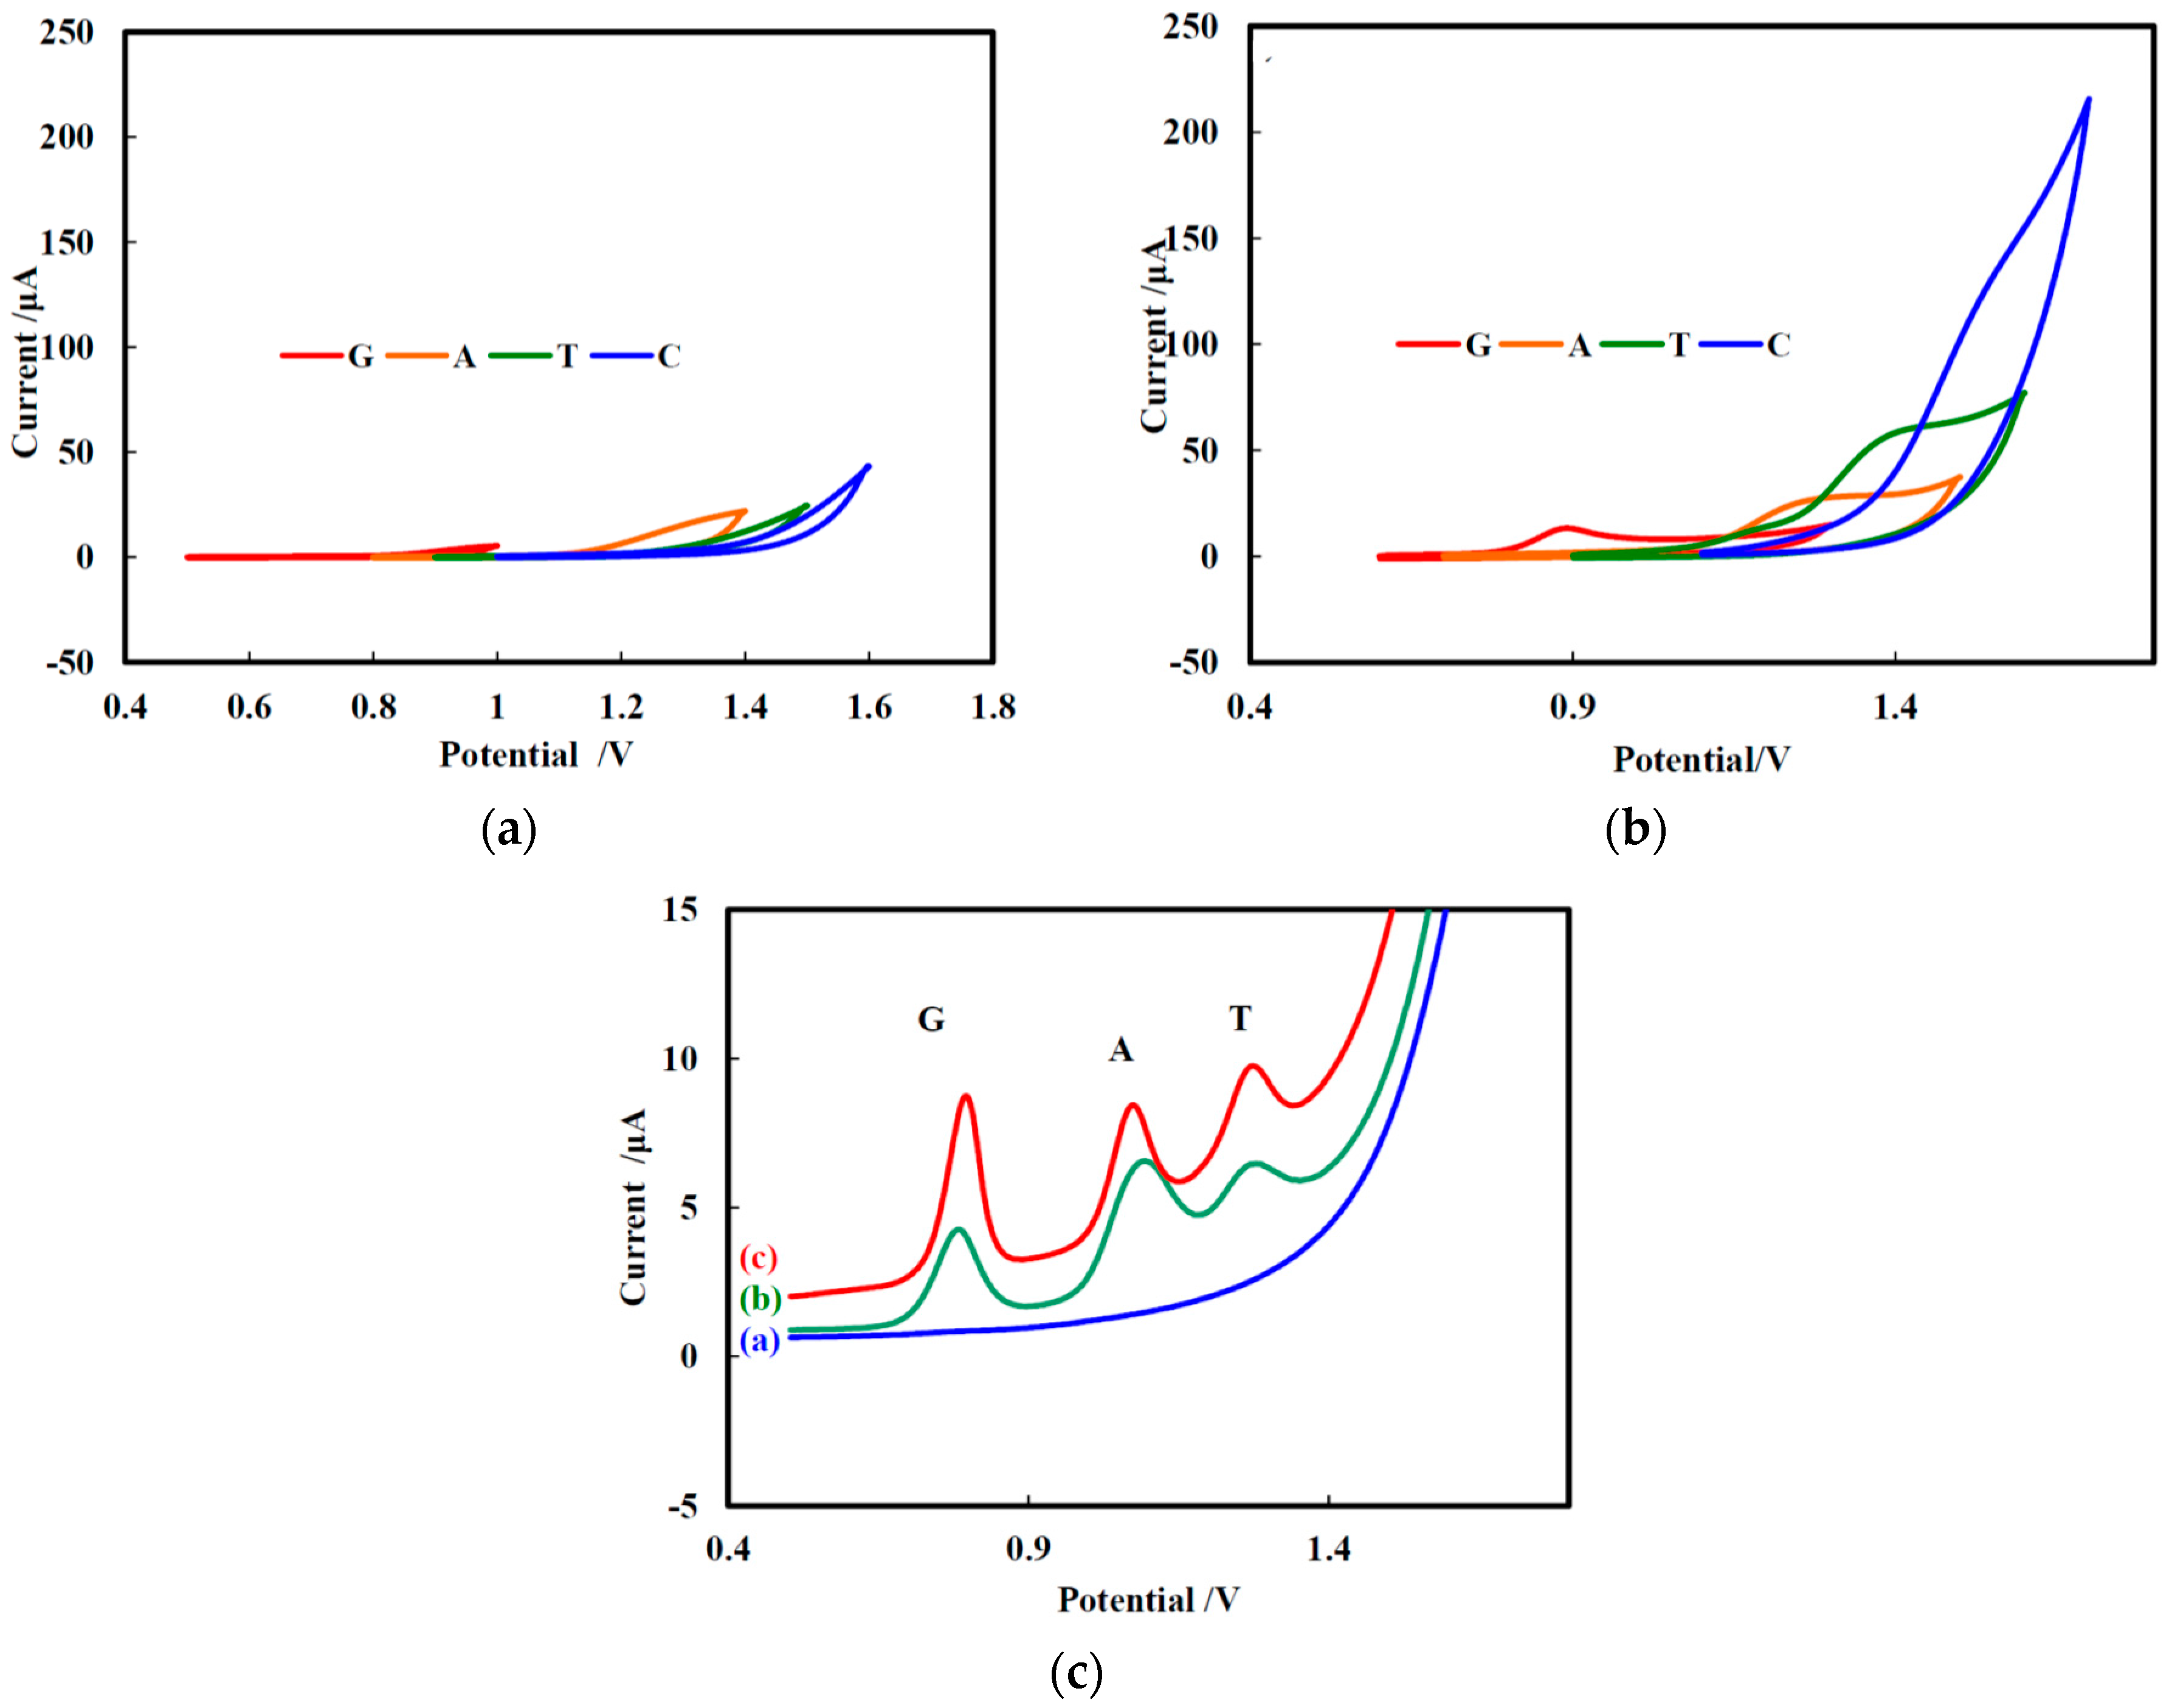
3.2. Characterization of Electrochemical Behavior of Different Modified GCEs

The cyclic voltammograms (CVs) of G, A, T, and C (each 1 mM) at (a) bare GCE and (b) NF/CHT-ARGO/GCE are shown in Figure 2. The CVs of bare GCE looked no redox peak was observed in Figure 2a. The G, A, and T were oxidized on NF/CHT-ARGO/GCE at 0.903 V, 1.247 V, or 1.407 V, respectively (Figure 2b). The oxidation peak currents were higher for NF/CHT-ARGO/GCE than that for NF/CHT-GO/GCE or NF/CHT-RGO (data not shown). ARGO may be more suitable for the preparation of functional membrane to detect the A and G than GO or RGO. The negatively charged NF contributes to enhance signals probably ionic interaction with the positively charged A and G molecules. A slightly smaller signal was observed for T, while the C oxidation was hardly observed (Figure 2b).
The electrochemistry of G, A, or T (each 1 mM) at various decorated GCEs were also investigated by differential pulse voltammetry (DPV), respectively, in 50 mM PBS, pH 7.0 (Figure 2c). No redox peak was observed in the range from 0.5 to 1.5 V at bare GCE (curve a). The NF/CHT-ARGO/GCE (curve c) gave three stronger oxidation peaks compared with NF/ARGO/GCE (curve b) at around 0.804 V, 1.084 V, and 1.288 V for G, A, and T, respectively. The peak-to-peak separation between G and A was 0.280 V. The separation between A and T was 0.208 V. These results may be ascribed to the high conductivity, high electrochemical activity, and the synergistic effect of the electro catalytic property of NF, CHT, and ARGO. It should be pointed out that the NF/CHT-ARGO functional membrane-decorated GCE can not only distinguish between G, A and T, but also can improve the measurement sensitivity. Though the peak-to-peak spacing between G and A (or between A and T) was 0.280 V (or 0.208 V), which was large enough to measure G, A, and T simultaneously, it may be more suitable to detect G and A on the NF/CHT-ARGO/GCE, to improve the anti-interference ability of the electrode.

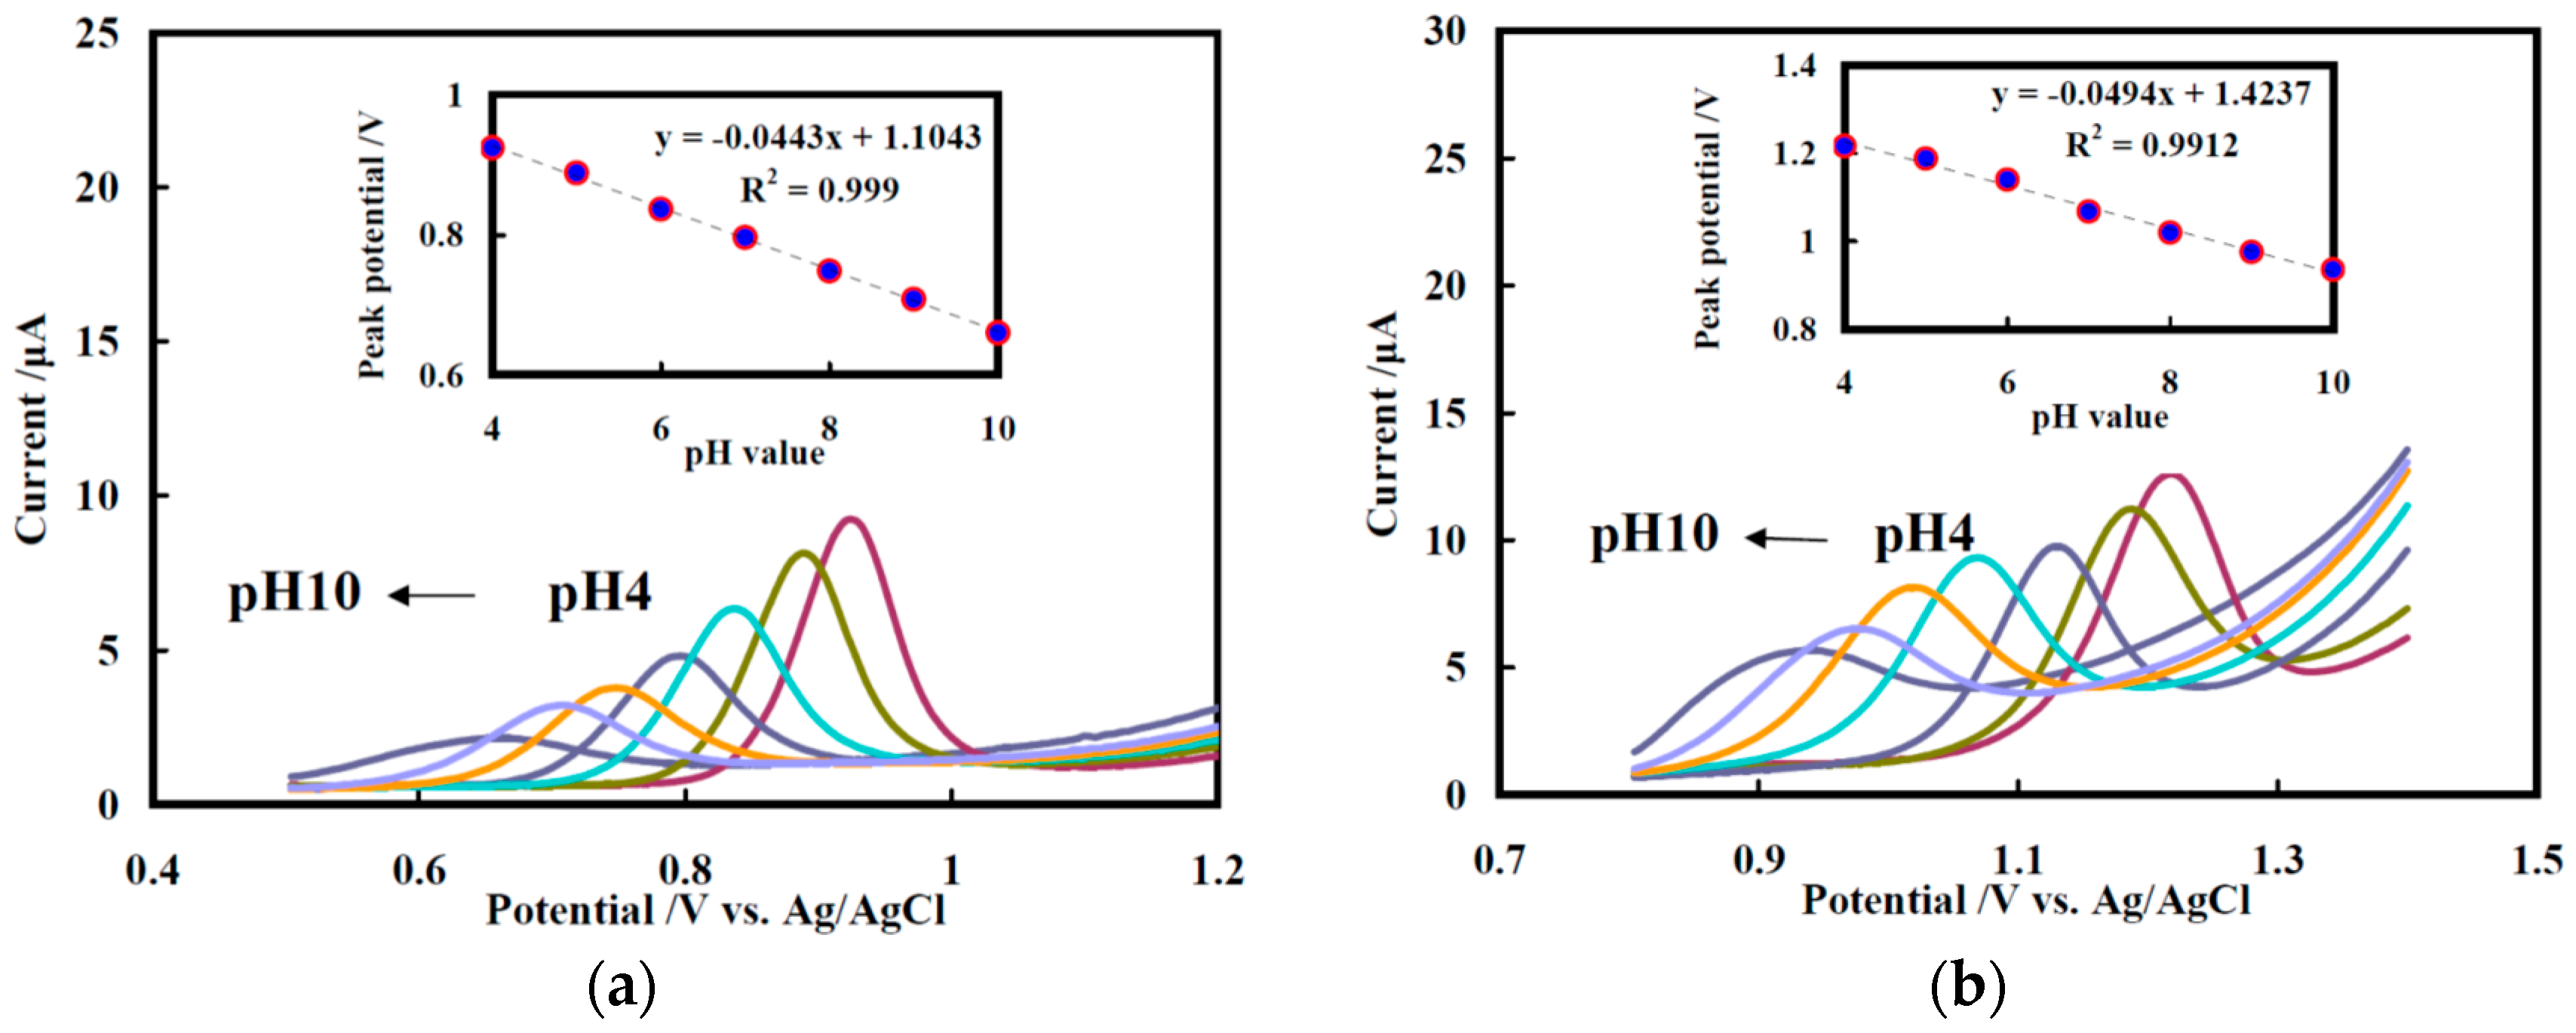
3.3. pH Effects Values on Determination of G and A

The pH effects on the individual oxidation of G and A, which were studied by DPVs of NF/CHT-ARGO/GCE in the pH value range from 4 to 10 (from right to left), are shown in Figure 3a,b, respectively. The oxidation peak potentials of G and A shifted positively with the decrease in pH values (from 4 to 10), indicating that the electrochemical oxidation of G or A was associated with a proton-transfer process. The relationships of the peak potentials of G and A were linear and proportional to pH values. The slopes were 44.3 mV/pH (Figure 3a, inset) and 49.4 mV/pH (Figure 3b, inset), respectively, which means that the numbers of electrons and protons involved in the mechanisms of guanine and adenine might be the same [17]. The electrochemical oxidation of G and A on NF/CHT-ARGO/GCE should be a two-electron and two-proton process, which is similar to that on graphene–NF/GCE [18]. The oxidation peak currents of G and A decreased with the increasing pH value (Figure 3). In consideration of the separation effects and measurement sensitivity, pH 7.0 was chosen as the optimum value in the later investigations.

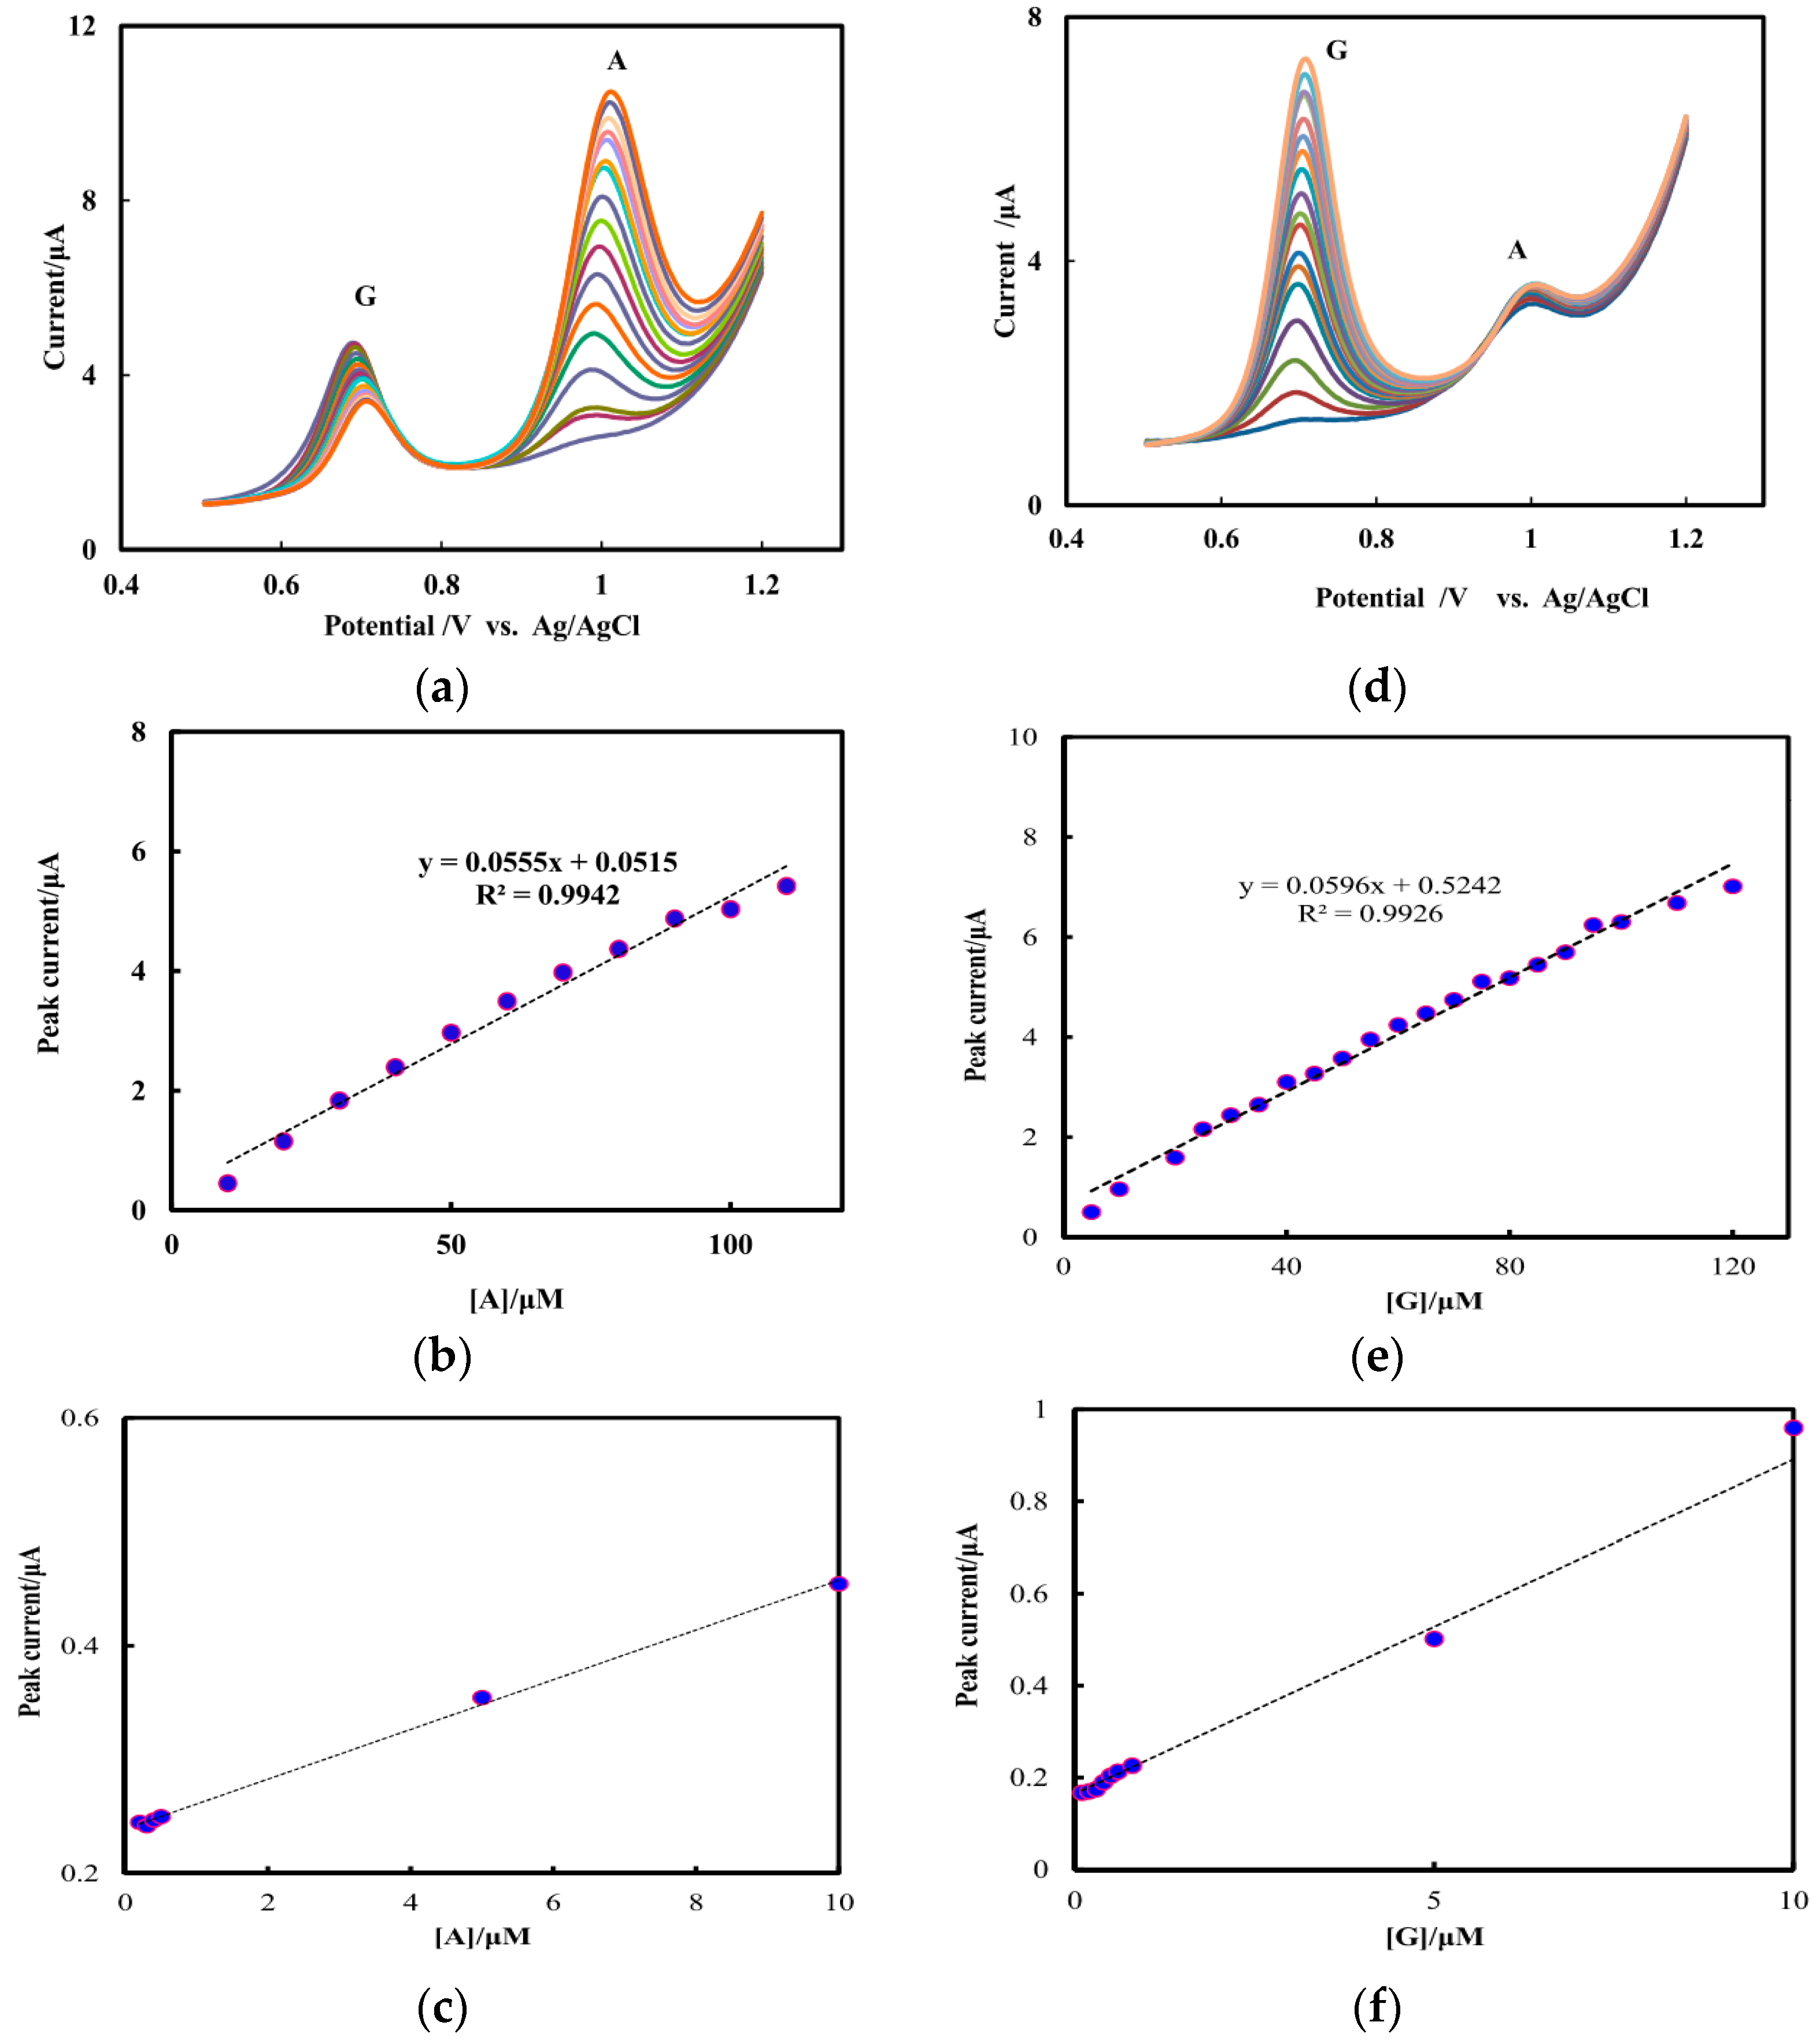
3.4. Determination of G and A Using NF/CHT-ARGO/GCE

The oxidation of G and A in their mixture was investigated by DPV at the NF/CHT-ARGO/GCE, respectively, when the concentration of one species changed, the concentration of the other species remained constant. Figure 4a shows that the oxidation peak current increases linearly with the increasing concentration of A ranging from 0.2 to 110 μM in 50 mM PBS, pH 7.0 containing G (25 μM) (Figure 4b). obtained to be 0.2 μM (Figure 4c). A calibration equation (Equation (1)) for A was then calculated (Figure 4b). Similarly, a linear relationship was found in the range of 0.1–120 μM with a calibration equation (Equation (2)) (Figure 4d,e) for G, in 50 mM PBS, pH 7.0 containing A (25 μM). The detection limit for G was 0.1 μM (Figure 4f). Table 1 shows the comparison of the behaviour of different modified electrodes for the detection of DNA bases.
I A ( μ A ) = 0.0555 C A ( μ M ) + 0.0515     ( R 2 = 0.994 )
I G ( μ A ) = 0.0596 C G ( μ M ) + 0.5242     ( R 2 = 0.993 )

3.5. Potential Applications of NF/CHT-ARGO/GCE

The potential applications of the modified GCE were verified in a real DNA. The calf thymus DNA sample was prepared as indicated in Section 2.4. The oxidation peak currents of the DNA sample were clearly shown to be 5.310 μA and 6.000 μA on the NF/CHT-ARGO/GCE by DPV (Figure 5), which were caused by the oxidation of G and A groups, respectively. According to Equations (1) and (2), the concentrations of G and A for calf thymus DNA was calculated to be 80.3 ± 1.0 μM and 107.1 ± 1.0 μM, respectively. So, the ratio of G to A was determined to be 0.75, which was close to the value (0.77) determined by the HPLC method (data not shown).

3.6. Reproducibility, Stability and Interferences

To evaluate the reproducibility of the proposed sensor, five NF/CHT-ARGO-modified GCEs were prepared in the same manner, and DPV responses to the mixture containing 20 μM G and 25 μM A in 50 mM PBS (pH 7.0) were investigated. The relative standard deviation (RSD, n = 5) were concluded to be 3.45% of G and 4.33% of A, indicating that the reproducibility of the proposed electrode was good.
To evaluate the long-term stability, the DPV responses to the mixture containing 20 μM G and 25 μM A were detected for 15 days. The RSDs (n = 15) were 2.53% of G and 2.87% of A (data not shown). The DPV responses of the prepared electrodes, which were stored at 4 °C, were determined at the interval of three days. The RSDs (n = 5) were 2.82% of G and 2.69% of A (data not shown), suggesting that the stability of the proposed electrode was high.
The anti-interference ability of NF/CHT-ARGO/GCE was evaluated by adding possible interferents to samples containing 20 μM G and 25 μM A in 50 mM PBS (pH 7.0). As shown in Table 2, it was found that uric acid, ascorbic acid, vitaminB1, vitaminB2, L-Lysine, Glycine and glucose had little effect on the detection of G or A, indicating that the NF/CHT-ARGO/GCE had a good selectivity and anti-interference ability for measuring G and A. The interference percentages (I%) were calculated using Equation (3):
I % = ( 1 I p I p 0 I p 0 ) × 100 %
where, Ip is the oxidation peak current of A or G in the presence of one of the interferences, Ip0 is the oxidation peak current of A or G in the absence of an interference. Obviously, the anti-interference ability of the electrode would be stronger when I% value is close to 100%.

4. Conclusions

A new electrochemical sensor based on NF, ARGO and CHT functional membrane-modified glassy carbon electrode was proposed for the simultaneous detection of A and G. CHT may help to disperse ARGO homogeneously in the functional membrane and improve the electrochemical properties of the proposed electrode. The negatively charged NF may adsorb more positively charged guanine and adenine molecules to enhance the oxidation signals. The proposed modified electrode could be applied to quantify G and A with high reproducibility, stability, and sensitivity.

Acknowledgments

This work was supported by Henan University Science Foundation, Development Projects of Henan Province Science, Technology and Research Council of University of Tehran and Iran National Science Foundation (INSF). NS is supported by an unrestricted award from Research to Prevent Blindness to the Department of Ophthalmology and Visual Sciences and Retina Research Foundation.

Author Contributions

D.L., X.-L.Y. and J.H. conceived and designed the experiments; D.L., X.-L.Y. and F.-Y.G. performed the experiments; D.L., X.-L.Y., B.-L.X., F.-Y.G. and J.H. analyzed the data; D.L., X.-L.Y. and B.-L.X. contributed reagents/materials/analysis tools; D.L., X.-L.Y., J.H., N.S., and A.A.M.-M. wrote the paper.

Conflicts of Interest

The authors declare no conflict of interest.

References

  1. Wei, Y.; Xu, Y.; Han, X.; Qi, Y.; Xu, L.; Xu, Y.; Yin, L.; Sun, H.; Liu, K.; Peng, J. Anti-cancer effects of dioscin on three kinds of human lung cancer cell lines through inducing DNA damage and activating mitochondrial signal pathway. Food Chem. Toxicol. 2013, 59, 118–128. [Google Scholar] [CrossRef] [PubMed]
  2. Hu, C.; Yang, D.P.; Wang, Z.; Huang, P.; Wang, X.; Chen, D.; Cui, D.; Yang, M.; Jia, N. Bio-mimetically synthesized Ag@BSA microspheres as a novel electrochemical biosensing interface for sensitive detection of tumor cells. Biosens. Bioelectron. 2013, 41, 656–662. [Google Scholar] [CrossRef] [PubMed]
  3. Hu, C.; Yang, D.P.; Wang, Z.; Yu, L.; Zhang, J.; Jia, N. Improved EIS performance of an electrochemical cytosensor using three-dimensional architecture Au@BSA as sensing layer. Anal. Chem. 2013, 85, 5200–5206. [Google Scholar] [CrossRef] [PubMed]
  4. Goyal, R.N.; Chatterjee, S.; Bishnoi, S. Voltammetric determination of 2-deoxy-adenosine and adenine in urine of patients with hepatocellular carcinoma using fullerene-C60-modified glassy carbon electrode. Electroanalysis 2009, 21, 1369–1378. [Google Scholar] [CrossRef]
  5. Yang, F.Q.; Guan, J.; Li, S.P. Fast simultaneous determination of 14 nucleosides and nucleobases in cultured cordyceps using ultra-performance liquid chromatography. Talanta 2007, 73, 269–273. [Google Scholar] [CrossRef] [PubMed]
  6. Kai, M.; Ohkura, Y.; Yonekura, S.; Iwasaki, M. Chemiluminescence determination of guanine and its nucleosides and nucleotides using phenylglyoxal. Anal. Chim. Acta 1994, 287, 75–81. [Google Scholar] [CrossRef]
  7. Hamberg, M.; Zhang, L.Y. Quantitative determination of 8-hydroxyguanine and guanine by isotope dilution mass spectrometry. Anal. Biochem. 1995, 229, 336–344. [Google Scholar] [CrossRef] [PubMed]
  8. Todd, B.; Zhao, J.; Fleet, G. HPLC measurement of guanine for the determination of nucleic acids (RNA) in yeasts. J. Microbiol. Methods 1995, 22, 1–10. [Google Scholar] [CrossRef]
  9. Graven, P.; Tambalo, M.; Scapozza, L.; Perozzo, R. Purine metabolite and energy charge analysis of trypanosoma brucei cells in different growth phases using an optimized ion-pair RP-HPLC/UV for the quantification of adenine and guanine pools. Exp. Parasitol. 2014, 141, 28–38. [Google Scholar] [CrossRef] [PubMed]
  10. Haunschmidt, M.; Buchberger, W.; Klampfl, C.W. Investigations on the migration behaviour of purines and pyrimidines in capillary electromigration techniques with UV detection and mass spectrometric detection. J. Chromatogr. A 2008, 1213, 88–92. [Google Scholar] [CrossRef] [PubMed]
  11. Heisler, I.; Keller, J.; Tauber, R.; Sutherland, M.; Fuchs, H. A colorimetric assay for the quantitation of free adenine applied to determine the enzymatic activity of ribosome-inactivating proteins. Anal. Biochem. 2002, 302, 114–122. [Google Scholar] [CrossRef] [PubMed]
  12. Xiao, F.; Zhao, F.; Li, J.; Liu, L.; Zeng, B. Characterization of hydrophobic ionicliquid carbon nanotubes-gold nanoparticles composite film coated electrodeand the simultaneous voltammetric determination of guanine and adenine. Electrochim. Acta 2008, 53, 7781–7788. [Google Scholar] [CrossRef]
  13. Tang, C.; Yogeswaran, U.; Chen, S.M. Simultaneous determination of adenine guanine and thymine at multi-walled carbon nanotubes incorporated with poly (new fuchsin) composite film. Anal. Chim. Acta 2009, 636, 19–27. [Google Scholar] [CrossRef] [PubMed]
  14. Tu, X.; Luo, X.; Luo, S.; Yan, L.; Zhang, F.; Xie, Q. Novel carboxylation treatment and characterization of multiwalled carbon nanotubes for simultaneous sensitive determination of adenine and guanine in DNA. Microchim. Acta 2010, 169, 33–40. [Google Scholar] [CrossRef]
  15. Thangaraj, R.; Kumar, A.S. Simultaneous detection of guanine and adenine in DNA and meat samples using graphitized mesoporous carbon modified electrode. J. Solid State Electrochem. 2013, 17, 583–590. [Google Scholar] [CrossRef]
  16. Cui, J.; Sun, D.; Zhou, W.; Liu, H.; Hu, P.; Ren, N.; Qin, H.; Huang, Z.; Lin, J.; Ma, H. Electrocatalytic oxidation of nucleobases by TiO2 nanobelts. Phys. Chem. Chem. Phys. 2011, 13, 9232–9237. [Google Scholar] [CrossRef] [PubMed]
  17. Niu, X.; Yang, W.; Ren, J.; Guo, H.; Long, S.; Chen, J. Electrochemical behaviors and simultaneous determination of guanine and adenine based on graphene–ionic liquid–chitosan composite film modified glassy carbon electrode. Electrochim. Acta 2012, 80, 346–353. [Google Scholar] [CrossRef]
  18. Yin, H.; Zhou, Y.; Ma, Q.; Ai, S.; Ju, P.; Zhu, L. Electrochemical oxidation behavior of guanine and adenine on graphene–nafion composite film modified glassy carbon electrode and the simultaneous determination. Process Biochem. 2010, 45, 1707–1712. [Google Scholar] [CrossRef]
  19. Li, C.; Qiu, X.; Ling, Y. Electrocatalytic oxidation and the simultaneous determination of guanine and adenine on (2,6-pyridinedicarboxylic acid)/graphene composite film modified electrode. J. Electroanal. Chem. 2013, 704, 44–49. [Google Scholar] [CrossRef]
  20. Kaur, B.; Srivastava, R. Synthesis of ionic liquids coated nanocrystalline zeolite materials and their application in the simultaneous determination of adenine, cytosine, guanine, and thymine. Electrochim. Acta 2014, 133, 428–439. [Google Scholar] [CrossRef]
  21. Shaidarova, L.G.; Gedmina, A.V.; Zhaldak, E.R.; Chelnokova, I.A.; Budnikov, G.K. Selective voltammetric and flow-injection determination of guanine and adenine on a glassy carbon electrode modified by a ruthenium hexachloroplatinate film. J. Anal. Chem. 2014, 69, 741–749. [Google Scholar] [CrossRef]
  22. Arvand, M.; Ghodsi, N.; Zanjanchi, M.A. A new microplatform based on titanium dioxide nanofibers/graphene oxide nanosheets nanocomposite modified screen printed carbon electrode for electrochemical determination of adenine in the presence of guanine. Biosens. Bioelectron. 2015, 77, 837–844. [Google Scholar] [CrossRef] [PubMed]
  23. Yari, A.; Derki, S. New MWCNT-Fe3O4@PDA-Ag nanocomposite as a novel sensing element of an electrochemical sensor for determination of guanine and adenine contents of DNA. Sens. Actuators B Chem. 2016, 227, 456–466. [Google Scholar] [CrossRef]
  24. Chang, J.; Xiao, W.; Liu, P.; Liao, X.; Wen, Y.; Bai, L. Carboxymethyl cellulose assisted preparation of water-processable halloysite nanotubular composites with carboxyl-functionalized multi-carbon nanotubes for simultaneous voltammetric detection of uric acid, guanine and adenine in biological samples. J. Electroanal. Chem. 2016, 780, 103–113. [Google Scholar] [CrossRef]
  25. He, W.; Ding, Y.; Ji, L.; Zhang, X.; Yang, F. A high performance sensor based on bimetallic NiCu nanoparticles forthe simultaneous determination of five species of biomolecules. Sens. Actuators B Chem. 2017, 241, 949–956. [Google Scholar] [CrossRef]
  26. He, W.; Zhang, W.; Zhang, L.; Zhang, X.; Yang, F. A versatile sensor for determination of seven species based on NiFe nanoparticles. J. Electroanal. Chem. 2017, 797, 61–68. [Google Scholar] [CrossRef]
  27. Geim, A.K. Graphene: Status and prospects. Science 2009, 324, 1530–1534. [Google Scholar] [CrossRef] [PubMed]
  28. Pumera, M.; Ambrosi, A.; Bonanni, A.; Chng, E.L.K.; Poh, H.L. Graphene for electrochemical sensing and biosensing. TrAC Trends Anal. Chem. 2014, 29, 954–965. [Google Scholar] [CrossRef]
  29. Stankovich, S.; Dikin, D.A.; Dommett, G.H.; Kohlhaas, K.M.; Zimney, E.J.; Stach, E.A.; Ruoff, R.S. Graphene-based composite materials. Nature 2006, 442, 282–286. [Google Scholar] [CrossRef] [PubMed]
  30. Robinson, J.T.; Perkins, F.K.; Snow, E.S.; Wei, Z.; Sheehan, P.E. Reduced graphene oxide molecular sensors. Nano Lett. 2008, 8, 3137–3140. [Google Scholar] [CrossRef] [PubMed]
  31. Ali, M.A.; Kamil Reza, K.; Srivastava, S.; Agrawal, V.V.; John, R.; Malhotra, B.D. Lipid-Lipid Interactions in Aminated Reduced Graphene Oxide Interface for Biosensing Application. Langmuir 2014, 30, 4192–4201. [Google Scholar] [CrossRef] [PubMed]
  32. Gao, Y.S.; Xu, J.K.; Lu, L.M.; Wu, L.P.; Zhang, K.X.; Nie, T. Overoxidized polypyrrole/graphene nanocomposite with good electrochemical performance as novel electrode material for the detection of adenine and guanine. Biosens. Bioelectron. 2014, 62, 261–267. [Google Scholar] [CrossRef] [PubMed]
  33. Gao, Y.F.; Yang, T.; Yang, X.L.; Zhang, Y.S.; Xiao, B.L.; Hong, J.; Sheibani, N.; Ghourchian, H.; Hong, T.; Moosavi-Movahedi, A.A. Direct electrochemistry of glucose oxidase and glucose biosensing on a hydroxyl fullerenes modified glassy carbon electrode. Biosens. Bioelectron. 2014, 60, 30–34. [Google Scholar] [CrossRef] [PubMed]
  34. Hong, J.; Yang, W.Y.; Zhao, Y.X.; Xiao, B.L.; Gao, Y.F.; Yang, T.; Ghourchian, H.; Moosavi-Movahedi, Z.; Sheibani, N.; Li, J.G.; et al. Catalase immobilized on a functionalized multi-walled carbon nanotubes–gold nanocomposite as a highly sensitive bio-sensing system for detection of hydrogen peroxide. Electrochim. Acta 2013, 89, 317–325. [Google Scholar] [CrossRef]
  35. Hong, J.; Zhao, Y.-X.; Xiao, B.-L.; Moosavi-Movahedi, A.A.; Ghourchian, H.; Sheibani, N. Direct electrochemistry of hemoglobin immobilized on a functionalized multi-walled carbon nanotubes and gold nanoparticles nanocomplex-modified glassy carbon electrode. Sensors 2013, 13, 8595–8611. [Google Scholar] [CrossRef] [PubMed]
  36. De Moral, P.G.; Arin, M.J.; Resines, J.A.; Diez, M.T. Simultaneous determination of adenine and guanine in ruminant bacterial pellets by ion-pair HPLC. J. Chromatogr. B 2005, 826, 257–260. [Google Scholar] [CrossRef] [PubMed]
  37. Hong, J.; Moosavi-Movahedi, A.A.; Ghourchian, H.; Rad, A.M.; Rezaei-Zarchi, S. Direct electron transfer of horseradish peroxidase on Nafion-cysteine modified gold electrode. Electrochem. Acta 2007, 52, 6261–6267. [Google Scholar] [CrossRef]
  38. Prathap, M.A.; Srivastava, R.; Satpati, B. Simultaneous detection of guanine, adenine, thymine, and cytosine atpolyaniline/MnO2 modified electrode. Electrochim. Acta 2013, 114, 285–295. [Google Scholar] [CrossRef]
  39. Ye, X.; Du, Y.; Duan, K.; Lu, D.; Wang, C.; Shi, X. Fabrication of nano-ZnS coated PEDOT-reduced graphene oxide hybrids modified glassy carbon-rotating disk electrode and its application for simultaneous determination of adenine, guanine, and thymine. Sens. Actuators B Chem. 2014, 203, 271–281. [Google Scholar] [CrossRef]
  40. Yari, A.; Saidikhah, M. Trithiane silver-nanoparticles-decorated polyaniline nanofibers as sensing element for electrochemical determination of adenine and guanine in DNA. J. Electroanal. Chem. 2016, 783, 288–294. [Google Scholar] [CrossRef]
  41. Ensafi, A.A.; Abarghoui, M.M.; Rezaei, B. A new electrochemical sensor based on porous silicon supported Pt–Pd nanoalloy for simultaneous determination of adenine and guanine. Sens. Actuators B Chem. 2014, 204, 528–535. [Google Scholar] [CrossRef]
Scheme 1. The preparation processes of NF/CHT-ARGO/GCE and the TEM images of ARGO (a), CHT-ARGO (b), and NF-CHT-ARGO (c). NF: Nafion, CHT: chitosan, ARGO: aminated reduced graphene oxide.
Sensors 17 01652 sch001
Figure 1. FTIR spectra of ARGO (curve a), CHT (curve b), NF (curve c), and the mixture of NF-CHT-ARGO (curve d).
Sensors 17 01652 g001
Figure 2. Cyclic voltammograms (CVs) of G, A, T, and C (each 1 mM) at (a) bare GCE and (b) NF/CHT-ARGO/GCE in buffer solution (pH 7.0) at a scan rate of 50 mV/s; (c) Differential pulse voltammograms (DPVs) of G, A, and T at bare GCE (curve a), NF/ARGO/GCE (curve b), and NF/CHT-ARGO/GCE (curve c), respectively, in pH 7.0 PBS at a scan rate of 50 mV/s.
Sensors 17 01652 g002
Figure 3. Effects of pH value on the electrochemical oxidation of 100 μM G (a) and 100 μM A (b), respectively, on NF/CHI-ARGO/GCE (accumulation time: 200 s). Insets: plots of the oxidation peaks potential versus pH value.
Sensors 17 01652 g003
Figure 4. (a) DPVs at varying concentrations of A in the presence of G (25 μM); (b) Plot of the oxidation peak currents versus different concentrations of A; (c) Local enlarged drawing of Figure 4b at low concentrations of A; (d) DPVs at varying concentrations of G in the presence of A (25 μM); (e) Plot of the oxidation peak currents versus different concentrations of G; (f) Local enlarged drawing of Figure 4e at low concentrations of G. The DPVs were operated at a pulse amplitude of 50 mV, pulse width of 50 ms and a scan rate of 50 mV/s, respectively.
Sensors 17 01652 g004
Figure 5. DPVs of G and A in the calf thymus DNA sample in 5 mL, pH 7.0 PBS (phosphate buffer solution) on NF/CHT-ARGO/GCE at a scan rate of 50 mV s−1.
Sensors 17 01652 g005
Table 1. Comparison of the performances of different chemically modified electrodes for the detection of DNA bases.
Working ElectrodeAnalyteDetection Limit (μM)Linear Range (μM)TechniqueReference
NF/CHT-ARGO/GCEA0.20.2–110DPVThis work
G0.10.1–120
GMC/GCEA0.6325-200DPV[15]
G0.7625–150
GS/IL/CHT/GCEA0.451.5–350DPV[17]
G0.752.5–150
Graphene-NF/GCEA0.758–150DPV[18]
G0.584–200
Nano-ZSM-5/ILA9.510–300DPV[20]
G4.810–300
TNFs/GONs/SPCEA1.71 × 10−30.1–10DPV[22]
G--
MWCNT-Fe3O4@PDA-Ag/CPEA5.6610–120DPV[23]
G1.478–130
PANI/MnO2/GCEA2.910–100DPV[38]
G4.810–100
ZnS-PEDOT-RGO/GC-RDEA0.1410.5–150DPV[39]
G0.1160.5–150
TAN-AgNP-PANT/CPEA2.81–200DPV[40]
G40.9–140
Pt–Pd/PSi–CNTPEA0.030.06–55.0DPV/AMP[41]
G0.010.04–53.4
GCE: glassy carbon electrode; NF: nafion; CHT: chitosan; GS: graphene sheets; IL: ionic liquid; GMC: graphitized mesoporous carbon; PANI: polyaniline; PEDOT: poly (3,4-ethylenedioxythiophene); GC-RDE: glassy carbon-rotating disk electrode; PSi–CNTPE: mixing of Nujol oil, graphite powder, MWCNTs and polycrystalline Si powder; TNFs: titanium dioxide nanofibers; GONs: graphene oxide nanosheets; SPCE: screen-printed carbon electrode; TAN-AgNP-PANT/CPE: 1,3,5-Trithiane-Ag-nanoparticles decorated polyaniline nanofibers; PDA: polydopamine; MWCNT: multi-walled carbon nanotube; DPV: differential pulse voltammetry; AMP: amperometry.
Table 2. Influence of interferences in the determination of G and A.
Signal ChangeUric AcidGlucoseAscorbic AcidVitamin B1Vitamin B2L-LysineGlycine
A101.6%101.5%101.8%104.0%99.3%102.3%103.6%
G102.2%97.2%101.3%95.9%96.6%102.6%97.3%
The experiments were carried out in 5.0 mL, 50 mM, pH 7.0 PBS containing 20 μM G and 25 μM A, using DPVs of NF/CHT-ARGO/GCE. The concentrations of the interferences were 200 μM.

