
Mechanomyography and Torque during FES-Evoked Muscle Contractions to Fatigue in Individuals with Spinal Cord Injury

Abstract
:1. Introduction
2. Materials and Methods
2.1. Subjects
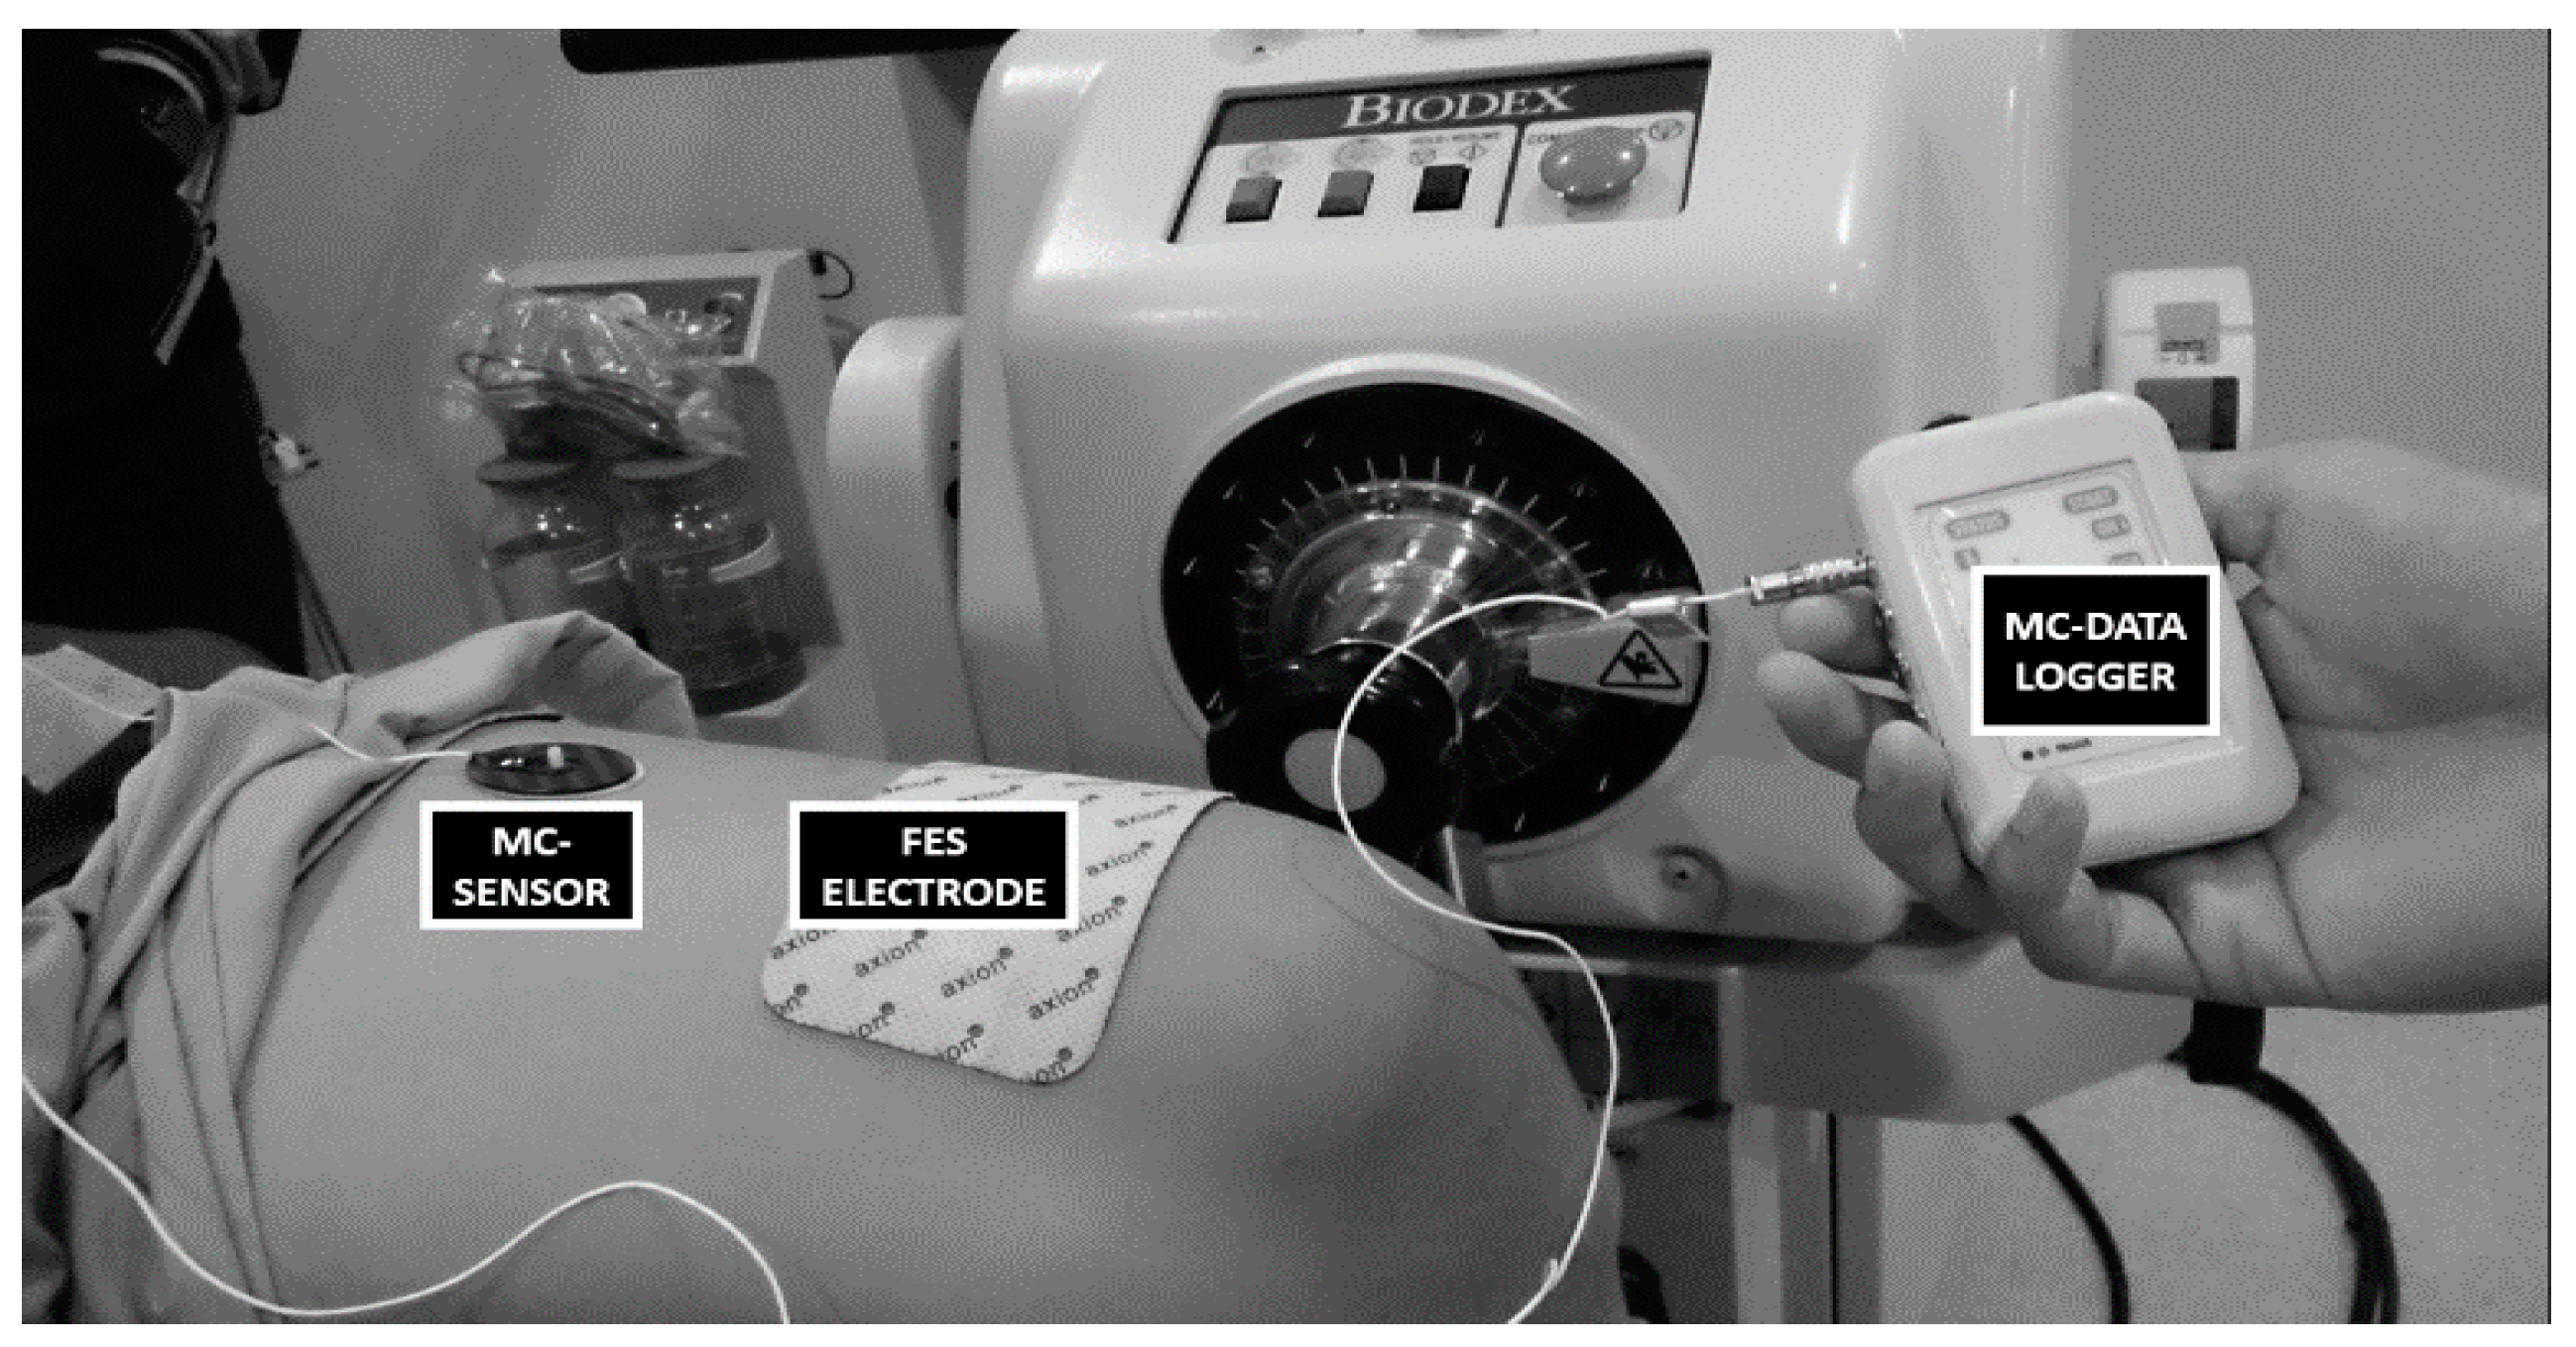
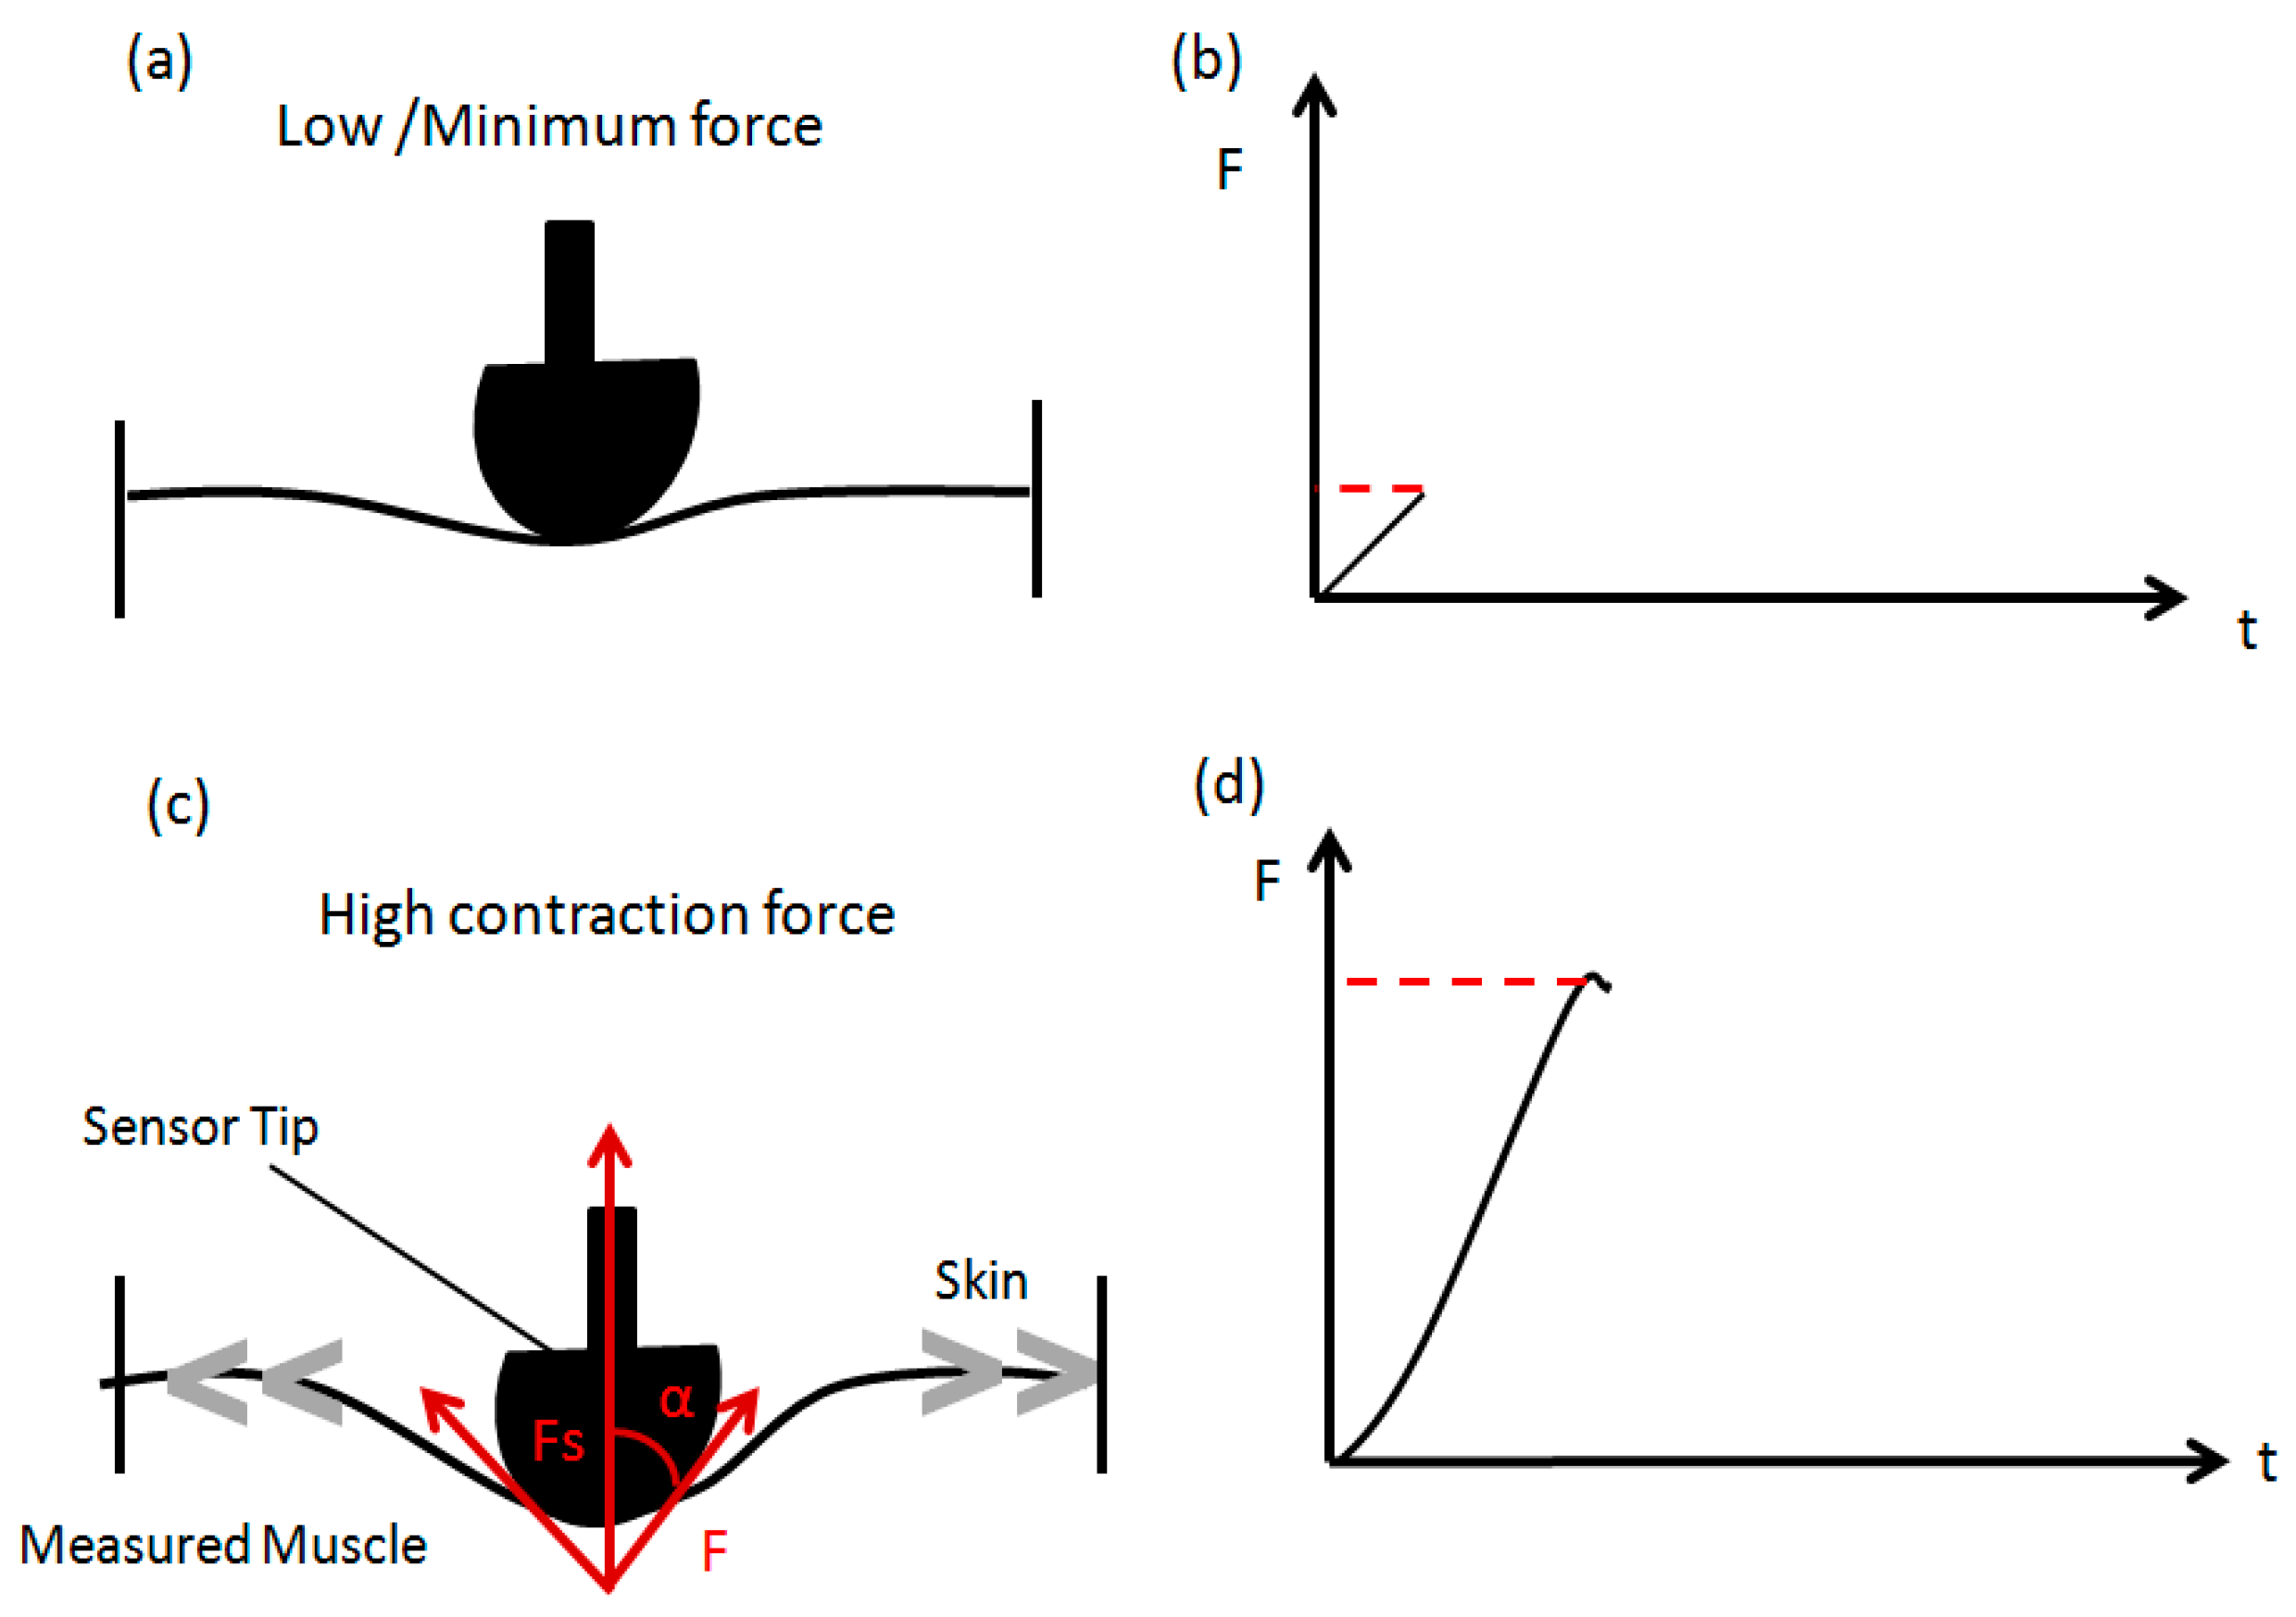
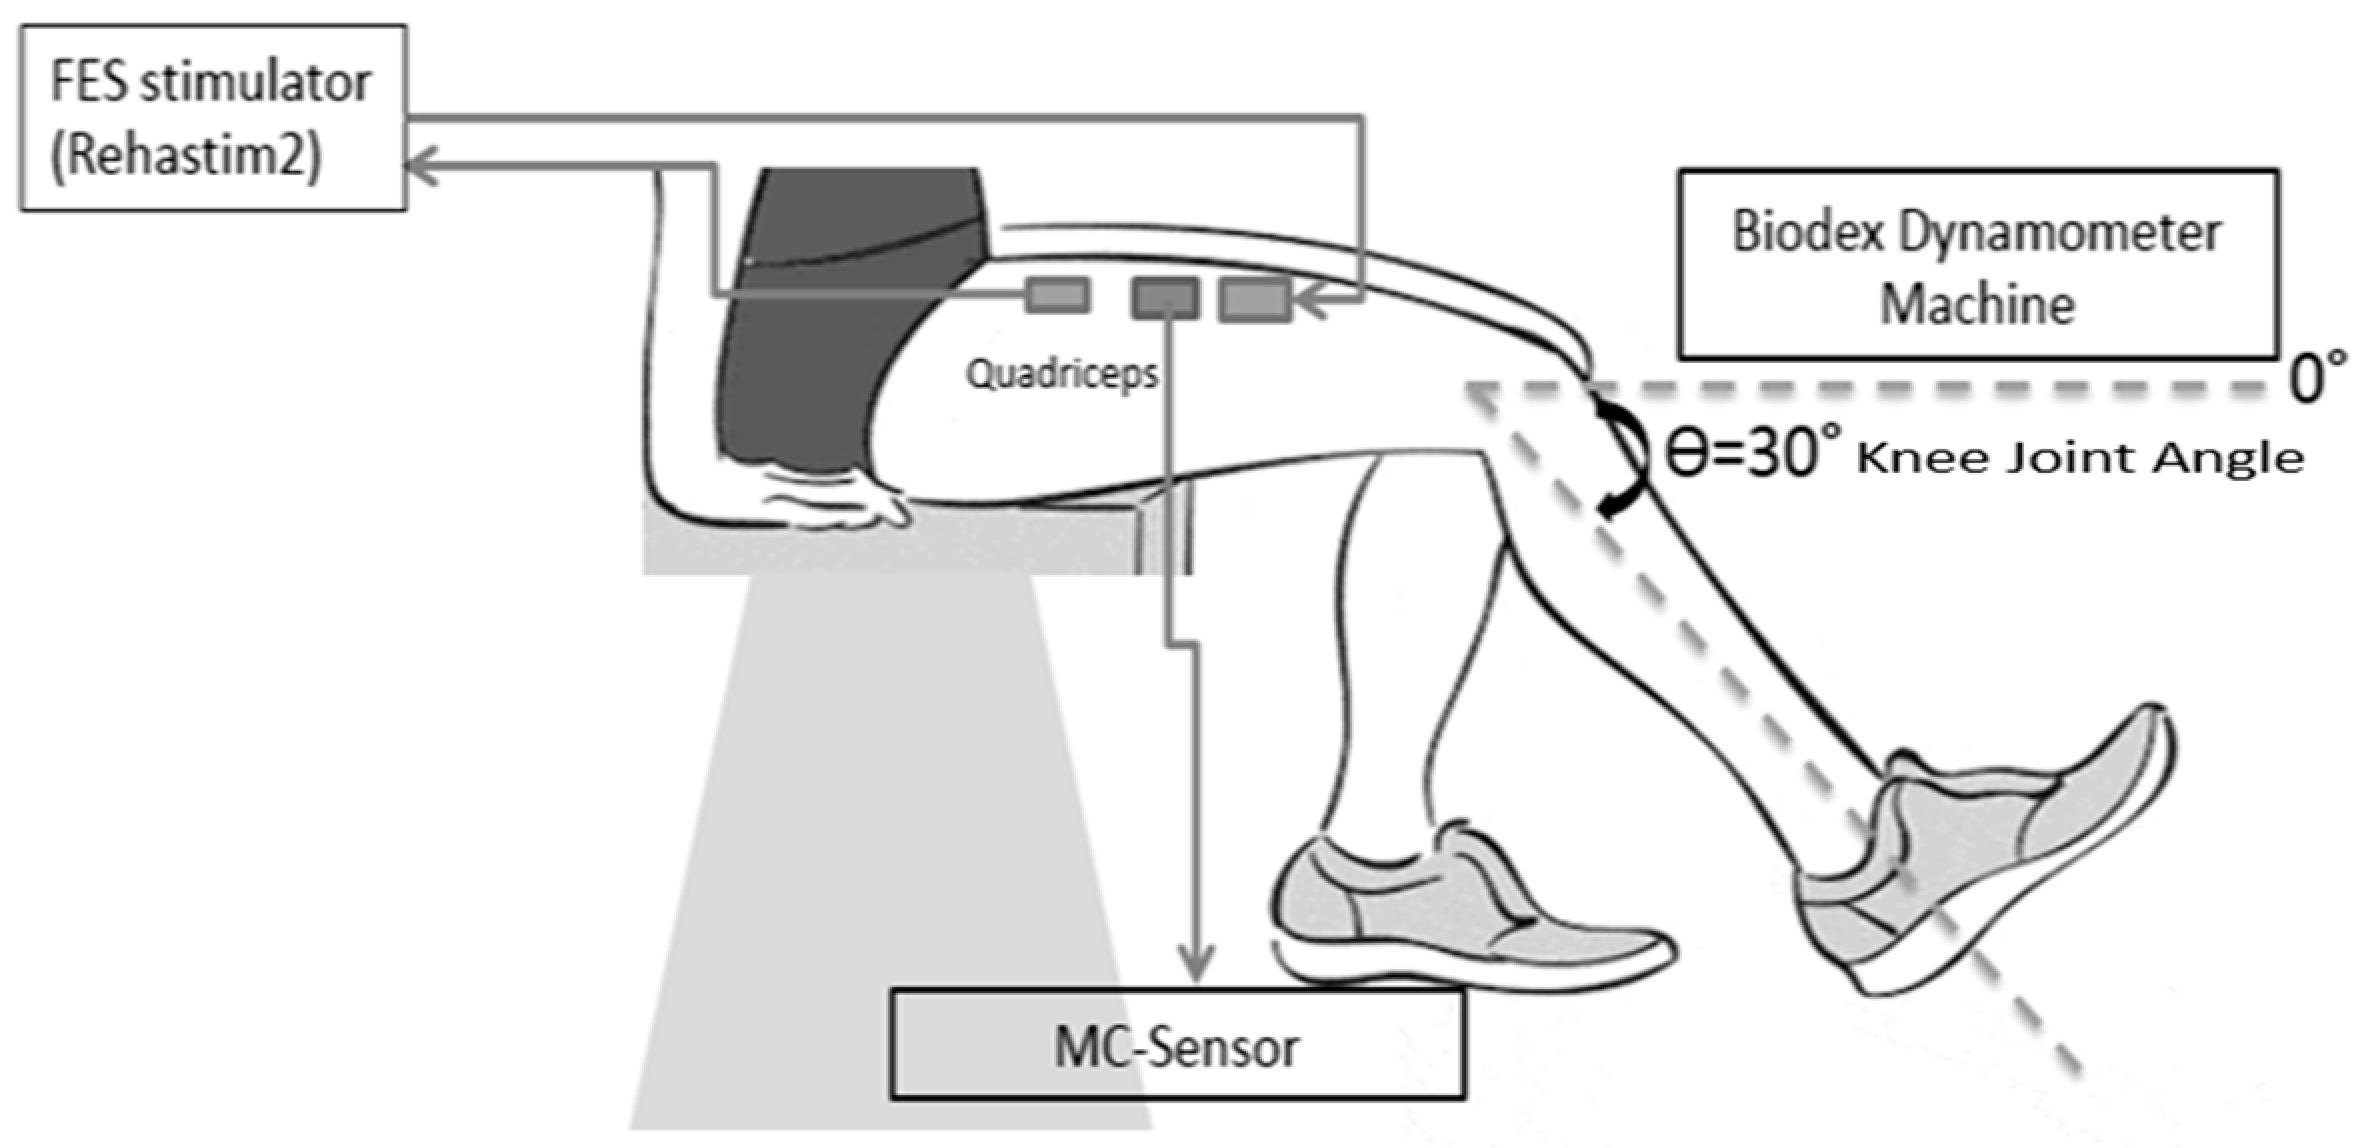
2.2. Instrumentation
2.3. Experimental Protocol
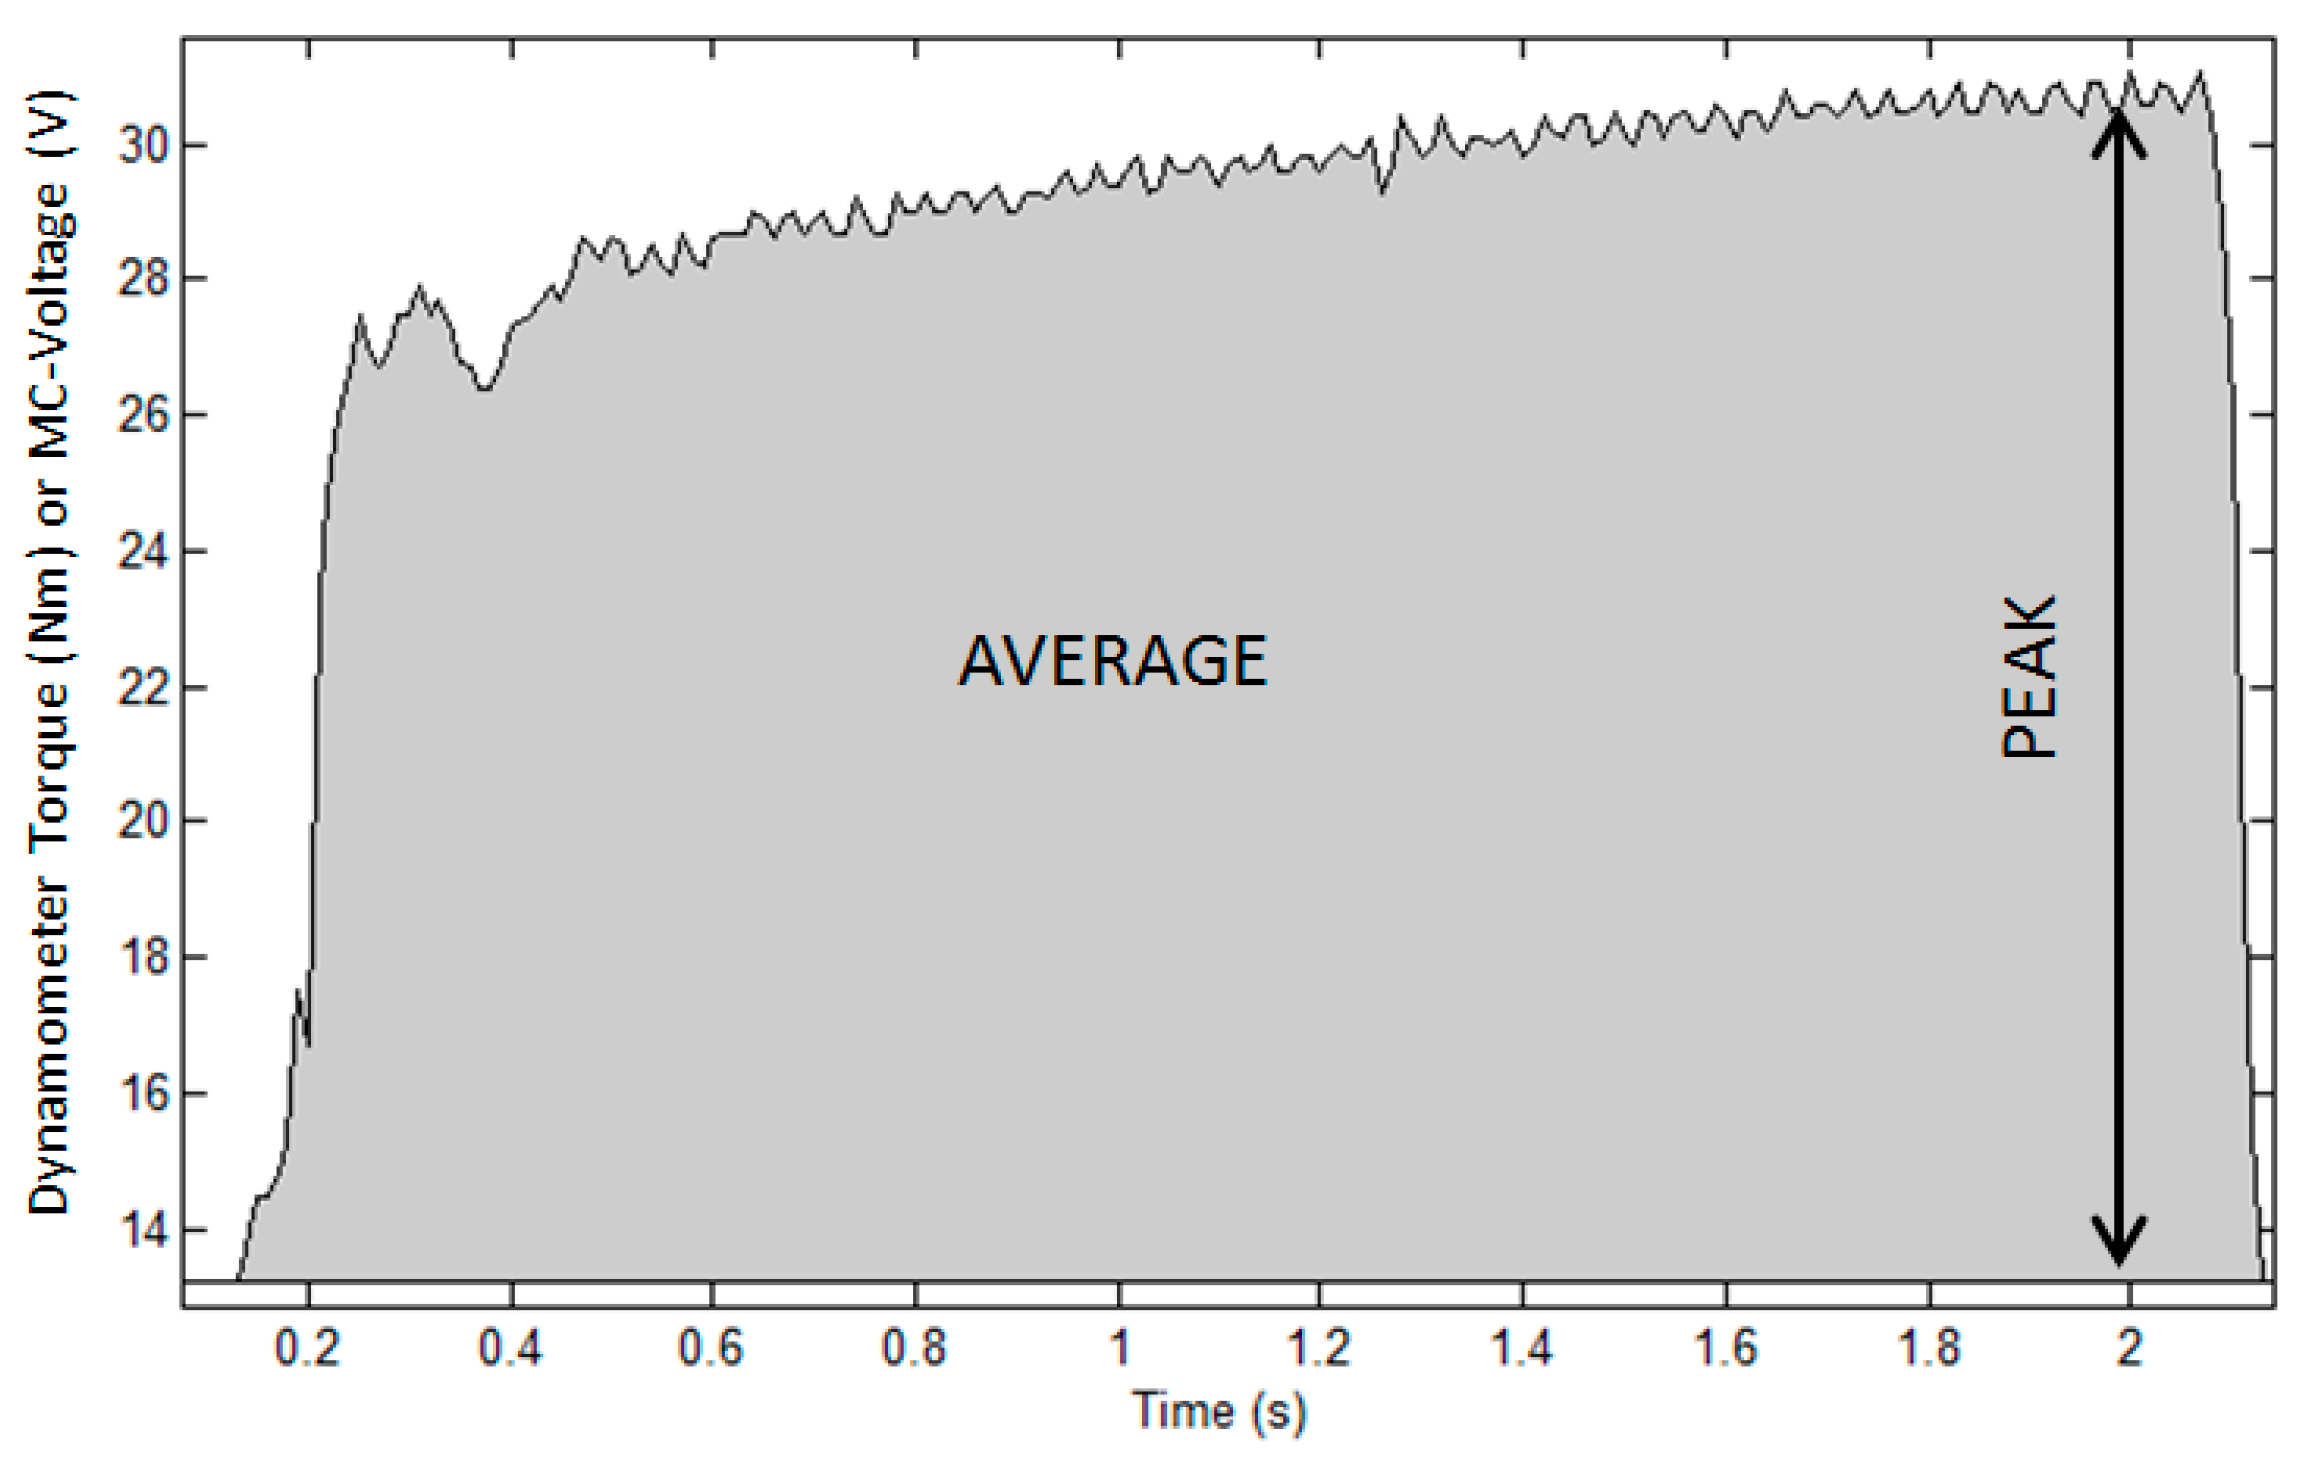
2.3.1. Part 1: Muscle Performance Trial
- T = dynamometer torque (N·m)
- β0 = y-intercept
- β1 = slope of the line
- MC = sensor output (V)
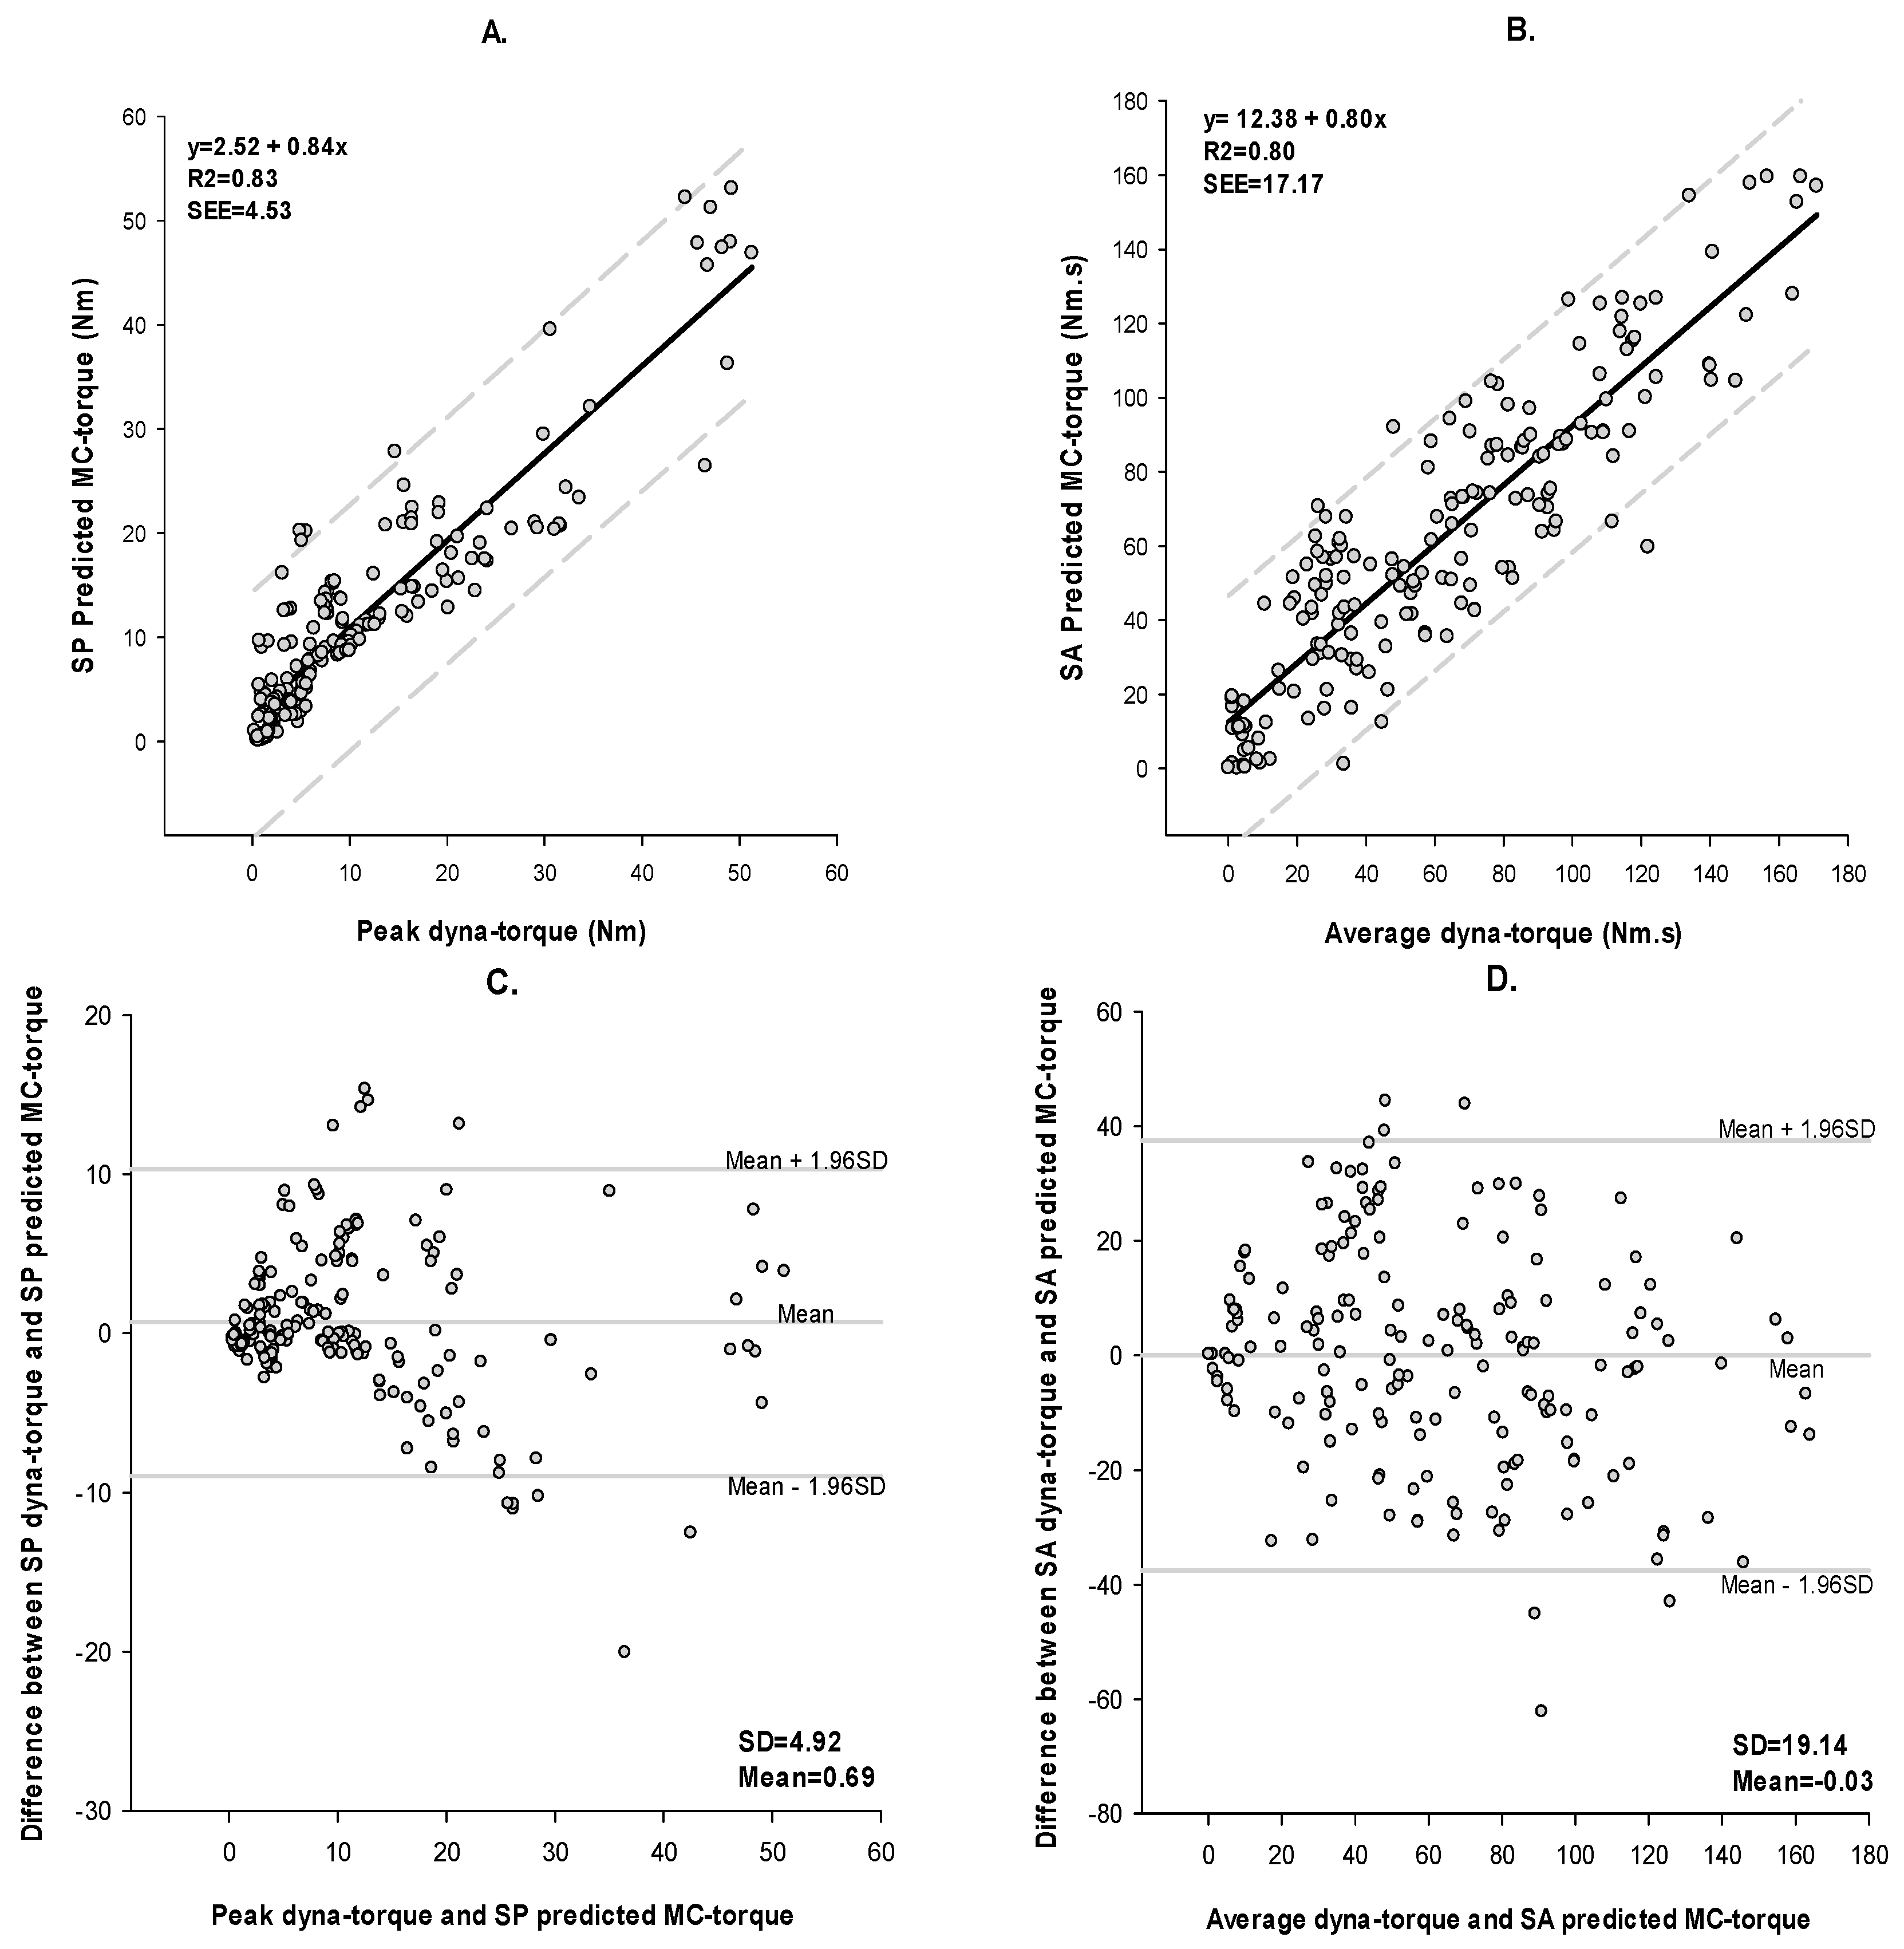
- SP = Signal Peak
- SA = Signal Average
2.3.2. Part 2: Muscle Fatigue Trial
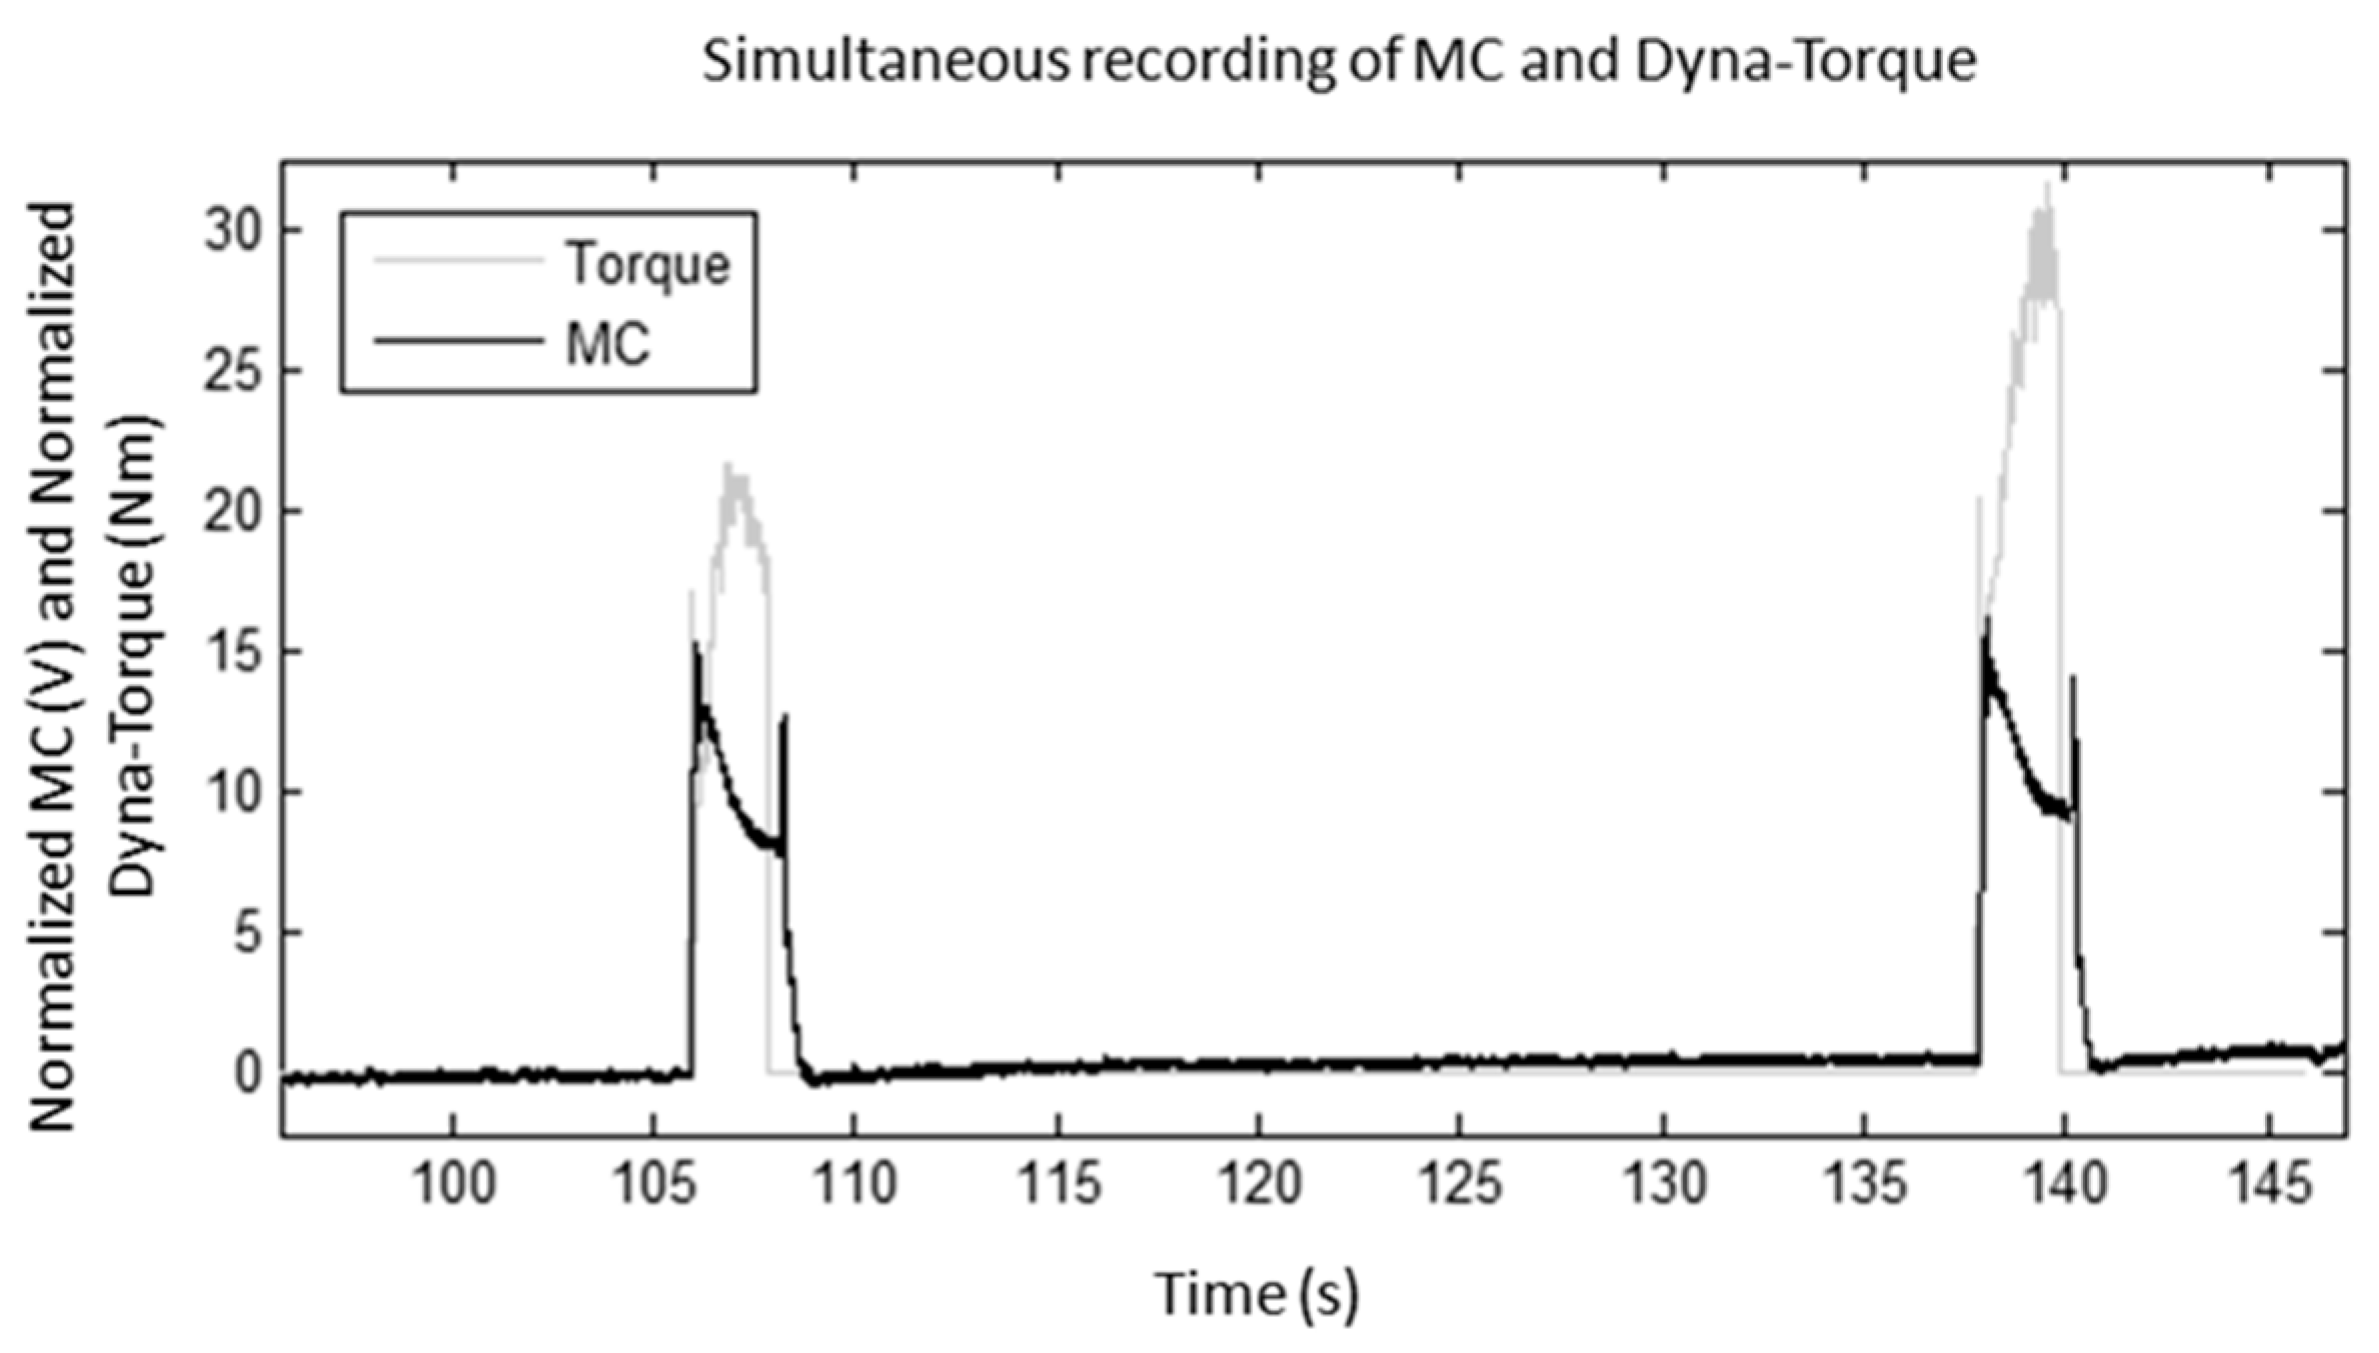
2.4. Data Analysis
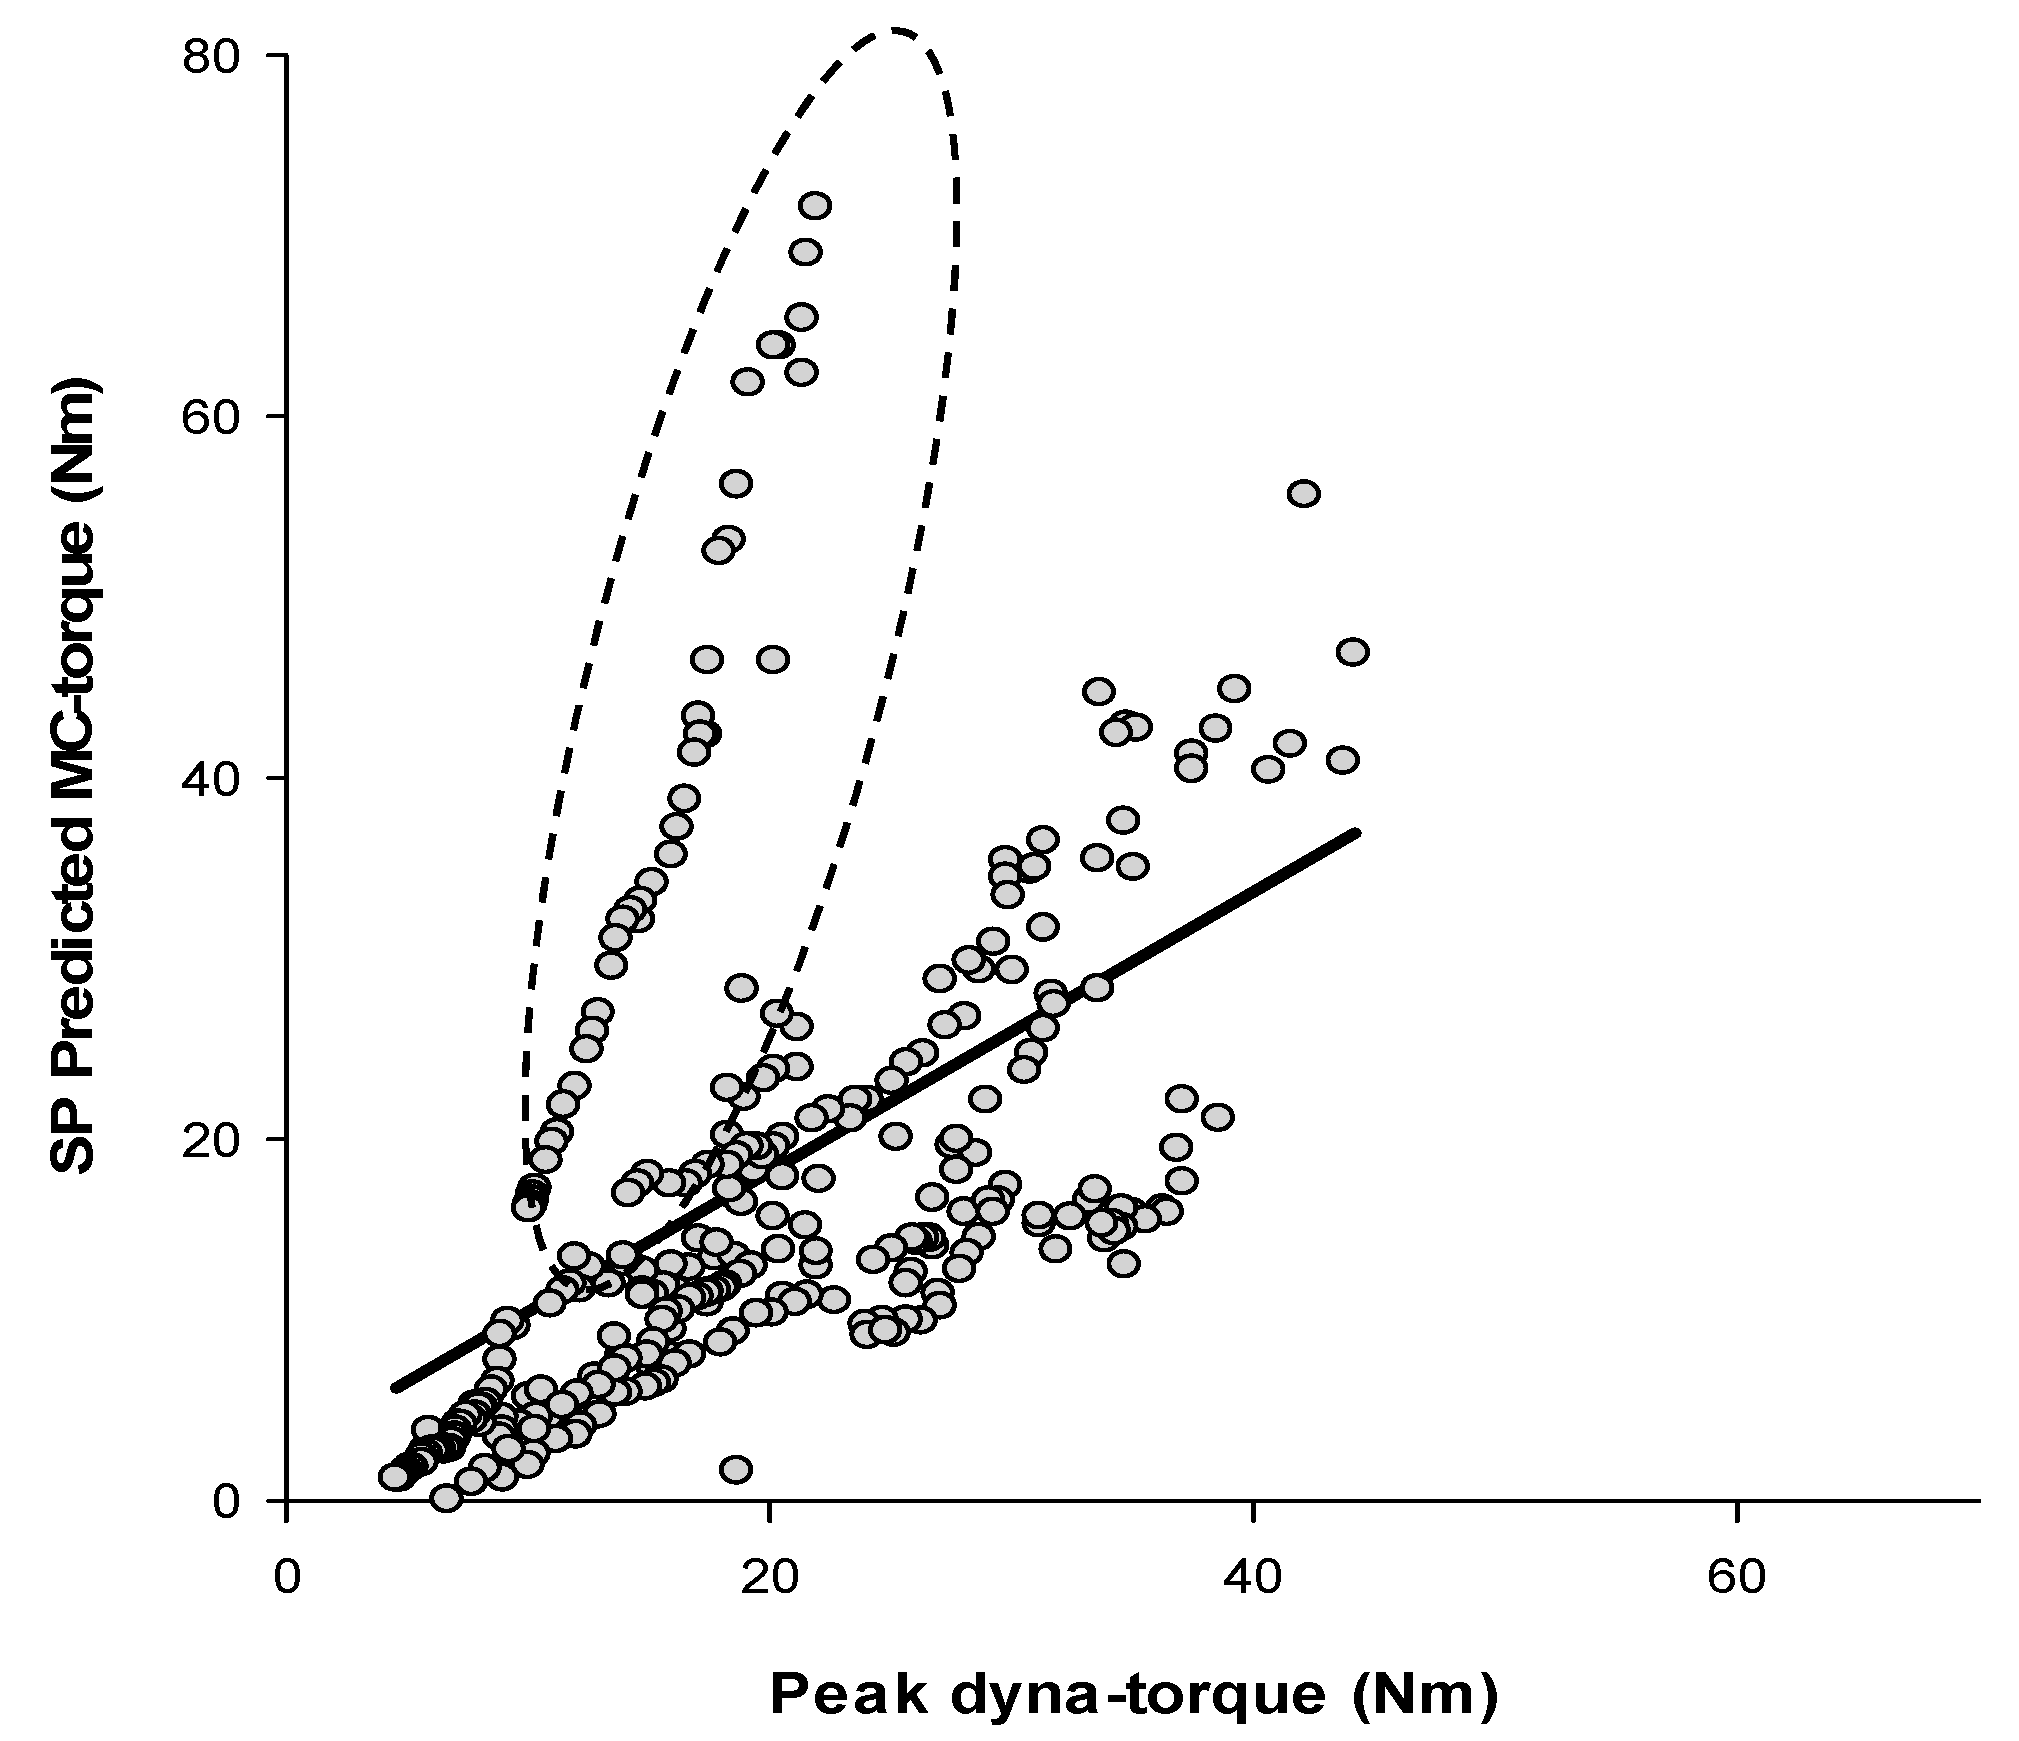
3. Results
3.1. Muscle Performance
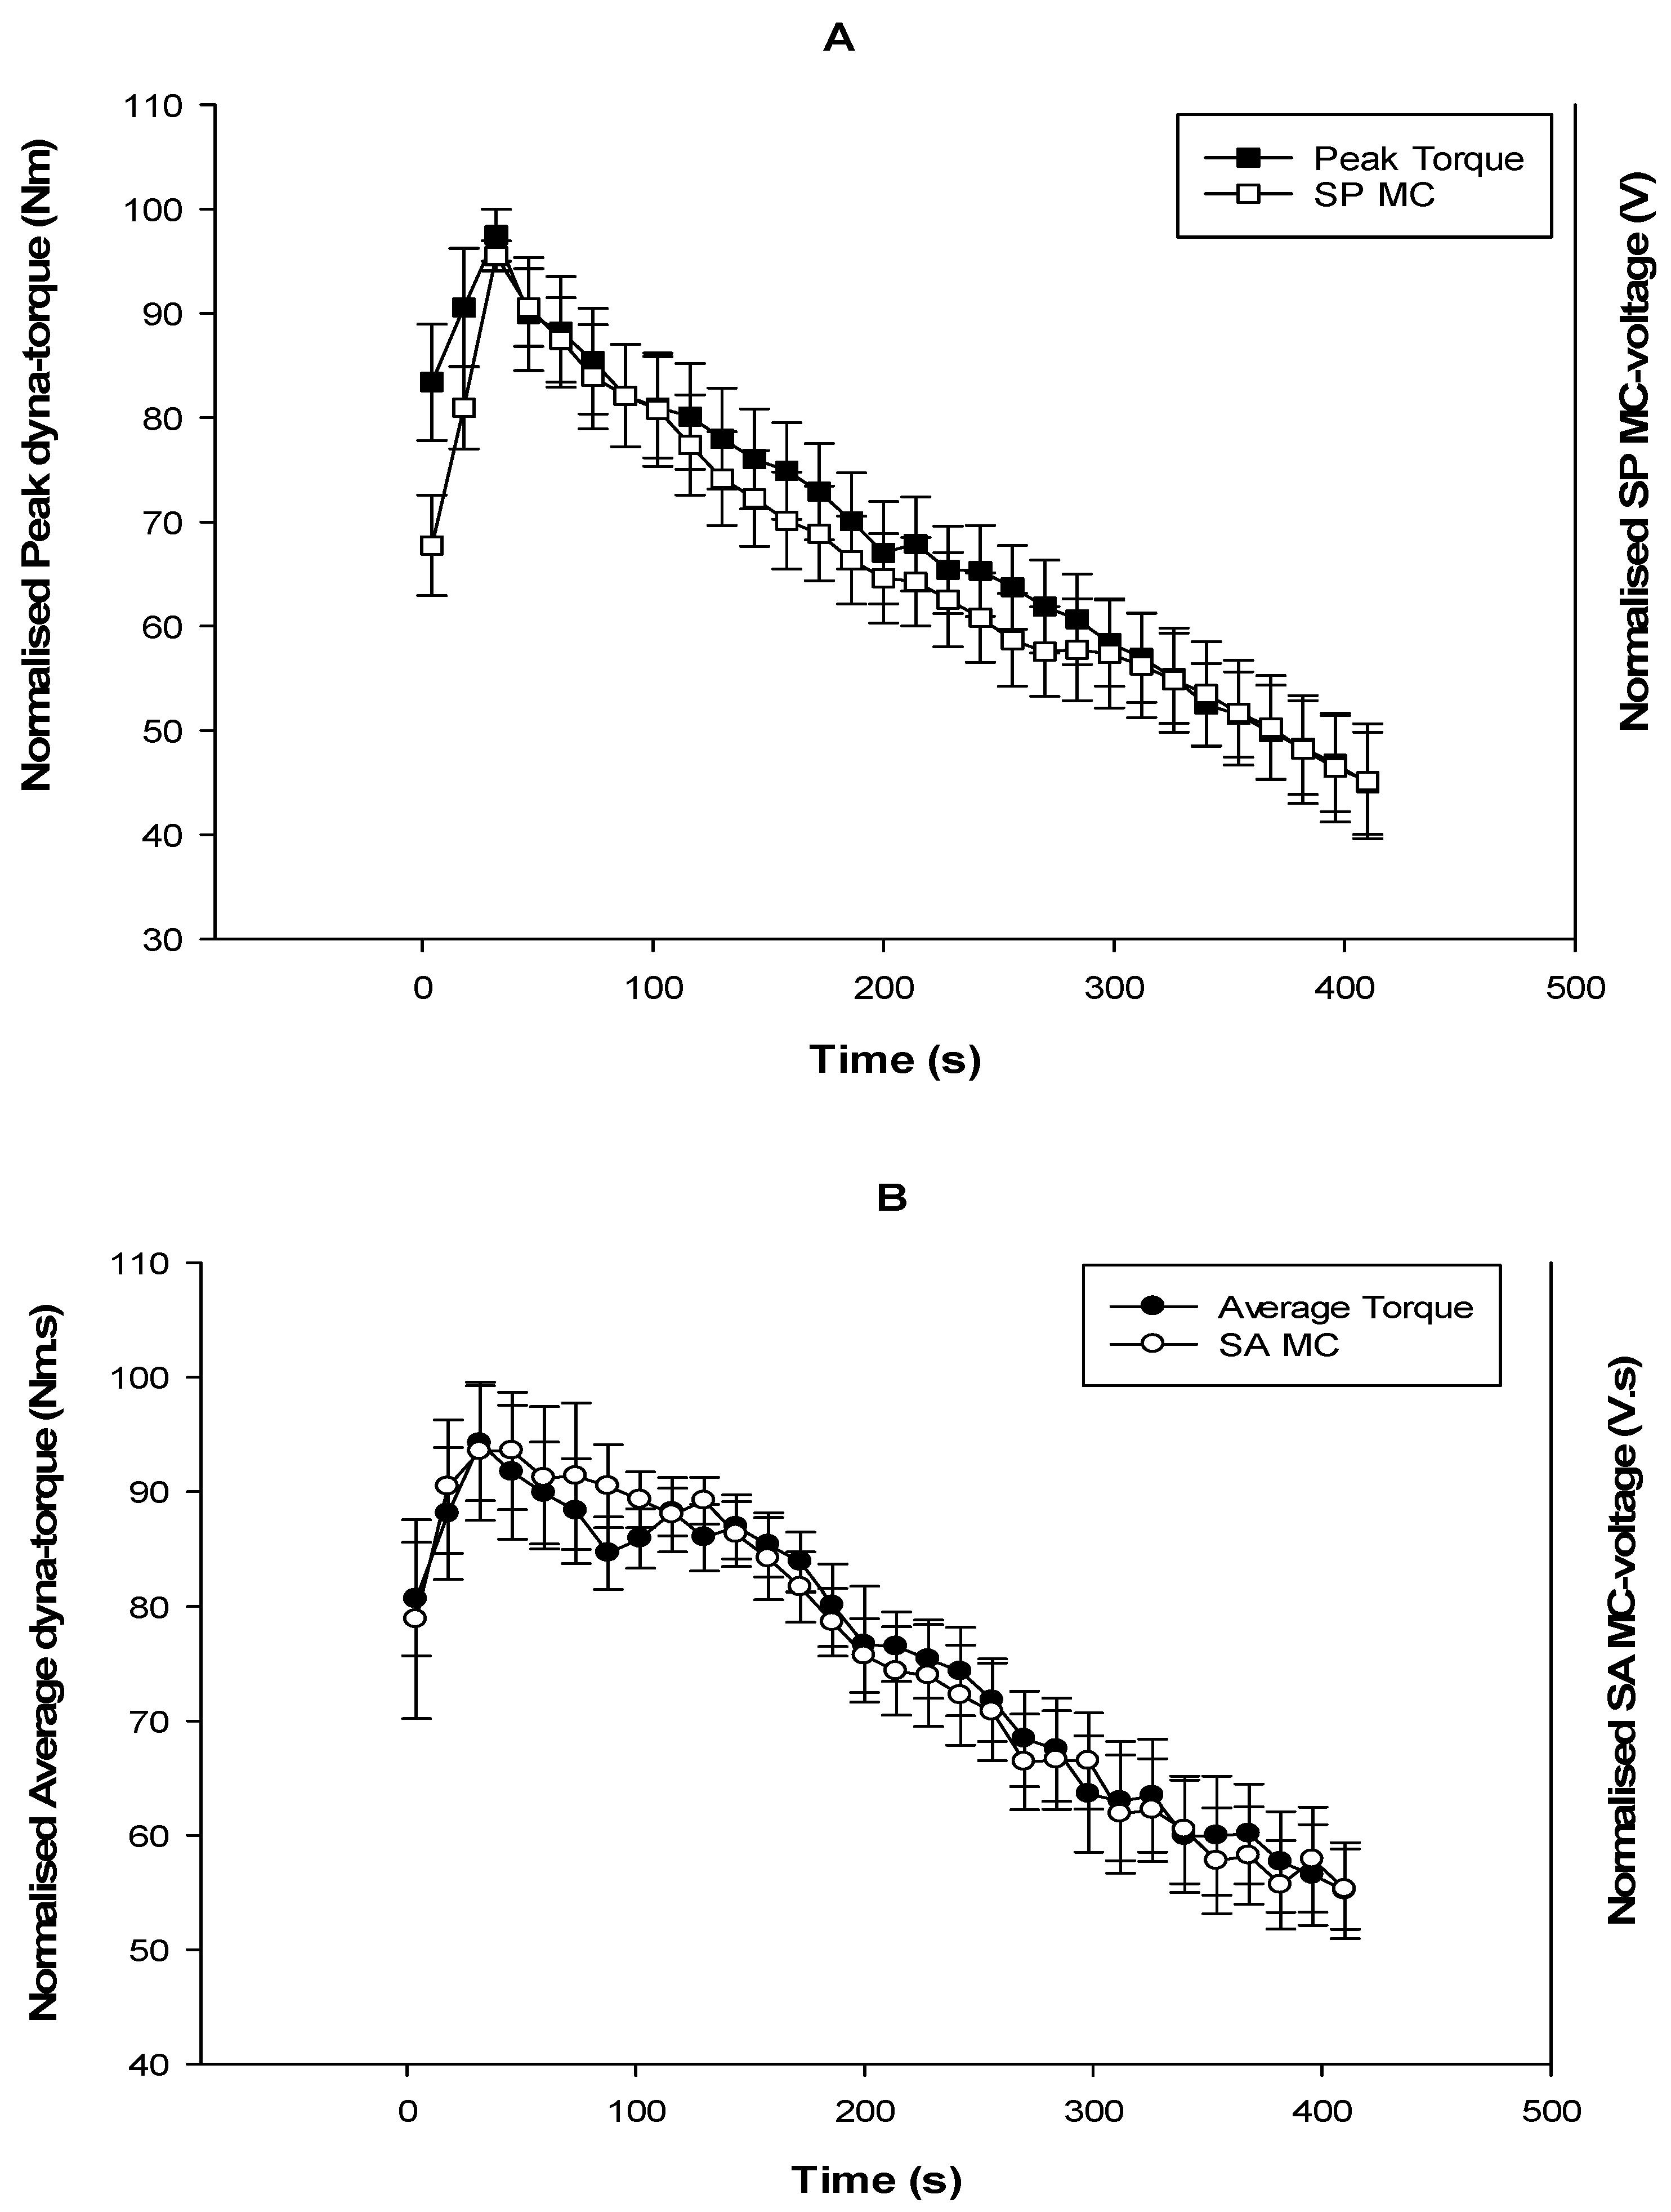
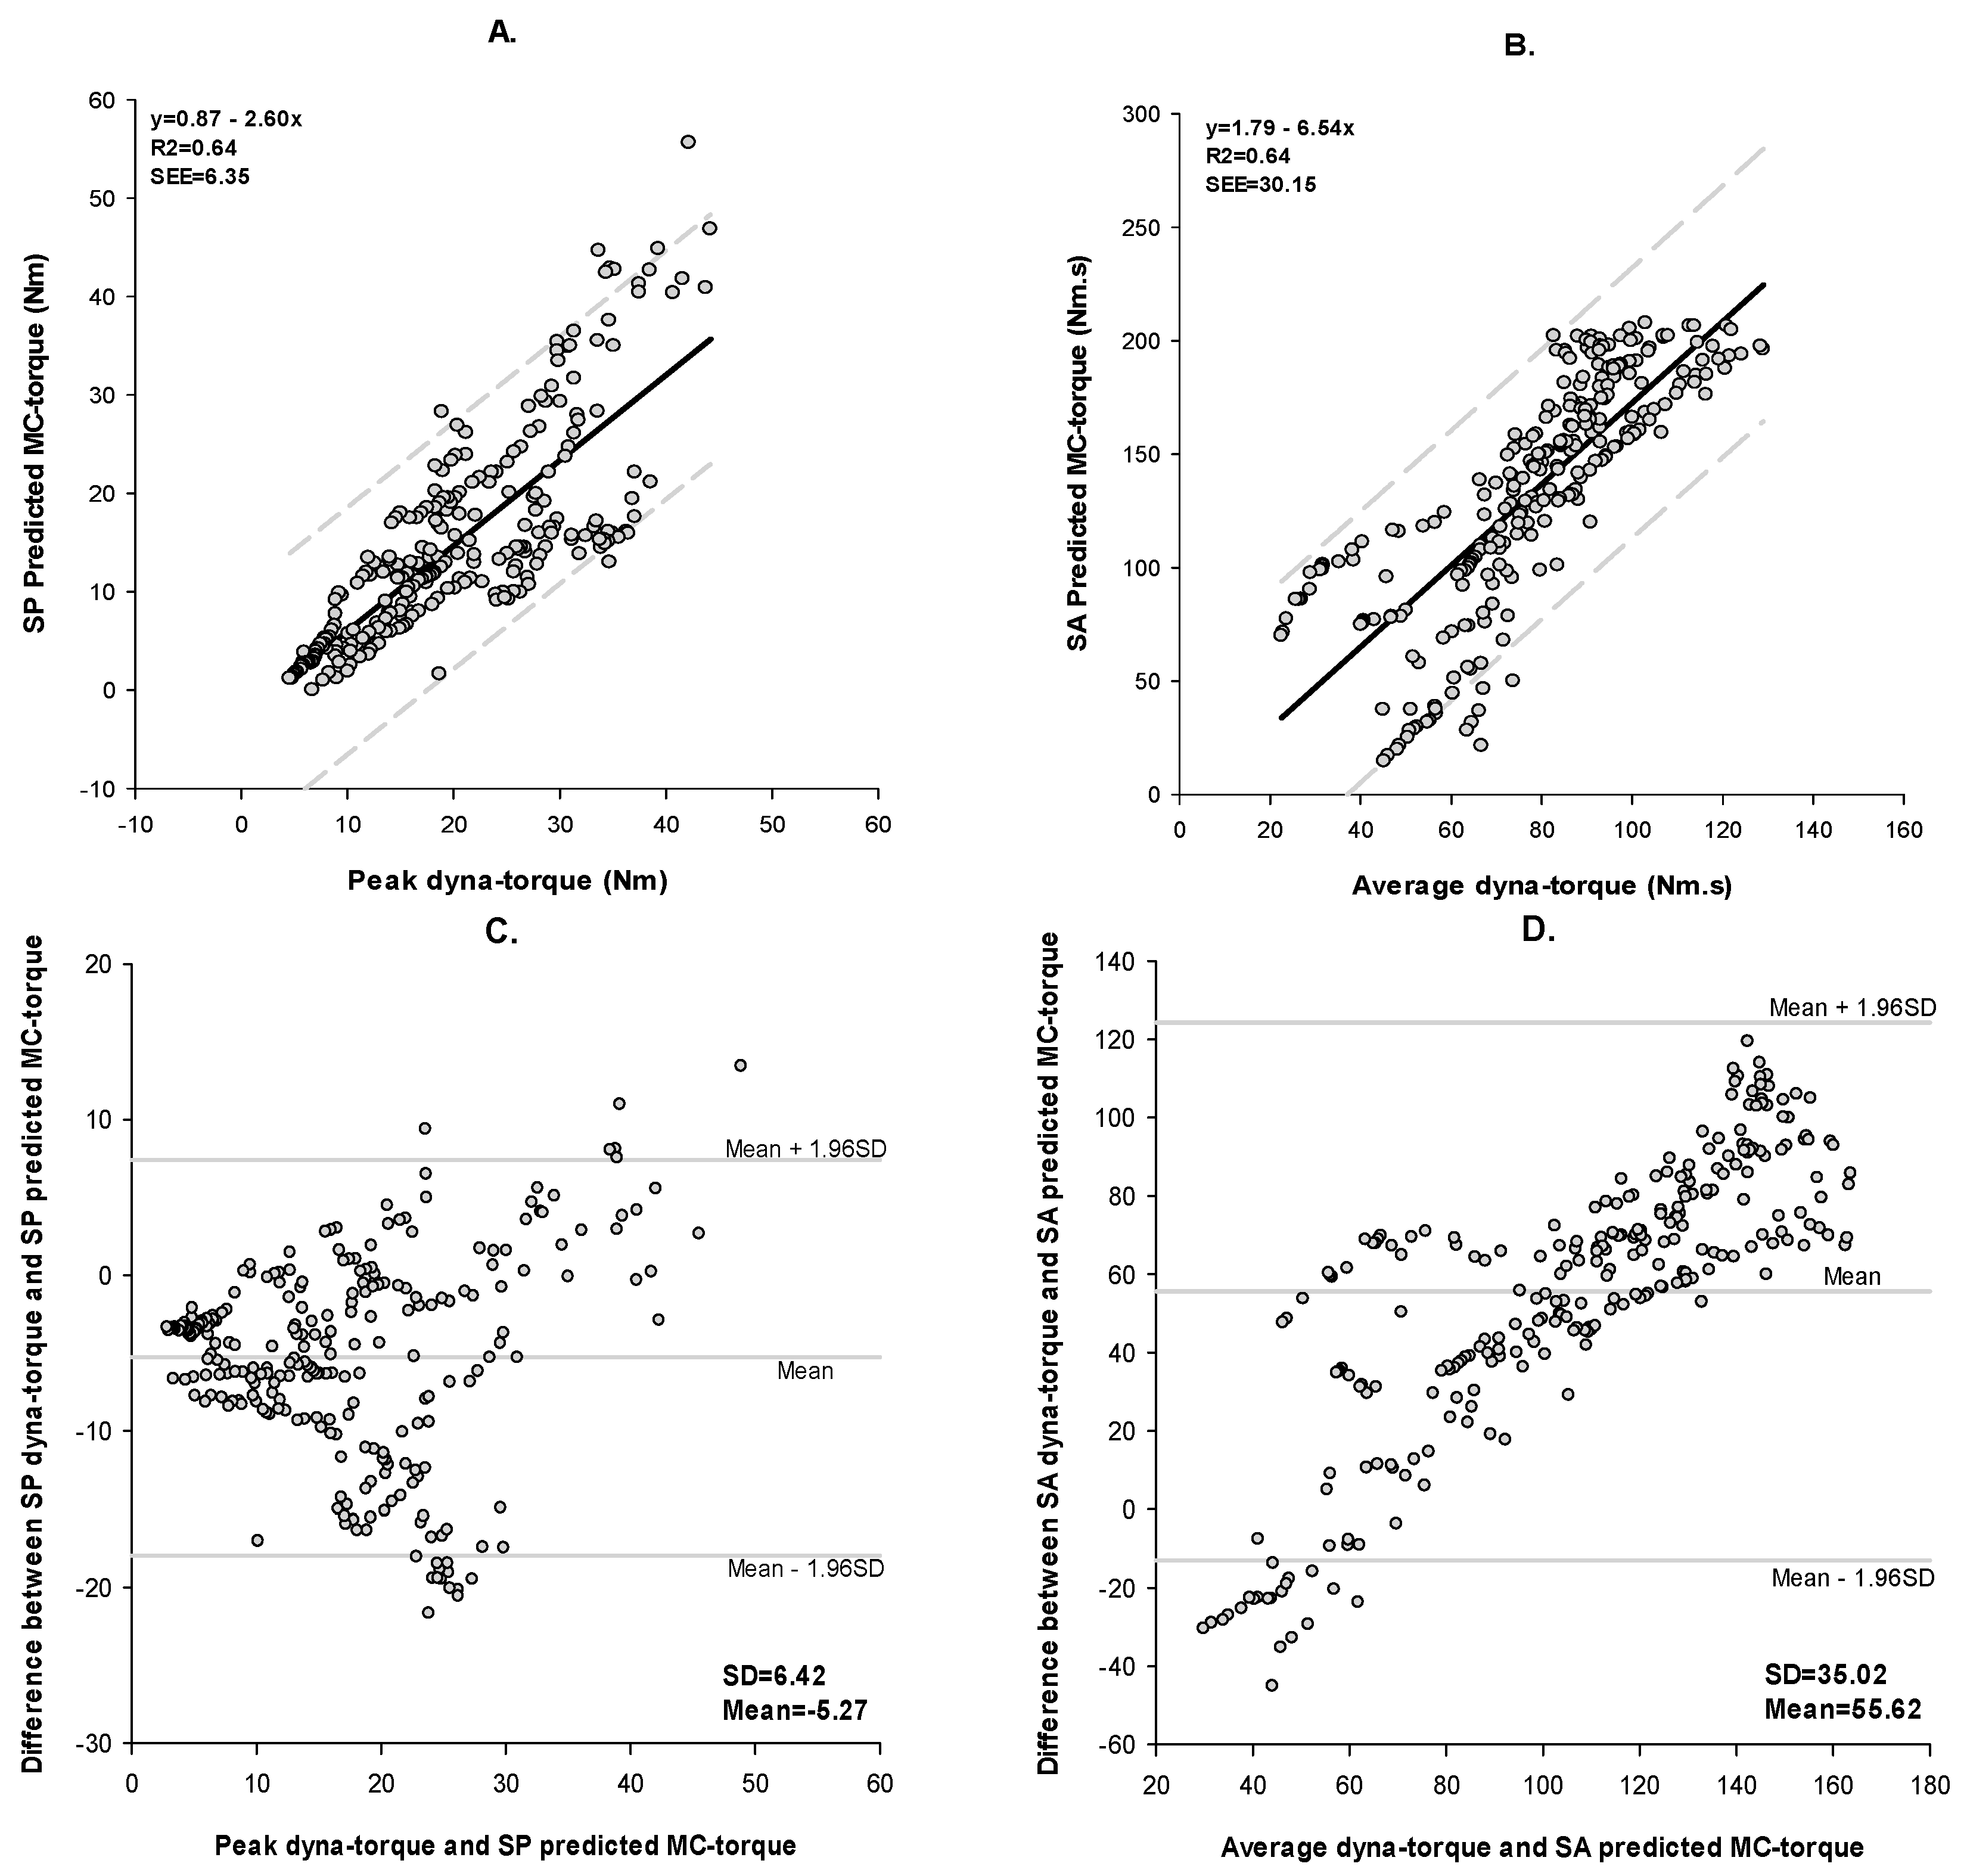
3.2. Fatigue
4. Discussion
4.1. Method of Validation
4.2. Method of Agreement: Bland-Altman
4.3. Mean Absolute Percentage Error (MAPE)
5. Conclusions
Acknowledgments
Author Contributions
Conflicts of Interest
References
- Rushton, D.N. Functional electrical stimulation. Physiol. Meas. 1997, 18, 241–275. [Google Scholar] [CrossRef] [PubMed]
- Estigoni, E.H.; Fornusek, C.; Hamzaid, N.A.; Hasnan, N.; Smith, R.M.; Davis, G.M. Evoked EMG versus Muscle Torque during Fatiguing Functional Electrical Stimulation-Evoked Muscle Contractions and Short-Term Recovery in Individuals with Spinal Cord Injury. Sensors 2014, 14, 22907–22920. [Google Scholar] [CrossRef] [PubMed]
- Karu, Z.; Durfee, W.; Barzilai, A. Reducing muscle fatigue in FES applications by stimulating with N-let pulse trains. IEEE Trans. Biomed. Eng. 1995, 42, 809–817. [Google Scholar] [CrossRef] [PubMed]
- Stokes, M.; Cooper, R. Muscle fatigue as a limiting factor in functional electrical stimulation: A review. Physiother. Pract. 1989, 5, 83–90. [Google Scholar] [CrossRef]
- Hayashibe, M.; Zhang, Q.; Guiraud, D.; Fattal, C. Evoked EMG-based torque prediction under muscle fatigue in implanted neural stimulation. J. Neural Eng. 2011, 8, 064001. [Google Scholar] [CrossRef] [PubMed]
- Hammell, K.; Miller, W.; Forwell, S.; Forman, B.; Jacobsen, B. Managing fatigue following spinal cord injury: A qualitative exploration. Disabil. Rehabil. 2009, 31, 1437–1445. [Google Scholar] [CrossRef] [PubMed]
- Zhang, Q.; Hayashibe, M.; Fraisse, P.; Guiraud, D. FES-Induced Torque Prediction with Evoked EMG Sensing for Muscle Fatigue Tracking. In Proceedings of the International Conference of the IEEE Engineering in Medicine and Biology Society, Buenos Aires, Argentina, 1–4 September 2010. [Google Scholar]
- Faller, L.; Nogueira Neto, G.N.; Button, V.L.S.N.; Nohama, P. Muscle fatigue assessment by mechanomyography during application of NMES protocol. Braz. J. Phys. Ther. 2009, 13, 422–429. [Google Scholar] [CrossRef]
- Enoka, R.M.; Duchateau, J. Muscle fatigue: What, why and how it influences muscle function. J. Physiol. 2008, 586, 11–23. [Google Scholar] [CrossRef] [PubMed]
- Chesler, N.C.; Durfee, W.K. Surface EMG as a Fatigue Indicator During FES-induced Isometric Muscle Contractions. J. Electromyogr. Kinesiol. 1997, 7, 27–37. [Google Scholar] [CrossRef]
- Mizrahi, J.; Levy, M.; Ring, H.; Isakov, E.; Liberson, A. EMG as an indicator of fatigue in isometrically FES-activated paralyzed muscles. Rehabil. Eng. 1994, 2, 57–65. [Google Scholar] [CrossRef]
- Yoshitake, Y.; Moritani, T.; Miyazaki, M.; Ue, H. Assessment of lower-back muscle fatigue using electromyography, mechanomyography, and near-infrared spectroscopy. Eur. J. Appl. Physiol. 2001, 84, 174–179. [Google Scholar] [CrossRef] [PubMed]
- Tarata, M.T. Mechanomyography versus Electromyography, in monitoring the muscular fatigue. BioMed. Eng. OnLine 2003, 2. [Google Scholar] [CrossRef]
- Ibitoye, M.O.; Hamzaid, N.A.; Zuniga, J.M. Mechanomyography and muscle function assessment: A review of current state and prospects. Clin. Biomech. 2014, 29, 691–704. [Google Scholar] [CrossRef] [PubMed]
- Viitasalo, J.H.T.; Komi, P.V. Signal Characteristics of EMG during Fatigue. Eur. J. Appl. Physiol. Occup. Physiol. 1977, 37, 111–121. [Google Scholar] [CrossRef] [PubMed]
- Đorđević, S.; Stančin, S.; Meglič, A.; Milutinović, V.; Tomažič, S. MC Sensor—A Novel Method for Measurement of Muscle Tension. Sensors 2011, 11, 9411–9425. [Google Scholar] [CrossRef] [PubMed]
- Đorđević, S.; Tomažič, S.; Narici, M.; Pišot, R.; Meglič, A. In-Vivo Measurement of Muscle Tension: Dynamic Properties of of the MC Sensor during Isometric Muscle Contraction. Sensors 2014, 14, 17848–17863. [Google Scholar] [CrossRef] [PubMed]
- Ng, M.Y.; Pourmajidian, M.; Hamzaid, N. Mechanomyography Sensors for Detection of Muscle Activities and Fatigue during Fes-Evoked Contraction. In Proceedings of the 19th International Functional Electrical Stimulation Society Annual Conference (IFESS), Kuala Lumpur, Malaysia, 17–19 September 2014. [Google Scholar]
- Verhaagen, J.; McDonald, J.W. Spinal Cord Injury; Elsevier: Sydney, Australia, 2012. [Google Scholar]
- Kirshblum, S.C.; Burns, S.P.; Biering-Sørensen, F.; Donovan, W.; Graves, D.E.; Jha, A.; Johansen, M.; Jones, L.; Krassioukov, A.; Mulcahey, M.J.; et al. International Standards for Neurological Classification of Spinal Cord Injury (Revised 2011). J. Spinal Cord Med. 2011, 34, 535–546. [Google Scholar] [CrossRef] [PubMed]
- Thrasher, T.; Graham, G.M.; Popovic, M.R. Attempts to reduce muscle fatigue by randomizing FES parameters. In Proceedings of the 8th Vienna Workshop on Functional Electrical Stimulation, Vienna, Austria, 10–13 September 2004. [Google Scholar]
- Dugan, S.; Frontera, W. Muscle fatigue and muscle injury. Phys. Med. Rehabil. Clin. North Am. 2000, 11, 385–403. [Google Scholar]
- Tarata, M.; Spaepen, A.; Puers, R. The accelerometer MMG measurement approach, in monitoring the muscular fatigue. Meas. Sci. Rev. 2001, 1, 47–50. [Google Scholar]
- Ibitoye, M.O.; Hamzaid, N.A.; Abdul Wahab, A.K.; Hasnan, N.; Olatunji, S.O.; Davis, G.M. OAM Estimation of Electrically-Evoked Knee Torque from Mechanomyography Using Support Vector Regression. Sensors 2016, 16, 1115. [Google Scholar] [CrossRef] [PubMed]
- Phinyomark, A.; Thongpanja, S.; Hu, H.; Phukpattaranont, P.; Limsaku, C. The Usefulness of Mean and Median Frequencies in Electromyography Analysis. In Computational Intelligence in Electromyography Analysis—A Perspective on Current Applications and Future Challenges; In Tech: Kwun Tong, China, 2012; pp. 195–220. [Google Scholar]
- Bland, J.; Altman, D. Statistical methods for assessing agreement between two methods of clinical measurement. Lancet 1986, 1, 307–310. [Google Scholar] [CrossRef]
- Bland, J.; Altman, D. Applying the Right Statistics: Analyses of Measurement Studies. Ultrasound Obstet. Gynecol. 2003, 22, 85–93. [Google Scholar]
- Ibitoye, M.O.; Hamzaid, N.A.; Hasnan, N.; Abdul Wahab, A.K.; Islam, M.A.; Kean, V.S.; Davis, G.M. Torque and mechanomyogram relationships during electrically-evoked isometric quadriceps contractions in person with spinal cord injury. Med. Eng. Phys. 2016, 38, 767–775. [Google Scholar] [CrossRef] [PubMed]
- Al-Mulla, M.R.; Sepulveda, F.; Colley, M. A Review of Non-Invasive Techniques to Detect and Predict Localised Muscle Fatigue. Sensors 2011, 11, 3546–3594. [Google Scholar] [CrossRef] [PubMed]
- Ibitoye, M.O.; Hamzaid, N.A.; Zuniga, J.M.; Hasnan, N.; Abdul Wahab, A.K. Mechanomyograhic Parameter Extraction Methods: An Appraisal for Clinical Applications. Sensors 2014, 14, 22940–22970. [Google Scholar] [CrossRef] [PubMed]


| Subject | Age (year) | Gender | Height (m) | Body Weight (kg) | Spinal Lesion Level | Injury Classification (AIS *) | Years Since Injury (year) |
|---|---|---|---|---|---|---|---|
| 1 | 28 | M | 1.71 | 62.4 | C7 | B | 14 |
| 2 | 35 | M | 1.61 | 81.0 | T10–T11 | A | 18 |
| 3 | 59 | M | 1.79 | 71.6 | C6–C7 | B | 2.5 |
| 4 | 47 | F | 1.62 | 82.0 | T4 | B | 24 |
| 5 | 58 | M | 1.73 | 80.0 | C5–C7 | B | 4 |
| 6 | 33 | M | 1.71 | 44.0 | C5–C6 | A | 13 |
| 7 | 59 | M | 1.72 | 60.5 | T10–T11 | A | 13 |
| 8 | 34 | M | 1.70 | 75.9 | C6 | A | 17 |
| 9 | 21 | F | 1.60 | 48.0 | T10 | B | 1 |
| Session | 1 | 2 | 3 | 4 | 5 | |
|---|---|---|---|---|---|---|
| Set | ||||||
| 1 | 70 | 80 | 90 | 100 | 110 | |
| 2 | 80 | 90 | 100 | 110 | 70 | |
| 3 | 90 | 100 | 110 | 70 | 80 | |
| 4 | 100 | 110 | 70 | 80 | 90 | |
| 5 | 110 | 70 | 80 | 90 | 100 | |
| Experiment Outcome | N | p | R2 | SEE | Bland-Altman Bias | ρC | MAPE |
|---|---|---|---|---|---|---|---|
| Performance | |||||||
| SP | 225 | <0.0001 | 83% | 4.53 | 0.69 | 0.91 | 70% |
| SA | 225 | <0.0001 | 80% | 17.17 | −0.03 | 0.89 | 70% |
| Fatigue | |||||||
| SP | 304 | <0.0001 | 64% | 6.35 | −5.27 | 0.70 | 49% |
| SA | 304 | <0.0001 | 64% | 30.15 | 55.62 | 0.30 | 77% |
© 2017 by the authors. Licensee MDPI, Basel, Switzerland. This article is an open access article distributed under the terms and conditions of the Creative Commons Attribution (CC BY) license (http://creativecommons.org/licenses/by/4.0/).
Share and Cite
Mohamad, N.Z.; Hamzaid, N.A.; Davis, G.M.; Abdul Wahab, A.K.; Hasnan, N. Mechanomyography and Torque during FES-Evoked Muscle Contractions to Fatigue in Individuals with Spinal Cord Injury. Sensors 2017, 17, 1627. https://doi.org/10.3390/s17071627
Mohamad NZ, Hamzaid NA, Davis GM, Abdul Wahab AK, Hasnan N. Mechanomyography and Torque during FES-Evoked Muscle Contractions to Fatigue in Individuals with Spinal Cord Injury. Sensors. 2017; 17(7):1627. https://doi.org/10.3390/s17071627
Chicago/Turabian StyleMohamad, Nor Zainah, Nur Azah Hamzaid, Glen M. Davis, Ahmad Khairi Abdul Wahab, and Nazirah Hasnan. 2017. "Mechanomyography and Torque during FES-Evoked Muscle Contractions to Fatigue in Individuals with Spinal Cord Injury" Sensors 17, no. 7: 1627. https://doi.org/10.3390/s17071627
APA StyleMohamad, N. Z., Hamzaid, N. A., Davis, G. M., Abdul Wahab, A. K., & Hasnan, N. (2017). Mechanomyography and Torque during FES-Evoked Muscle Contractions to Fatigue in Individuals with Spinal Cord Injury. Sensors, 17(7), 1627. https://doi.org/10.3390/s17071627