
Room-Temperature Ammonia Sensor Based on ZnO Nanorods Deposited on ST-Cut Quartz Surface Acoustic Wave Devices


Abstract
:1. Introduction
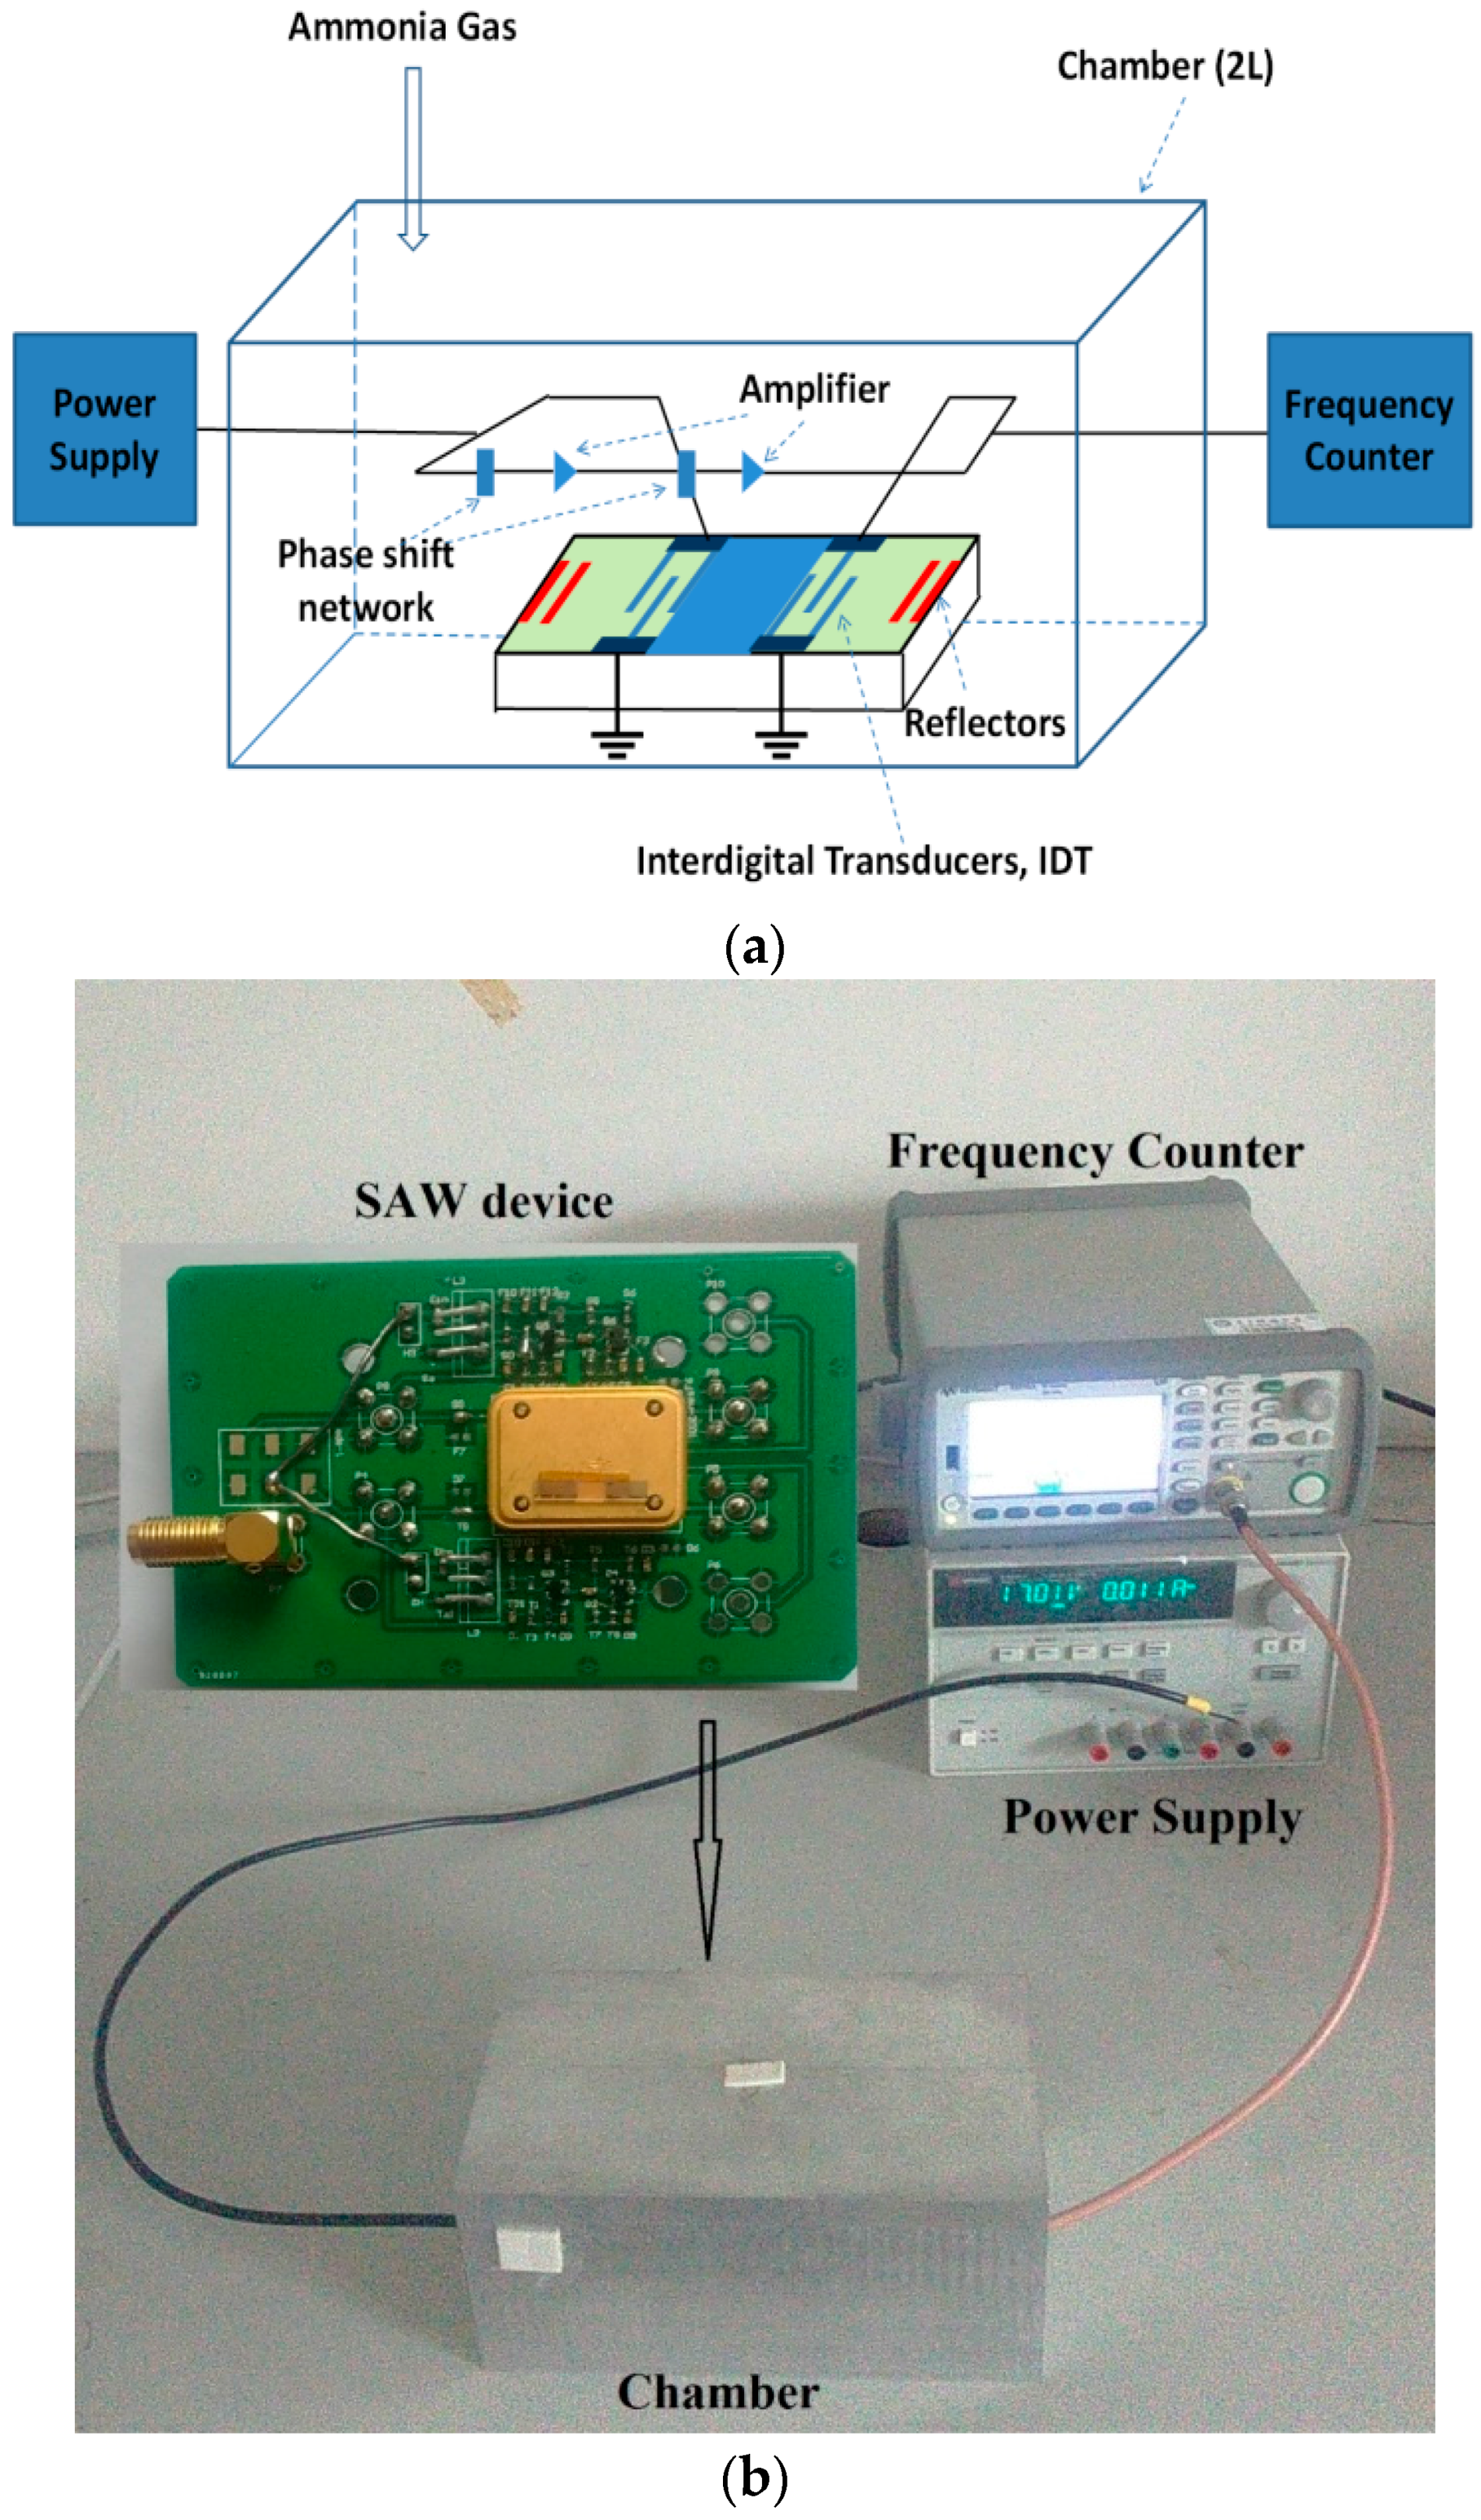
2. Experimental
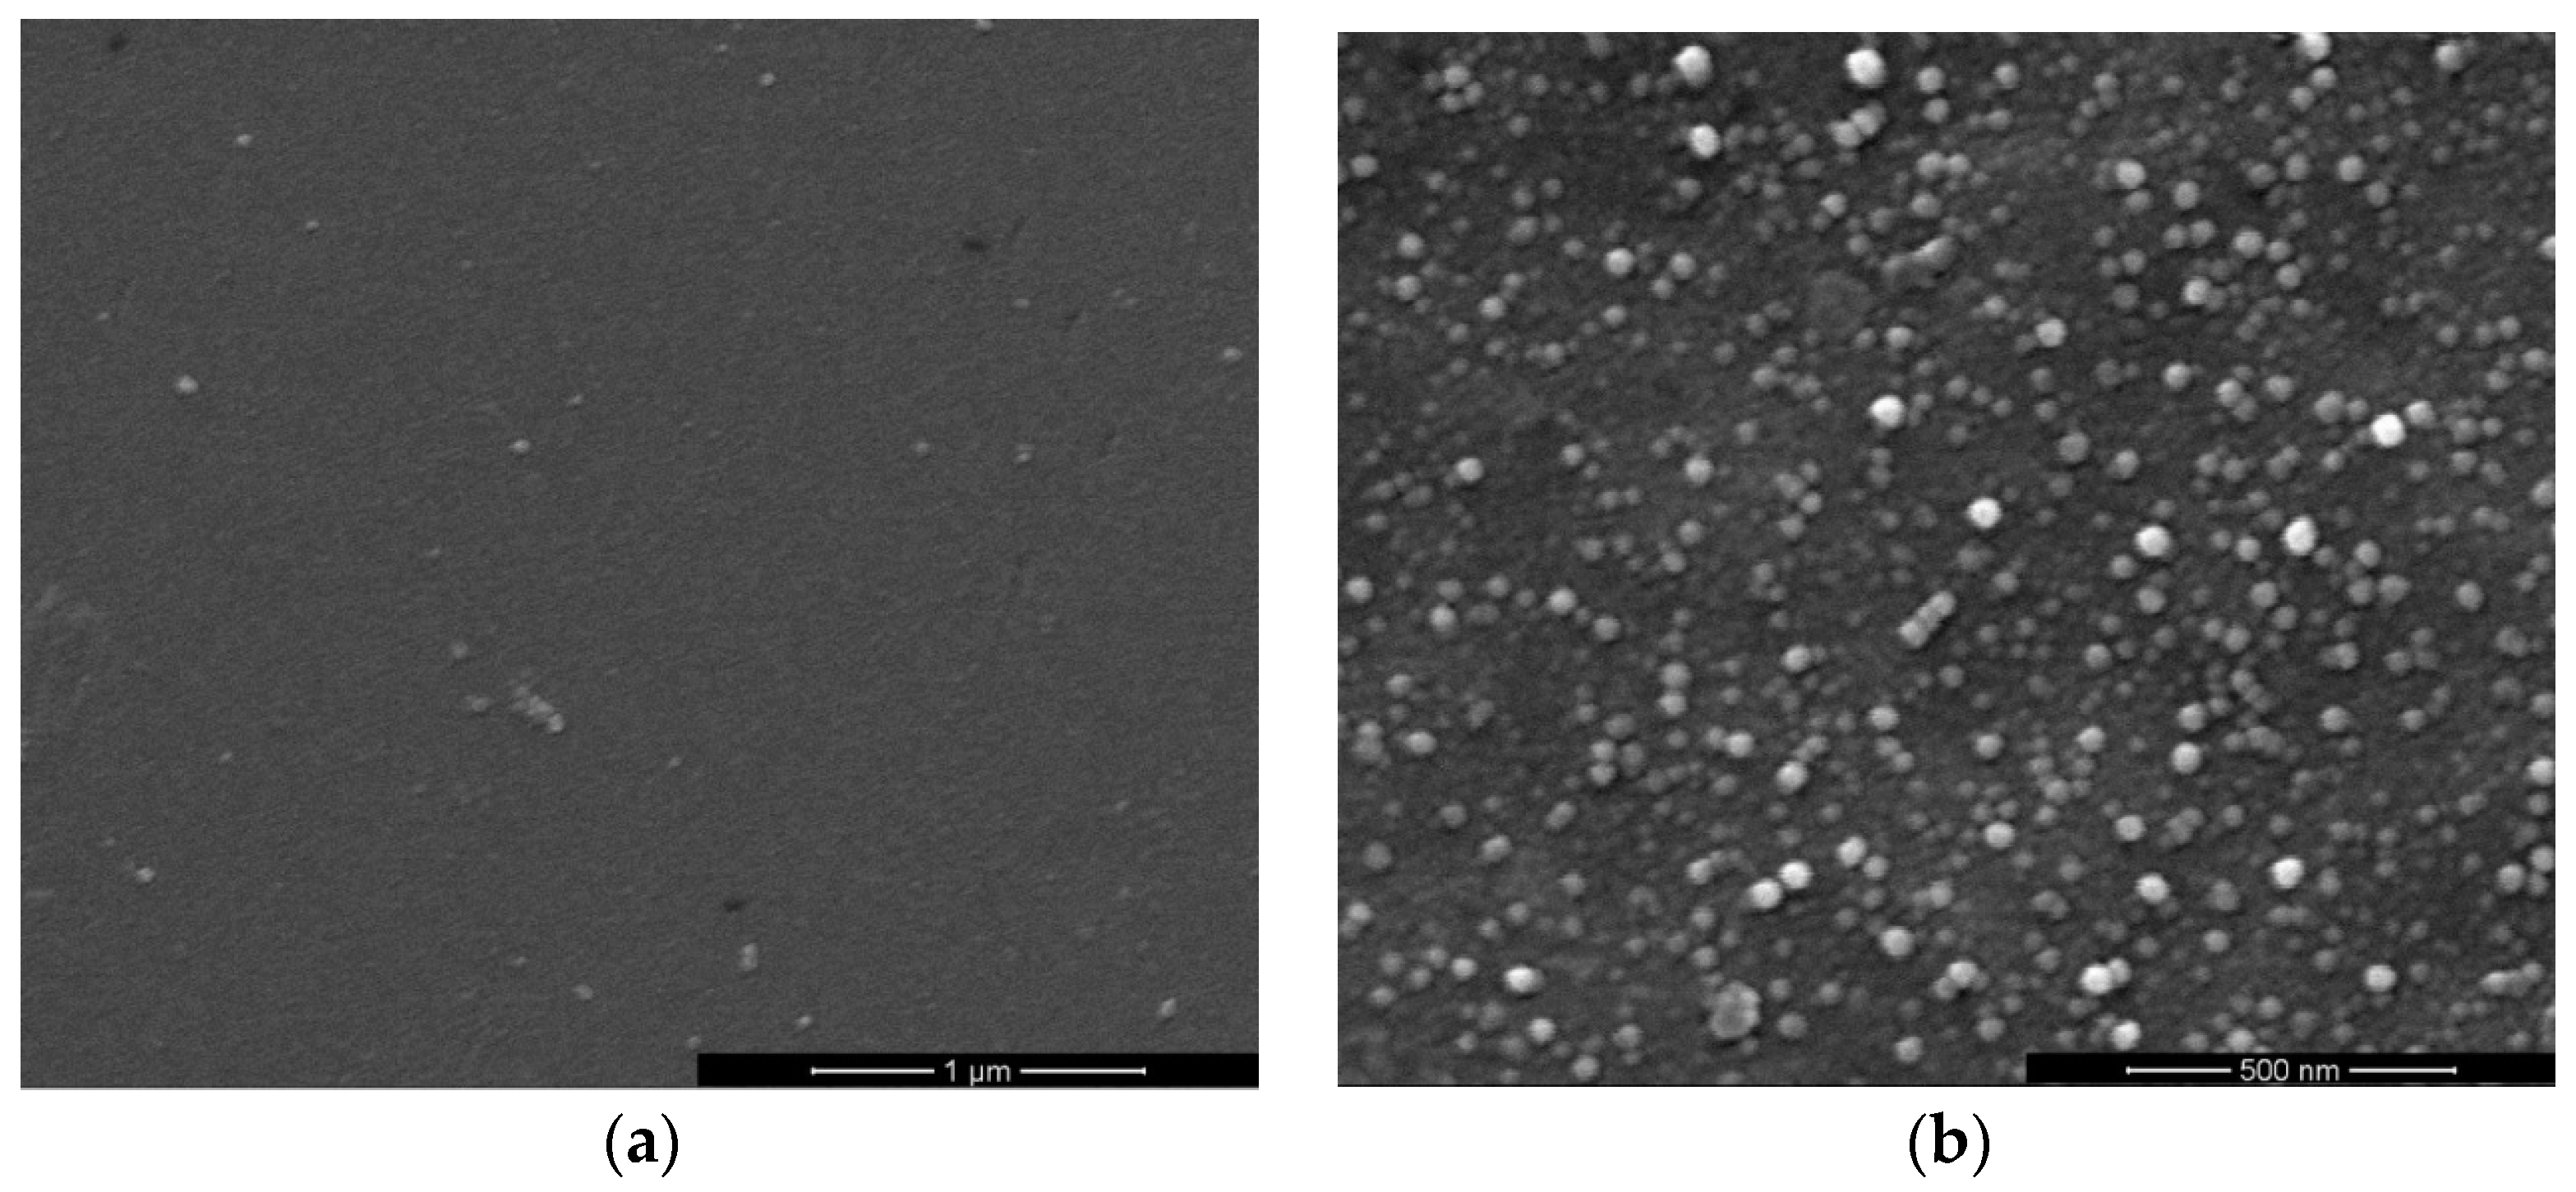
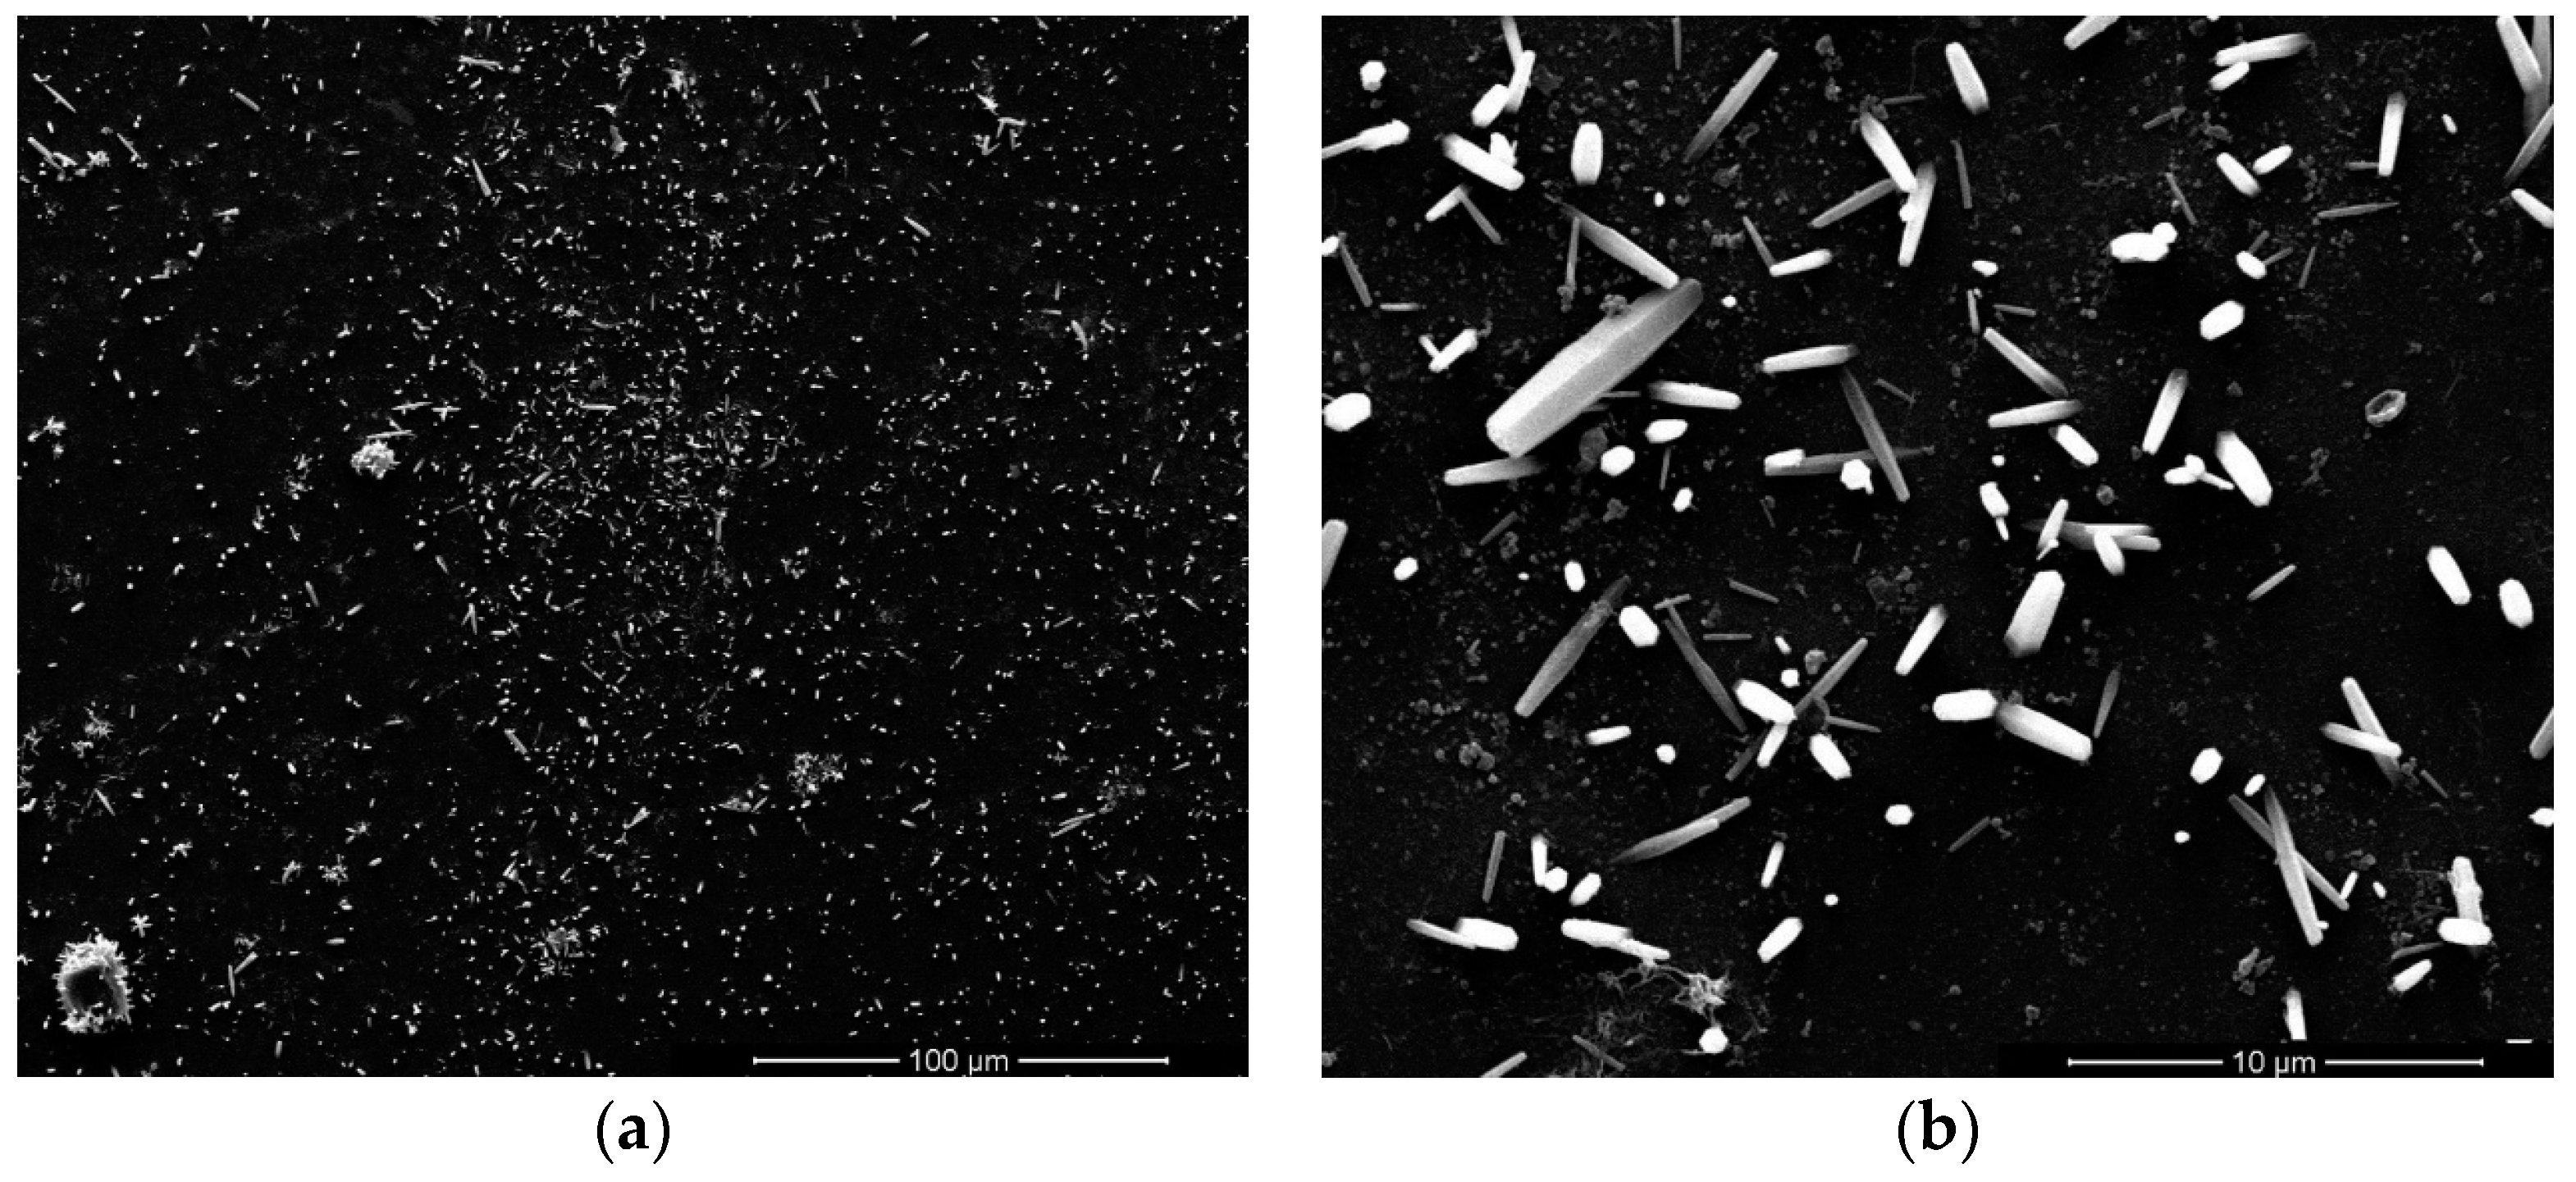
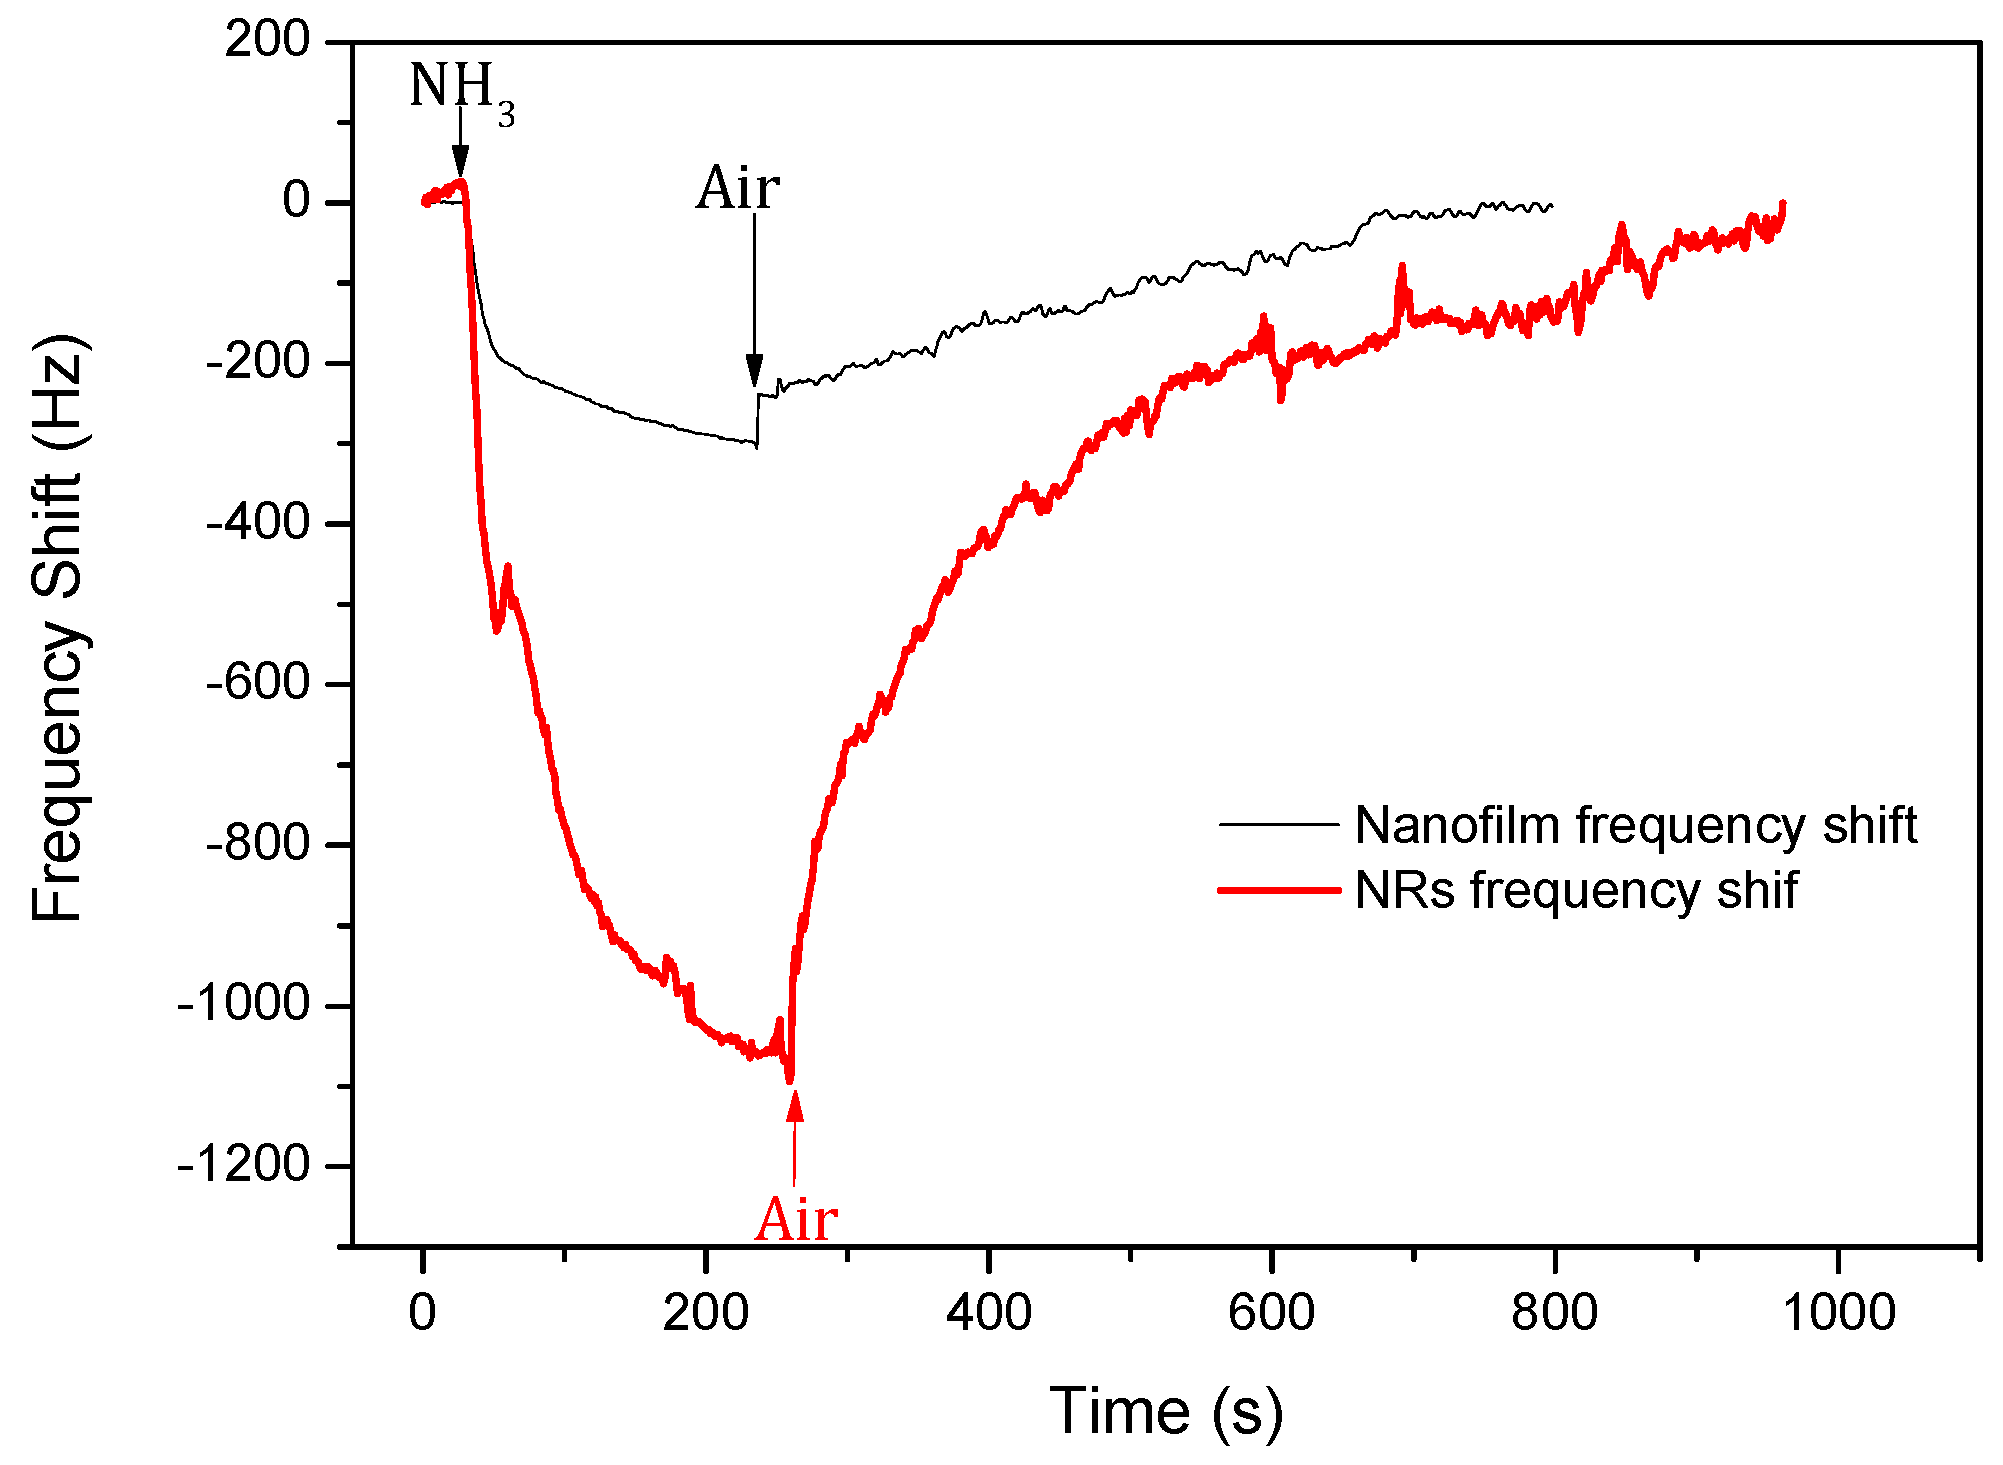
3. Results and Discussion
4. Conclusions
Acknowledgments
Author Contributions
Conflicts of Interest
References
- Schwartz, J. Air pollution and daily mortality: A review and meta analysis. Environ. Res. 1994, 64, 36–52. [Google Scholar] [CrossRef] [PubMed]
- Gaskin, S.; Pisaniello, D.; Edwards, J.W.; Bromwich, D.; Reed, S.; Logan, M.; Baxter, C. Application of skin contamination studies of ammonia gas for management of hazardous material incidents. J. Hazard. Mater. 2013, 252–253, 338–346. [Google Scholar] [CrossRef] [PubMed]
- Fedoruk, M.J.; Bronstein, R.; Kerger, B.D. Ammonia exposure and hazard assessment for selected household cleaning product uses. J. Expo. Anal. Environ. Epidemiol. 2005, 15, 534–544. [Google Scholar] [CrossRef] [PubMed]
- Timmer, B.; Olthuis, W.; Berg, A.V.D. Ammonia sensors and their applications—A review. Sens. Actuators B Chem. 2005, 107, 666–677. [Google Scholar] [CrossRef]
- Llobet, E.; Molas, G.; Molinàs, P.; Calderer, J.; Vilanova, X.; Brezmes, J.; Sueiras, J.E.; Correig, X. Fabrication of highly selective tungsten oxide ammonia sensors. J. Electrochem. Soc. 2000, 147, 776–779. [Google Scholar] [CrossRef]
- Aslam, M.; Chaudhary, V.A.; Mulla, I.S.; Sainkar, S.R.; Mandale, A.B.; Belhekar, A.A.; Vijayamohanan, K. A highly selective ammonia gas sensor using surface-ruthenated zinc oxide. Sens. Actuators A Phys. 1999, 75, 162–167. [Google Scholar] [CrossRef]
- Ji, X.; Banks, C.; Silvester, D.; Aldous, L.; Hardacre, C.; Compton, R.G. Electrochemical ammonia gas sensing in nonaqueous systems: A comparison of propylene carbonate with room temperature ionic liquids. Electroanalysis 2007, 19, 2194–2201. [Google Scholar] [CrossRef]
- Tang, Y.; Li, Z.; Ma, J.; Guo, Y.; Fu, Y.; Zu, X. Ammonia gas sensors based on ZnO/SiO2, bi-layer nanofilms on ST-cut quartz surface acoustic wave devices. Sens. Actuators B Chem. 2014, 201, 114–121. [Google Scholar] [CrossRef]
- Tang, Y.L.; Li, Z.J.; Ma, J.Y.; Su, H.Q.; Guo, Y.J.; Wang, L.; Du, B.; Chen, J.J.; Zhou, W.; Yu, Q.K.; et al. Highly sensitive room-temperature surface acoustic wave (SAW) ammonia sensors based on Co3O4/SiO2, composite films. J. Hazard. Mater. 2014, 280, 127–133. [Google Scholar] [CrossRef] [PubMed]
- Varghese, O.K.; Gong, D.; Dreschel, W.R.; Ong, K.G.; Grimes, C.A. Ammonia detection using nanoporous alumina resistive and surface acoustic wave sensors. Sens. Actuators B Chem. 2003, 94, 27–35. [Google Scholar] [CrossRef]
- Shen, C.Y.; Liou, S.Y. Surface acoustic wave gas monitor for ppm ammonia detection. Sens. Actuators B Chem. 2008, 131, 673–679. [Google Scholar] [CrossRef]
- Raj, V.B.; Nimal, A.T.; Parmar, Y.; Sharma, M.U.; Sreenivas, K.; Gupta, V. Cross-sensitivity and selectivity studies on ZnO surface acoustic wave ammonia sensor. Sens. Actuators B Chem. 2010, 147, 517–524. [Google Scholar] [CrossRef]
- Nimal, A.T.; Singh, M.; Mittal, U.; Yadava, R.D.S. A comparative analysis of one-port Colpitt and two-port Pierce SAW oscillators for DMMP vapor sensing. Sens. Actuators B Chem. 2006, 114, 316–325. [Google Scholar] [CrossRef]
- Rapp, M.; Reibel, J.; Voigt, A.; Balzer, M.; Bülow, O. New miniaturized SAW-sensor array for organic gas detection driven by multiplexed oscillators. Sens. Actuators B Chem. 2000, 65, 169–172. [Google Scholar] [CrossRef]
- Ricco, A.J.; Martin, S.J.; Zipperian, T.E. Surface acoustic wave gas sensor based on film conductivity changes. Sens. Actuators 1986, 8, 319–333. [Google Scholar] [CrossRef]
- Willander, M.; Israr, M.Q.; Sadaf, J.R.; Nur, O. Progress on one-dimensional zinc oxide nanomaterials based photonic devices. Nanophotonics 2012, 1, 99–115. [Google Scholar] [CrossRef]
- Wang, Z.L. ZnO nanowire and nanobelt platform for nanotechnology. Mater. Sci. Eng. R Rep. 2009, 64, 33–71. [Google Scholar] [CrossRef]
- Udom, I.; Ram, M.K.; Stefanakos, E.K.; Hepp, A.F.; Goswami, D.Y. One dimensional-ZnO nanostructures: Synthesis, properties and environmental applications. Mater. Sci. Semicond. Process. 2013, 16, 2070–2083. [Google Scholar] [CrossRef]
- Zhang, Y.; Ram, M.K.; Stefanakos, E.K.; Goswami, D.Y. Synthesis, characterization, and applications of ZnO nanowires. J. Nanomater. 2012, 2012. [Google Scholar] [CrossRef]
- Chey, C.O.; Ibupoto, Z.H.; Khun, K.; Nur, O.; Willander, M. Indirect determination of mercury ion by inhibition of a glucose biosensor based on ZnO nanorods. Sensors 2012, 12, 15063–15077. [Google Scholar] [CrossRef] [PubMed]
- Yang, Q.; Wang, W.; Xu, S.; Wang, Z.L. Enhancing light emission of zno microwire-based diodes by piezo-phototronic effect. Nano Lett. 2011, 11, 4012–4017. [Google Scholar] [CrossRef] [PubMed]
- Harale, N.S.; Kamble, A.S.; Tarwal, N.L.; Mulla, I.S.; Rao, V.K.; Kim, J.H.; Patil, P.S. Hydrothermally grown ZnO nanorods arrays for selective NO2, gas sensing: Effect of anion generating agents. Ceram. Int. 2016, 42, 12807–12814. [Google Scholar] [CrossRef]
- Kim, W.; Baek, M.; Yong, K. Fabrication of ZnO/CdS, ZnO/CdO core/shell nanorod arrays and investigation of their ethanol gas sensing properties. Sens. Actuators B Chem. 2016, 223, 599–605. [Google Scholar] [CrossRef]
- Teea, T.S.; Hui, T.C.; Yi, C.W.; Chin, Y.C.; Umar, A.A.; Titian, G.R.; Beng, L.H.; Sing, L.K.; Yahaya, M.; Salleh, M. Microwave-assisted hydrolysis preparation of highly crystalline Zno nanorod array for room temperature photoluminescence-based co gas sensor. Sens. Actuators B Chem. 2015, 227, 304–312. [Google Scholar]
- Liu, L. Controllable ZnO nanorod arrays @ carbon fibers composites: Towards advanced CO2, photocatalytic reduction catalysts. Ceram. Int. 2016, 42, 12516–12520. [Google Scholar] [CrossRef]
- Vuong, N.M.; Hien, T.T.; Quang, N.D.; Chinh, N.D.; Lee, D.S.; Kim, D.; Kim, D. H2- and NH3-treated ZnO nanorods sensitized with CdS for photoanode enhanced in photoelectrochemical performance. J. Power Sources 2016, 317, 169–176. [Google Scholar] [CrossRef]
- Wang, J.X.; Sun, X.W.; Yang, Y.; Huang, H.; Lee, Y.C.; Tan, O.K.; Vayssieres, L. Hydrothermally grown oriented ZnO nanorod arrays for gas sensing applications. Nanotechnology 2006, 17, 4995–4998. [Google Scholar] [CrossRef]
- Chan, O.C.; Alnoor, H.; Abbasi, M.A.; Willanderet, M. Fast synthesis, morphology transformation, structural and optical properties of ZnO nanorods grown by seed-free hydrothermal method. Phys. Status Solidi Appl. Mater. 2014, 211, 2611–2615. [Google Scholar]
- Ma, W.; Shi, W. Temperature-sensitive cuts for surface acoustic waves in quartz. IEEE Trans. Ultrason. Ferroelectr. Freq. Control 2001, 48, 333–335. [Google Scholar] [PubMed]
- Henry-Briot, E.; Ballandras, S.; Marianneau, G.; Martin, G. Influence of metal thickness on phase velocity and thermal sensitivity of SAW devices. IEEE Trans. Ultrason. Ferroelectr. Freq. Control 2001, 48, 538–546. [Google Scholar] [CrossRef] [PubMed]
- Yamazaki, T.; Iizawa, K.; Kanna, S.; Takagi, M. Temperature stability of surface acoustic wave resonators on In-plane rotated 33° Y-cut quartz. Jpn. J. Appl. Phys. Part Regul. Pap. Short Notes Rev. Pap. 2003, 42, 3136–3138. [Google Scholar] [CrossRef]
- Takao, Y.; Takao, Y. High ammonia sensitive semiconductor gas sensors with double-layer structure and interface electrodes. J. Electrochem. Soc. 1994, 141, 1028–1034. [Google Scholar] [CrossRef]
- Li, J.; Fan, H.; Jia, X.; Yang, W.; Fang, P. Enhanced blue-green emission and ethanol sensing of Co-doped ZnO nanocrystals prepared by a solvothermal route. Appl. Phys. A 2010, 98, 537–542. [Google Scholar] [CrossRef]
- Jakubik, W. Theory of saw gas sensor based on bi-layer conductivity changes. Procedia Eng. 2012, 47, 1287–1290. [Google Scholar] [CrossRef]
- Thompson, M.; Stone, D.C. Surface-Launched Acoustic Wave Sensors; Wiley & Sons: New York, NY, USA, 2010. [Google Scholar]


| Ammonia Gas Concentration (ppm) | ZnO Nanfilm | ZnO NRs | ||||
|---|---|---|---|---|---|---|
| Frequency Shift (Hz) | 90% Response Time (s) | 90% Recovery Time (s) | Frequency Shift (Hz) | 90% Response Time (s) | 90% Recovery Time (s) | |
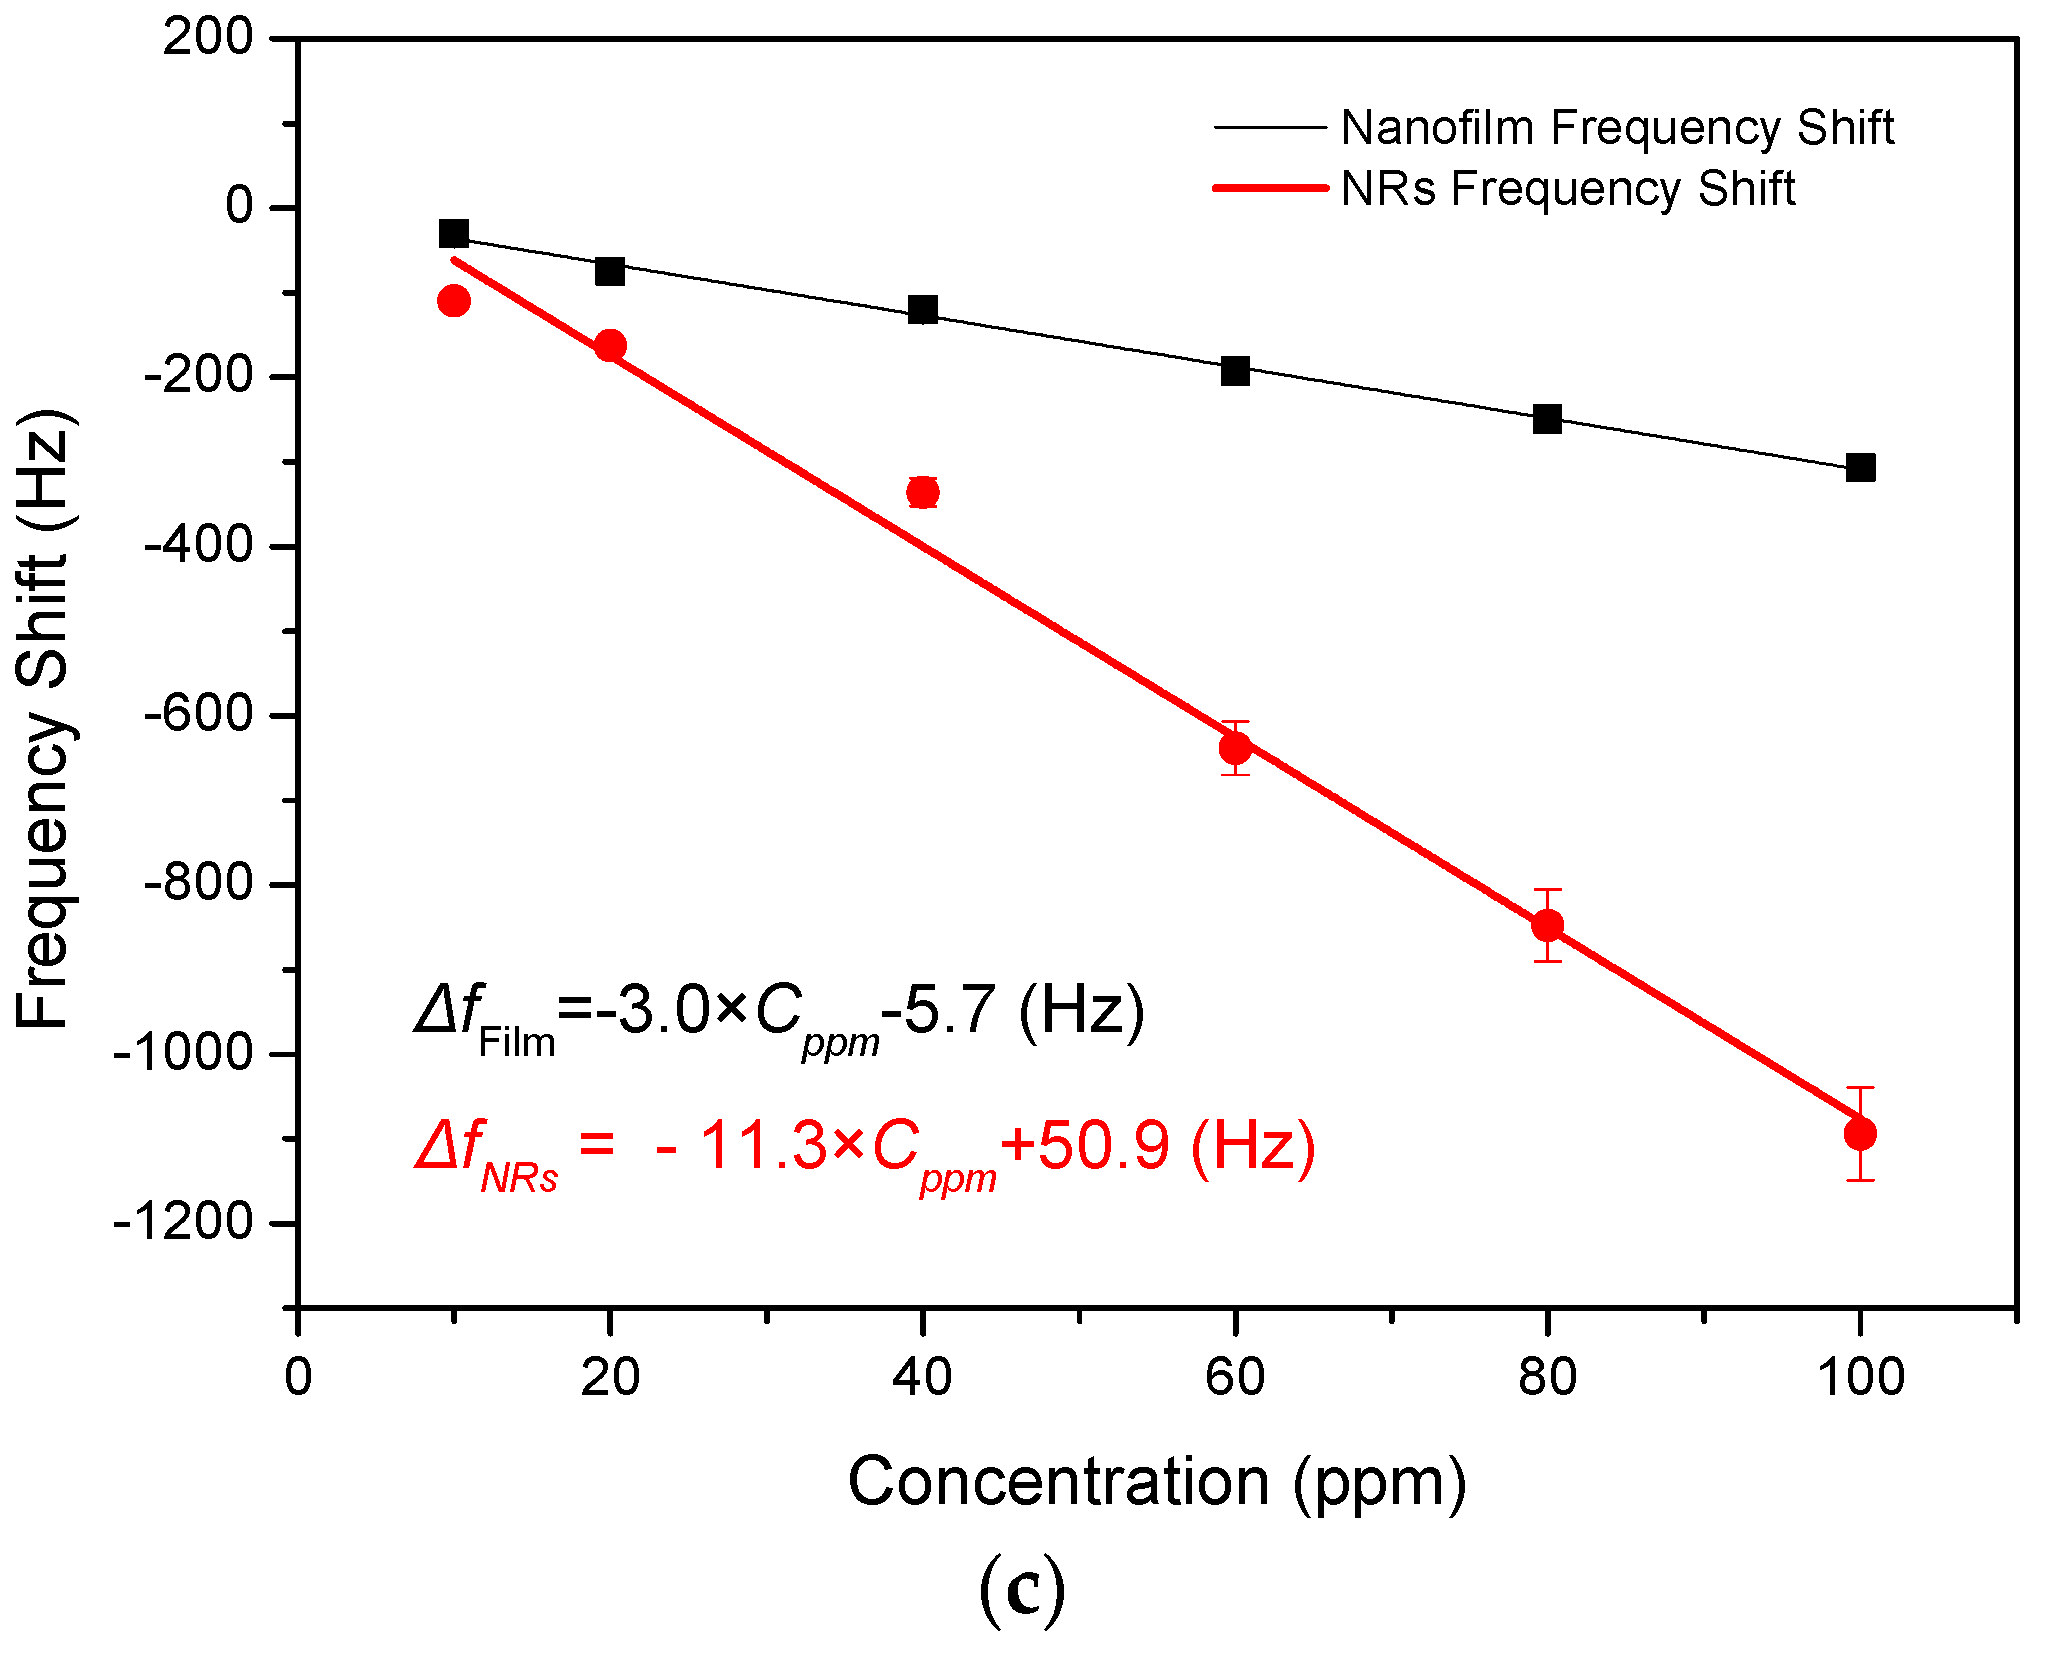
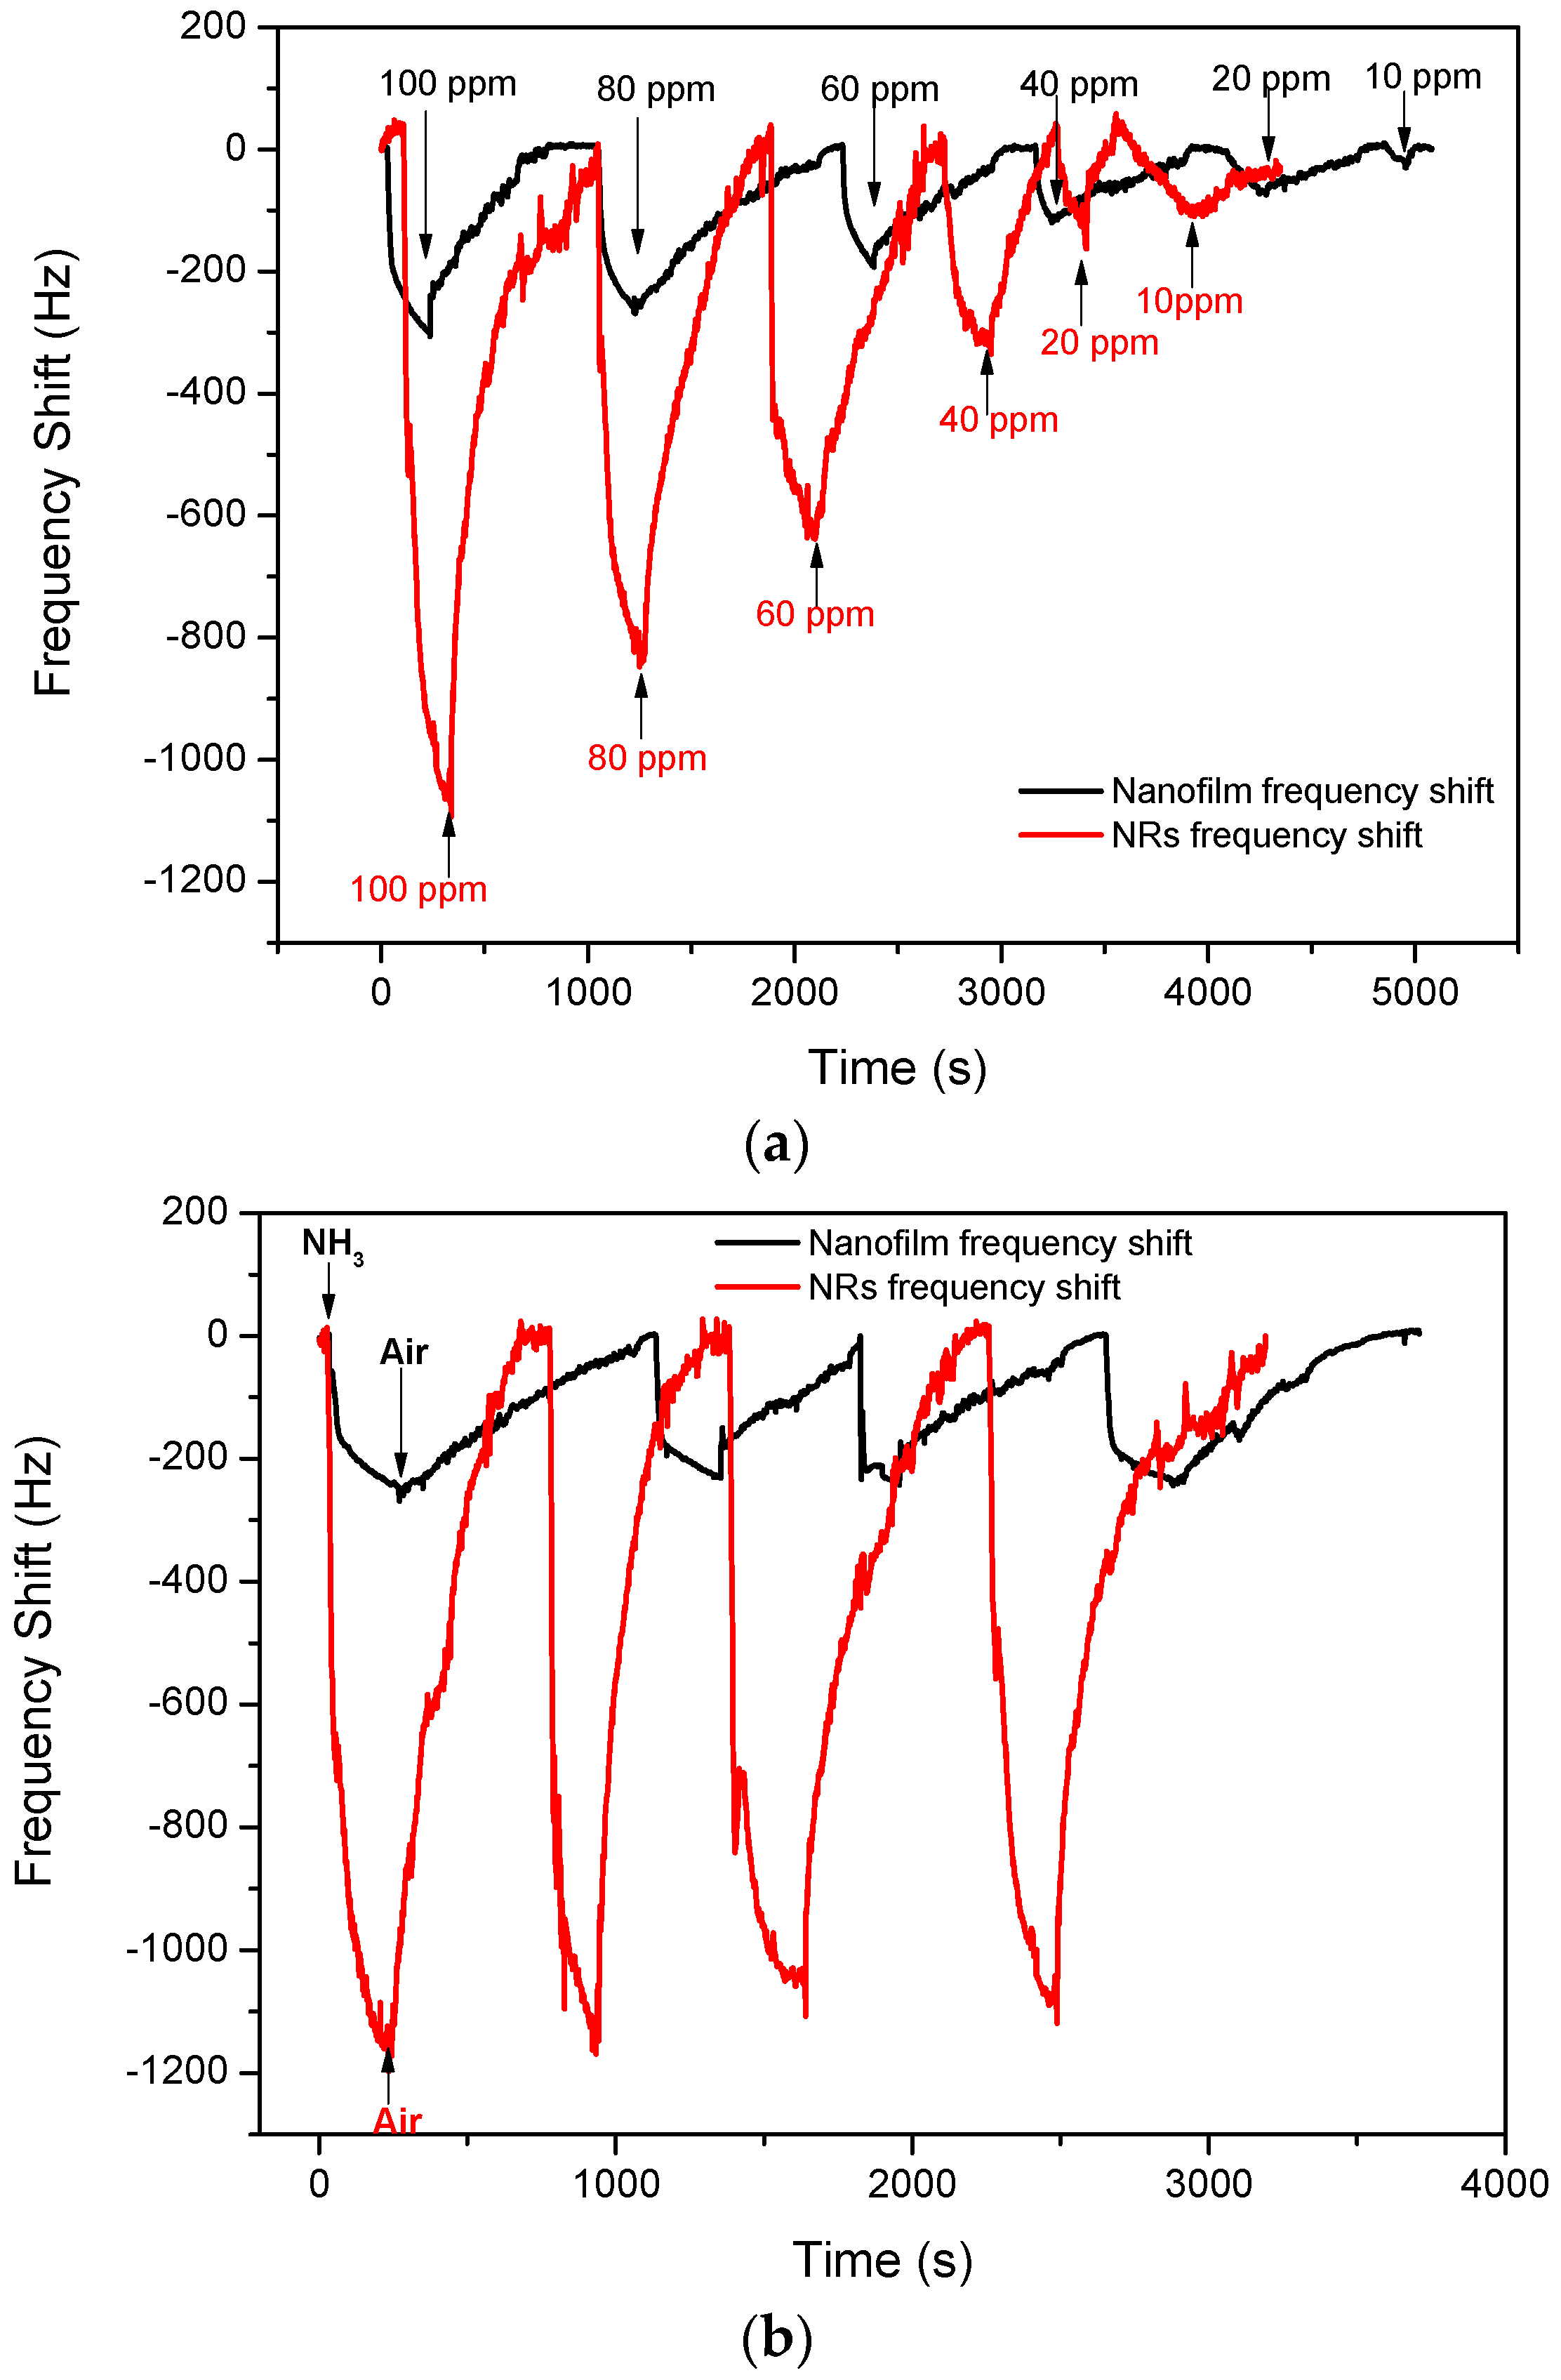
| 10 | −30 | 50 | 34 | −110 | 266 | 431 |
| 20 | −75 | 85 | 457 | −163 | 117 | 76 |
| 40 | −120 | 94 | 562 | −336 | 125 | 233 |
| 60 | −193 | 113 | 583 | −638 | 131 | 465 |
| 80 | −269 | 130 | 932 | −848 | 140 | 470 |
| 100 | −307 | 143 | 426 | −1094 | 151 | 568 |
© 2017 by the authors. Licensee MDPI, Basel, Switzerland. This article is an open access article distributed under the terms and conditions of the Creative Commons Attribution (CC BY) license (http://creativecommons.org/licenses/by/4.0/).
Share and Cite
Li, W.; Guo, Y.; Tang, Y.; Zu, X.; Ma, J.; Wang, L.; Fu, Y.Q. Room-Temperature Ammonia Sensor Based on ZnO Nanorods Deposited on ST-Cut Quartz Surface Acoustic Wave Devices. Sensors 2017, 17, 1142. https://doi.org/10.3390/s17051142
Li W, Guo Y, Tang Y, Zu X, Ma J, Wang L, Fu YQ. Room-Temperature Ammonia Sensor Based on ZnO Nanorods Deposited on ST-Cut Quartz Surface Acoustic Wave Devices. Sensors. 2017; 17(5):1142. https://doi.org/10.3390/s17051142
Chicago/Turabian StyleLi, Wei, Yuanjun Guo, Yongliang Tang, Xiaotao Zu, Jinyi Ma, Lu Wang, and Yong Qing Fu. 2017. "Room-Temperature Ammonia Sensor Based on ZnO Nanorods Deposited on ST-Cut Quartz Surface Acoustic Wave Devices" Sensors 17, no. 5: 1142. https://doi.org/10.3390/s17051142
APA StyleLi, W., Guo, Y., Tang, Y., Zu, X., Ma, J., Wang, L., & Fu, Y. Q. (2017). Room-Temperature Ammonia Sensor Based on ZnO Nanorods Deposited on ST-Cut Quartz Surface Acoustic Wave Devices. Sensors, 17(5), 1142. https://doi.org/10.3390/s17051142