
Cross Layer Design for Optimizing Transmission Reliability, Energy Efficiency, and Lifetime in Body Sensor Networks


Abstract
:1. Introduction
- We obtain the transmission power of different nodes that maximizes their energy efficiency through theoretical analysis.
- A Cross Layer Design Optimal (CLDO) scheme is proposed to simultaneously improve the transmission reliability, energy efficiency, and lifetime of WBANs through optimizing the network layer, medium access control (MAC) layer, and PHY layer:
- The CLDO scheme first optimizes the transmission power for every link in the WBAN from the MAC layer and PHY layer, which can maximize the energy efficiency in theory under the premise that requirements on delay and jitter are assured to be met.
- After that, a relay decision algorithm is proposed to optimize the process of selecting relay nodes from the network layer, which burden the routing task for sensor nodes.
- Since different locations of nodes lead to unbalanced energy consumption, then CLDO scheme then will enhance the transmission power of nodes with more residual energy to further improve QoS requirement performance. Similar to step 1, this operation is related to the MAC layer and PHY layer.
- Finally, the CLDO scheme chooses suitable packet sizes for different data packets transmitted in the network to maximize energy efficiency, which involves the network layer, MAC layer, and PHY layer simultaneously since the actual header consists of their sub-headers.
- Through our extensive simulation, we demonstrate that both the transmission reliability and the lifetime of a WBAN can be enhanced using the proposed CLDO scheme. Compared with previous methods, the transmission reliability reaches more than while the lifetime can be prolonged by .
2. Related Work
2.1. Optimizations in the MAC Layer
2.2. Optimizations in the Network Layer
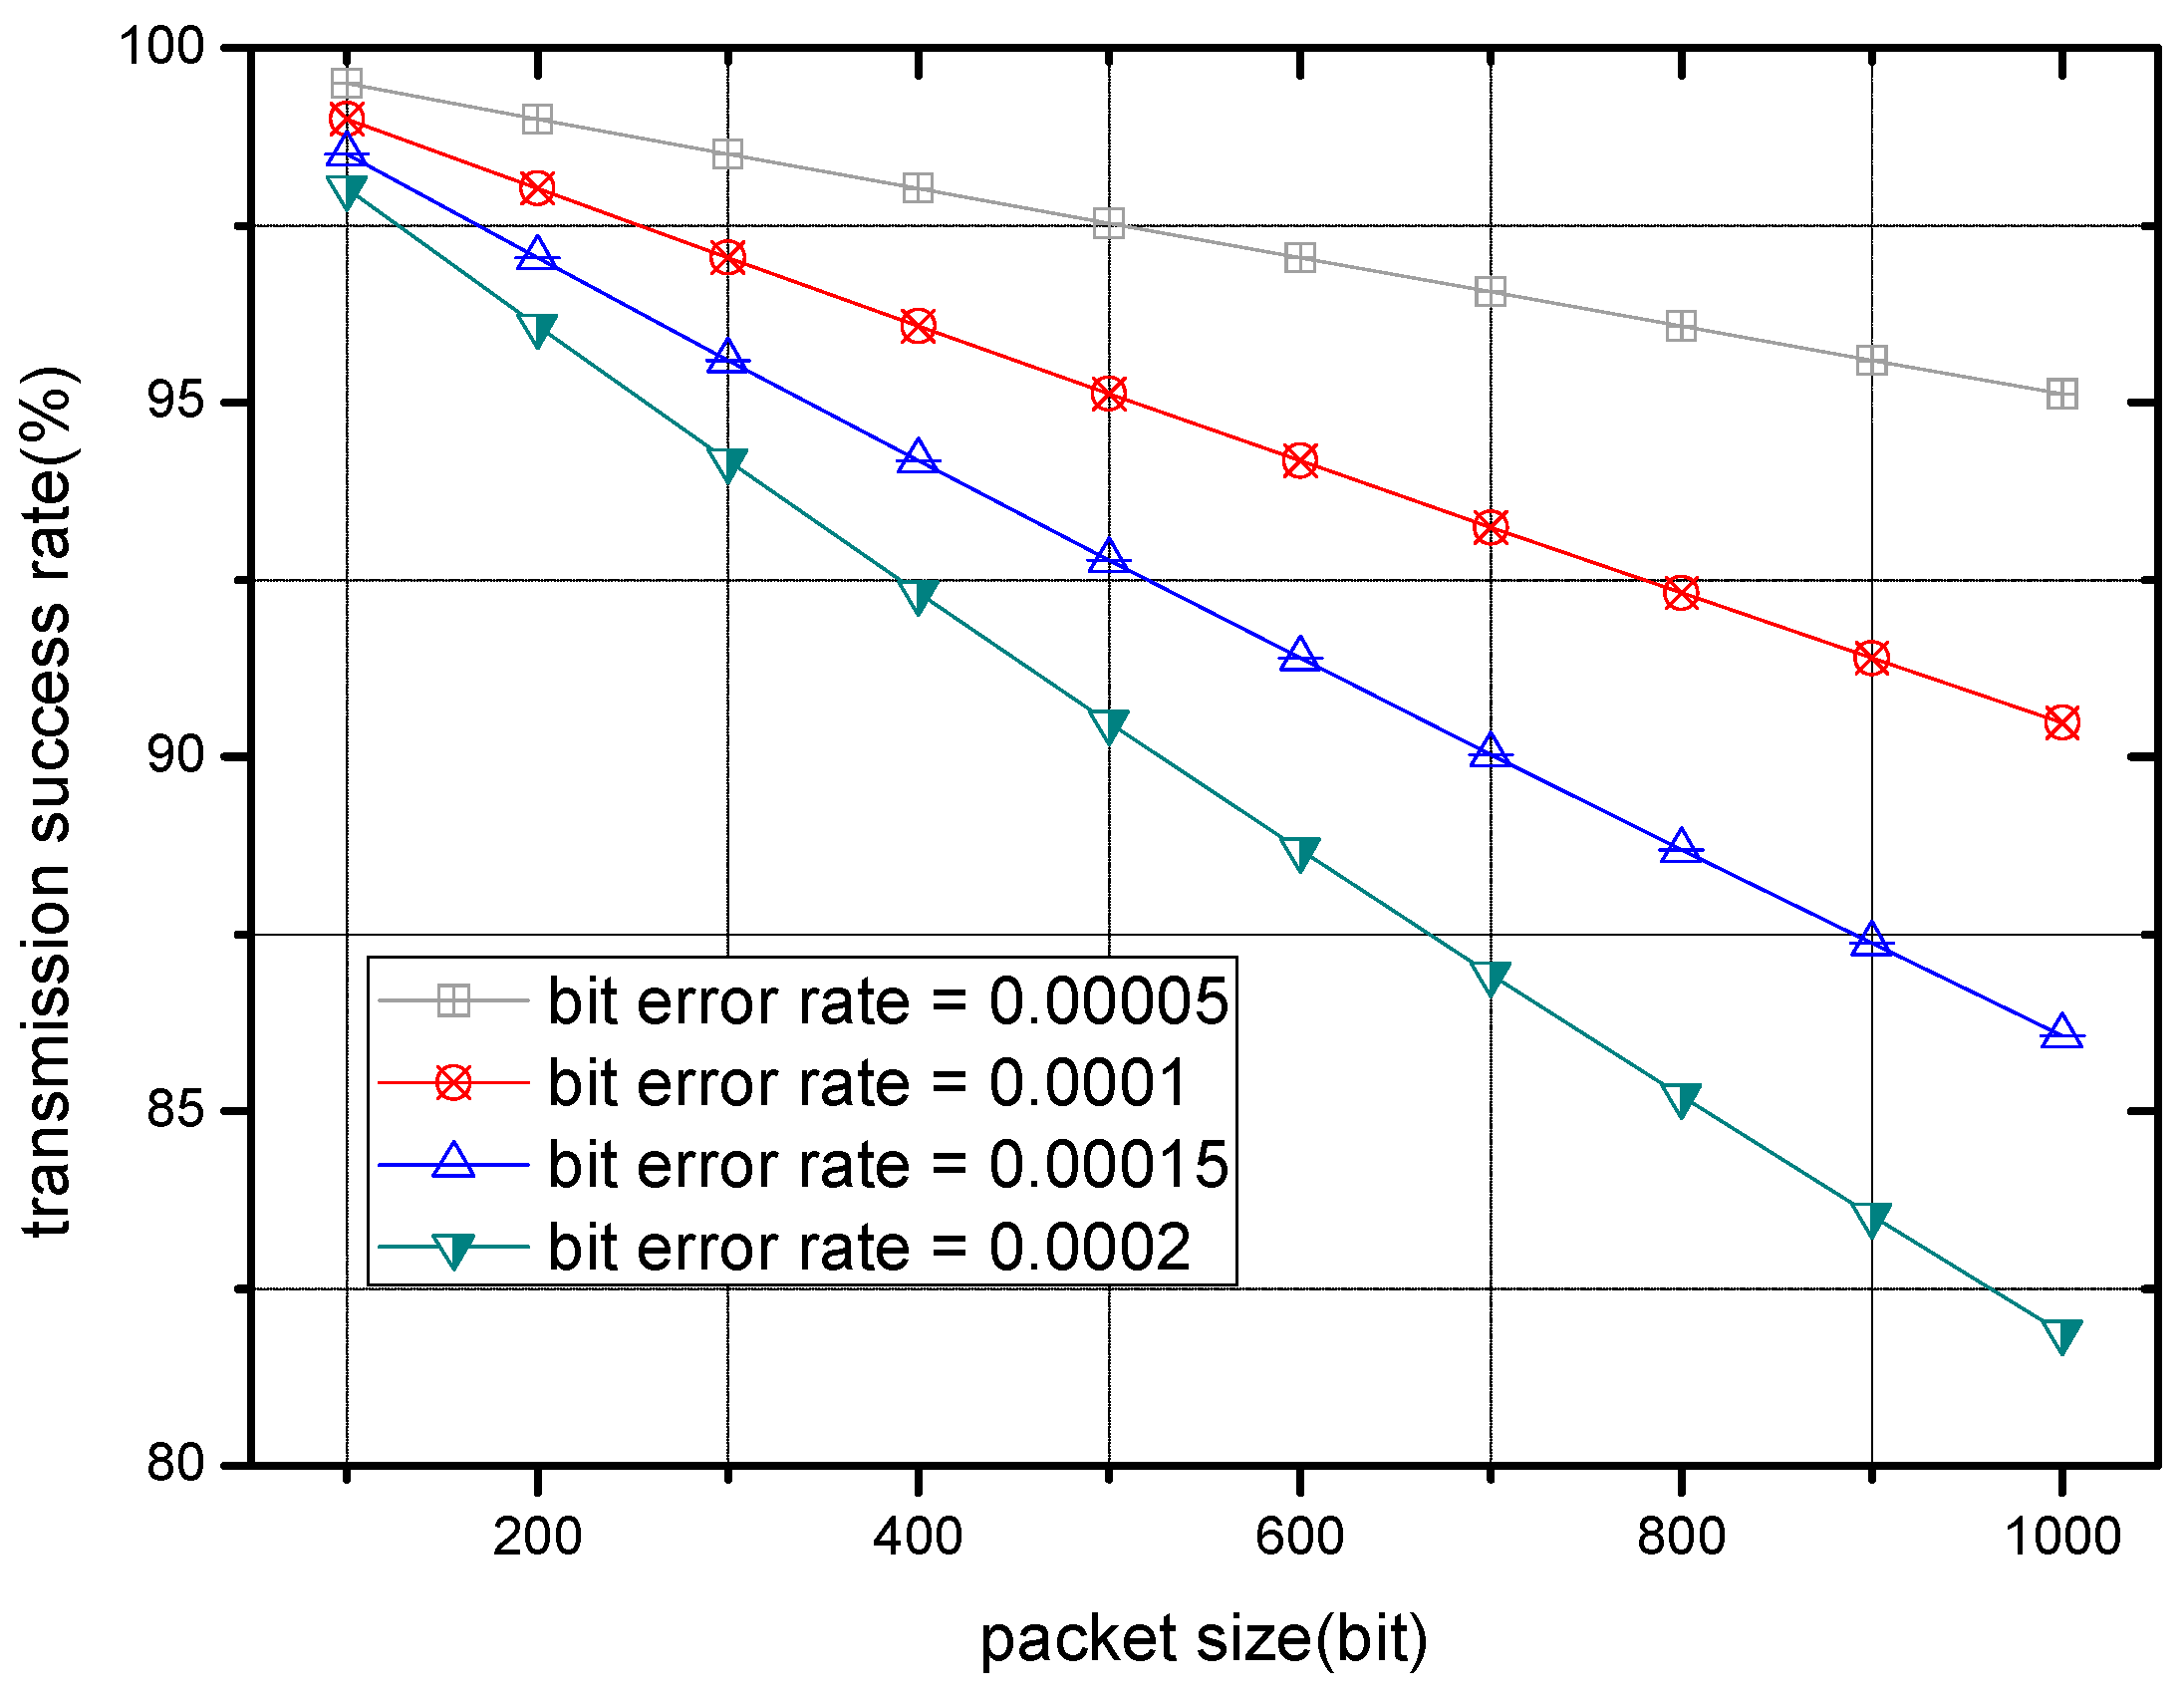
2.3. Relationships between Packet Size and Network Performance
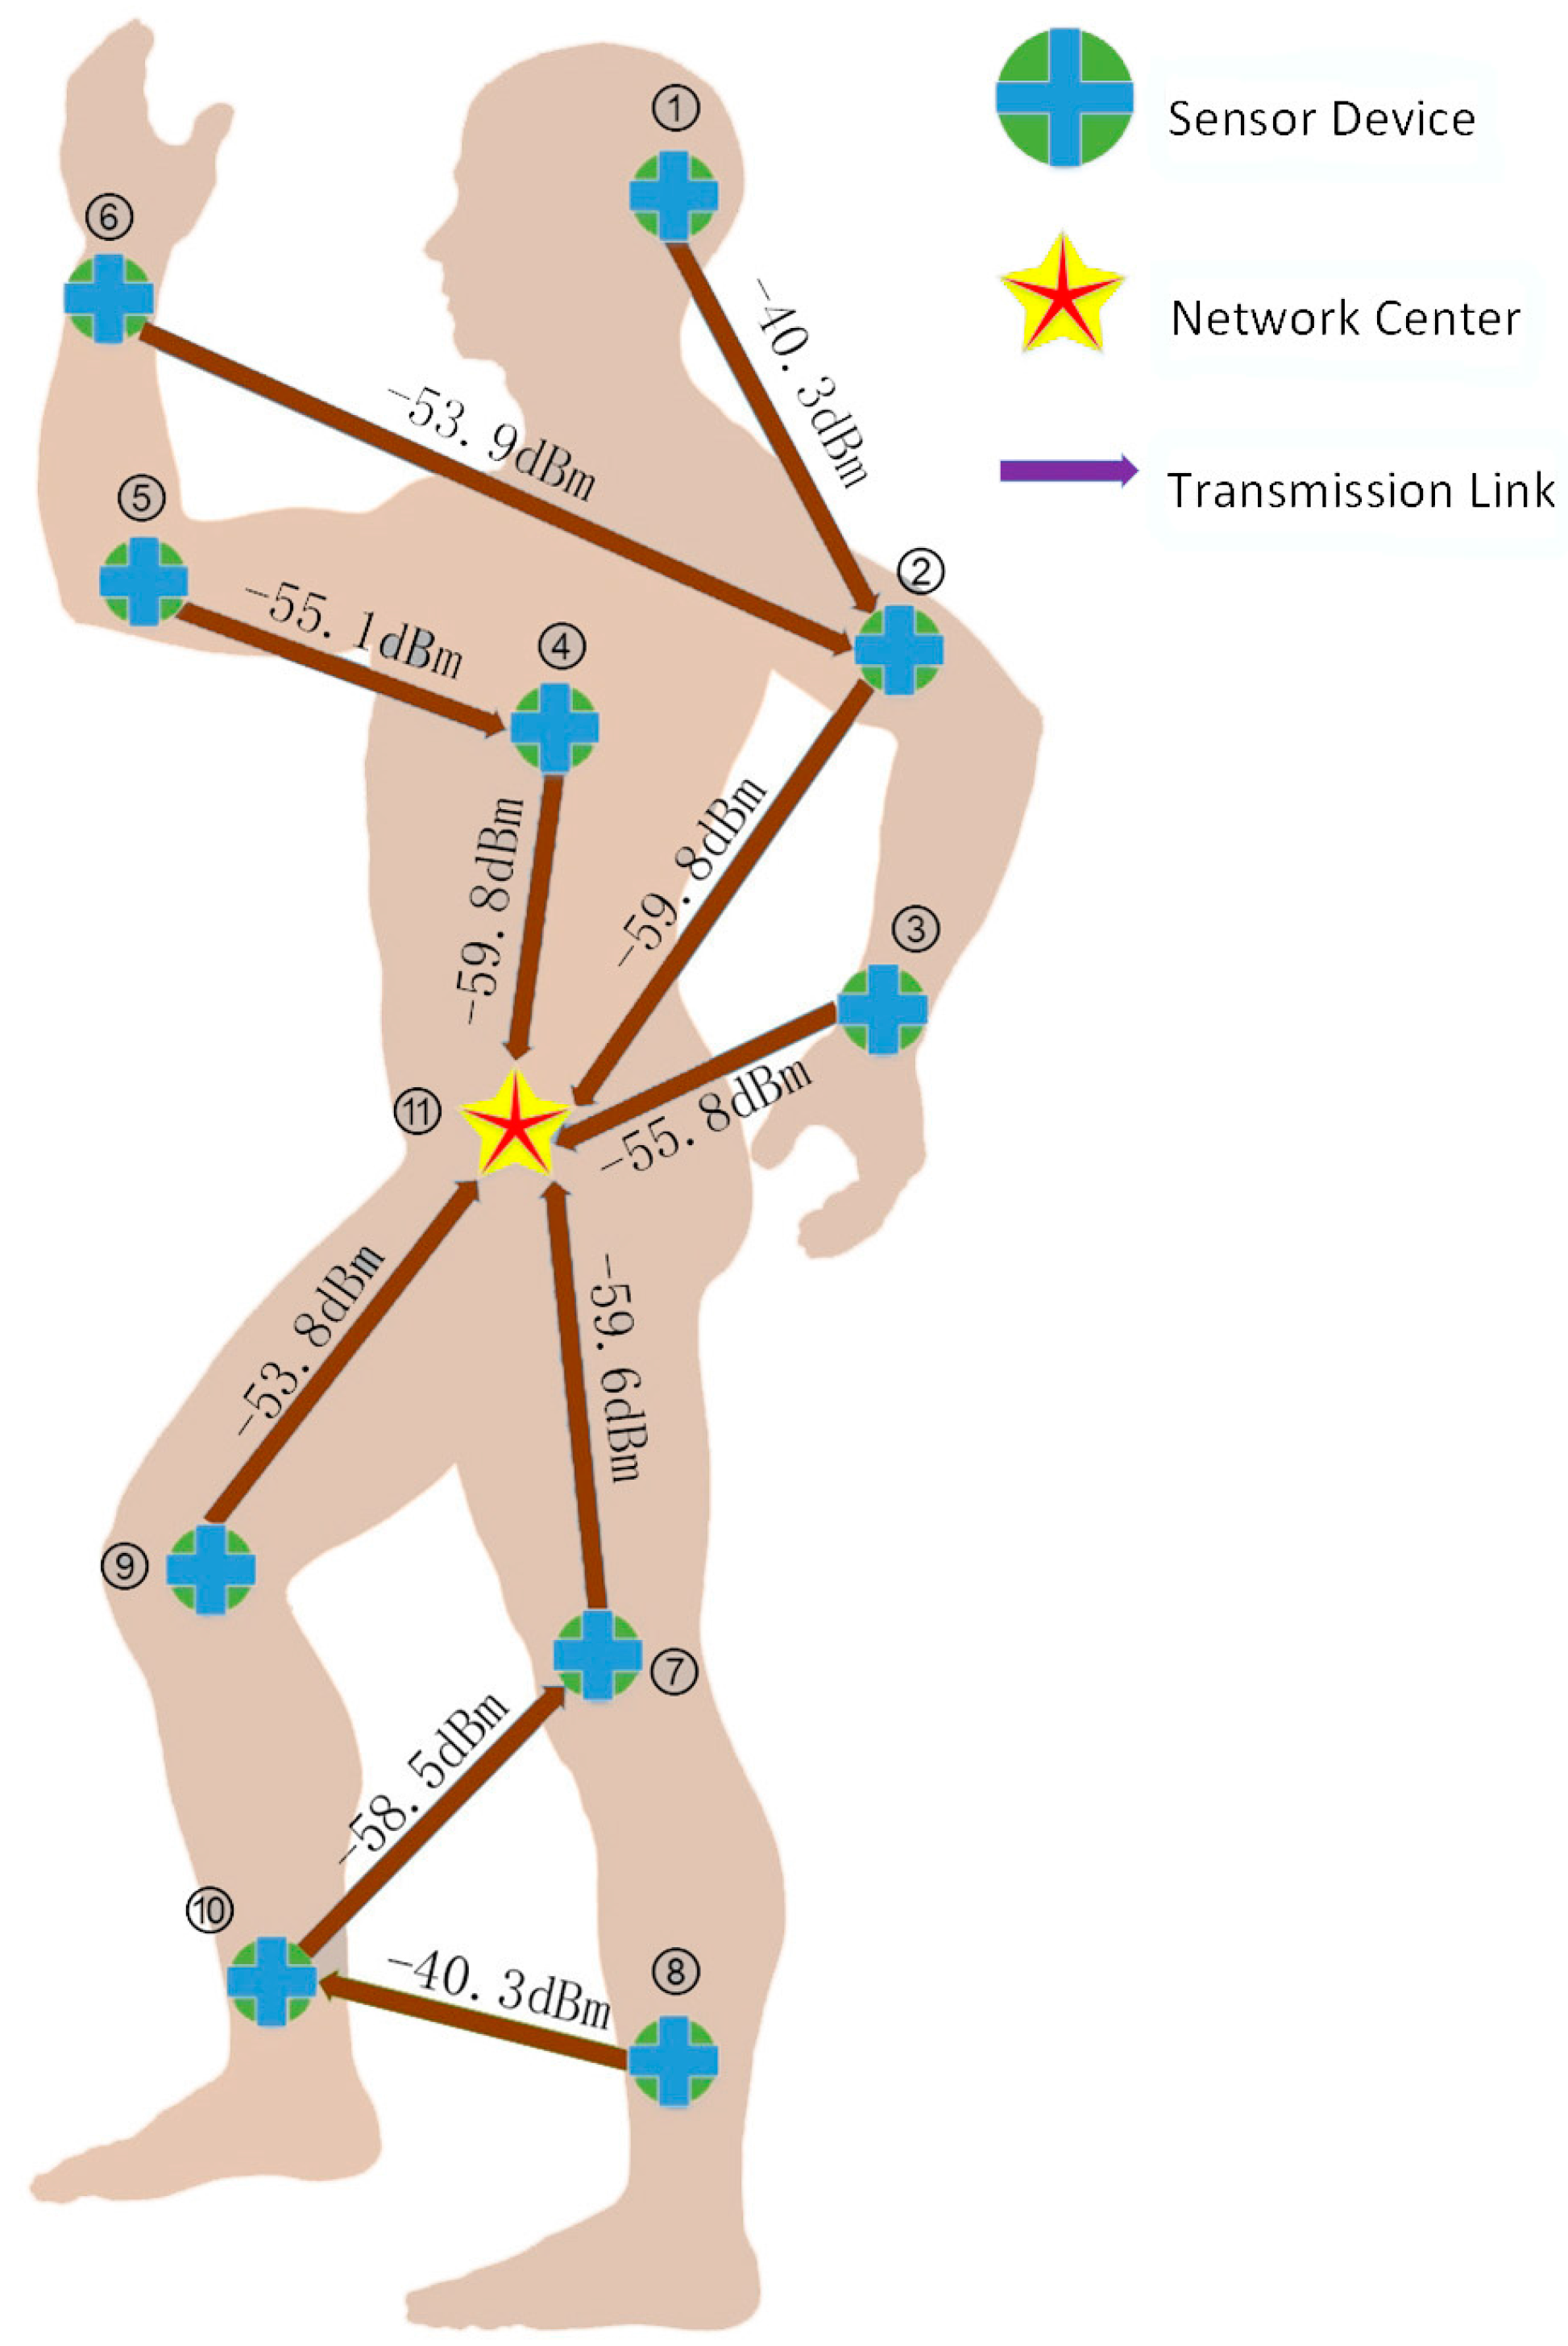
3. System Model and Problem Statement
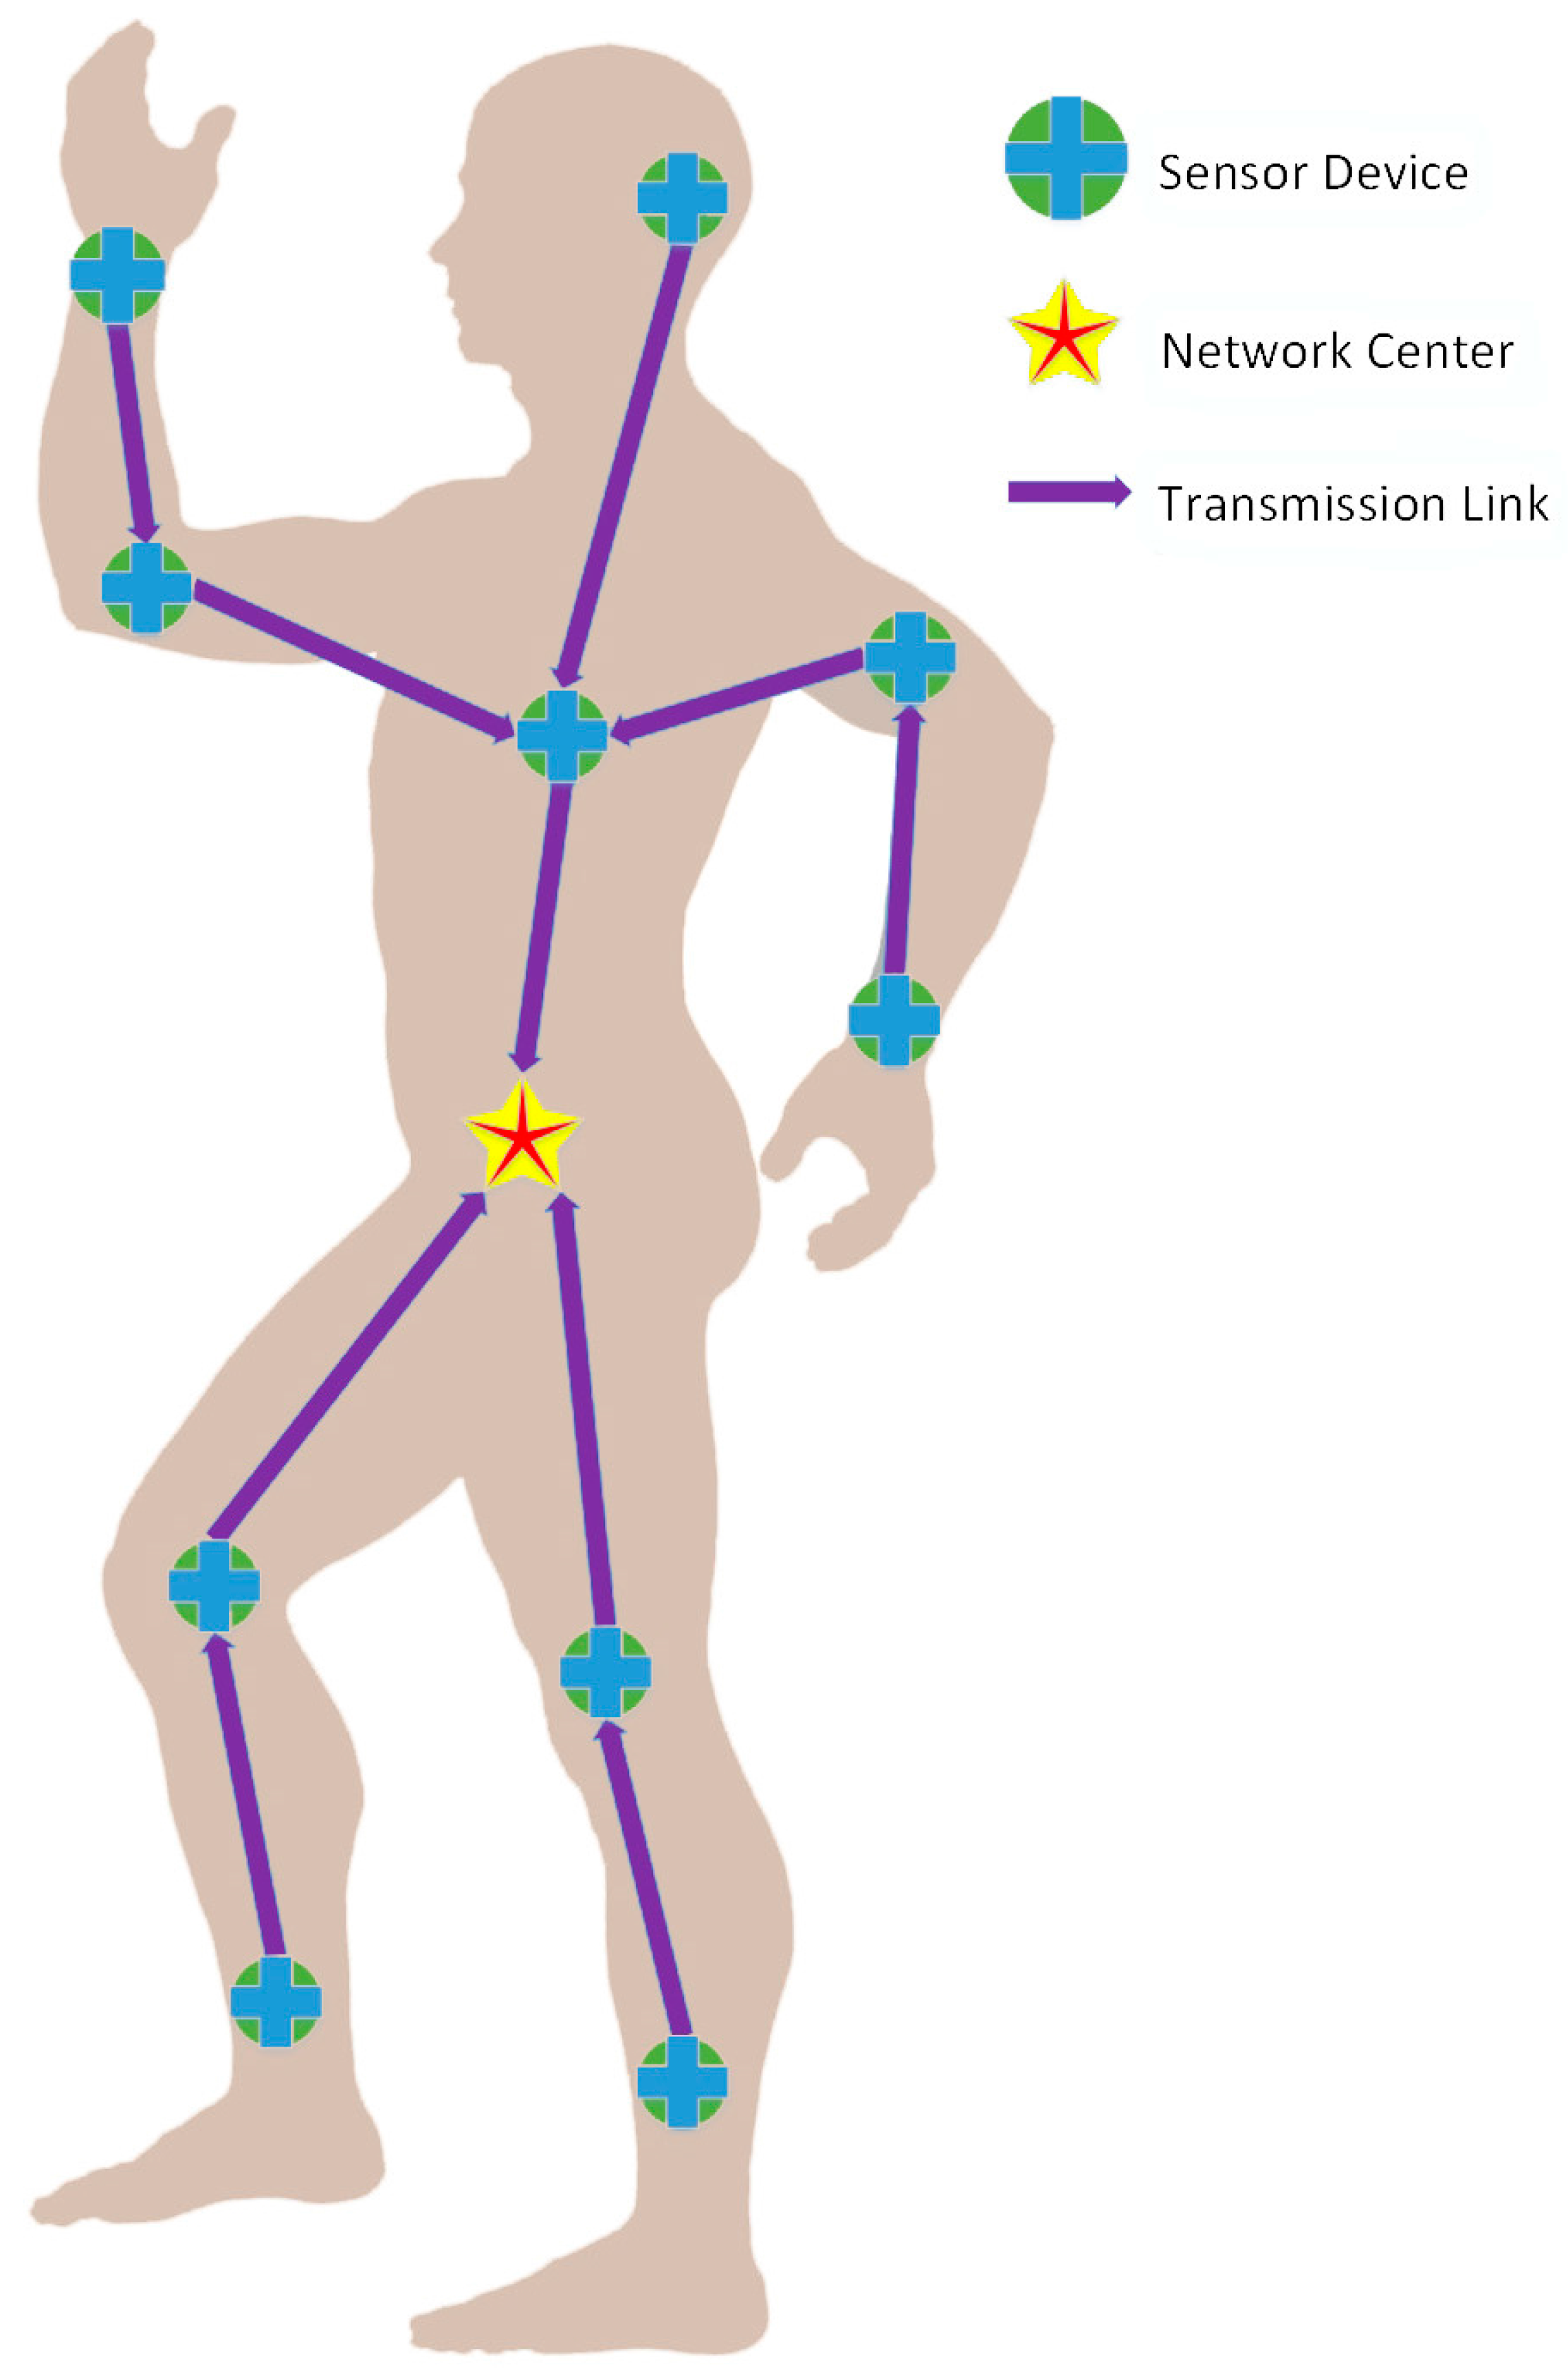
3.1. System Model
3.2. Problem Statement
4. Design of the CLDO Scheme
4.1. Research Motivation of CLDO Scheme
4.1.1. Observation 1
4.1.2. Observation 2
4.1.3. Observation 3
4.1.4. Observation 4
4.2. Optimal Power Control Strategy over Links
4.3. Optimal Relay Decision Strategy for Sensor Nodes
- (1)
- Initialize a star topology for the network, centered at the hub.
- (2)
- Sort sensor nodes within the network into a queue according to the ascending order of their distance to the hub.
- (3)
- Pick the head of the queue every time and implement a relay decision strategy for it until the queue is empty.
- (4)
- Return to step (2) to start the next round of relay reselection.
| Algorithm 1 Relay Decision (RD) Algorithm for Forming Topology |
| 1: input one value as the iteration time |
| 2: For |
| 3: ; //initialize a star network topology |
| 4: ; //obtain relay candidates |
| 5: End |
| 6: While |
| 7: sort elements in into a queue in an ascending order of distance |
| 8: While is not empty |
| 9: pull out the head of ; |
| 10: For |
| 11: assume an established link for transmission; |
| 12: compute the optimized power ; |
| 13: compute the candidate assessment function ; |
| 14: End |
| 15: choose node as the relay of that satisfies where |
| 16: End |
| 17: ; |
| 18: End |
4.4. Power Rearrangement Strategy and Packet Size Choice Strategy
| Algorithm 2 Cross Layer Design Optimization (CLDO) Algorithm | |
| 1: | For |
| 2: | employ RD scheme to form network topology and arrange consumed power; |
| 3: | employ power rearrangement strategy to fully utilize remaining energy; |
| 4: | compute average energy efficiency ; |
| 5: | End |
| 6: | choose the packet size that corresponds to the crest value of where ; |
| 7: | implement the optimized power, the optimized topology obtained in step 1–4 that corresponds to the chosen packet size in WBAN. |
5. Performance Analysis of CLDO Scheme
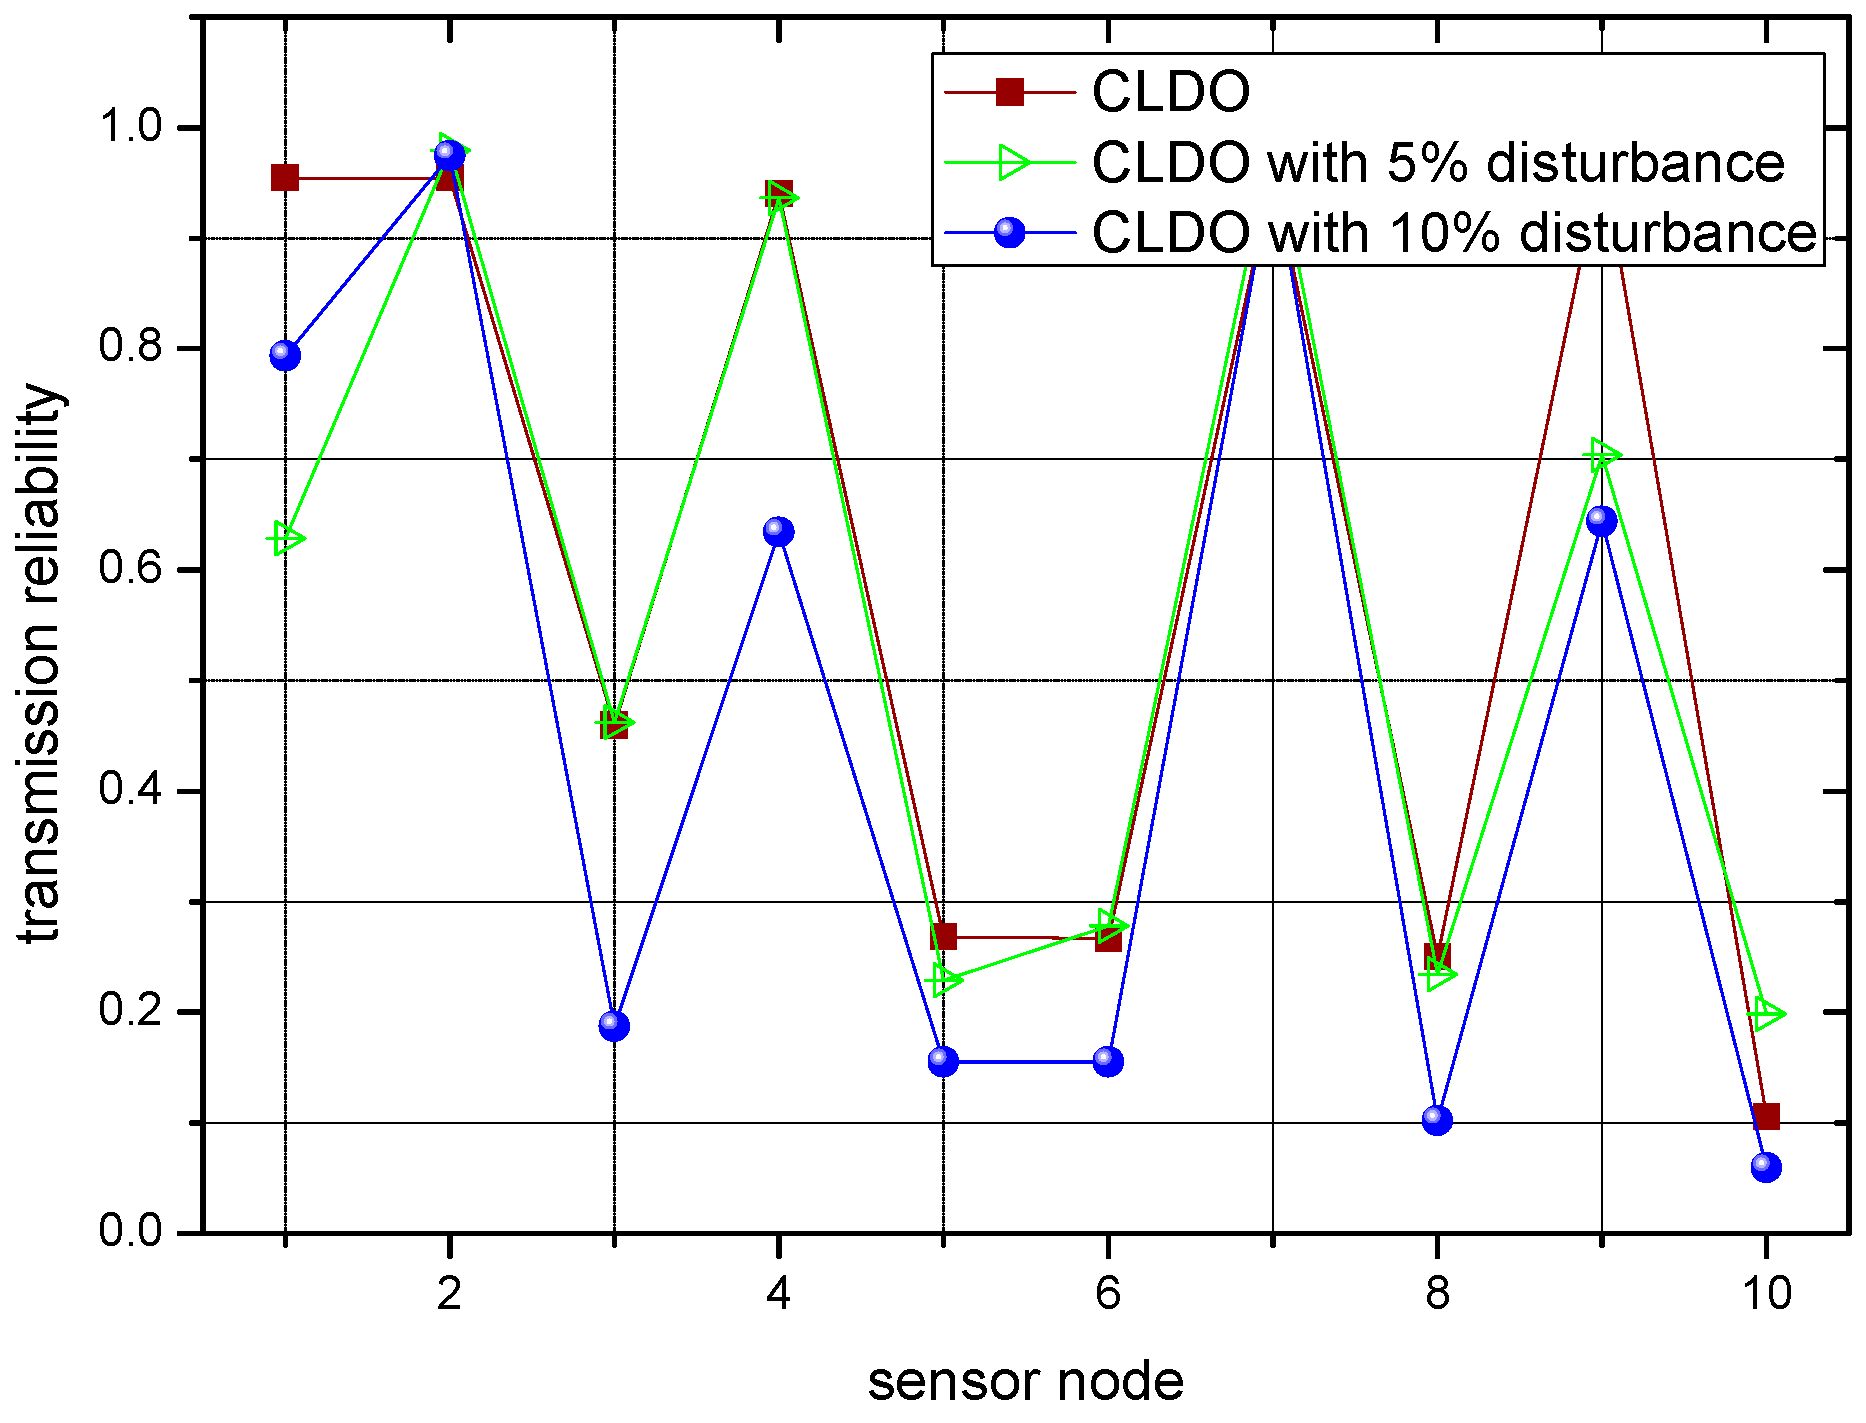
5.1. Transmission Reliability of CLDO Scheme
5.2. Energy Efficiency of CLDO Scheme
5.3. Energy Consumption Balance of CLDO Scheme
5.4. End-to-End Delay and Jitter of CLDO Scheme
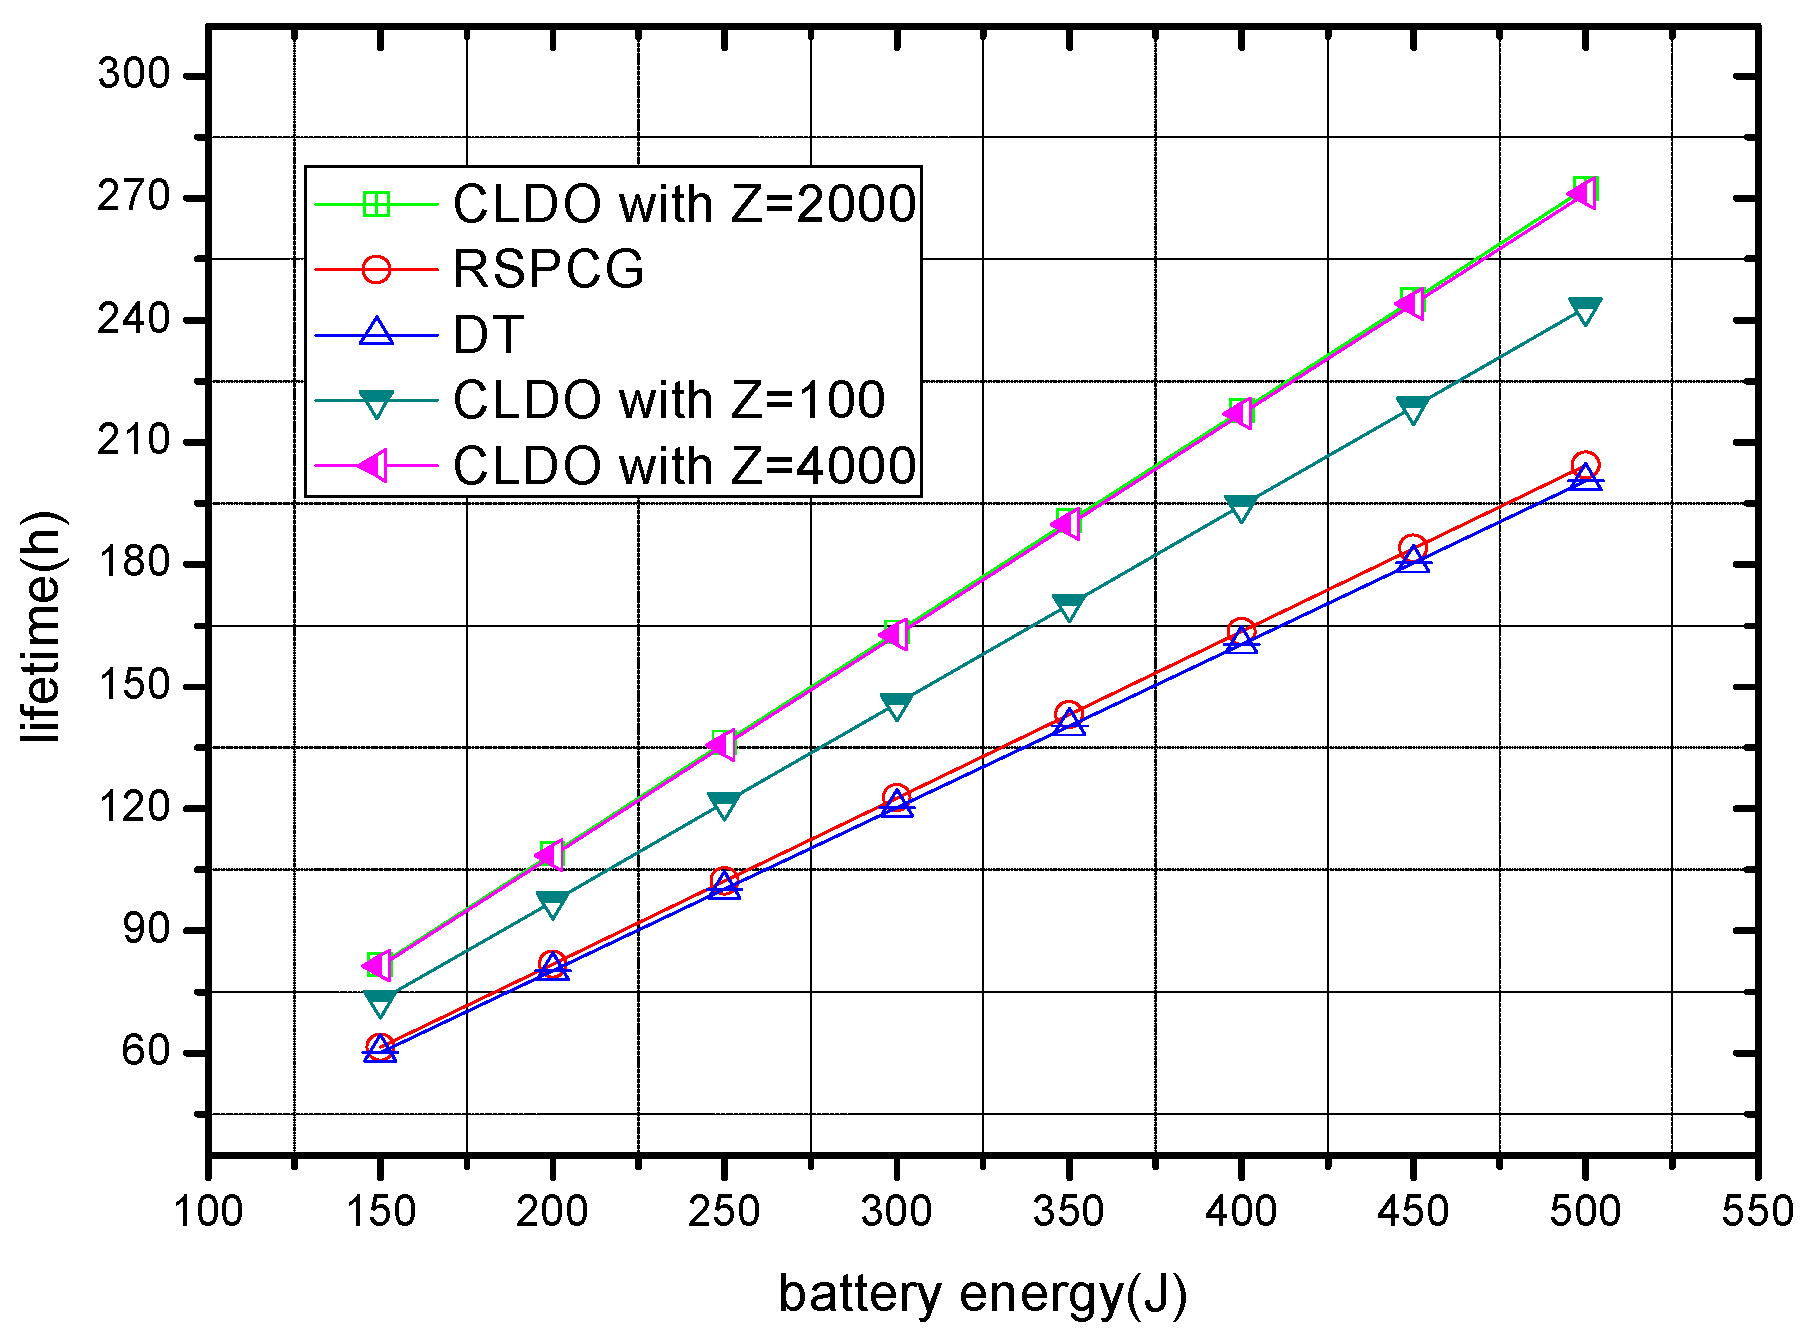
5.5. Network Lifetime of the CLDO Scheme
6. Experimental Results and Analysis of the CLDO Scheme
6.1. Experimental Parameter Settings
6.2. Experimental Results of the CLDO Scheme
6.3. End-to-End Delay and Jitter of the CLDO Scheme
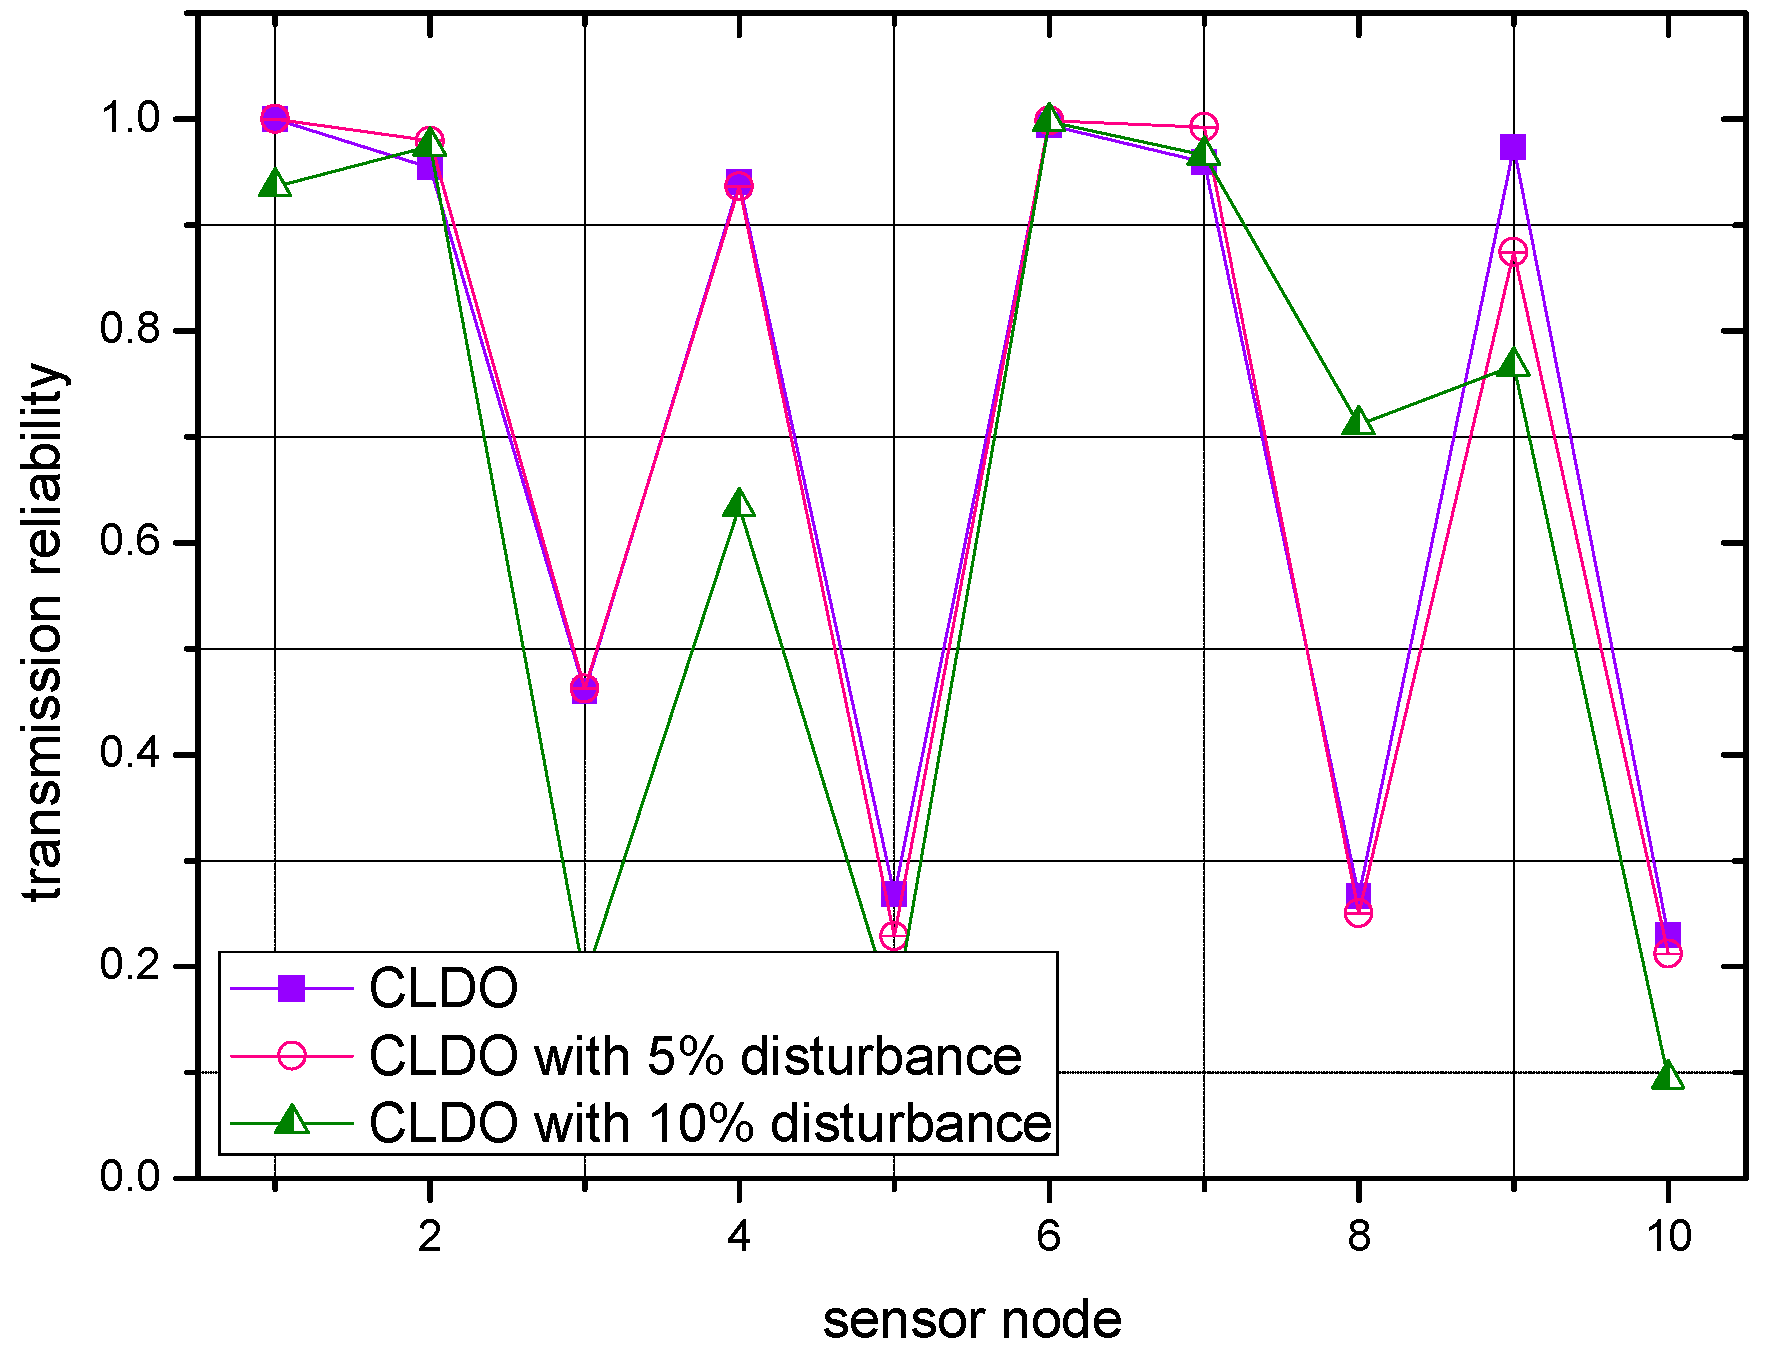
6.4. Transmission Reliablity of the CLDO Scheme
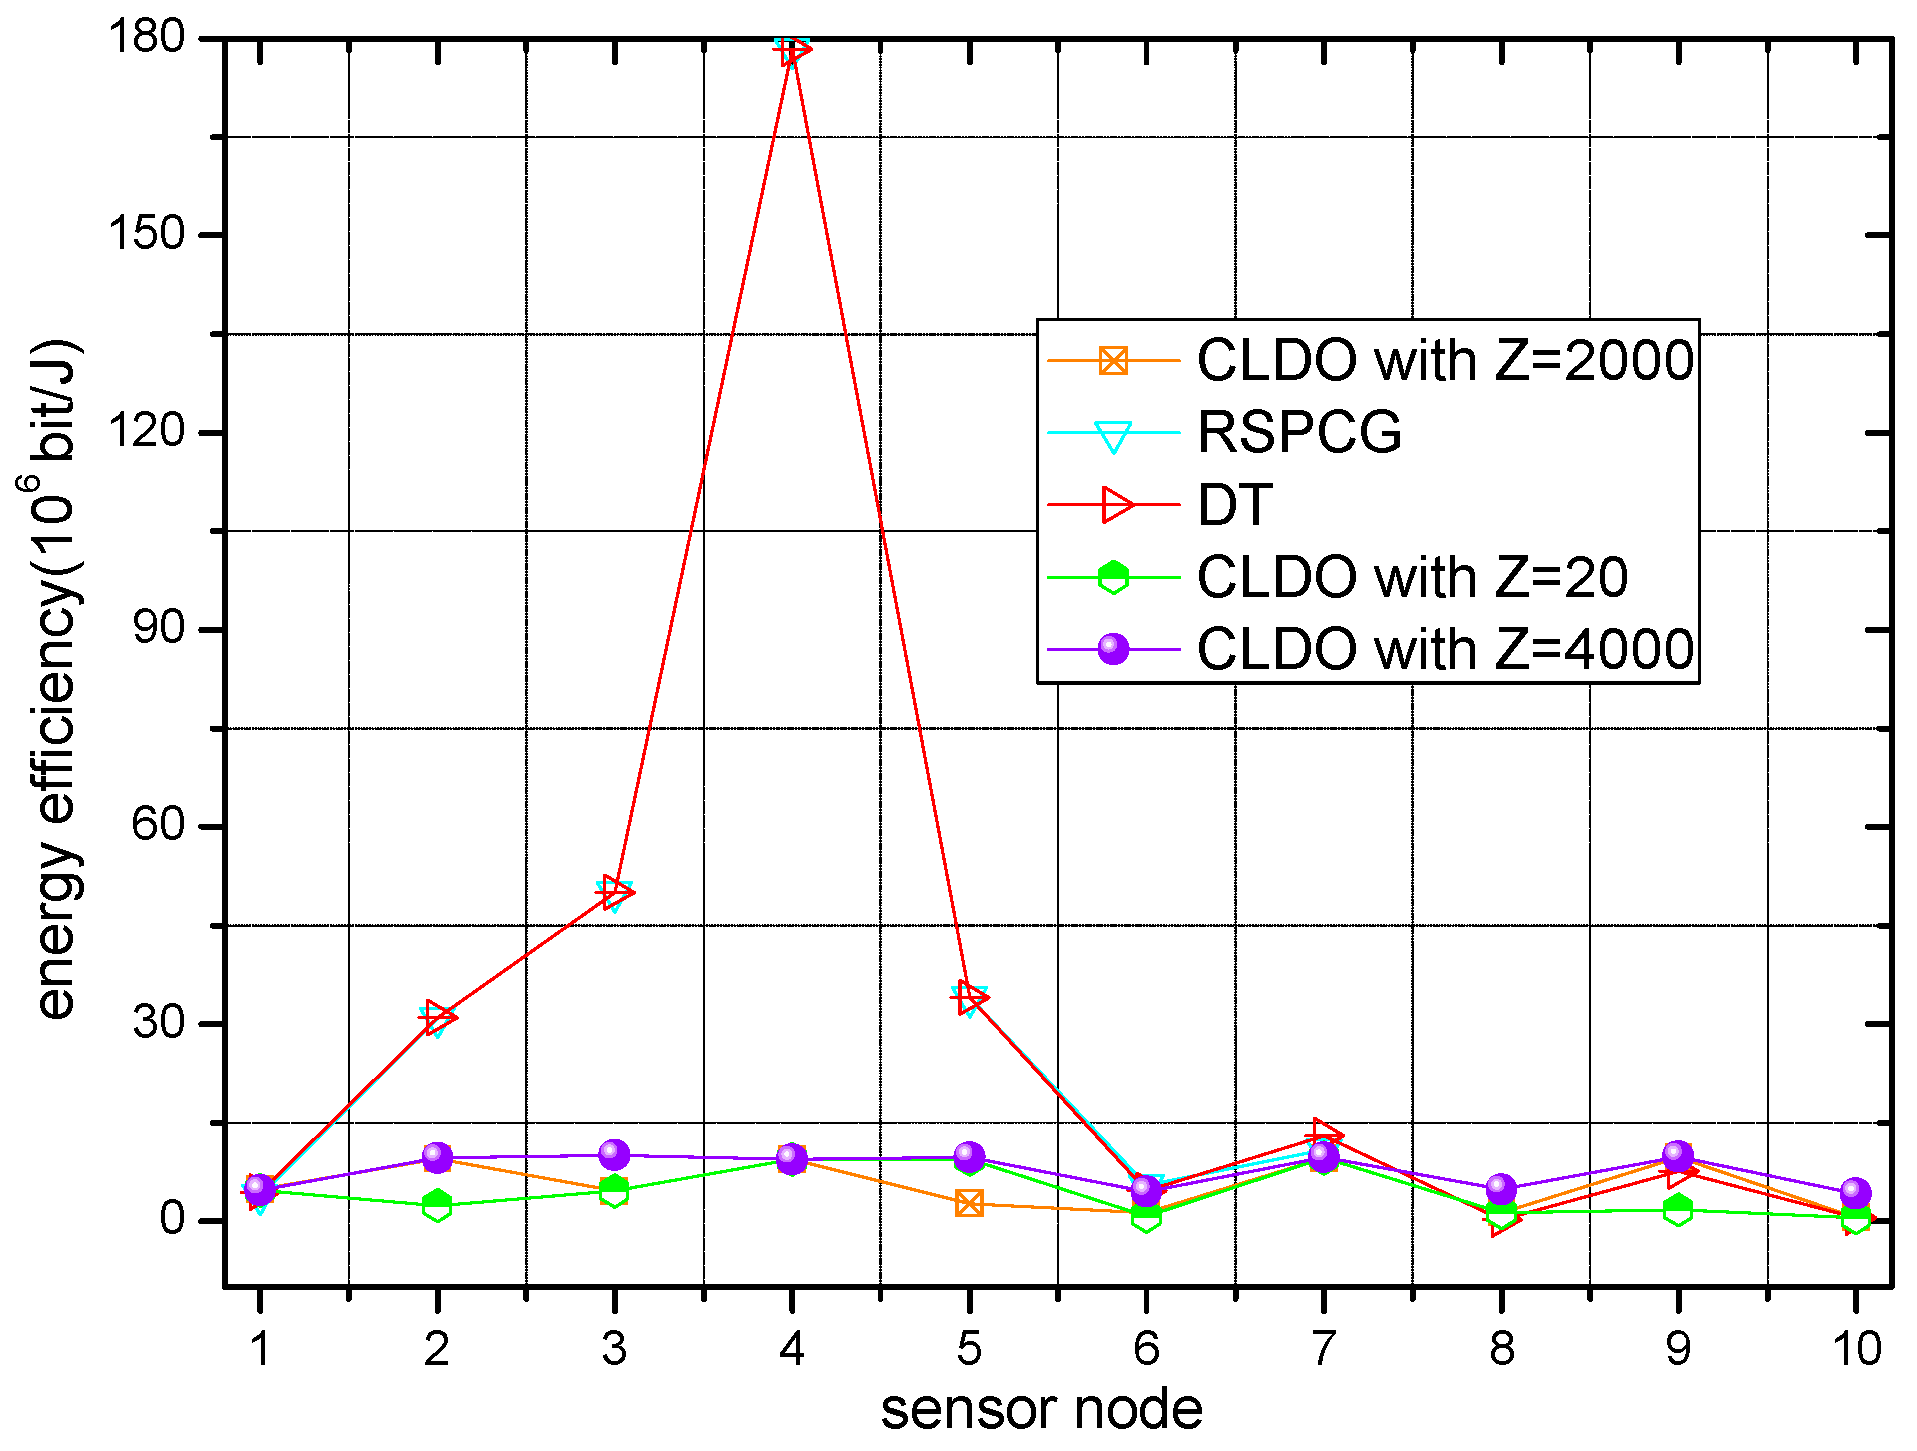
6.5. Energy Efficiency of the CLDO Scheme
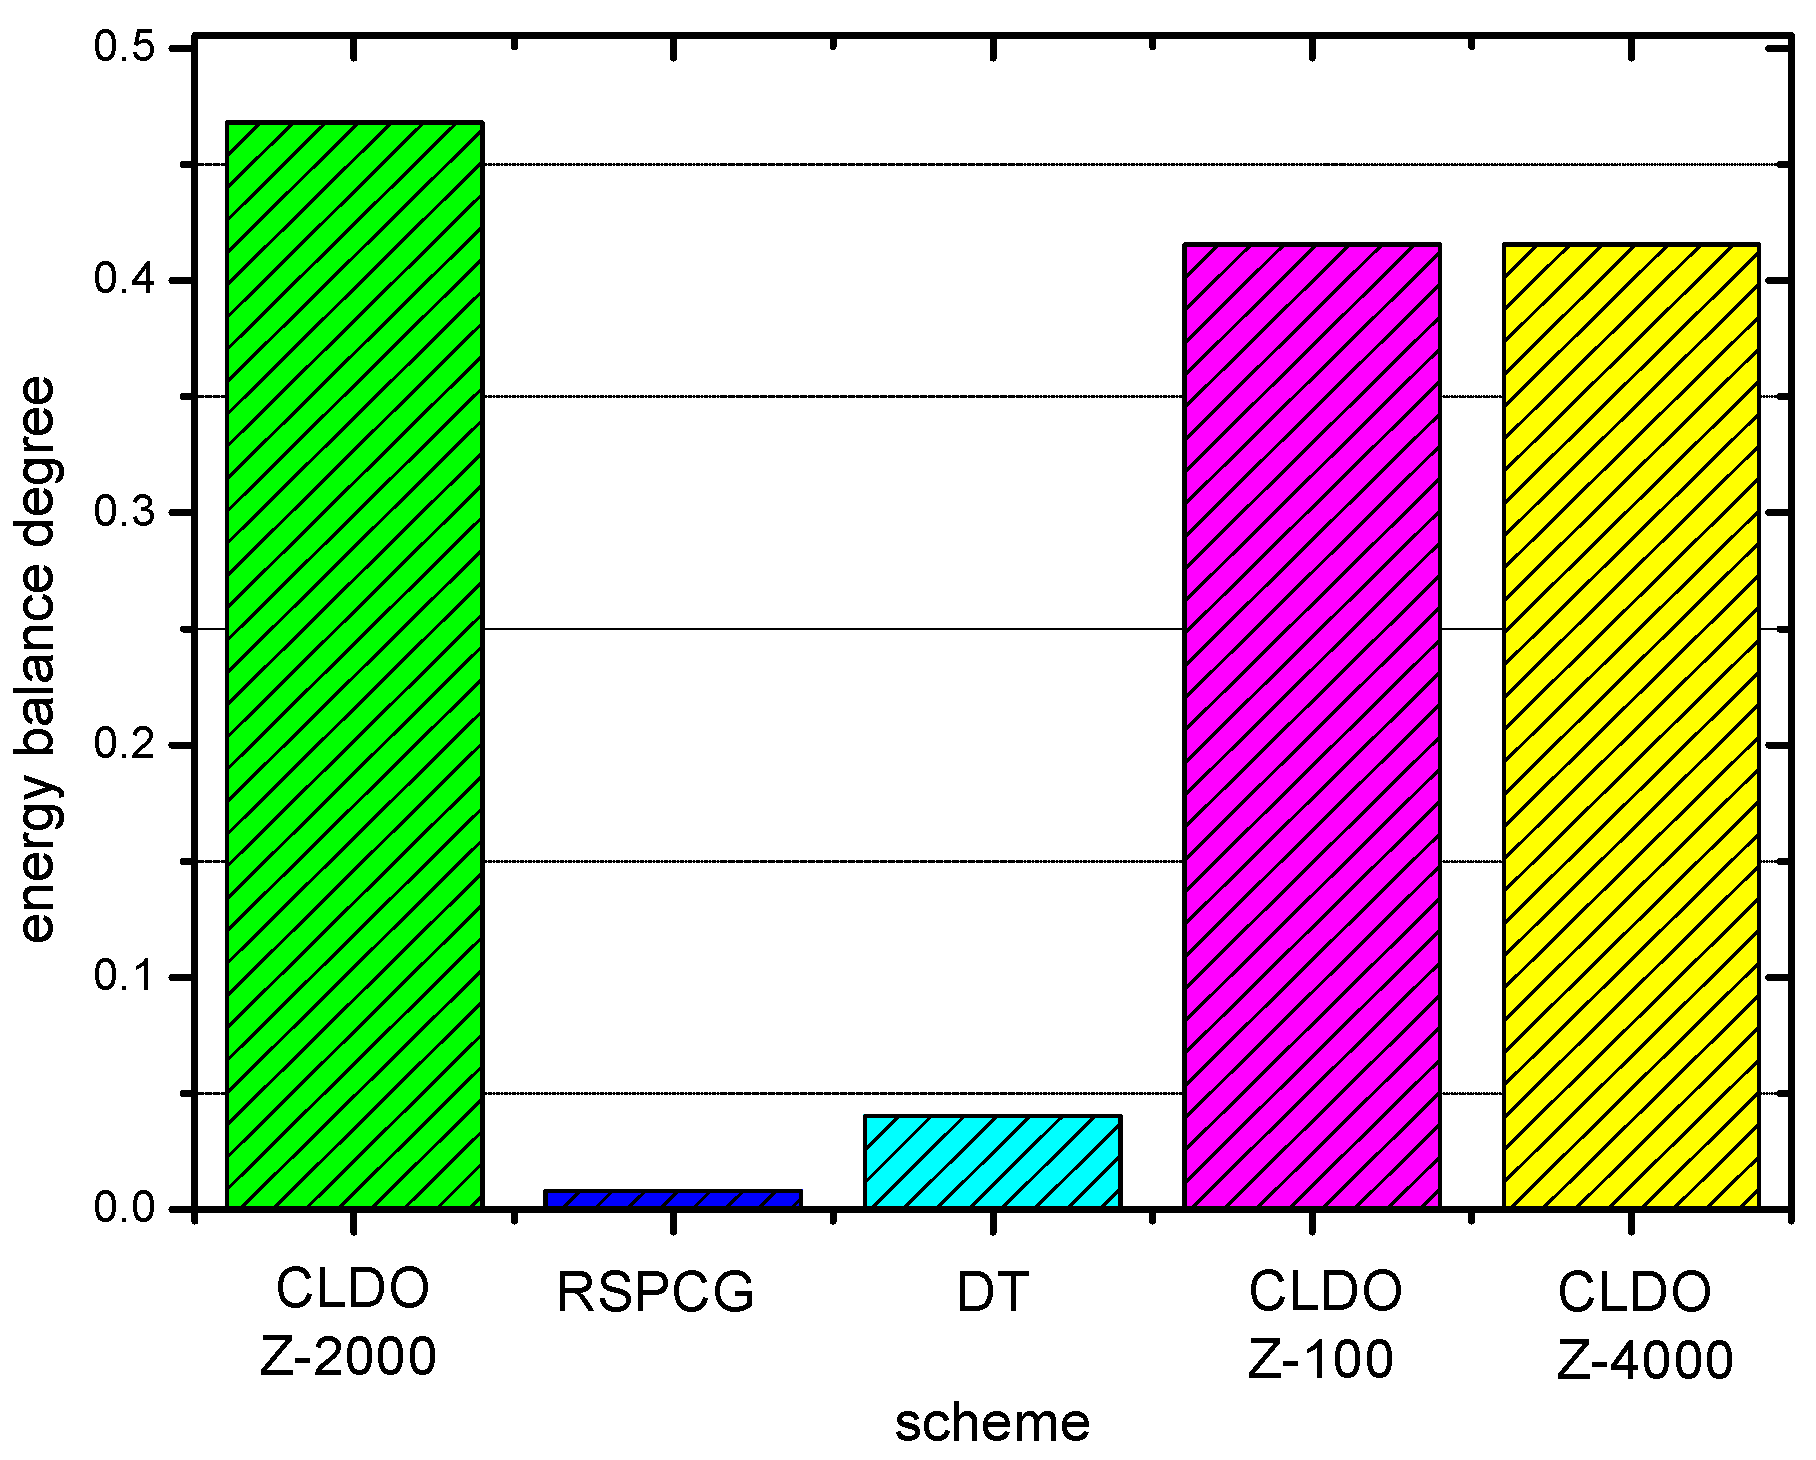
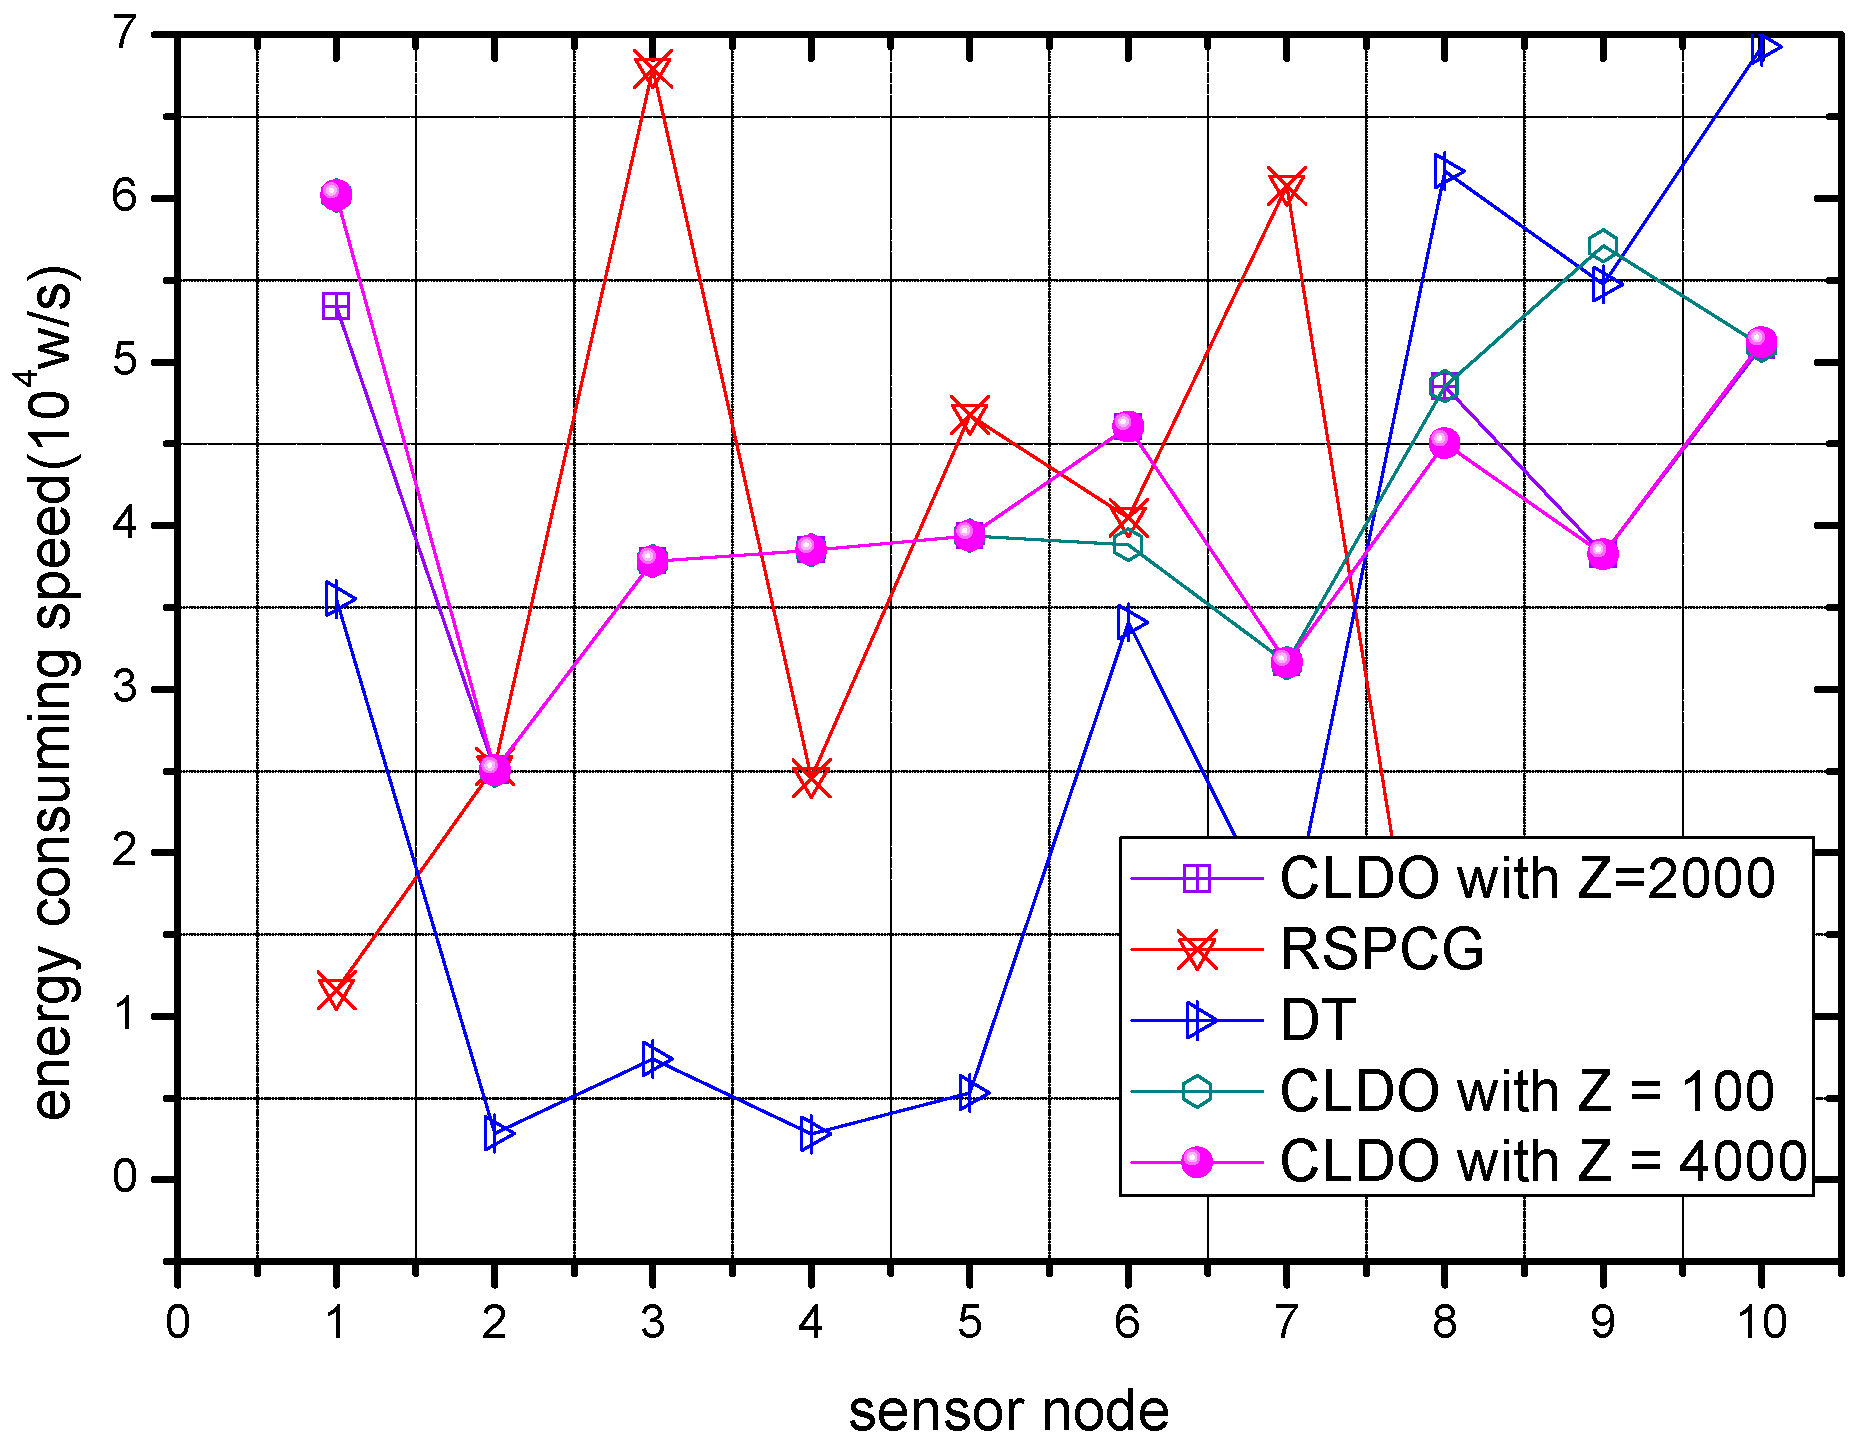
6.6. Energy Balance Degree of the CLDO Scheme
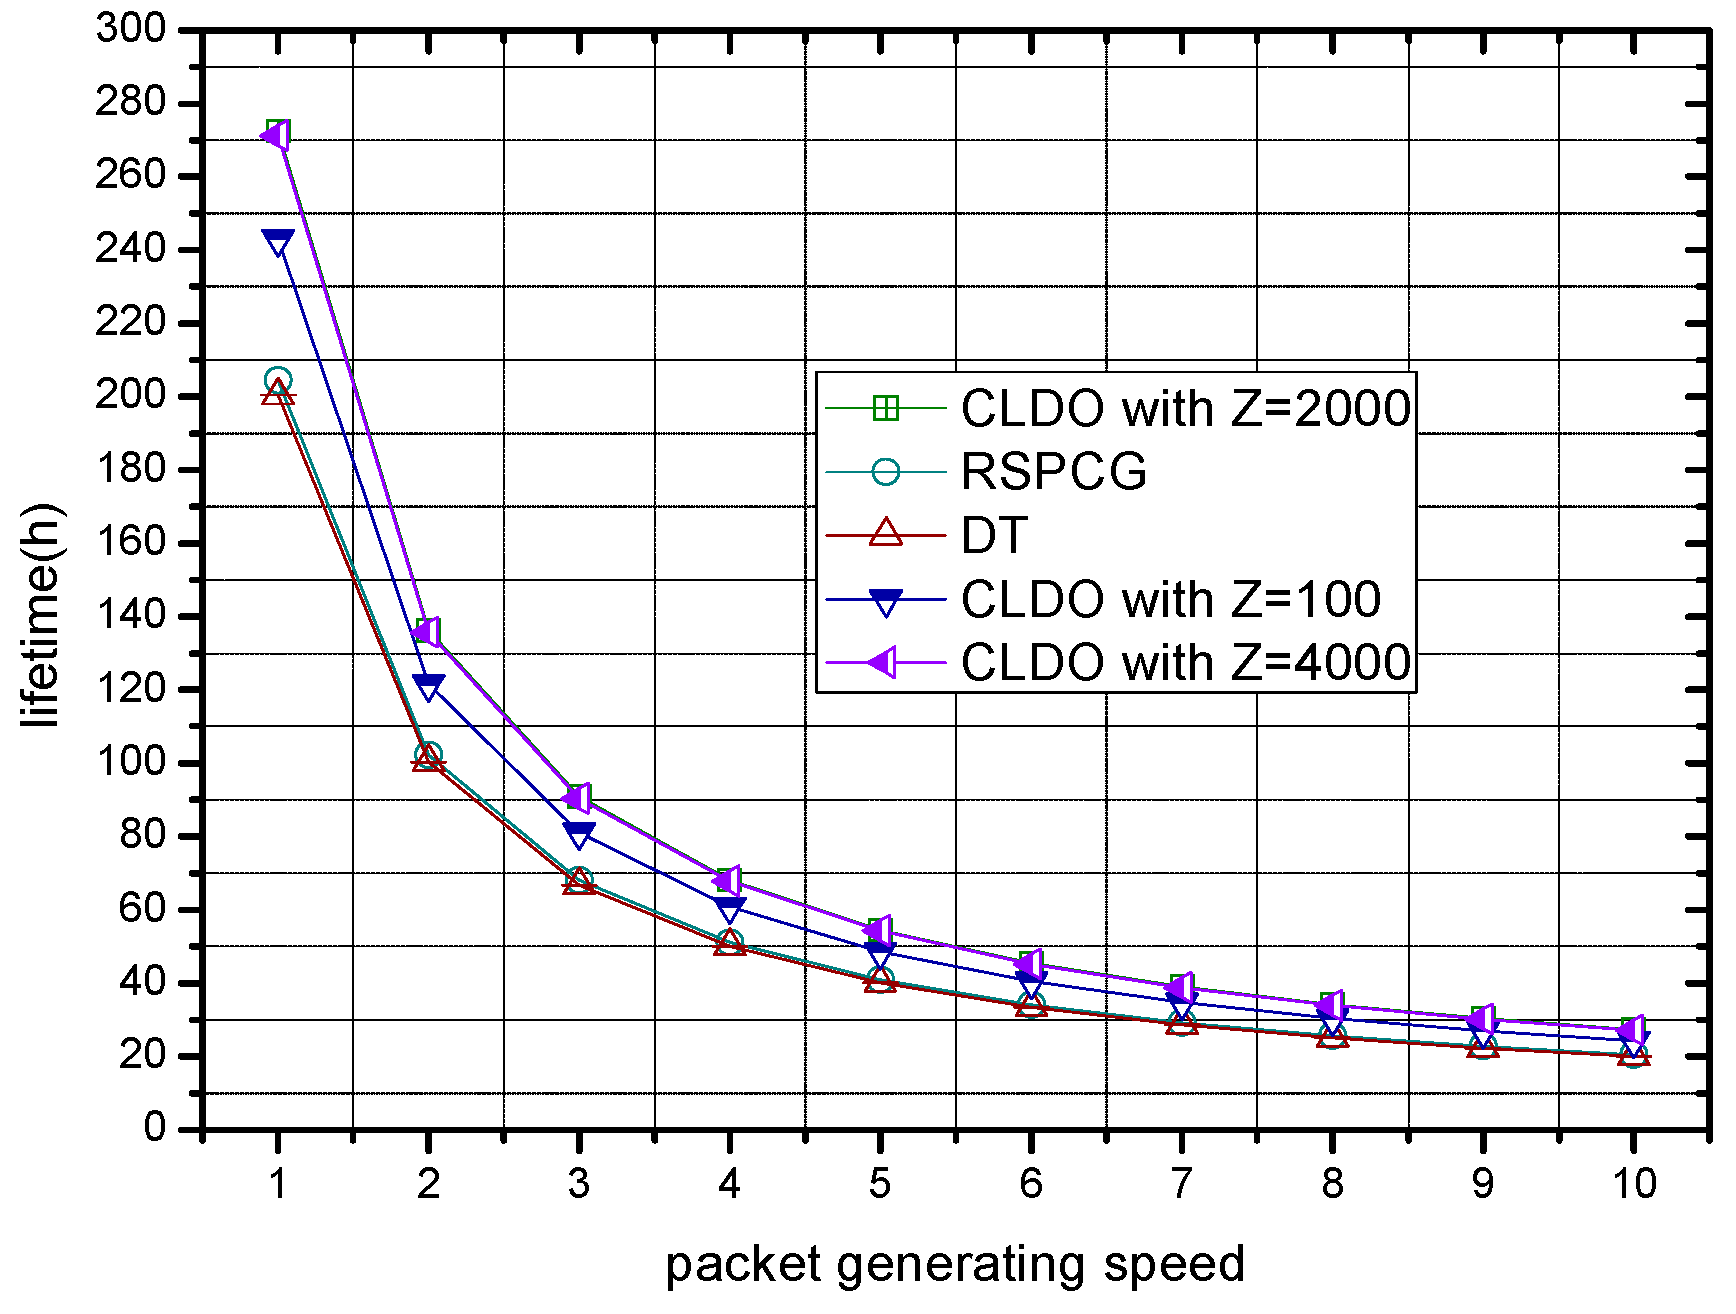
6.7. Lifetime of the CLDO Scheme
6.8. Study on Body Movement
- ①
- CLDO has complex procedures during network initialization, which is costly in both consumption and time.
- ②
- The value of the number of iterations in the CLDO algorithm influences its performance to a considerable degree, but we cannot guarantee the rationality of its setting sometimes.
- ③
- Since the network will be reinitialized whenever a sensor node enters or leaves the WBAN, therefore, the CLDO scheme lacks the capacity to deal with dynamic location situations, but from the overall view, the estimable contribution of the CLDO scheme totally warrants such a slight overhead.
7. Conclusions and Future Work
Acknowledgments
Author Contributions
Conflicts of Interest
References
- Gravina, R.; Alinia, P.; Ghasemzadeh, H.; Fortino, G. Multi-sensor fusion in body sensor networks: State-of-the-art and research challenges. Inf. Fusion. 2016, 35, 68–80. [Google Scholar] [CrossRef]
- Fortino, G.; Giannantonio, R.; Gravina, R.; Kuryloski, P. Enabling Effective Programming and Flexible Management of Efficient Body Sensor Network Applications. IEEE Trans. Hum. Mach. Syst. 2013, 43, 115–133. [Google Scholar] [CrossRef]
- Fallahzadeh, R.; Ma, Y.; Ghasemzadeh, H. Context-Aware System Design for Remote Health Monitoring: An Application to Continuous Edema Assessment. IEEE Trans. Mob. Comput. 2016. [Google Scholar] [CrossRef]
- Liu, Y.; Liu, A.; Hu, Y.; Li, Z.; Choi, Y.-J.; Sekiya, H.; Li, J. FFSC: An Energy Efficiency Communications Approach for Delay Minimizing in Internet of Things. IEEE Access 2016, 4, 3775–3793. [Google Scholar] [CrossRef]
- Liu, X.; Liu, A.; Deng, Q.; Liu, H. Large-scale Programing Code Dissemination for Software Defined Wireless Networks. Comput. J. 2017. [Google Scholar] [CrossRef]
- Xu, Y.; Liu, A.; Huang, C. Delay-Aware Program Codes Dissemination Scheme in Internet of Everything. Mob. Inf. Syst. 2016. [Google Scholar] [CrossRef]
- Moosavi, H.; Bui, F.M. Optimal relay selection and power control with quality-of-service provisioning in wireless body area networks. IEEE Trans. Wirel. Commun. 2016, 15, 5497–5510. [Google Scholar] [CrossRef]
- Li, T.; Zhao, M.; Liu, A.; Huang, C. On Selecting Vehicles as Recommenders for Vehicular Social Networks. IEEE Access 2017. [Google Scholar] [CrossRef]
- Tang, Z.; Liu, A.; Huang, C. Social-aware Data Collection Scheme through Opportunistic Communication in Vehicular Mobile Networks. IEEE Access 2016, 4, 6480–6502. [Google Scholar] [CrossRef]
- Liu, Y.; Dong, M.; Ota, K.; Liu, A. ActiveTrust: Secure and Trustable Routing in Wireless Sensor Networks. IEEE Trans. Inf. Forensics Secur. 2016, 11, 2013–2027. [Google Scholar] [CrossRef]
- Meshkati, F.; Poor, H.V.; Schwartz, S.C.; Balan, R.V. Energy-efficient resource allocation in wireless networks with quality-of-service constraints. IEEE Trans. Commun. 2007, 57, 3406–3414. [Google Scholar] [CrossRef]
- Goodman, D.; Mandayam, N. Power control for wireless data. IEEE Pers. Commun. 2000, 7, 48–54. [Google Scholar] [CrossRef]
- Dong, M.; Ota, K.; Yang, L.T.; Liu, A. LSCD: A Low Storage Clone Detecting Protocol for Cyber-Physical Systems. IEEE Trans. Comput. Aided Des. Integr. Circuits Syst. 2016, 35, 712–723. [Google Scholar] [CrossRef]
- Xie, R.; Liu, A.; Gao, J. A residual energy aware schedule scheme for WSNs employing adjustable awake/sleep duty cycle. Wirel. Pers. Commun. 2016, 90, 1859–1887. [Google Scholar] [CrossRef]
- Hui, Y.; Su, Z.; Guo, S. Utility Based Data Computing Scheme to Provide Sensing Service in Internet of Things. IEEE Trans. Emerg. Top. Comput. 2017. [Google Scholar] [CrossRef]
- Zimmerman, T.G. Personal area networks: Near-field intrabody communication. IBM Syst. J. 1996, 35, 609–617. [Google Scholar] [CrossRef]
- Hu, Y.; Dong, M.; Ota, K.; Liu, A. Mobile Target Detection in Wireless Sensor Networks with Adjustable Sensing Frequency. IEEE Syst. J. 2016, 10, 1160–1171. [Google Scholar] [CrossRef]
- Proakis, J.G.; Salehi, M. Digital Communications, 5th ed.; McGraw-Hill Education: New York, NY, USA, 2007. [Google Scholar]
- Liu, X.; Dong, M.; Ota, K.; Hung, P.; Liu, A. Service Pricing Decision in Cyber-Physical Systems: Insights from Game Theory. IEEE Trans. Serv. Comput. 2016, 9, 186–198. [Google Scholar] [CrossRef]
- Roy, S.V.; Quitin, F.; Liu, L.; Oestges, C. Dynamic channel modeling for multi-sensor body area networks. IEEE Trans. Antennas Propag. 2013, 61, 2200–2208. [Google Scholar]
- Yazdandoost, K.Y.; Sayrafian-Pour, K. Channel Model for Body Area Network (BAN). 2009. https://mentor.ieee.org/802.15/dcn/08/15-08-0780-09-0006-tg6-channel-model.pdf (accessed on 15 April 2017).
- Li, T.; Liu, A.; Huang, C. A Similarity Scenario-based Recommendation Model with Small Disturbances for Unknown Items in Social Networks. IEEE Access 2016, 4, 9251–9272. [Google Scholar] [CrossRef]
- IEEE Standard for Local and Metropolitan Area Networks—Part 15.6: Wireless Body Area Networks; IEEE Standards Association: Piscataway, NJ, USA, 2012.
- Wang, J.; Hu, C.; Liu, A. Comprehensive Optimization of Energy Consumption and Delay Performance for Green Communication in Internet of Things. Mob. Inf. Syst. 2017, 2017, 3206160. [Google Scholar] [CrossRef]
- Xu, Q.; Su, Z.; Han, B.; Fang, D.; Xu, Z.; Gan, X. Analytical model with a novel selfishness division of mobile nodes to participate cooperation. Peer Peer Netw. Appl. 2016, 9, 712–720. [Google Scholar] [CrossRef]
- Liu, X.; Liu, A.; Huang, C. Adaptive Information Dissemination Control to Provide Diffdelay for Internet of Things. Sensors 2017, 17, 138. [Google Scholar] [CrossRef] [PubMed]
- Su, Z.; Xu, Q.; Hui, Y.; Wen, M.; Guo, S. A Game Theoretic Approach to Parked Vehicle Assisted Content Delivery in Vehicular Ad Hoc Networks. IEEE Trans. Veh. Technol. 2016. [Google Scholar] [CrossRef]
- Liu, X.; Dong, M.; Ota, K.; Yang, L.T.; Liu, A. Trace malicious source to guarantee cyber security for mass monitor critical infrastructure. J. Comput. Syst. Sci. 2016. [Google Scholar] [CrossRef]
- Yildiz, H.U.; Tavli, B.; Yanikomeroglu, H. Transmission power control for link-level handshaking in wireless sensor networks. IEEE Sens. J. 2016, 16, 561–576. [Google Scholar] [CrossRef]
- Gross, D.; Harris, C.M. Fundamentals of Queueing Theory, 4th ed.; Wiley: Hoboken, NJ, USA, 2013. [Google Scholar]
- Chen, Z.; Liu, A.; Li, A.; Choi, Y.; Li, J. Distributed Duty Cycle Control for Delay Improvement in Wireless Sensor Networks. Peer-to-Peer Netw. Appl. 2017, 10, 559–578. [Google Scholar] [CrossRef]
- Baz, M.; Mitchell, P.D.; Pearce, D.A.J. Analysis of queuing delay and medium access distribution over wireless multihop pans. IEEE Trans. Veh. Technol. 2015, 64, 2972–2990. [Google Scholar] [CrossRef]
- Liu, A.; Zhang, Q.; Li, Z.; Choi, Y.J.; Li, J.; Komuro, N. A Green and Reliable Communication Modeling for Industrial Internet of Things. Comput. Electr. Eng. 2016. [Google Scholar] [CrossRef]
- Li, H.; Liu, D.; Dai, Y.; Luan, T. Engineering Searchable Encryption of Mobile Cloud Networks: When QoE Meets QoP. IEEE Wirel. Commun. 2015, 22, 74–80. [Google Scholar] [CrossRef]
- He, S.; Shin, D.; Zhang, J.; Chen, J.; Sun, Y. Full-view area coverage in camera sensor networks: Dimension reduction and near-optimal solutions. IEEE Trans. Veh. Technol. 2016, 65, 7448–7461. [Google Scholar] [CrossRef]
- He, S.; Chen, J.; Li, X.; Shen, X.; Sun, Y. Mobility and intruder prior information improving the barrier coverage of sparse sensor networks. IEEE Trans. Mob. Comput. 2014, 13, 1268–1282. [Google Scholar]
- Dong, M.; Ota, K.; Liu, A. RMER: Reliable and Energy Efficient Data Collection for Large-scale Wireless Sensor Networks. IEEE Internet Things J. 2016, 3, 511–519. [Google Scholar] [CrossRef]
- Chen, Z.; Liu, A.; Li, Z.; Choi, Y.; Sekiya, H.; Li, J. Energy-efficient Broadcasting Scheme for Smart Industrial Wireless Sensor Networks. Mob. Inf. Syst. 2017. [Google Scholar] [CrossRef]
- Gui, J.; Zhou, K. Flexible adjustments between energy and capacity for topology control in heterogeneous wireless multi-hop networks. J. Netw. Syst. Manag. 2016, 24, 789–812. [Google Scholar] [CrossRef]
- Ayatollahitafti, V.; Ngadi, M.A.; Sharif, J.M.; Abdullahi, M. An Efficient Next Hop Selection Algorithm for Multi-Hop Body Area Networks. PLoS ONE 2016, 11, e0146464. [Google Scholar] [CrossRef]
- Wang, H.; Agoulmine, N.; Deen, M.J.; Zhao, J. A utility maximization approach for information-communication tradeoff in Wireless Body Area Networks. Pers. Ubiquitous Comput. 2014, 18, 1963–1976. [Google Scholar] [CrossRef]
- Shu, M.; Yuan, D.; Zhang, C.; Wang, Y.; Chen, C. A MAC protocol for medical monitoring applications of wireless body area networks. Sensors 2015, 15, 12906–12931. [Google Scholar] [CrossRef]
- Cai, X.; Li, J.; Yuan, J.; Zhu, W.; Wu, Q. Energy-aware adaptive topology adjustment in wireless body area networks. Telecommun. Syst. 2015, 58, 139–152. [Google Scholar] [CrossRef]
- Duan, X.; Zhao, C.; He, S.; Cheng, P.; Zhang, J. Distributed Algorithms to Compute Walrasian Equilibrium in Mobile Crowdsensing. IEEE Trans. Ind. Electron. 2016. [Google Scholar] [CrossRef]
- Li, H.; Yang, Y.; Luan, T.; Liang, X.; Zhou, L.; Shen, X. Enabling Fine-grained Multi-keyword Search Supporting Classified Sub-dictionaries over Encrypted Cloud Data. IEEE Trans. Dependable Secure Comput. 2016, 13, 312–325. [Google Scholar] [CrossRef]
- Li, H.; Lin, X.; Yang, H.; Liang, X.; Lu, R.; Shen, X. EPPDR: An Efficient Privacy-Preserving Demand Response Scheme with Adaptive Key Evolution in Smart Grid. IEEE Trans. Parallel Distrib. Syst. 2014, 25, 2053–2064. [Google Scholar] [CrossRef]
- Ghani, A.; Naqvi, H.A.; Sher, M.; Khan, Z.S.; Khan, I.; Saqlain, M. Energy efficient communication in body area networks using collaborative communication in Rayleigh fading channel. Telecommun. Syst. 2016, 63, 357–370. [Google Scholar] [CrossRef]
- Domingo, M.C. Packet size optimization for improving the energy efficiency in body sensor networks. ETRI J. 2011, 33, 299–309. [Google Scholar] [CrossRef]
- Chen, X.; Hu, Y.; Liu, A.; Chen, Z. Cross Layer Optimal Design with Guaranteed Reliability under Rayleigh Block Fading Channels. KSII Trans. Int. Inf. Syst. 2013, 7, 3071–3095. [Google Scholar]
- Liu, Y.; Liu, A.; Chen, Z. Analysis and improvement of send-and-wait automatic repeat-reQuest protocols for wireless sensor networks. Wirel. Pers. Commun. 2015, 81, 923–959. [Google Scholar] [CrossRef]
- Deepak, K.S.; Babu, A.V. Enhancing reliability of IEEE 802.15. 6 wireless body area networks in scheduled access mode and error prone channels. Wirel. Pers. Commun. 2016, 89, 93–118. [Google Scholar] [CrossRef]
- Yin, Y.; Hu, F.; Cen, L.; Du, Y.; Wang, L. Balancing Long Lifetime and Satisfying Fairness in WBAN Using a Constrained Markov Decision Process. Int. J. Antennas Propag. 2015, 2015, 657854. [Google Scholar] [CrossRef]
- Huang, C.; Ma, M.; Liu, Y.; Liu, A. Preserving Source Location Privacy for Energy Harvesting WSNs. Sensors 2017, 17, 724. [Google Scholar] [CrossRef]


| Symbol | Description | Value |
|---|---|---|
| Packet Header Size | ||
| Channel Bandwidth | ||
| Battery Energy | ||
| Thermal Noise Spectral Density | ||
| Channel Gain | ||
| Transmission Bit Rate | ||
| Relative Impact Factor | ||
| Packet Generating Speed of Node | ||
| Prescribe Packet Error Rate | ||
| Latency Threshold | ||
| Jitter Threshold | ||
| Iteration Times |
| Number | (1) | (2) | (3) | (4) | (5) | (6) | (7) | (8) | (9) | (10) | (11) |
| Node | Head | LeftArm | LeftHand | Chest | RightArm | RightHand | LeftLeg | LeftFoot | RightLeg | RightFoot | Center |
| Head | LeftArm | LeftHand | Chest | RightArm | RightHand | LeftLeg | LeftFoot | RightLeg | RightFoot | |
|---|---|---|---|---|---|---|---|---|---|---|
| CLDO | LeftArm | Center | Center | Center | Chest | LeftArm | Center | RightLeg | LeftLeg | LeftLeg |
| RSPCG | Center | Center | Chest | LeftArm | Center | Chest | LeftArm | LeftArm | RightArm | RightARm |
| DT | Center | Center | Center | Center | Center | Center | Center | Center | Center | Center |
| Single Link | Multi-Hop Path | |||||
|---|---|---|---|---|---|---|
| CLDO | RSPCG | DT | CLDO | RSPCG | DT | |
| Head | 7.30/33.29 | 5.80/37.58 | 6.92/28.79 | 171.20/137.46 | 12.01/63.9 | 6.92/28.79 |
| LeftArm | 163.89/104.18 | 6.10/32.73 | 7.25/35.97 | 163.89/104.18 | 6.13/32.73 | 7.25/35.97 |
| LeftHand | 417.59/137.74 | 6.39/38.3 | 6.99/30.06 | 417.59/137.74 | 6.44/38.3 | 6.99/30.06 |
| Chest | 607.40/161.5 | 6.10/38.49 | 6.96/29.31 | 607.40/161.5 | 6.19/38.49 | 6.96/29.31 |
| RightArm | 927.69/193.39 | 6.69/46.65 | 6.96/29.46 | 927.69/193.39 | 6.71/46.65 | 6.96/29.46 |
| RightHand | 16.79/41.49 | 6/31.88 | 7.25/32.35 | 944.50/234.88 | 12.79/78.53 | 7.25/32.35 |
| LeftLeg | 11.89/37.89 | 5.89/29.05 | 7.08/32.35 | 11.89/37.89 | 5.97/29.05 | 7.08/32.35 |
| LeftFoot | 13.79/39.37 | 6/30.21 | 7.13/33.36 | 621.19/200.87 | 12.45/68.51 | 7.13/33.36 |
| RightLeg | 8.29/34.44 | 5.80/26.32 | 6.99/30 | 8.29/34.44 | 12.57/72.97 | 6.99/30 |
| RightFoot | 11.50/37.58 | 5.89/28.8 | 7.07/31.73 | 429.09/175.32 | 12.67/75.45 | 7.07/31.73 |
© 2017 by the authors. Licensee MDPI, Basel, Switzerland. This article is an open access article distributed under the terms and conditions of the Creative Commons Attribution (CC BY) license (http://creativecommons.org/licenses/by/4.0/).
Share and Cite
Chen, X.; Xu, Y.; Liu, A. Cross Layer Design for Optimizing Transmission Reliability, Energy Efficiency, and Lifetime in Body Sensor Networks. Sensors 2017, 17, 900. https://doi.org/10.3390/s17040900
Chen X, Xu Y, Liu A. Cross Layer Design for Optimizing Transmission Reliability, Energy Efficiency, and Lifetime in Body Sensor Networks. Sensors. 2017; 17(4):900. https://doi.org/10.3390/s17040900
Chicago/Turabian StyleChen, Xi, Yixuan Xu, and Anfeng Liu. 2017. "Cross Layer Design for Optimizing Transmission Reliability, Energy Efficiency, and Lifetime in Body Sensor Networks" Sensors 17, no. 4: 900. https://doi.org/10.3390/s17040900
APA StyleChen, X., Xu, Y., & Liu, A. (2017). Cross Layer Design for Optimizing Transmission Reliability, Energy Efficiency, and Lifetime in Body Sensor Networks. Sensors, 17(4), 900. https://doi.org/10.3390/s17040900