
A Novel Auto-Sorting System for Chinese Cabbage Seeds

Abstract
:1. Introduction
2. Materials and Methods
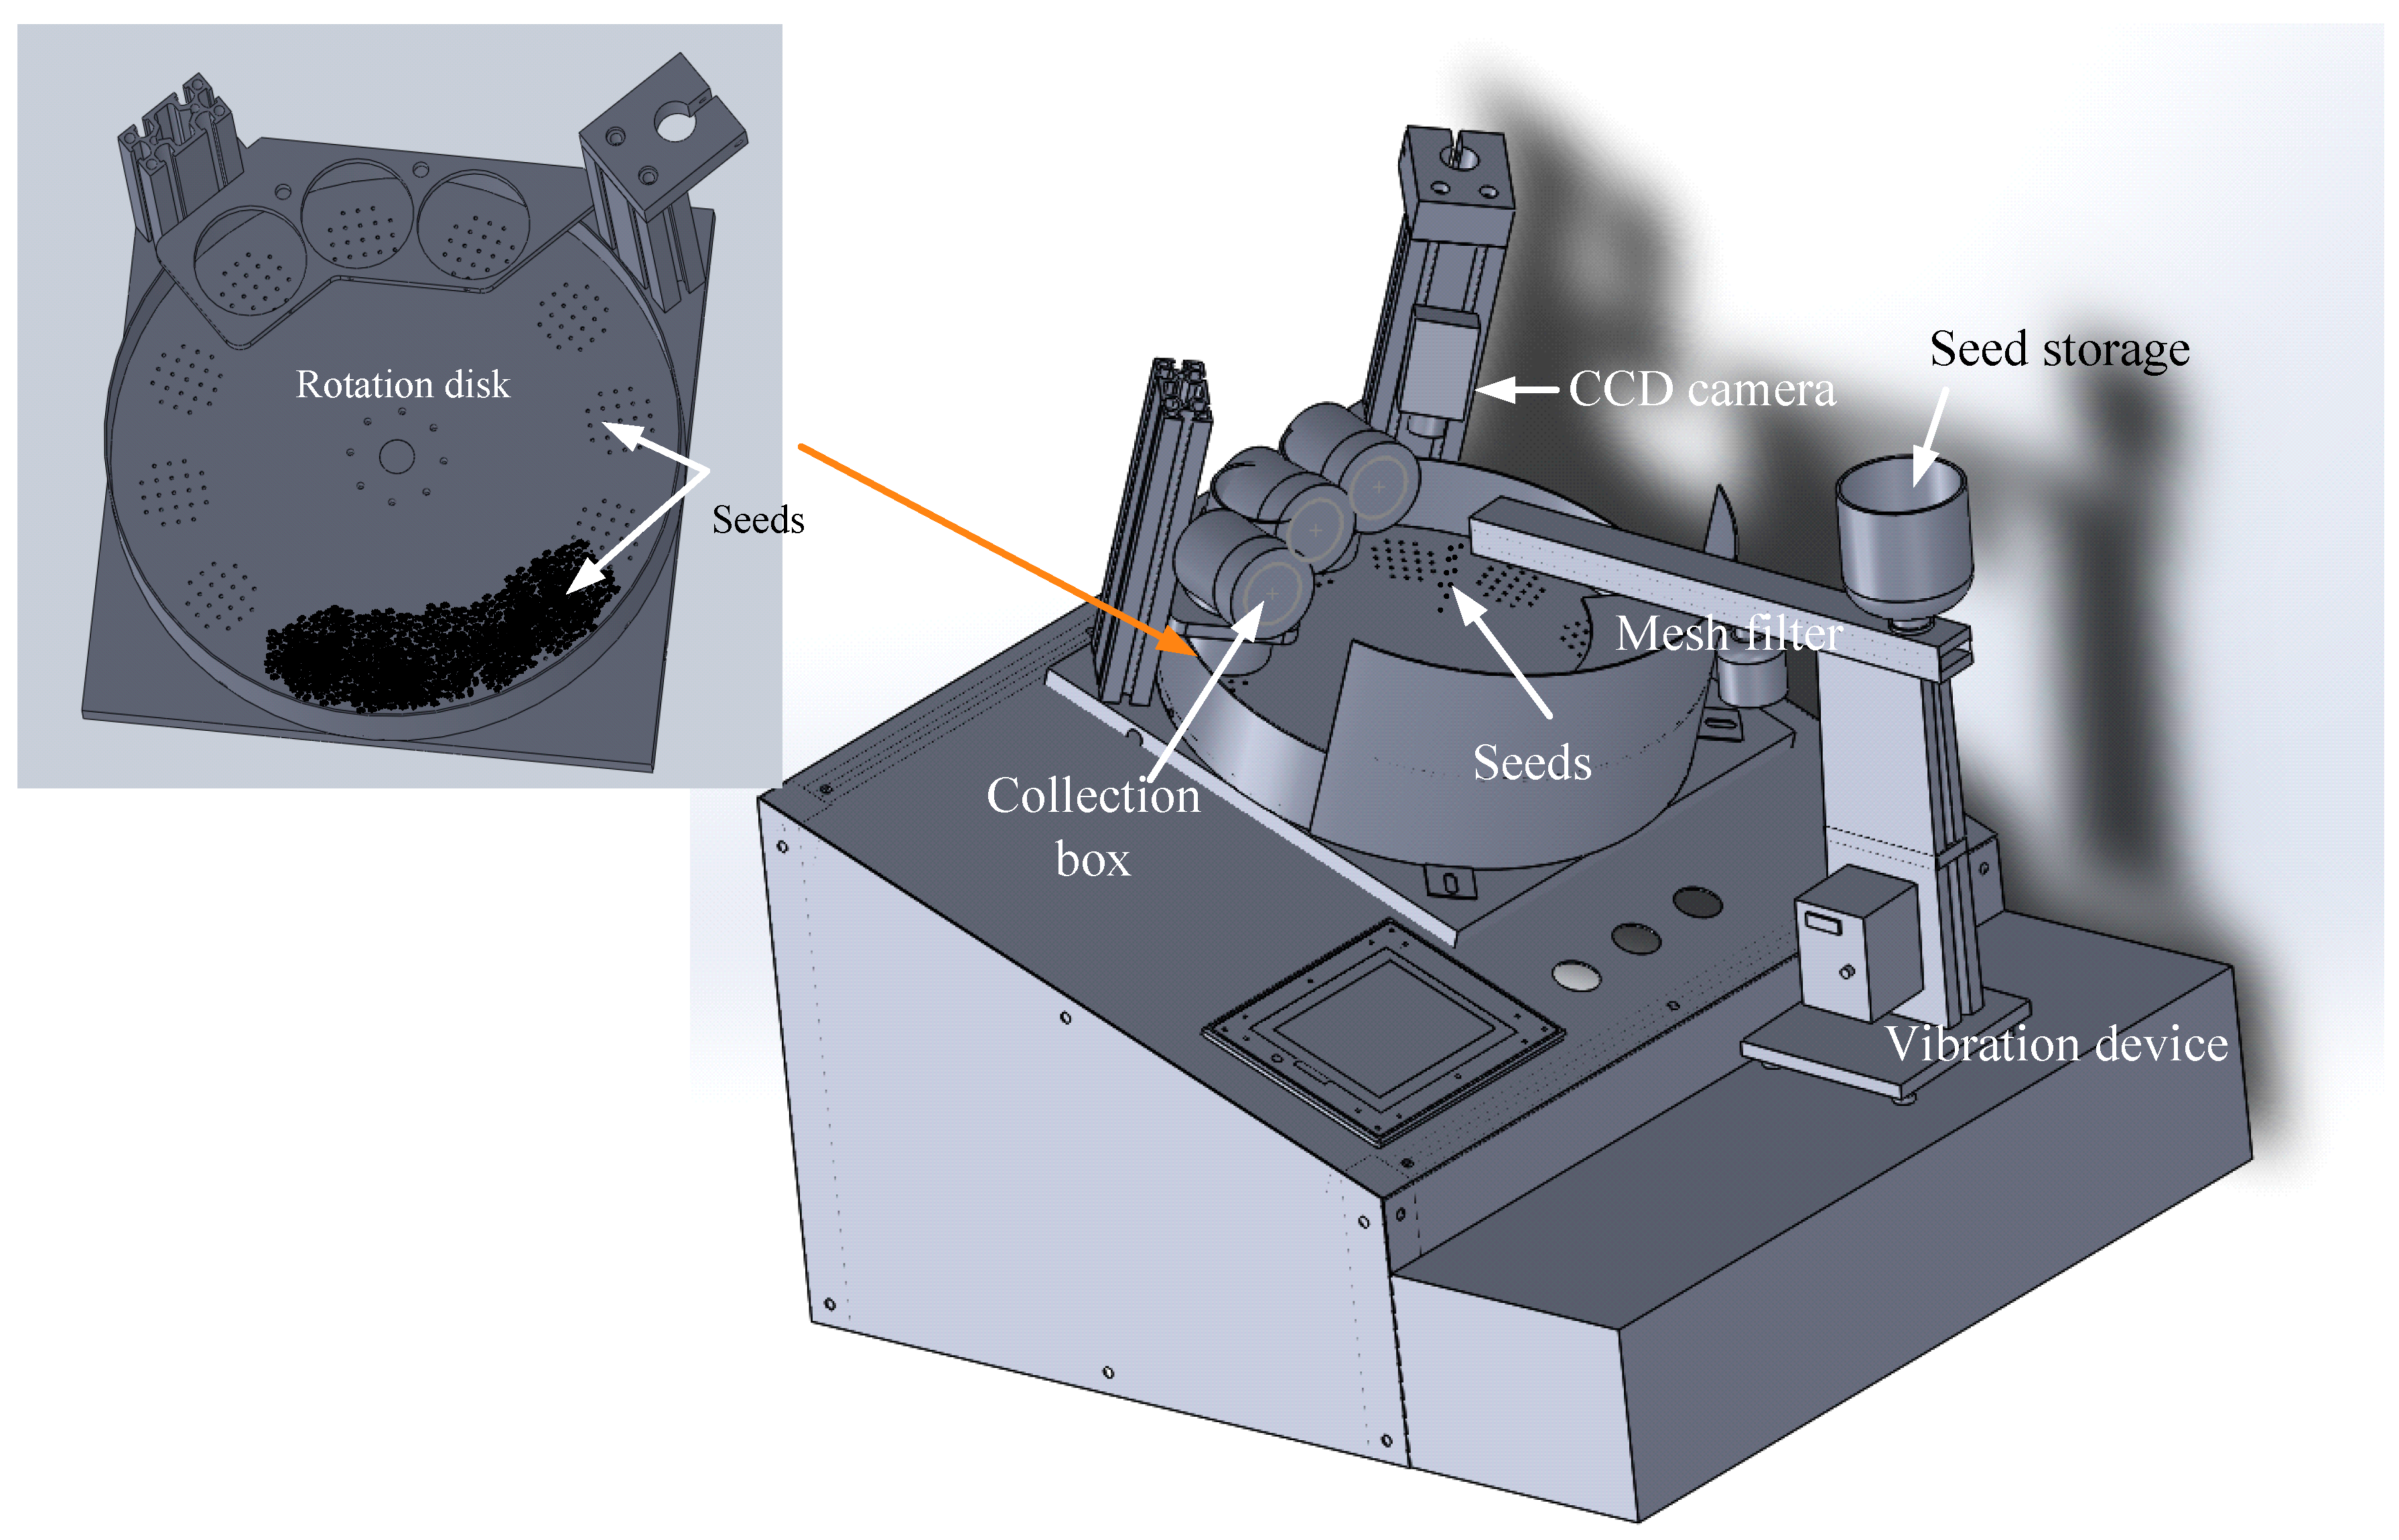
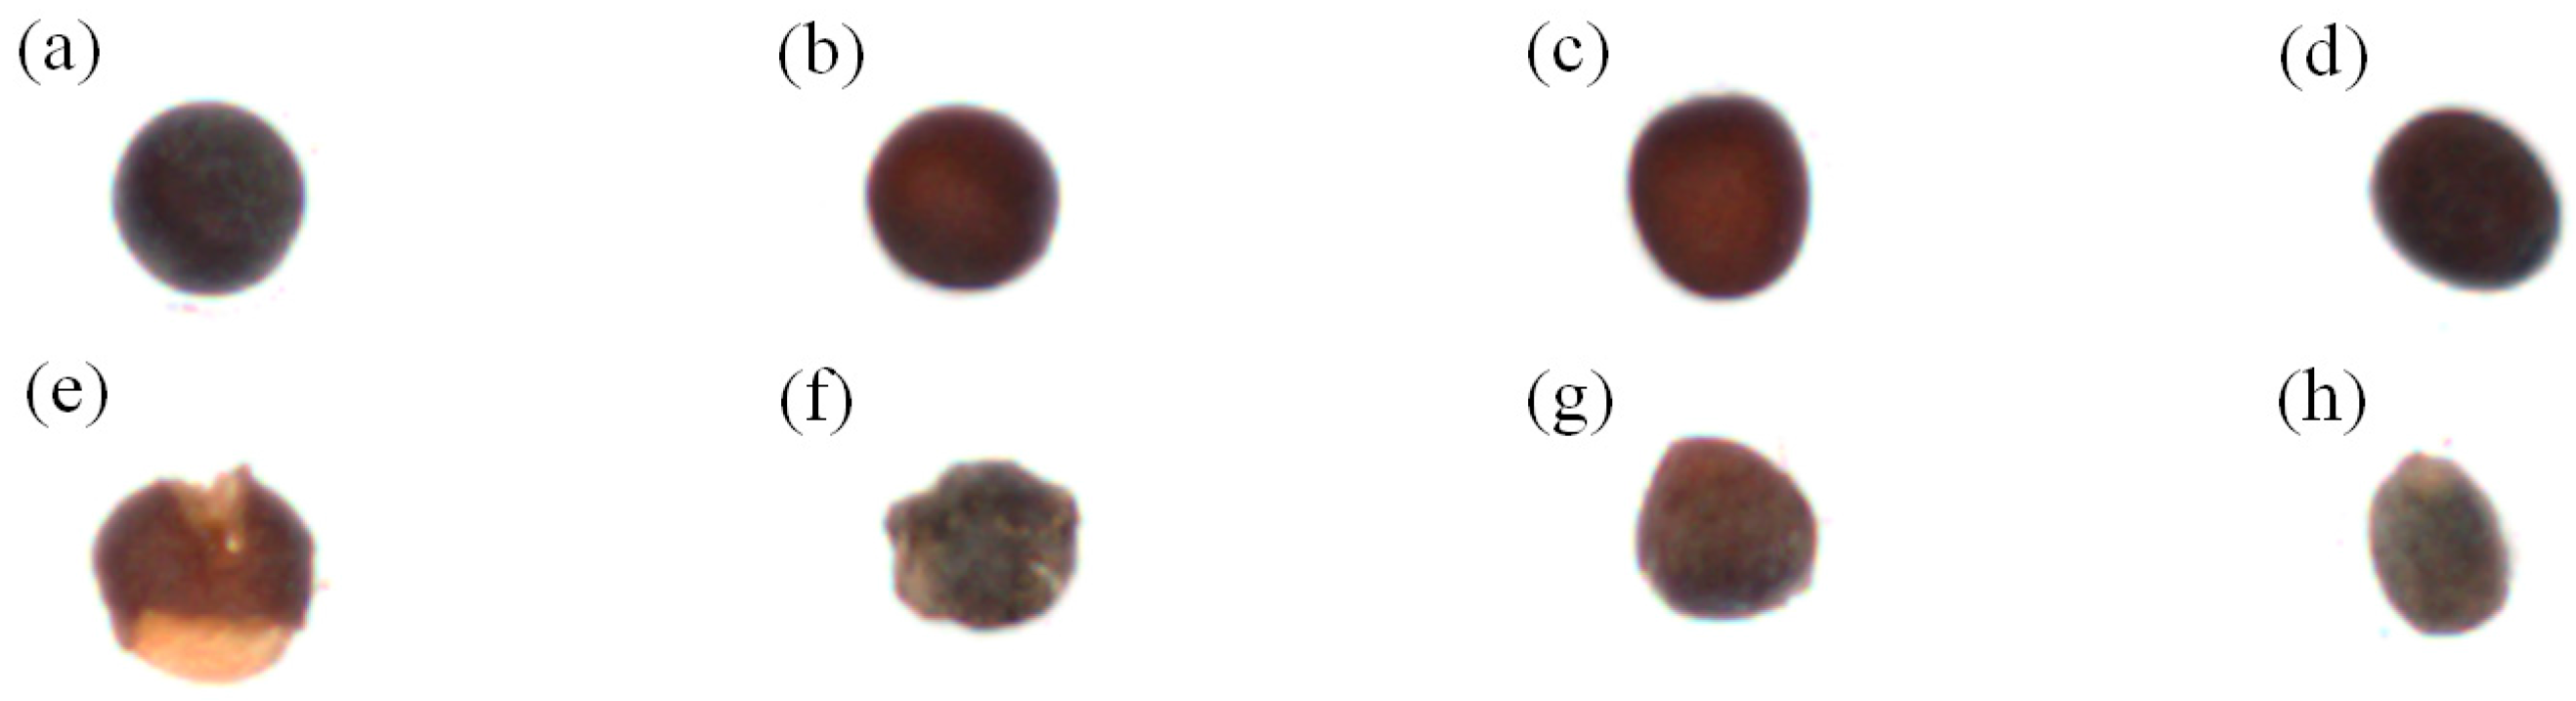
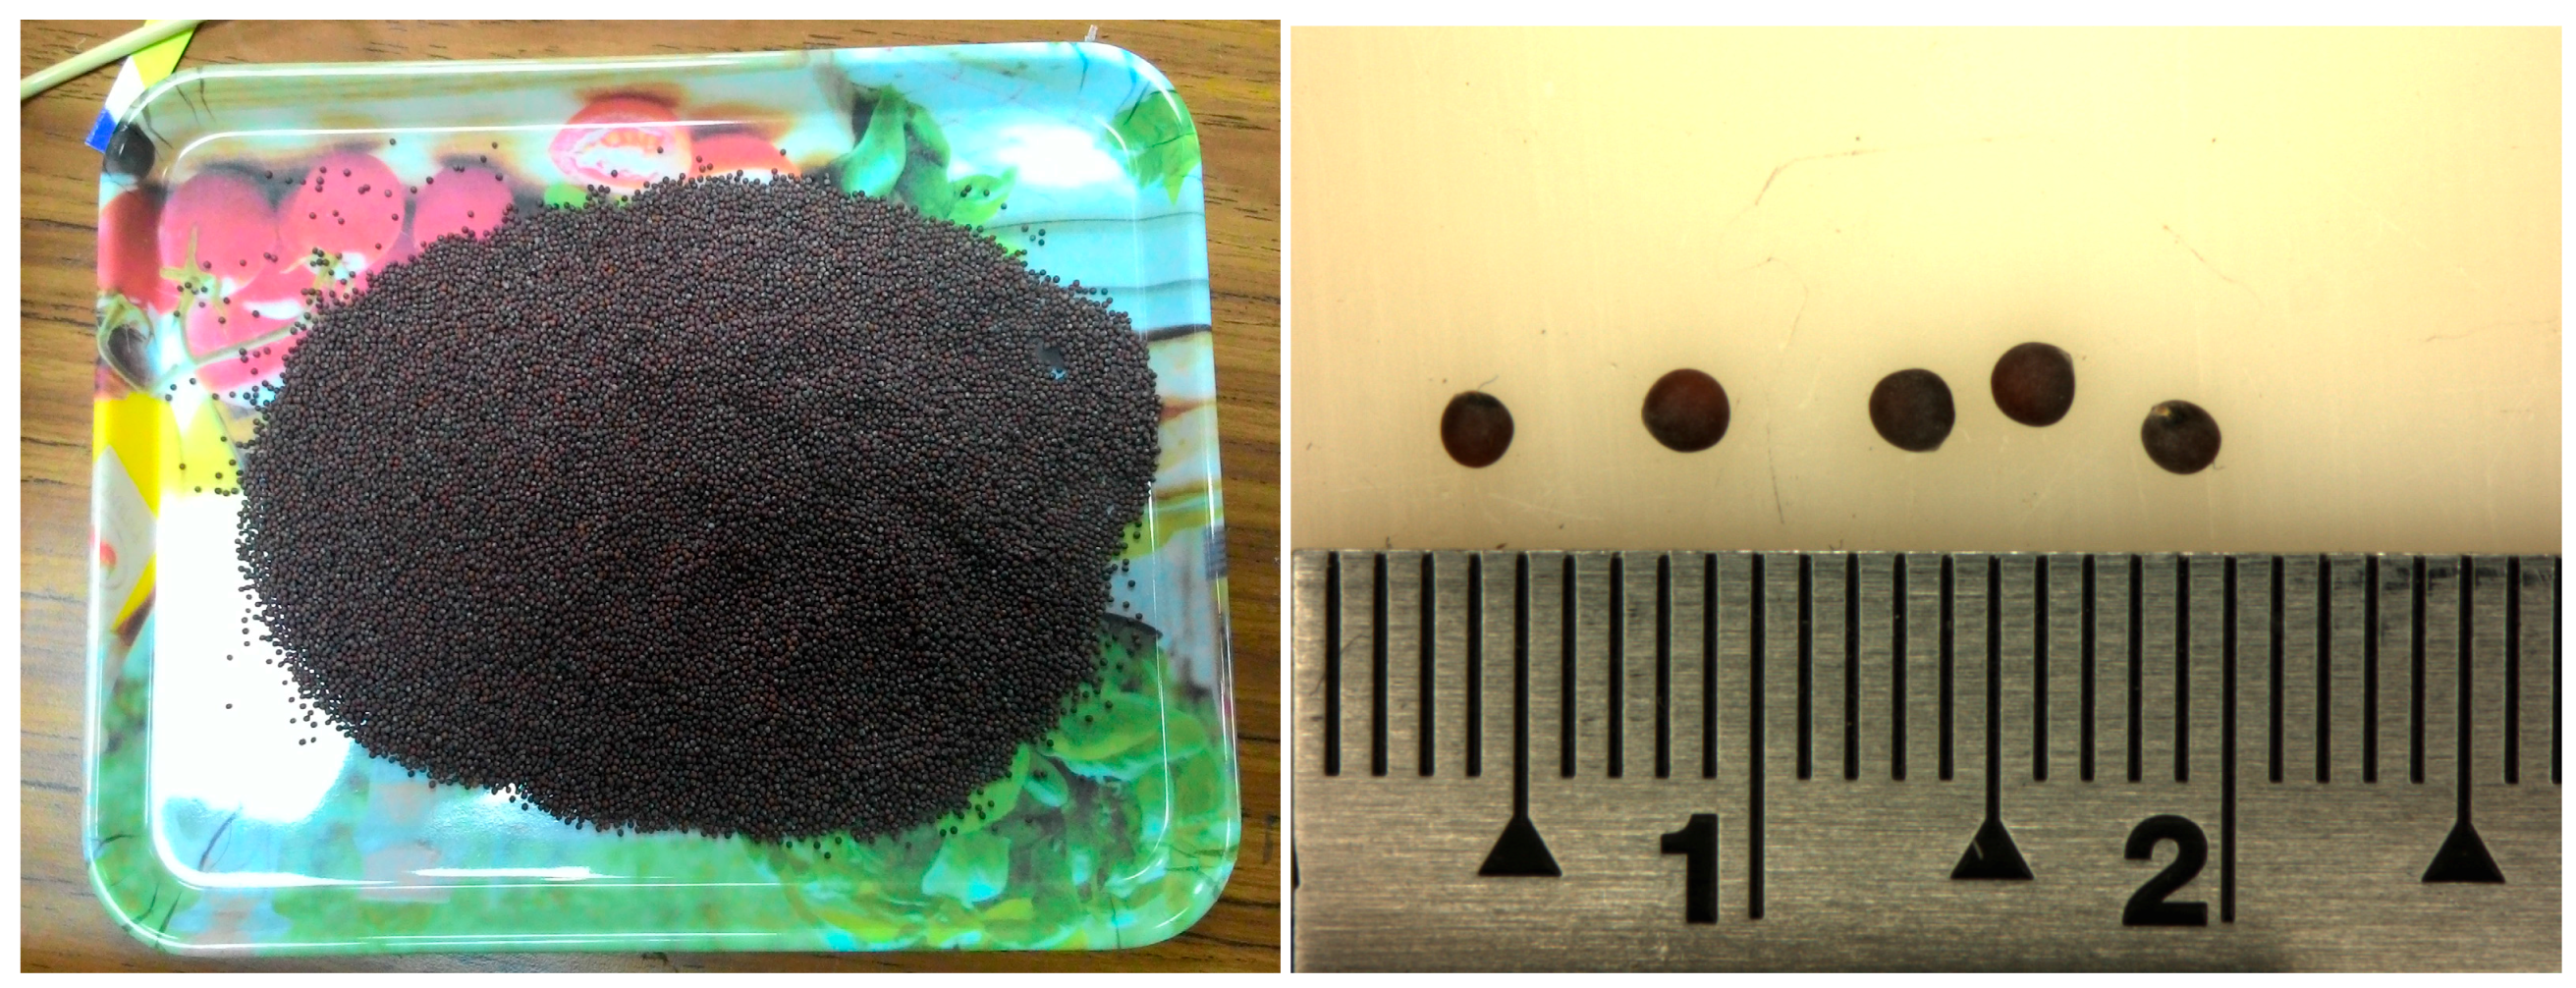
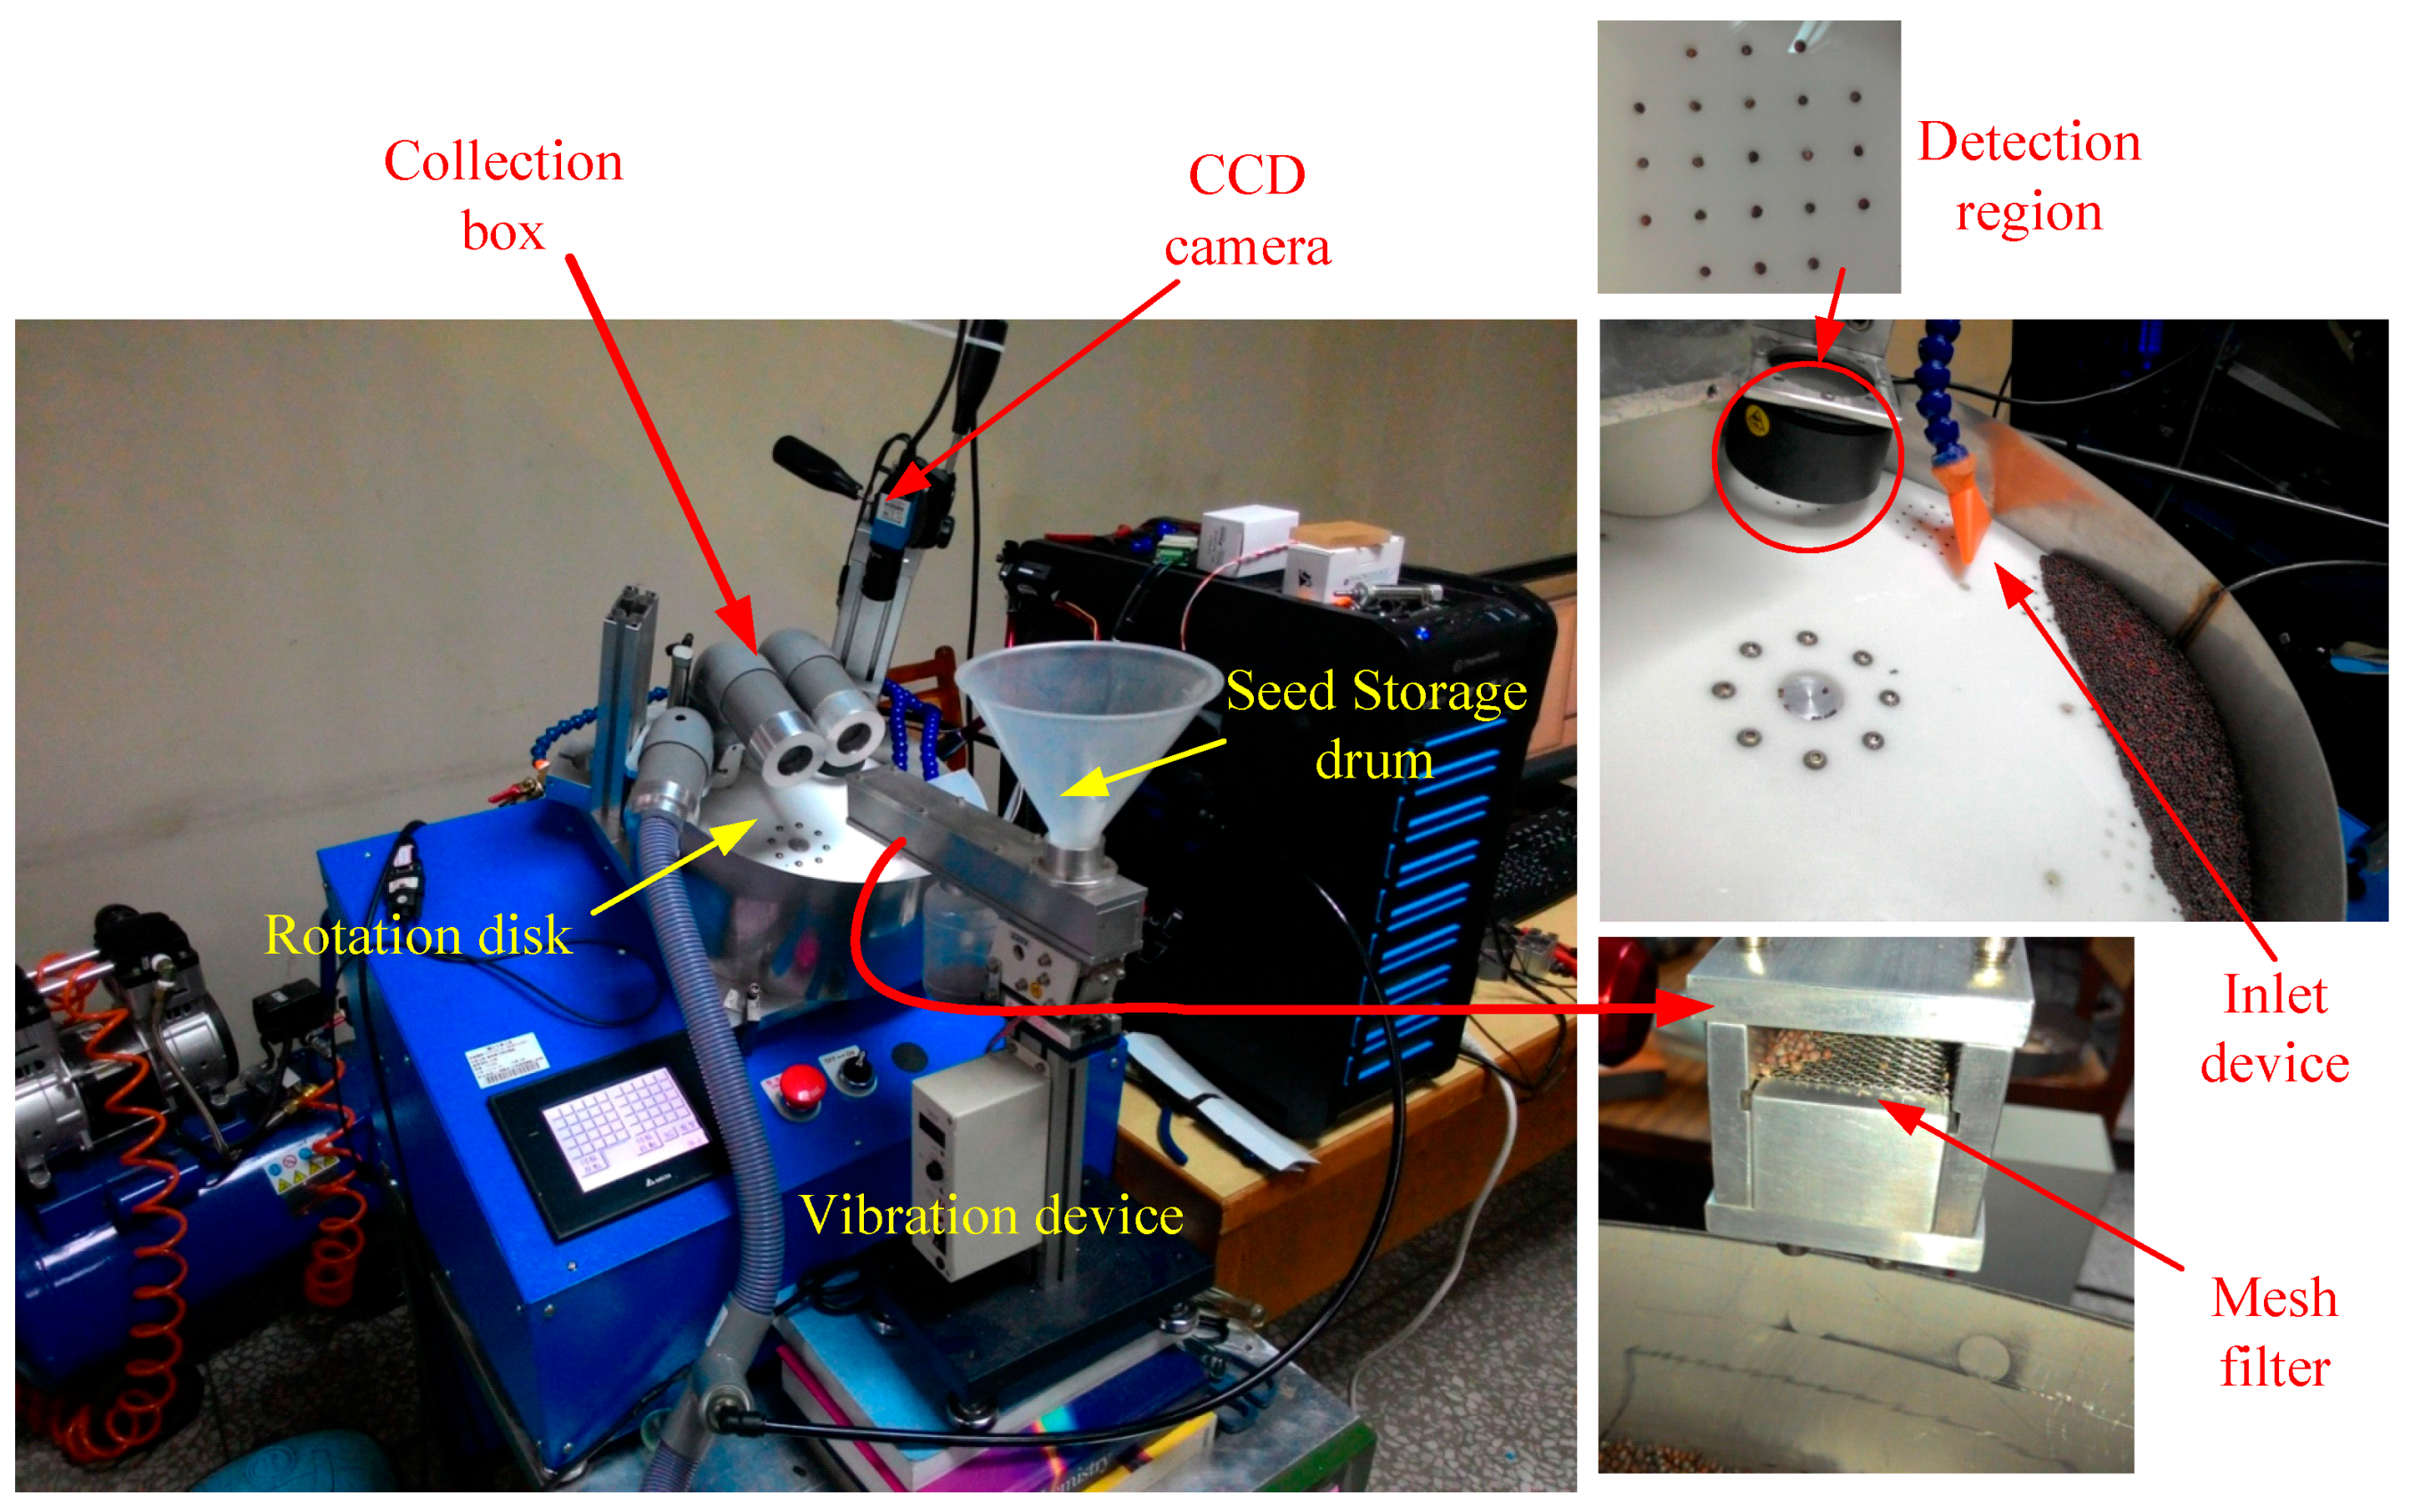
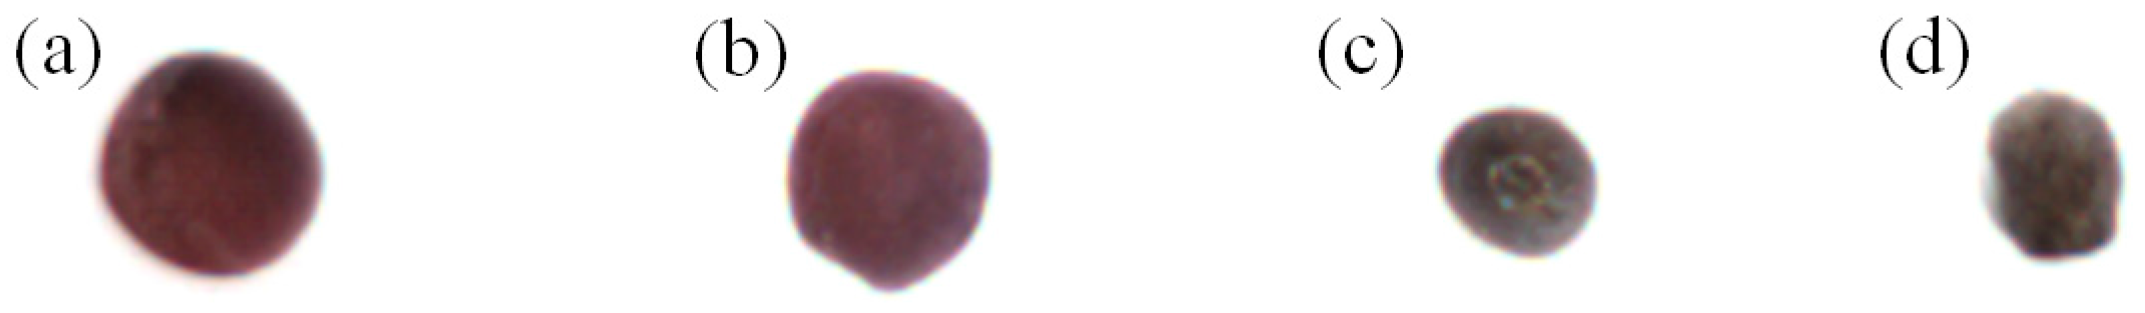
2.1. Image Capture System and Experimental Samples
2.2. Machine Vision System
2.3. Regional Segmentation and Feature Extraction
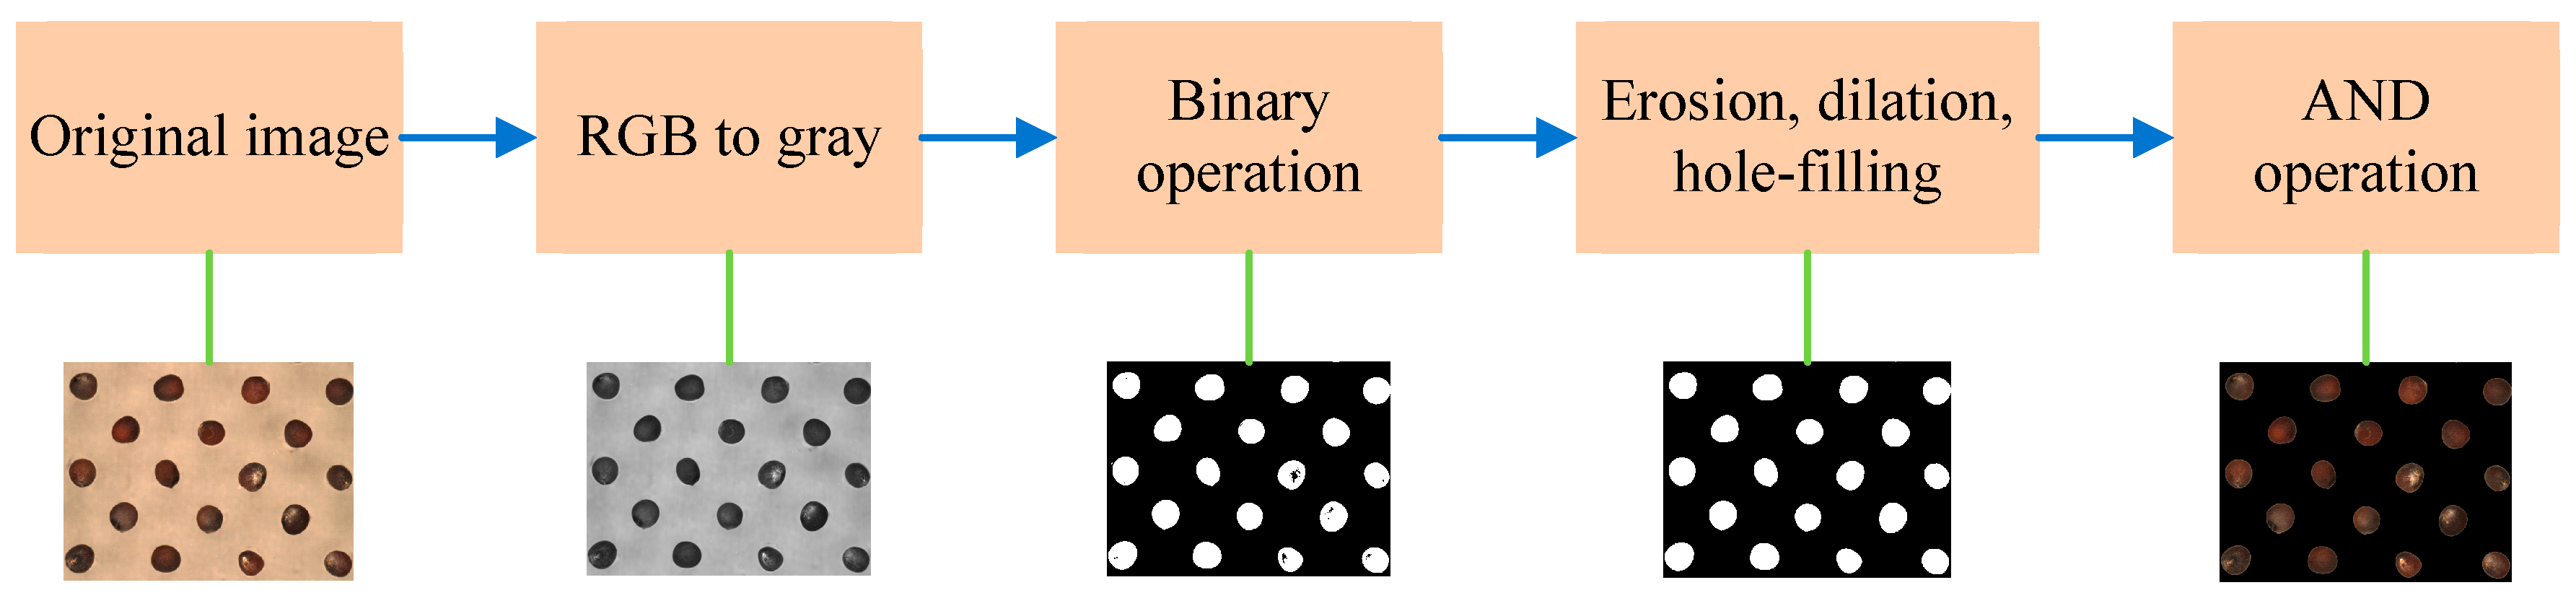
2.3.1. Seed Image Segmentation
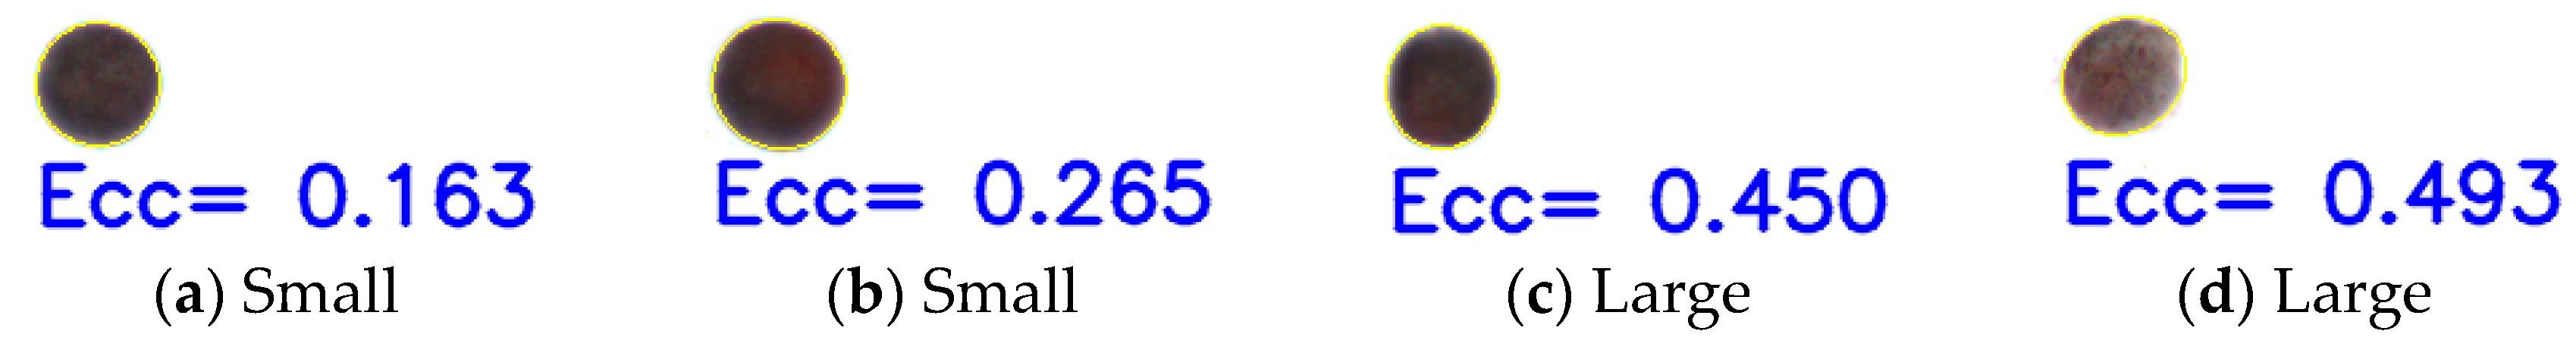
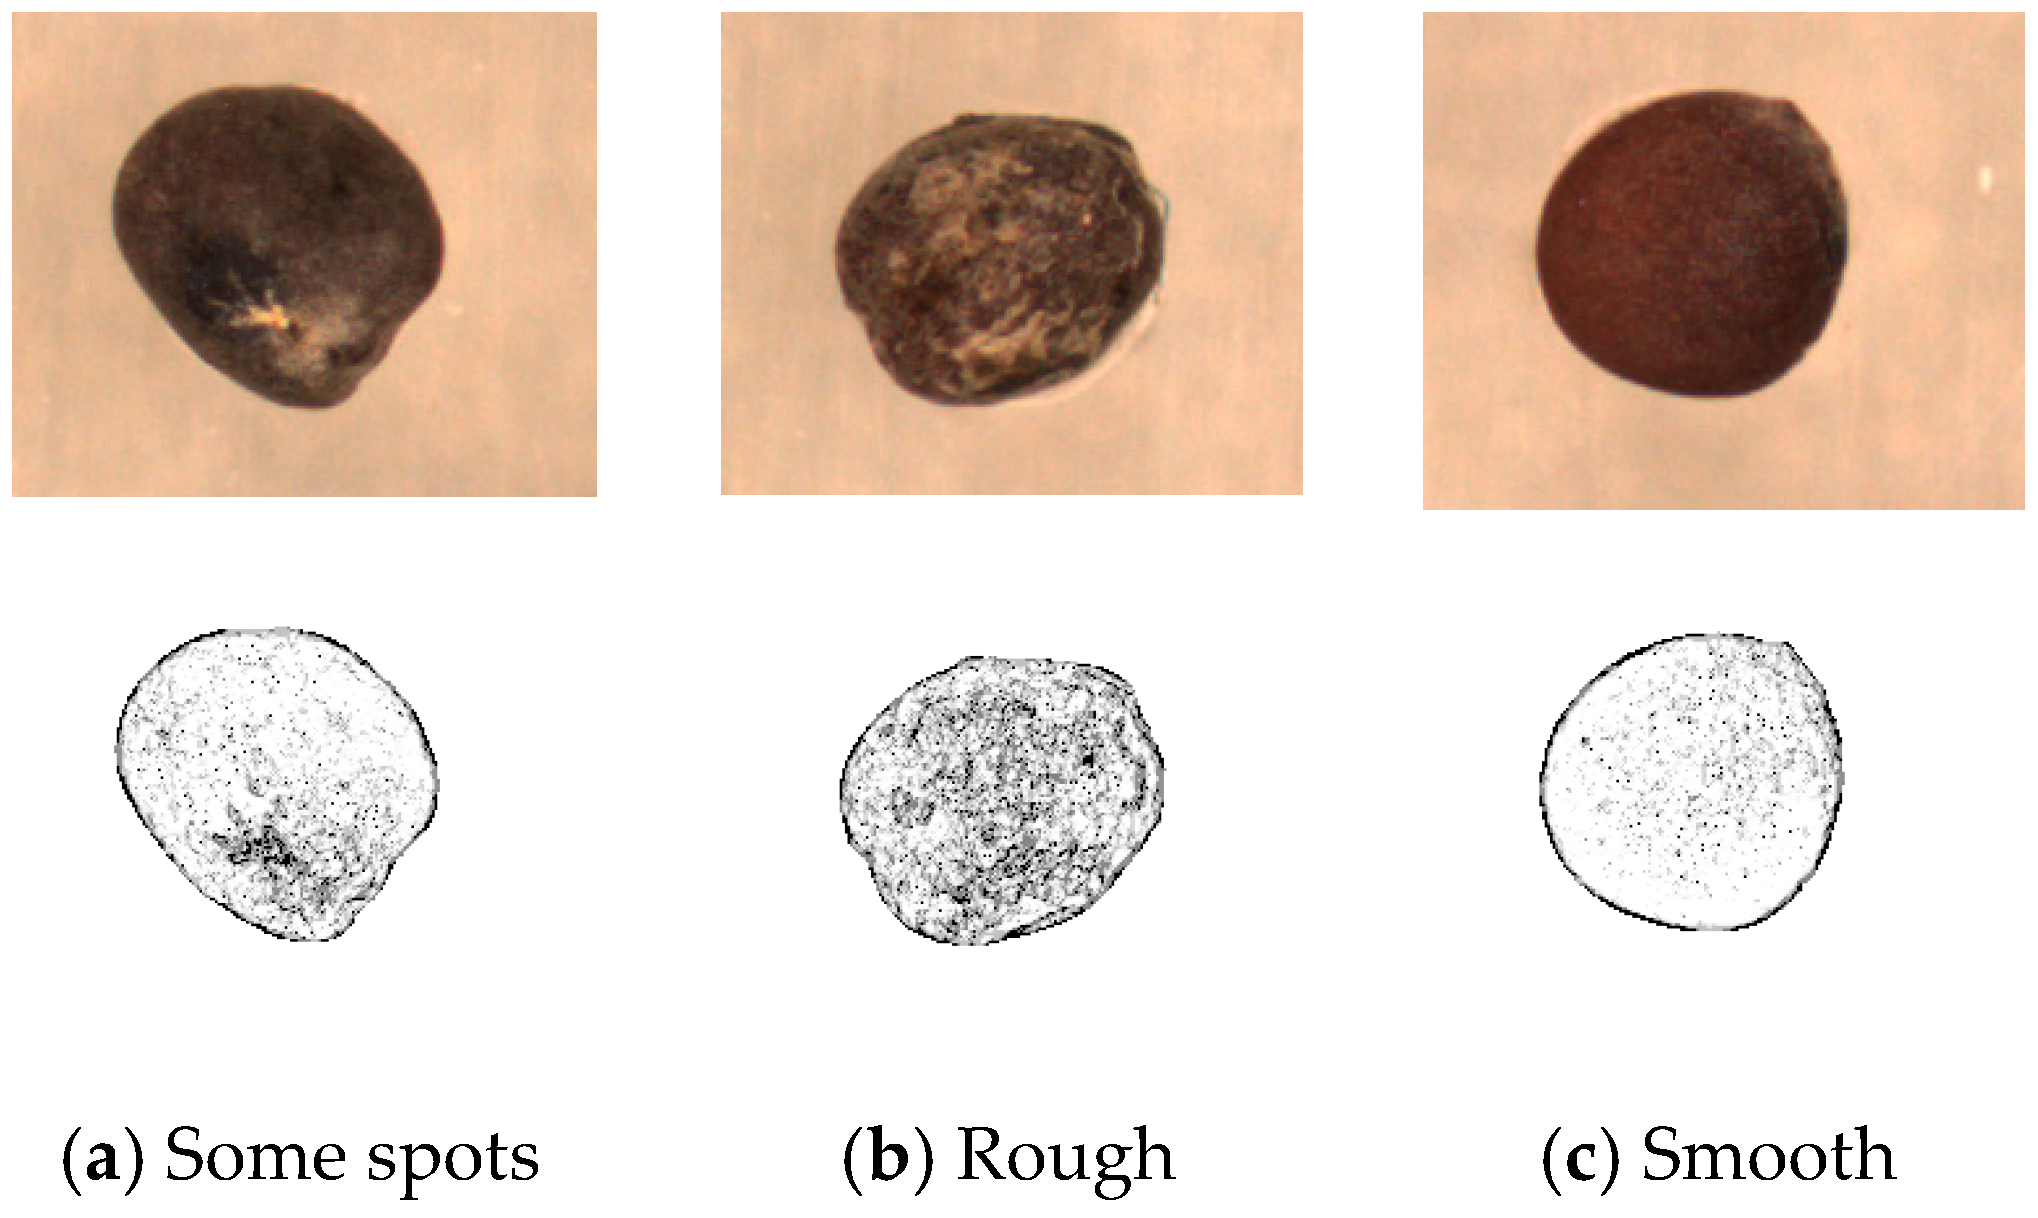
2.3.2. Feature Extraction
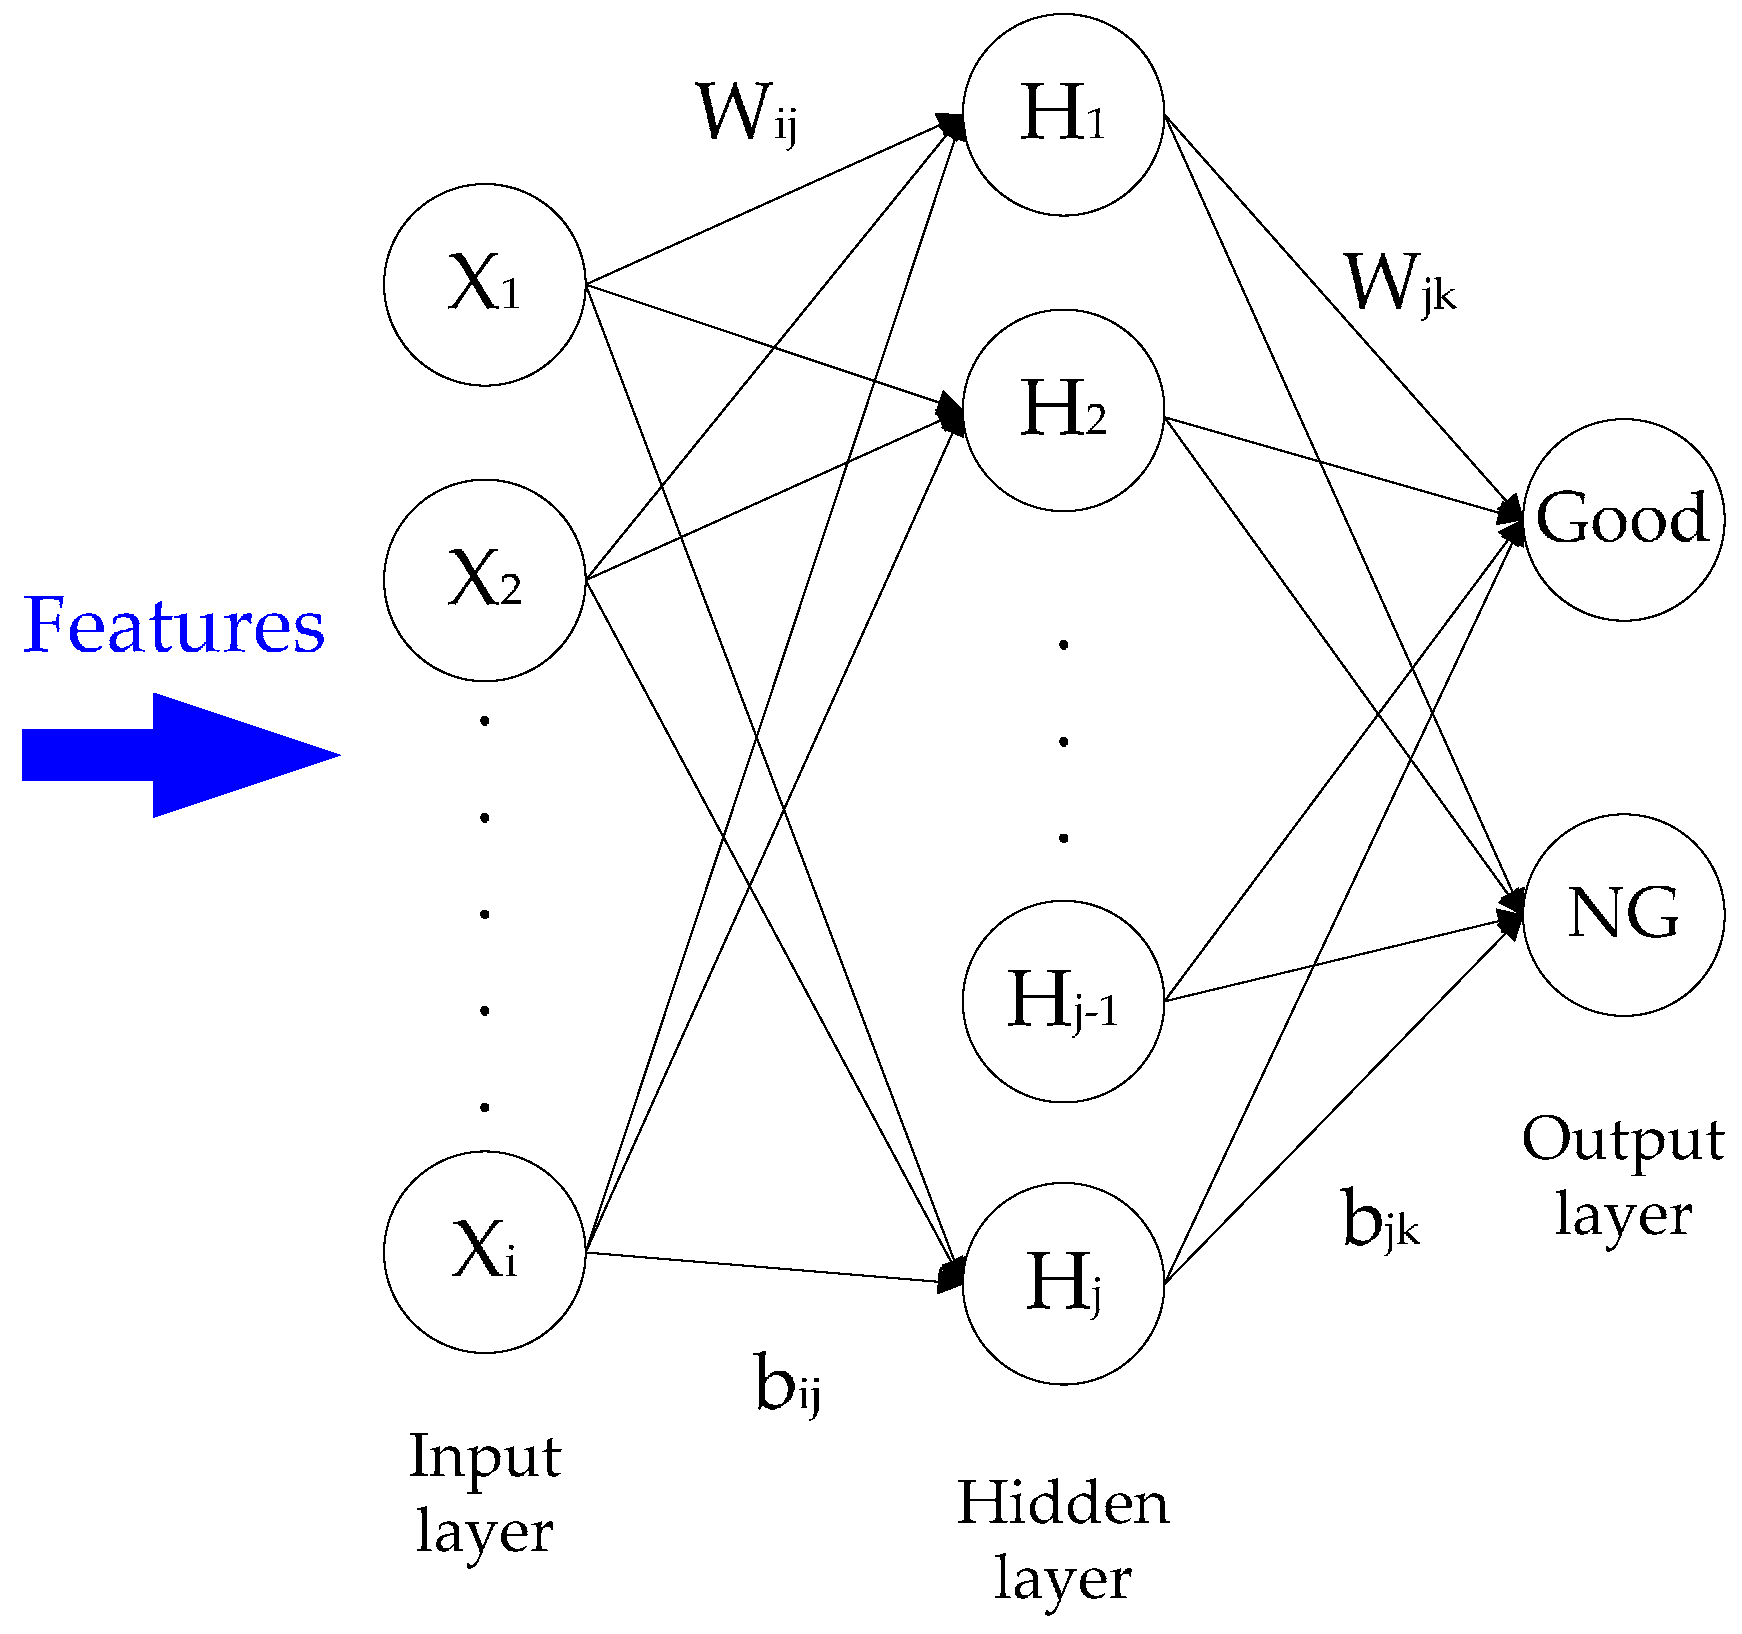
2.4. Back-Propagation Neural Network Classifer
3. Results
3.1. Feature Selection
3.2. Results and Discussion
4. Conclusions
Acknowledgments
Author Contributions
References
- Rodriguez-Pulido, F.J.; Gomez-Robledo, L.; Melgosa, M.; Gordillo, B.; Gonzalez-Miret, M.L.; Heredia, F.J. Ripeness estimation of grape berries and seeds by image analysis. Comput. Electron. Agric. 2012, 82, 128–133. [Google Scholar] [CrossRef]
- Xu, L.; Zhao, Y. Automated strawberry grading system based on image processing. Comput. Electron. Agric. 2010, 71, S32–S39. [Google Scholar]
- Wiwart, M.; Suchowilska, E.; Lajszner, W.; Graban, L. Identification of hybrids of spelt and wheat and their parental forms using shape and color descriptors. Comput. Electron. Agric. 2012, 83, 68–76. [Google Scholar] [CrossRef]
- Tanabata, T.; Shibaya, T.; Hori, K.; Ebana, K.; Yano, M. SmartGrain: High-throughput phenotyping software for measuring seed shape through image analysis. Am. Soc. Plant Biol. 2012, 160, 1871–1880. [Google Scholar] [CrossRef] [PubMed]
- ElMasry, G.; Cubero, S.; Molto, E.; Blasco, J. In-line sorting of irregular potatoes by using automated computer-based machine vision system. J. Food Eng. 2012, 112, 60–68. [Google Scholar] [CrossRef]
- Huang, K.Y. Application of artificial neural network for detecting Phalaenopsis seedling diseases using color and texture features. Comput. Electron. Agric. 2007, 57, 3–11. [Google Scholar] [CrossRef]
- Wang, N.; ElMasry, G.; Vigneault, C. Detecting chilling injury in Red Delicious apple using hyperspectral imaging and neural networks. Postharvest Biol. Technol. 2009, 52, 1–8. [Google Scholar]
- Huang, K.Y. Detection and classification of areca nuts with machine vision. Comput. Math. Appl. 2012, 64, 739–746. [Google Scholar] [CrossRef]
- Chen, H.; Xiong, L.; Hu, X.; Wang, Q.; Wu, M. Identification method for moldy peanut kernels based on neural network and image processing. Trans. Chin. Soc. Agric. Eng. 2007, 23, 158–161. [Google Scholar]
- Huang, M.; Tang, J.; Yang, B.; Zhu, Q. Classification of maize seeds of different years based on hyperspectral imaging and model updating. Comput. Electron. Agric. 2016, 122, 139–145. [Google Scholar] [CrossRef]
- Chaugule, A.A.; Mali, S.N. Identification of paddy varieties based on novel seed angle features. Comput. Electron. Agric. 2016, 123, 415–422. [Google Scholar] [CrossRef]
- Lurstwut, B.; Pornpanomchai, C. Application of Image Processing and Computer Vision on Rice Seed Germination Analysis. Int. J. Appl. Eng. Res. 2016, 11, 6800–6807. [Google Scholar]
- Gonzalez, R.C.; Woods, R.E. Digital Image Processing, 3rd ed.; Prentice Hall: Upper Saddle River, NJ, USA, 2002. [Google Scholar]
- Davis, J.C. Statistics and Data Analysis in Geology, 2nd ed.; John Wiley: New York, NY, USA, 1986. [Google Scholar]
- Russ, J.C. The Image Processing Handbook, 4th ed.; CRC Press: Roca Raton, FL, USA; London, UK; New York, NY, USA, 2002. [Google Scholar]
- Cormen, T.H.; Leiserson, C.E.; Rivest, R.L.; Stein, C. Finding the convex hull. Introduction to Algorithms, 3rd ed.; The MIT Press: London, UK, 2009. [Google Scholar]
- Haralick, R.M.; Shanmugam, K.; Dinstein, I. Textual features for image classification. IEEE Trans. Syst. Man Cybern 1973, 3, 610–621. [Google Scholar] [CrossRef]
- Pourreza, H.R.; Masoudifar, M.; ManafZade, M. LSP: Local Similarity Pattern, a new approach for rotation invariant noisy texture analysis. In Proceedings of the IEEE International Conference on Image Processing, Brussels, Belgium, 11–14 September 2011; pp. 837–840. [Google Scholar]
- Tamura, H.; Mori, S.; Yamawaki, T. Textural features corresponding to visual perception. IEEE Trans. Syst. Man Cybern. 1978, 8, 460–473. [Google Scholar] [CrossRef]
- Hagan, M.T.; Demuth, H.B.; Beale, M.H.; Jesus, O.D. Neural Network Design, 2nd ed.; Oklahoma State University: Stillwater, OK, USA, 2014. [Google Scholar]
- Pudil, P.; Novovicova, J.; Kittler, J. Floating search methods in feature selection. Pattern Recognit. Lett. 1994, 15, 1119–1125. [Google Scholar] [CrossRef]
- Ciresan, D.; Meier, U.; Schmidhuber, J. Multi-column Deep Neural Networks for Image Classification. In Proceedings of the 2012 IEEE Conference on Computer Vision and Pattern Recognition, Providence, RI, USA, 16–21 June 2012. [Google Scholar]


| Feature | Formulation | Diagram |
|---|---|---|
| Compactness 1 | ~ | |
| Compactness 2 | ~ | |
| Circularity 1 | ~ | |
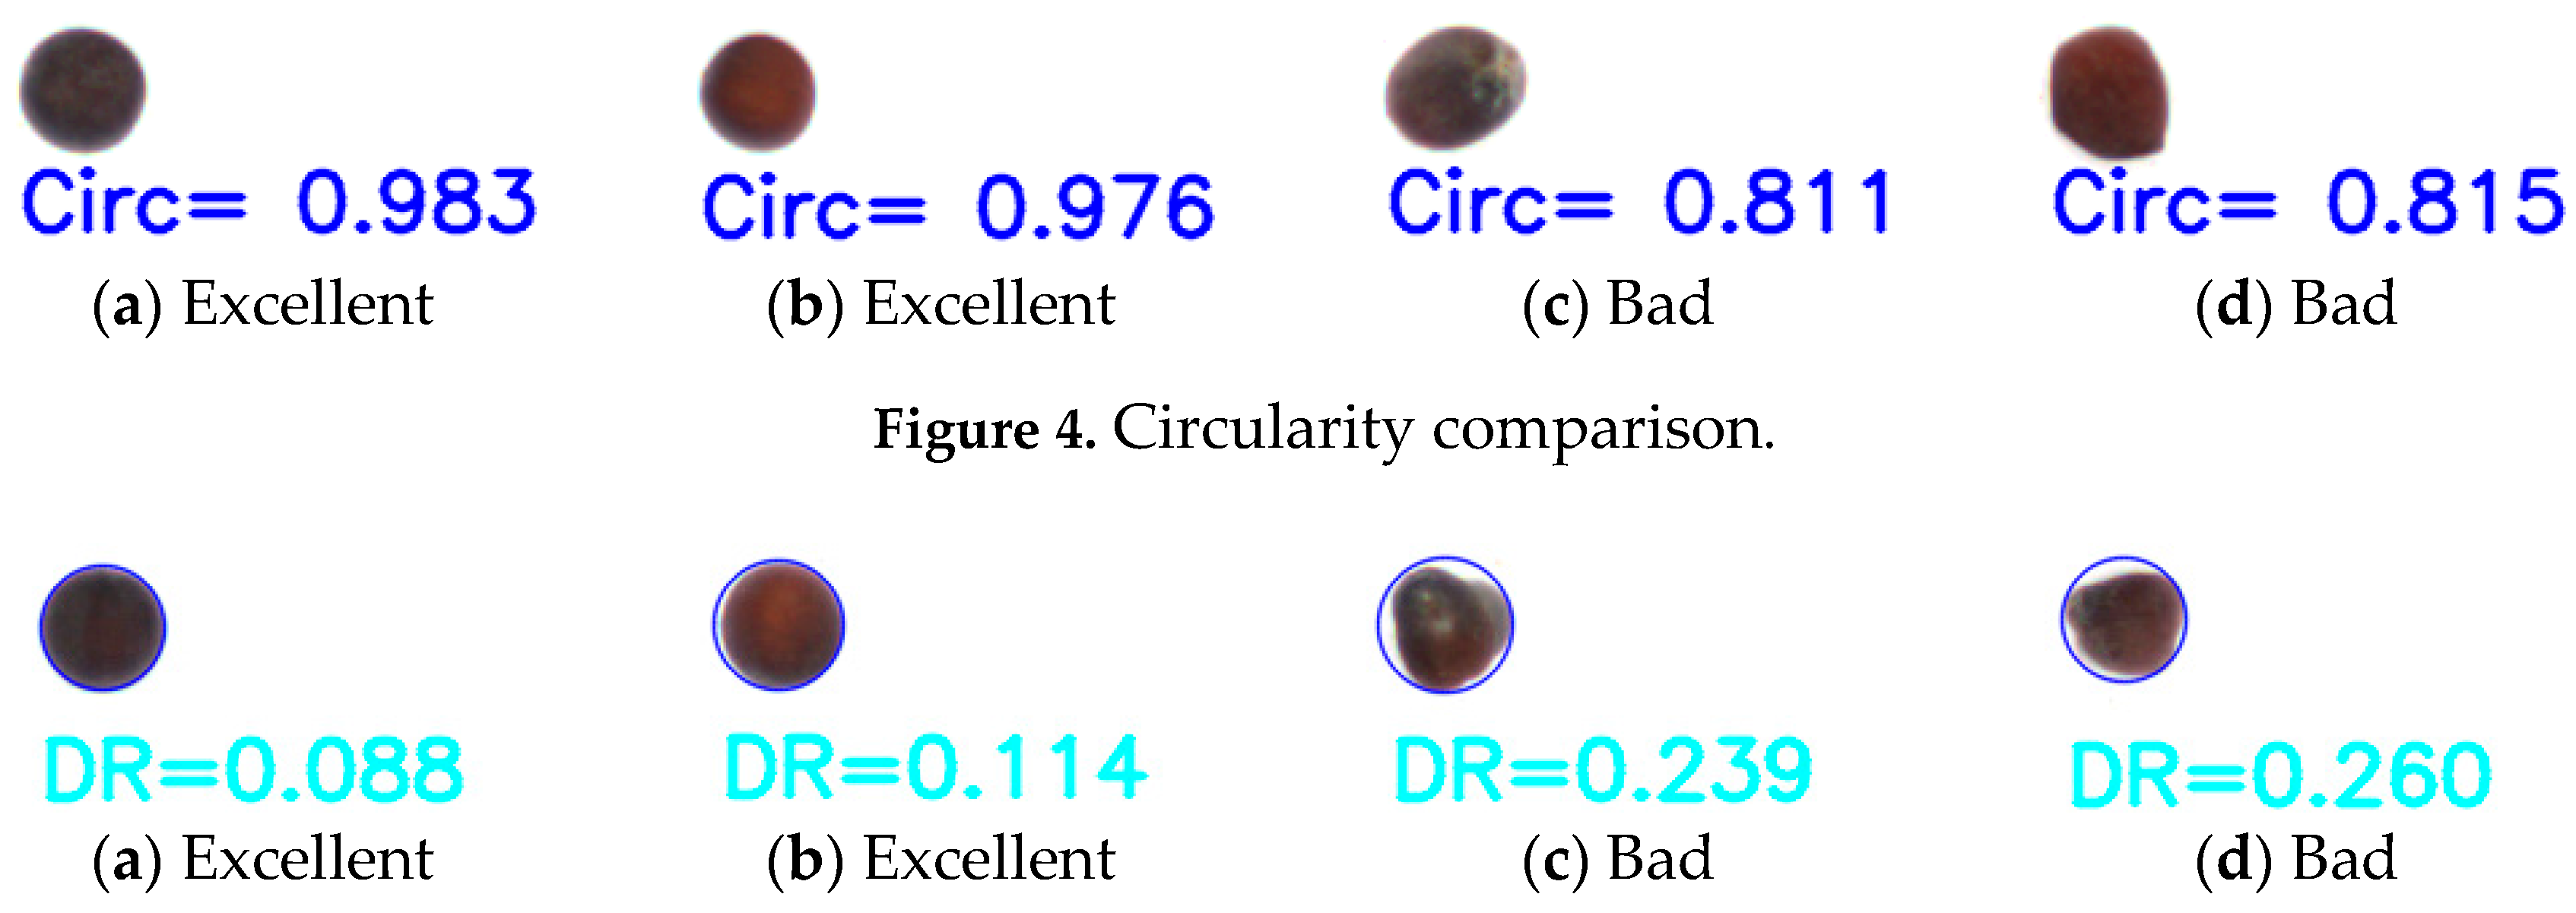
| Circularity 2 | Figure 4 | |
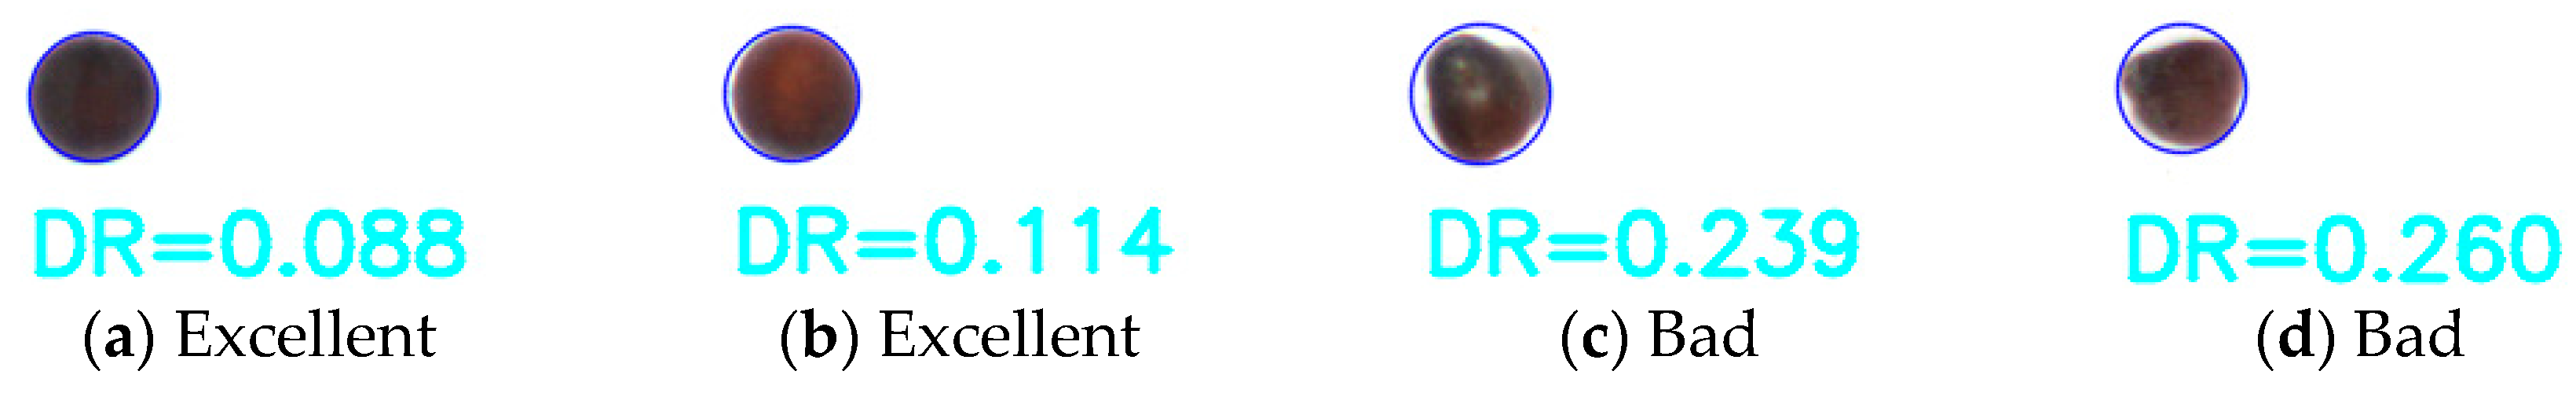
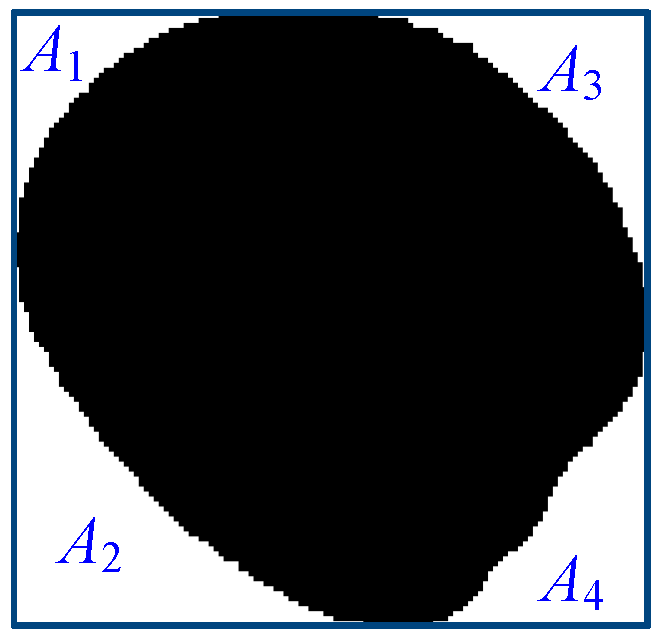
| Defects ratio | Figure 5 | |
| Elongation | ~ | |
| Ellipticity index | ~ | |
| Eccentricity | Figure 6 | |
| Symmetry area ratio 1 | Figure 7 | |
| Symmetry area ratio 2 | Figure 7 | |
| Symmetry area ratio 3 | Figure 7 |
| Feature | Formulation |
|---|---|
| Angular 2nd moment | |
| Entropy | |
| Contrast | |
| Homogeneity |
| Number | Accuracy | Feature Subset |
|---|---|---|
| (1) | 76.46% | {9} |
| (2) | 85.38% | {9, 8} |
| (3) | 85.79% | {9, 8, 3} |
| (4) | 88.02% | {9, 8, 3, 12} |
| (5) | 89.30% | {9, 8, 3, 12, 1} |
| (6) | 89.26% | {9, 8, 3, 12, 1, 11} |
| (7) | 89.50% | {9, 8, 3, 12, 11, 14} |
| (8) | 91.61% | {9, 8, 3, 12, 11, 14, 1} |
| (9) | 90.49% | {9, 8, 3, 12, 11, 14, 1, 13} |
| (10) | 90.72% | {9, 8, 3, 12, 11, 14, 1, 13, 10} |
| (11) | 90.14% | {9, 8, 3, 12, 11, 14, 1, 13, 10, 4} |
| (12) | 90.90% | {9, 8, 3, 12, 11, 14, 1, 13, 10, 4, 7} |
| (13) | 91.00% | {9, 8, 3, 12, 14, 1, 13, 10, 4, 7, 15} |
| (14) | 91.10% | {9, 8, 3, 12, 14, 1, 13, 4, 7, 15} |
| (15) | 90.90% | {9, 8, 3, 12, 14, 1, 4, 7, 15} |
| (16) | 91.61% | {9, 8, 3, 12, 14, 1, 4, 7, 15, 11} |
| (17) | 91.31% | {9, 8, 3, 12, 14, 1, 4, 7, 15, 11, 2} |
| (18) | 91.70% | {9, 8, 3, 12, 14, 4, 7, 15, 11, 2, 6} |
| (19) | 92.00% | {9, 8, 3, 12, 14, 4, 7, 15, 11, 6} |
| (20) | 91.00% | {9, 8, 3, 12, 14, 7, 15, 11, 6} |
| (21) | 91.00% | {9, 8, 3, 12, 14, 7, 15, 11} |
| (22) | 91.66% | {9, 8, 3, 12, 14, 7, 15, 11, 5} |
| (23) | 91.70% | {9, 8, 3, 12, 14, 15, 11, 5, 2} |
| (24) | 91.80% | {9, 8, 3, 12, 14, 15, 11, 2, 10} |
| (25) | 91.25% | {9, 8, 3, 12, 14, 15, 11, 2, 10, 4} |
| (26) | 91.90% | {9, 8, 3, 12, 14, 15, 11, 2, 10, 4, 1} |
| (27) | 91.55% | {9, 8, 3, 12, 14, 15, 11, 2, 10, 4, 1, 6} |
| Number | Accuracy | Feature Subset |
|---|---|---|
| (1) | 68.28% | {6} |
| (2) | 71.34% | {6, 12} |
| (3) | 73.83% | {6, 12, 7} |
| (4) | 75.62% | {6, 12, 7, 5} |
| (5) | 77.70% | {12, 7, 5, 4} |
| (6) | 79.38% | {12, 7, 5, 4, 10} |
| (7) | 81.68% | {12, 7, 5, 4, 10, 6} |
| (8) | 82.51% | {12, 7, 5, 4, 10, 6, 8} |
| (9) | 84.20% | {12, 7, 5, 4, 10, 8, 11} |
| (10) | 84.30% | {12, 5, 4, 10, 8, 11} |
| (11) | 81.70% | {5, 4, 10, 8, 11} |
| (12) | 79.20% | {5, 4, 8, 11} |
| (13) | 76.50% | {4, 8, 11} |
| (14) | 78.49% | {4, 8, 11, 5} |
| (15) | 79.50% | {4, 8, 5, 9} |
| (16) | 82.06% | {4, 8, 5, 9, 12} |
| (17) | 83.47% | {4, 8, 5, 9, 12, 11} |
| (18) | 82.10% | {4, 8, 5, 9, 12, 11, 7} |
| (19) | 82.40% | {4, 8, 5, 9, 12, 11, 6} |
| (20) | 84.20% | {4, 8, 5, 12, 11, 6, 10} |
| (21) | 85.25% | {4, 8, 5, 12, 11, 6, 10, 2} |
| (22) | 85.32% | {4, 8, 5, 12, 11, 6, 10, 2, 7} |
| (23) | 85.40% | {4, 8, 5, 12, 11, 10, 2, 7, 1} |
| (24) | 87.20% | {4, 8, 5, 12, 11, 10, 7, 1, 6} |
| (25) | 85.96% | {4, 8, 5, 12, 11, 10, 7, 1, 6, 3} |
| Type | Good | NG |
|---|---|---|
| Good | 8166 | 788 |
| NG | 756 | 6340 |
| Accuracy | 91.53% | 88.95% |
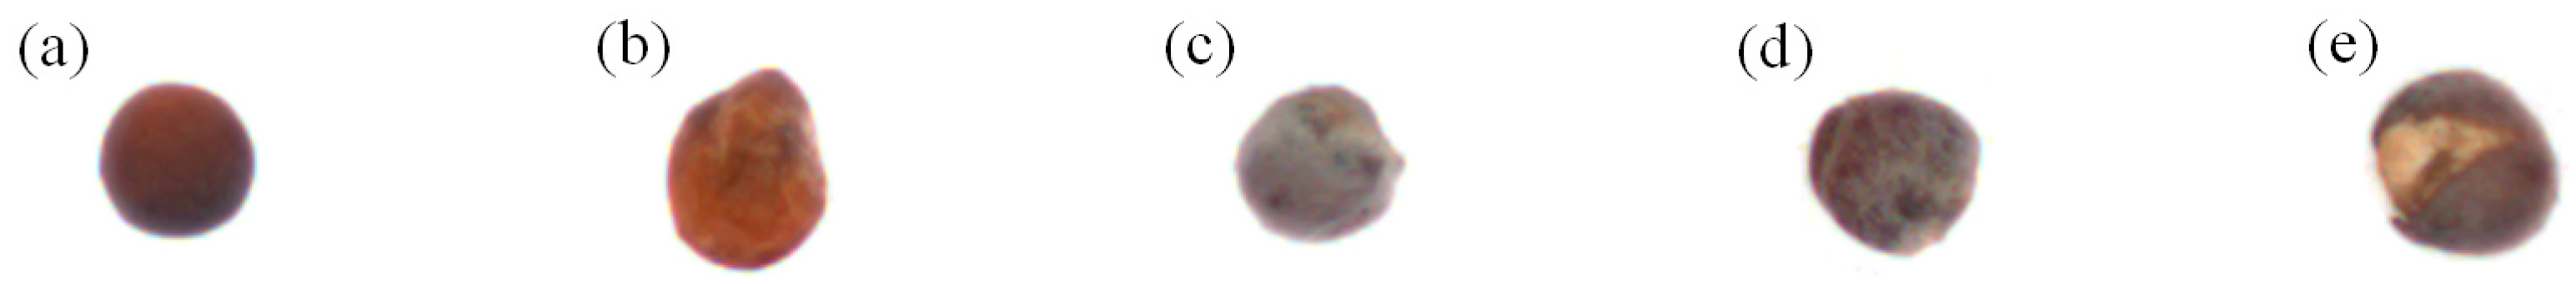
| Image | Explanation | |
|---|---|---|
| Case 1 |  | The shapes are similar to circular, but the captured images show hollow, square or triangle because of the seed placement angle. |
| Case 2 | 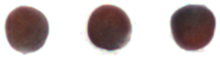 | The shapes are similar to triangular or irregular, but the captures images are similar to circular. |
| Case 3 | 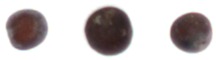 | The other sides of the seeds are damaged or show defects. |
© 2017 by the authors. Licensee MDPI, Basel, Switzerland. This article is an open access article distributed under the terms and conditions of the Creative Commons Attribution (CC BY) license (http://creativecommons.org/licenses/by/4.0/).
Share and Cite
Huang, K.-Y.; Cheng, J.-F. A Novel Auto-Sorting System for Chinese Cabbage Seeds. Sensors 2017, 17, 886. https://doi.org/10.3390/s17040886
Huang K-Y, Cheng J-F. A Novel Auto-Sorting System for Chinese Cabbage Seeds. Sensors. 2017; 17(4):886. https://doi.org/10.3390/s17040886
Chicago/Turabian StyleHuang, Kuo-Yi, and Jian-Feng Cheng. 2017. "A Novel Auto-Sorting System for Chinese Cabbage Seeds" Sensors 17, no. 4: 886. https://doi.org/10.3390/s17040886
APA StyleHuang, K.-Y., & Cheng, J.-F. (2017). A Novel Auto-Sorting System for Chinese Cabbage Seeds. Sensors, 17(4), 886. https://doi.org/10.3390/s17040886