Abstract
Measuring the radial collision force between the steam generator tube (SGT) and the tube support plate (TSP) is essential to assess the fretting damage of the SGT. In order to measure the radial collision force, a novel miniaturized force sensor based on fiber Fabry-Perot (F-P) was designed, and the principle and characteristics of the sensor were analyzed in detail. Then, the F-P force sensor was successfully fabricated and calibrated, and the overall dimensions of the encapsulated fiber F-P sensor were 17 mm × 5 mm × 3 mm (L × W × H). The sensor works well in humid, high pressure (10 MPa), high temperature (350 °C), and vibration (40 kHz) environments. Finally, the F-P force sensors were installed in a 1:1 steam generator test loop, and the radial collision force signals between the SGT and the TSP were obtained. The experiments indicated that the F-P sensor with small volume and high performance could help in assessing the fretting damage of the steam generator tubes.
1. Introduction
Steam generator tube rupture (SGTR) has been addressed as one of the most significant safety issues in past decades when operating nuclear power plants. According to an independent investigation of American pressurized water reactor (PWR) nuclear power plants, 75% of all failure risks in pressurized water reactor nuclear power plants are induced by SGTR-related faults [1]. The investigation results also show that the fretting damage due to the fluid motion and thermal energy transmission between the SGT and the tube support plate (TSP) is the most important cause of fatigue cracks in the SGT. The fretting work was used to assess the fretting damage of the SGT [2,3,4,5,6]. To calculate the fretting work, the radial impact force and the axial displacement between the SGT and the TSP need to be measured. The radial impact force is more difficult to measure than the axial displacement in the complex working environment of the SGT. Therefore, measuring the collision force between the SGT and the TSP is urgently needed to assess the fretting damage of the SGT, and thus to monitor the health condition of the SGT.
As shown in Figure 1, steam generator tubes are arranged closely in a high temperature and pressure environment (350 °C, 15 MPa, humid). Therefore, this working environment requires force sensors with large measurement range, small volume (especially, the height must be less than 4 mm), and good heat resistance, pressure resistance, and waterproofness. Meanwhile, since the impact time of radial collision force is short [6], a corresponding high-speed force sensor demodulation system is required. The first and urgent step to accessing the fretting damage of the SGT is to investigate the force sensors with high performance in a real steam generator tube.
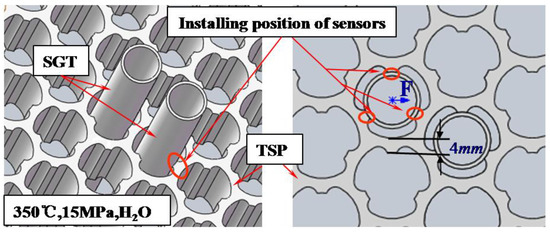
Figure 1.
Schematic structure of steam generator tube (SGT) and tube support plate (TSP) and installing position of force sensor.
Existing electric force sensors are too large to be installed in the narrow space at the contact position between the SGT and the TSP. Compared with the electric force sensors, the fiber sensors have outstanding advantages due to their small size and anti-electromagnetic interference [7]. Mo et al. reported a miniature and magnetic-resonance-compatible optical Fabry-Perot (F-P) force sensor [8], achieving a force sensing range of 0–5 N with a resolution of 0.1 N. Noh et al. developed a three-axis fiber-optic body force sensor structure for flexible manipulators with a measurement range of 0–21 N, being suitable for inclusion in instruments and robotic tools for minimally invasive surgery [9]. Tang et al. reported a sensitive force sensor using two identical fiber Bragg gratings (FBGs), achieving a sensitivity of (1.16 ± 0.06) × 103 dB/N [10]. Zychowicz presented a fiber-optic force sensor, operating in the configuration of a birefringent fiber based on a Sagnac interferometer, with a measurement range of 0–2 N [11]. Tsuda et al. developed a small-diameter FBG sensor to detect the impact damage of carbon fiber reinforced plastic [12]. These sensors are based on fiber F-P or fiber Bragg gratings, but they are too large for the small gap at the contact position between the SGT and the TSP. Further, these sensors are insufficient to meet the range requirements (range of 0–200 N, resolution of 1 N) in the SGT fretting damage assessment applications.
In this paper, a novel micro-machined fiber F-P force sensor was developed. Its principle, characteristics, and structure parameters were analyzed in detail. Moreover, the sensors were fabricated and then tested in high-pressure, humid, high-temperature, and vibration environments. The sensor worked successfully on the 1:1 steam generator test loop (which simulated a real steam generator with the same geometry and system design).
2. Design of F-P Force Sensor
The sensor has to meet two key requirements: first, the measurement range has to be around 200 N with the resolution of about 1 N; second, the size of sensors has to be small enough. Therefore, there are three key points to be considered during the designing process. (1) The structure of the force measuring element should be carefully designed to maintain the parallelism of the two surfaces of the F-P cavity. The beam length should be appropriately selected when the beam thickness and beam width are limited by the small installation space. (2) Considering the working conditions, the material with higher elasticity modulus, larger tensile strength, and lower heat expansion coefficient is preferable for the force measurement element. (3) To obtain the real-time F-P cavity length, the intensity output from the F-P cavity in the sensor is processed by non-scanning correlation demodulation method [13,14], so the resolution of the F-P force sensor depends on the minimum F-P cavity length variation that the demodulation system can distinguish.
2.1. Structure Design and Analysis
Due to the small gap at the contact position (less than 4 mm) between the SGT and the TSP, a 45° reflection prism, a fiber collimator, and a sensing beam with suitable elastic force measuring element were utilized. The clamped-clamped beam and the cantilever beam are commonly used structures for a sensing beam, as shown in Figure 2a,b. The beam deflections of both clamped-clamped beam and cantilever beam are equal to the change of the F-P cavity length (see Figure 2c,d).
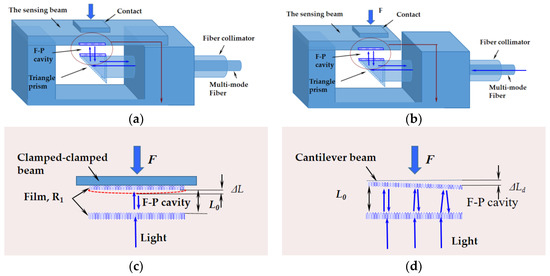
Figure 2.
Three-dimensional structure of our Fabry-Perot (F-P) force sensors with (a) clamped-clamped beam element; (b) cantilever beam element; a simplified structure of the F-P cavity length change induced by the force F for (c) a clamped-clamped beam; (d) a cantilever beam.
The F-P cavity length changes when a force is exerted on the force-sensitive element (sensing beam). The cavity length variation is related to the magnitude of the applied force F. The non-scanning correlation demodulation method is used to obtain the F-P cavity length variation induced by the force F. The relationship between the F-P cavity length variation and the applied force F in two different sensing structures is given by:
where F1 is the force exerted on the clamped-clamped beam, F2 is the force exerted on the cantilever beam, E is the elastic modulus of the beam material, l is the beam length, h is the beam thickness, b is the beam width, L0 is the original F-P cavity length, L0′ is the F-P cavity length induced by the force, ΔL is the F-P cavity length variation, and R1 is the reflective index.
Based on Equations (1) and (2), the measurement range of the F-P force sensor is proportional to the maximum F-P cavity length variation ΔLmax that the demodulation system can demodulate; the measuring accuracy is related to the minimum F-P cavity length variation ΔLmin that the demodulation system can distinguish.
Compared with the clamped-clamped beam element, the cantilever beam element has higher sensitivity and larger measurement range. However, an exerted force would severely reduce the degree of parallelism between the two reflective surfaces of the F-P cavity in the sensor (see Figure 2d), while the parallelism must be strictly guaranteed in order to ensure the good optical performance of the F-P cavity. Therefore, a systematic analysis must be done to aid in the design of the sensor structure.
For the cantilever beam force sensor, L is no longer a fixed value with a large deformation of F-P cavity. The F-P cavity could be decomposed into infinite numbers of micro F-P cavities. The signal of the force sensor can be demodulated by non-scanning correlation demodulation method [13], shown in Figure 3. Additionally, the intensity on the charge coupled devices (CCD) could be calculated by integration with the integration step of ΔLstep, expressed by
where R1 is the reflectivity of the F-P cavity end face, R2 is the reflectivity of the Fizeau interferometer, Bλ is the bandwidth of the super luminescent light emitting diode (SLED), λp is the central wavelength of the SLED spectrum, λmin~λmax is the wavelength range of SLED, θ is the optical wedge angle, L is the F-P cavity length, x is the optical wedge length equal to the photoreceptor length of the CCD, I0 is the input light spectrum density, and results from the Gaussian lineshape of the SLED spectrum.
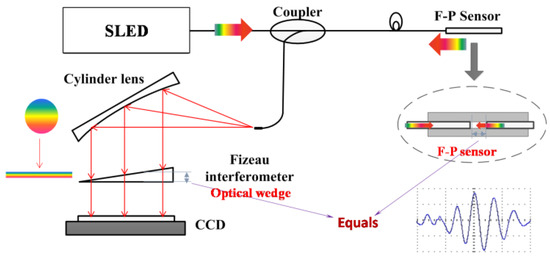
Figure 3.
A schematic of the non-scanning correlation demodulation method. (SLED, super luminescent light emitting diode; CCD, charge coupled devices)
The signals of the F-P force sensor demodulated by the non-scanning correlation demodulation method could be discussed by numerical computation based on Equation (3), and the corresponding demodulated signals are shown in Figure 4a,b at different ΔL values (other parameters are R1 = 0.2, R2 = 0.5, L = 50 μm, θ = 0.05°, λp = 840 nm, and Bλ = 60 nm). Note that when the height of the optical wedge equals the cavity length of the F-P sensor, a maximum value of the corresponding intensity on the CCD pixel appears. The CCD pixel position where the maximum value appears is targeted to find the corresponding demodulated F-P cavity length.
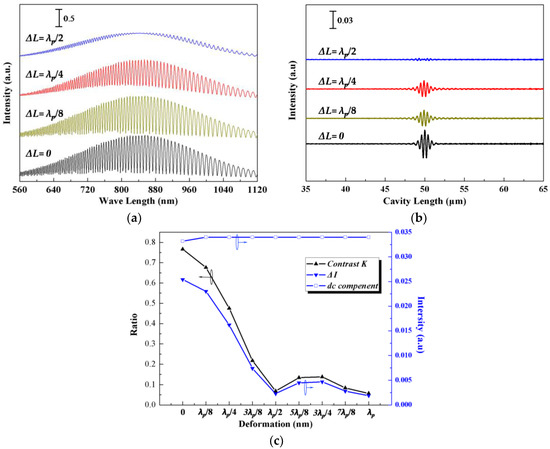
Figure 4.
Simulated signals of fiber F-P sensor with different deformation: (a) F-P reflective light intensity; (b) demodulation signals; (c) contrast K, ΔI, dc component.
Three parameters are used to evaluate the demodulation quality: ΔI is the difference between Imax and Imin, dc is the averaged value of Iout, and the signal contrast K is the ratio of the F-P cavity length signal intensity (Imax − Imin) and the dc component. The three parameters are calculated and plotted in Figure 4c. It indicates that when ΔL is less than λp/4, it is easy to demodulate the signal. The contrast ratio is reduced with the increase of ΔL. When ΔL reaches λp/2, the demodulated signal almost disappears. When ΔL is larger than λp/2, it is more difficult to demodulate the signal. In order to weaken the incline effect of the sensing beam, the value of ΔL should be kept smaller than λp/2. The above analyses indicate that the tilt deformation of the F-P cavity must be less than λp/2 during the sensing, which limits the measurement range of the force sensor. Compared with a cantilever beam element, the clamped-clamped beam element performs better in maintaining the parallelism between the two reflective surfaces of the F-P cavity, which achieves a larger measurement range of the force sensor. Therefore, in this paper, the clamped-clamped beam element was used as the sensing beam in the subsequent discussion, fabrication, and experiments.
2.2. Material and Size Requirement
First, materials with high-temperature and high-pressure resistance were used to structure the F-P force sensor. In this design, optical fibers made of quartz (melting point at ~1750 °C) were used, and 3Cr13 (melting point at ~1371 °C) or 06Cr19Ni10 (melting point at ~1400 °C) stainless steel was used for the clamped-clamped beam. Second, in order to guarantee the rigidity of the supporting structure when exerting the maximum force of 200 N, stainless steel was used to package the F-P force sensor.
In order to optimize the dimension and materials used, three important clamped-clamped beam element parameters are discussed as follows:
where S is the sensitivity of the sensor, Fm is the permissible bending stress of the sensor, f0 is the natural frequency of the sensor, Fc is the force exerted on the clamped-clamped beam element, E is the elasticity modulus of the element material, l is the beam length, b is the beam thickness, h is the beam width, ΔL is the F-P cavity length variation, σb is the tensile strength of the element material, and ρ is the density of the element material.
The sensitivity S depends on the size and material of the sensing beam. The permissible bending stress Fm has to be large enough to prevent the F-P sensor failure caused by the fracture of the sensing beam. The natural frequency of the F-P force sensor has to be far away from the frequency of the SGT radial collision force and the sampling frequency of demodulation system in order to avoid the error caused by the resonance.
Based on Equations (4) and (6), S, Fm, and f0 were calculated with different beam lengths l of 3 mm, 4 mm, and 5 mm (other parameters are b = 2 mm, h = 0.6 mm, L = 50 μm, ΔLmax = 25 μm, ΔLmin = 30 nm) respectively. The calculation results based on 06Cr19Ni10 stainless steel and 3Cr13 stainless steel are shown in Table 1.

Table 1.
The calculation results when the clamped-clamped beams were used with 06Cr19Ni10 and 3Cr13 in different beam length.
The results show that the sensitivity S becomes larger and other parameters become smaller with the increase of the beam length. Since the permissible bending stress Fm of 06Cr19Ni10 stainless steel is unable to meet the requirement of the measurement range, the 3Cr13 stainless steel was selected for the F-P force sensing system, with the sensing beam length of 4 mm. Therefore, the dimensions of the 3Cr13 stainless steel force sensing beam were designed to be b = 2 mm, h = 0.6 mm, and l = 4 mm.
3. Fabrication of the F-P Sensor
The F-P force sensor consists of a base, two support frames, a sensing beam, a triangle prism, a fiber collimator, and fixing screws (see Figure 5a). Meanwhile, several preparation steps should be done before the assembly, such as the cleaning of the mechanical structure using the ultrasonic oscillator. In order to ensure the parallelism between the two reflective surfaces of the F-P cavity and the accuracy of the F-P cavity length, the sensor signal monitoring system was used (see Figure 5b). One end of the 1 × 2 fiber coupler was connected to the F-P sensor, and another two ends were connected to a halogen-tungsten light source and a spectrometer, respectively. The spectral signal of the F-P cavity could be obtained by the spectrometer, which can monitor the length of F-P cavity in real-time.
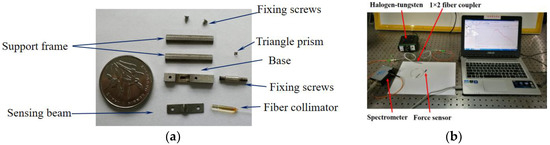
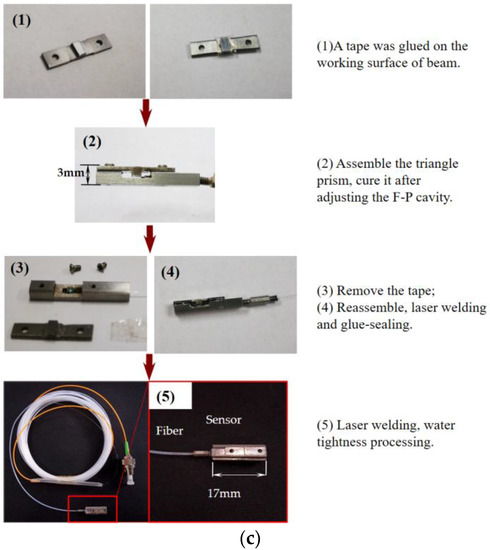
Figure 5.
(a) All elements of the sensor, (b) the sensor signal monitoring system, (c) the preparation process of the sensor. There are five key steps in the sensor production.
As shown in Figure 5c, there are five key steps to completing the assembly. (1) A 50 μm-thick tape was applied smoothly on the working surface of the force sensing beam to guarantee the length of the F-P cavity. (2) The triangle prism and fiber collimator (with fixing screws) were assembled in the groove of the sensor base. Then, the force sensing beam with 50 μm-thick tape was fixed on the base by two small screws. After that, the triangle prism was adjusted until good F-P cavity signal was obtained. (3) High-temperature glue was used to fix the triangle prism. The force sensing beam was disassembled and the tape was removed. (4) The force sensing beam was reassembled and welded onto the base by a laser welder. (5) Two support frames were welded onto the side edges of the base, and the water tightness processing was done. The overall dimensions of the encapsulated fiber F-P sensor were 17 mm × 5 mm × 3 mm.
4. F-P Sensor Experiments
4.1. Calibration of F-P Sensor
A three-point fixing device—a convenient calibration device with a large calibration range and high accuracy—was used to calibrate the fiber F-P force sensor, as shown in Figure 6a. This disc-shaped fixing device has three fixed spaces, all with a 120° angle with a dimensional accuracy of 0.01 mm. Since the output voltage of the CCD varies linearly with its position, a linear fitting was done on the exerted load F and the variation of the F-P cavity length to obtain the voltage–force curve. The fitting had a correlation coefficient of 0.98781, and there was a good linearity between the voltage and force. The calibration results and the fitting curve show that the measuring range of the F-P force sensor was 0–200 N with a resolution of 1 N, as shown in Figure 6b.
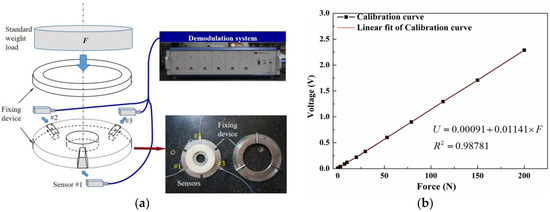
Figure 6.
(a) Schematic and image of sensors calibration fixture; (b) the calibration result and the fitting curve of voltage–force.
4.2. Experiments in Humid and High-Pressure Environment
A high-pressure gas cylinder injected with argon gas (10 MPa) and water inside was used to simulate the humid and high-pressure environment around the SGT. In order to place a fiber F-P force sensor into the cylinder, an optical fiber feedthrough was installed at the bottom of the cylinder. The F-P force sensor was connected with the optical fiber feedthrough, and the other end of optical fiber feedthrough was connected to the sensor signal monitoring system for a real-time measurement. A detailed schematic and an image of the measurement equipment are shown in Figure 7a. The experimental results in the humid and high-pressure environments are shown in Figure 7b, which indicates that the sensor had a stable response in the rigorous working environments. Mean squared error (MSE) was used to assess the stability of the sensor, and the calculated MSE value of the demodulated F-P cavity of the sensor was 5.95 × 10⁻⁴.
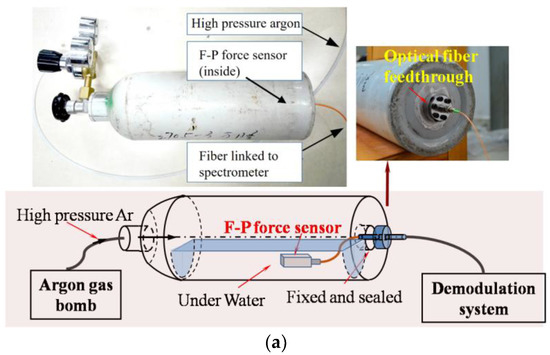
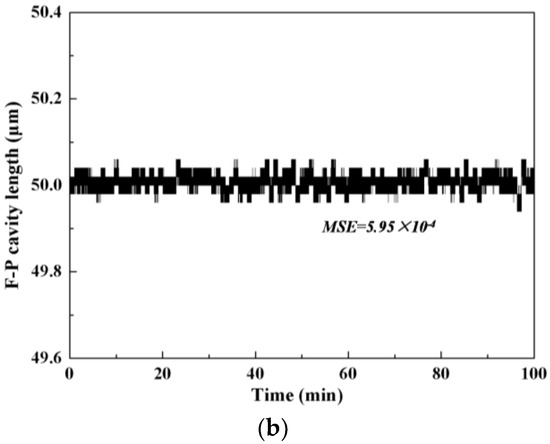
Figure 7.
(a) The schematic and measurement equipment of the experiment; (b) the cavity length results of the sensor in the humid and high-pressure environment. MSE: mean squared error.
4.3. Experiments in Vibration Environment
The vibration of a steam generator tube is caused by the collision of the water flow when the nuclear power plant is running. The vibration strength of the running SGT is not large, so an ultrasonic oscillator was sufficient to simulate the vibration environment in the experiment. The F-P force sensor was ultrasonicated with a vibration frequency of 40 KHz and monitored in real-time by the demodulation system for 60 min. The demodulated F-P cavity length of the force sensor is given in Figure 8, and the corresponding MSE value of the demodulated F-P cavity is 5.96 × 10⁻⁴, indicating that the vibration environment would not cause degradation of the sensor performance.
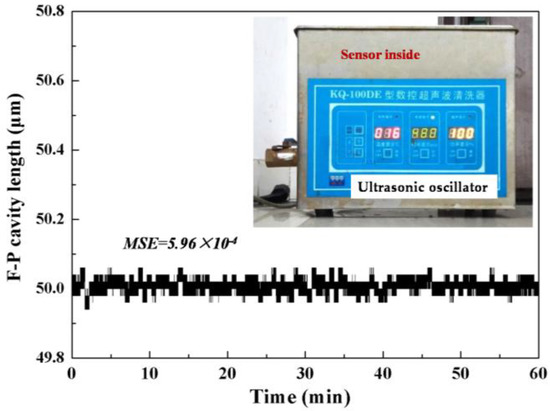
Figure 8.
Experimental results of the demodulated F-P cavity values when F-P sensor is in vibration environment.
4.4. Experiments in High-Temperature Environment
In a running PWR nuclear power plant, the average temperature of the primary loop is about 350 °C, and the average temperature of the secondary loop is about 200 °C. Therefore, in order to study the performance of the sensor in the high-temperature environment, the sensor was installed in an incubator (test temperature was set as 350 °C) and its signal was demodulated by the demodulation system in real-time. As shown in Figure 9, the experimental results indicated that the F-P cavity length became smaller (48.8 μm), but the contrast of the sensor signal at 350 °C was the same as at room temperature. Therefore, the small variation of the original F-P cavity length caused by the high temperature did not affect the performance of force sensor. Meanwhile, the calculated MSE value of 6.02 × 10⁻⁴ indicates that the sensor works well in the high-temperature environment.
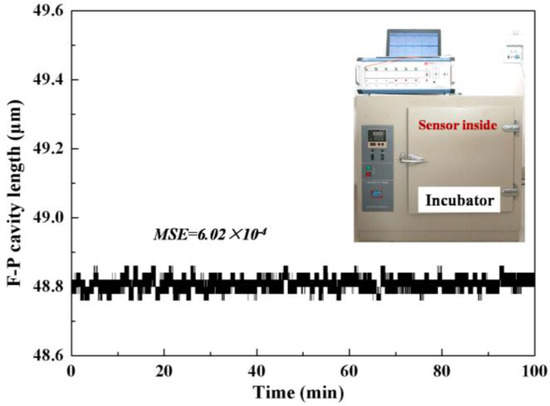
Figure 9.
The result of the cavity length of the sensor in the high temperature environment.
4.5. Experiments in the 1:1 Steam Generator Test Loop
The fiber F-P sensors were exploited to measure the radial impact force between the SGT and the TSP in a 1:1 steam generator test loop with the cooperation of the nuclear power institute of China. The fiber F-P force sensors were installed in the gap between the SGT and the TSP (see Figure 10). During the test in the 1:1 steam generator test loop, there were 30 F-P sensor test points, and the measuring result of one of the test points is shown in Figure 10. According to the calibration, the radial collision force between the SGT and the TSP was about 22 N.
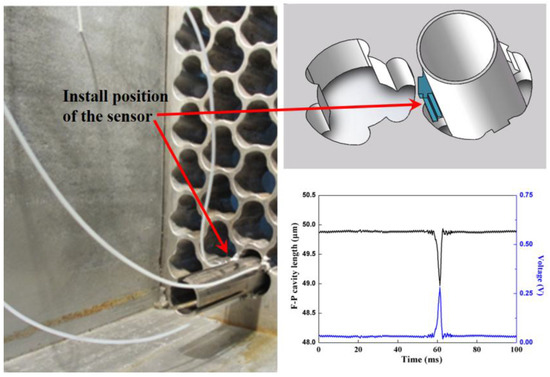
Figure 10.
Installed sensors in 1:1 steam generator test loop and the F-P cavity length and the CCD output voltage of one test point.
5. Conclusions
We demonstrated a F-P sensor which is capable of measuring the radial collision force of a SGT. The sensor with a dimension of 17 × 5 × 3 mm3 showed good performance in humid, high-pressure and vibration environment, with a force measurement range of 0–200 N and a resolution of 1 N. The sensor was suitable for installation in the small contact position between the SGT and the TSP of a real 1:1 steam generator test loop. Next, we will investigate the corresponding optical demodulation system.
Acknowledgments
This work was partially supported by the National Natural Science Foundation of China (Grant No. 51505047), the Foundation and Advanced Research Project of Chongqing (Grant No. cstc2016jcyjA0479) and Fundamental Research Funds for the Central Universities of China (Grant No. 106112016CDJXY120004).
Author Contributions
Peijian Huang and Ning Wang conducted the sensor structure design, and Peijian Huang wrote the paper and performed all the experiments under the supervision of Ning Wang. Junying Li, Yong Zhu and Jie Zhang worked on structure model and contributed to prepare and analyze the experimental data. All authors were involved in modifying the paper, the literature review and the discussion of the results.
Conflicts of Interest
The authors declare no conflict of interest.
References
- Wade, K.C. Steam Generator Degradation and Its Impact on Continued Operation of Pressurized Water Reactors in the United States. In Energy Information Administration/Electric Power Monthly August 1995; Energy Information Administration: Washington, DC, USA, 1995. [Google Scholar]
- Soria, S.R.; Tolley, A.; Yawny, A. Characterization of Damage and Triboparticles Resulting from Fretting of Incoloy 800 Steam Generator Tubes against Different Materials. Wear 2017, 390–391, 198–208. [Google Scholar] [CrossRef]
- Jong, C.J.; Myung, J.J.; Woong, S.K.; Young, H.C.; Hho, J.K. Fretting-Wear Characteristics of Steam Generator Tubes by Foreign Object. Nucl. Eng. Technol. 2003, 35, 442–453. [Google Scholar]
- Frick, T.M.; Sobek, T.E.; Reavis, J.R. Overview on the Development and Implementation of Methodologies to Compute Vibration and Wear of Steam Generator Tubes. In Symposium on Flow-Induced Vibrations, Volume 6: Computational Aspects of Flow-Induced Vibration, Proceedings of the 1984 ASME Winter Annual Meeting, New York, NY, USA, 9–14 December 1984; American Society of Mechanical Engineers: New York, NY, USA, 1984; pp. 149–161. [Google Scholar]
- Attia, M.H.; Magel, E. Experimental Investigation of Long-Term Fretting Wear of Multi-Span Steam Generator Tubes with U-bend Sections. Wear 1999, 225–229, 563–574. [Google Scholar] [CrossRef]
- Attia, H. A Generalized Fretting Wear Theory. Tribol. Int. 2009, 42, 1380–1388. [Google Scholar] [CrossRef]
- Berthold, J.W.; Jeffers, L.A.; Lopushansky, R.L. Fiber Optic Sensors for the Refinery of the Future. In Proceedings of the ISA/IEEE Sensors for Industry Conference, Houston, TX, USA, 19–21 November 2002; pp. 40–43. [Google Scholar]
- Mo, Z.; Xu, W.; Broderick, N. A Fabry-Perot Optical Fiber Force Sensor Based on Intensity Modulation for Needle Tip Force Sensing. In Proceedings of the 6th International Conference on Automation, Robotics and Applications, Queenstown, New Zealand, 17–19 February 2015; pp. 376–380. [Google Scholar]
- Noh, Y.; Sareh, S.; Würdemann, H. Three-Axis Fiber-Optic Body Force Sensor for Flexible Manipulators. IEEE Sens. J. 2016, 16, 1641–1651. [Google Scholar] [CrossRef]
- Tang, G.; Wei, J.; Zhou, W.; Yang, M.; Wu, M.; Xu, X. A Highly Sensitive Force Sensor Based on Two Identical Fiber Bragg Gratings. Meas. Sci. Technol. 2015, 26, 115203. [Google Scholar] [CrossRef]
- Zychowicz, L. Fiber Optic Interferometric Force Sensor with Reduced Temperature Sensitivity. In Proceedings of the Photonics Applications in Astronomy, Communications, Industry, and High Energy Physics Experiments, Wilga, Poland, 28 May–6 June 2017. [Google Scholar]
- Tsuda, H.; Lee, J.R.; Eguchi, S. Impact Damage Monitoring in CFRP Using Fiber Bragg Grating Ultrasound Sensors. In Proceedings of the Nondestructive Evaluation for Health Monitoring and Diagnostics. International Society for Optics and Photonics, San Diego, CA, USA, 26 February–2 March 2006. [Google Scholar]
- Wang, N.; Zhu, Y.; Gong, T. Multichannel Fiber Optic Fabry-Perot Non-scanning Correlation Demodulator. Chin. Opt. Lett. 2013, 11, 10–12. [Google Scholar]
- Lu, E.; Ran, Z.; Peng, F.; Liu, Z.; Xu, F. Demodulation of Micro Fiber-Optic Fabry–Perot Interferometer Using Subcarrier and Dual-Wavelength Method. Opt. Commun. 2012, 285, 1087–1090. [Google Scholar] [CrossRef]
© 2017 by the authors. Licensee MDPI, Basel, Switzerland. This article is an open access article distributed under the terms and conditions of the Creative Commons Attribution (CC BY) license (http://creativecommons.org/licenses/by/4.0/).