Development and Verification of a Novel Robot-Integrated Fringe Projection 3D Scanning System for Large-Scale Metrology

Abstract
:1. Introduction
2. The Proposed Approach
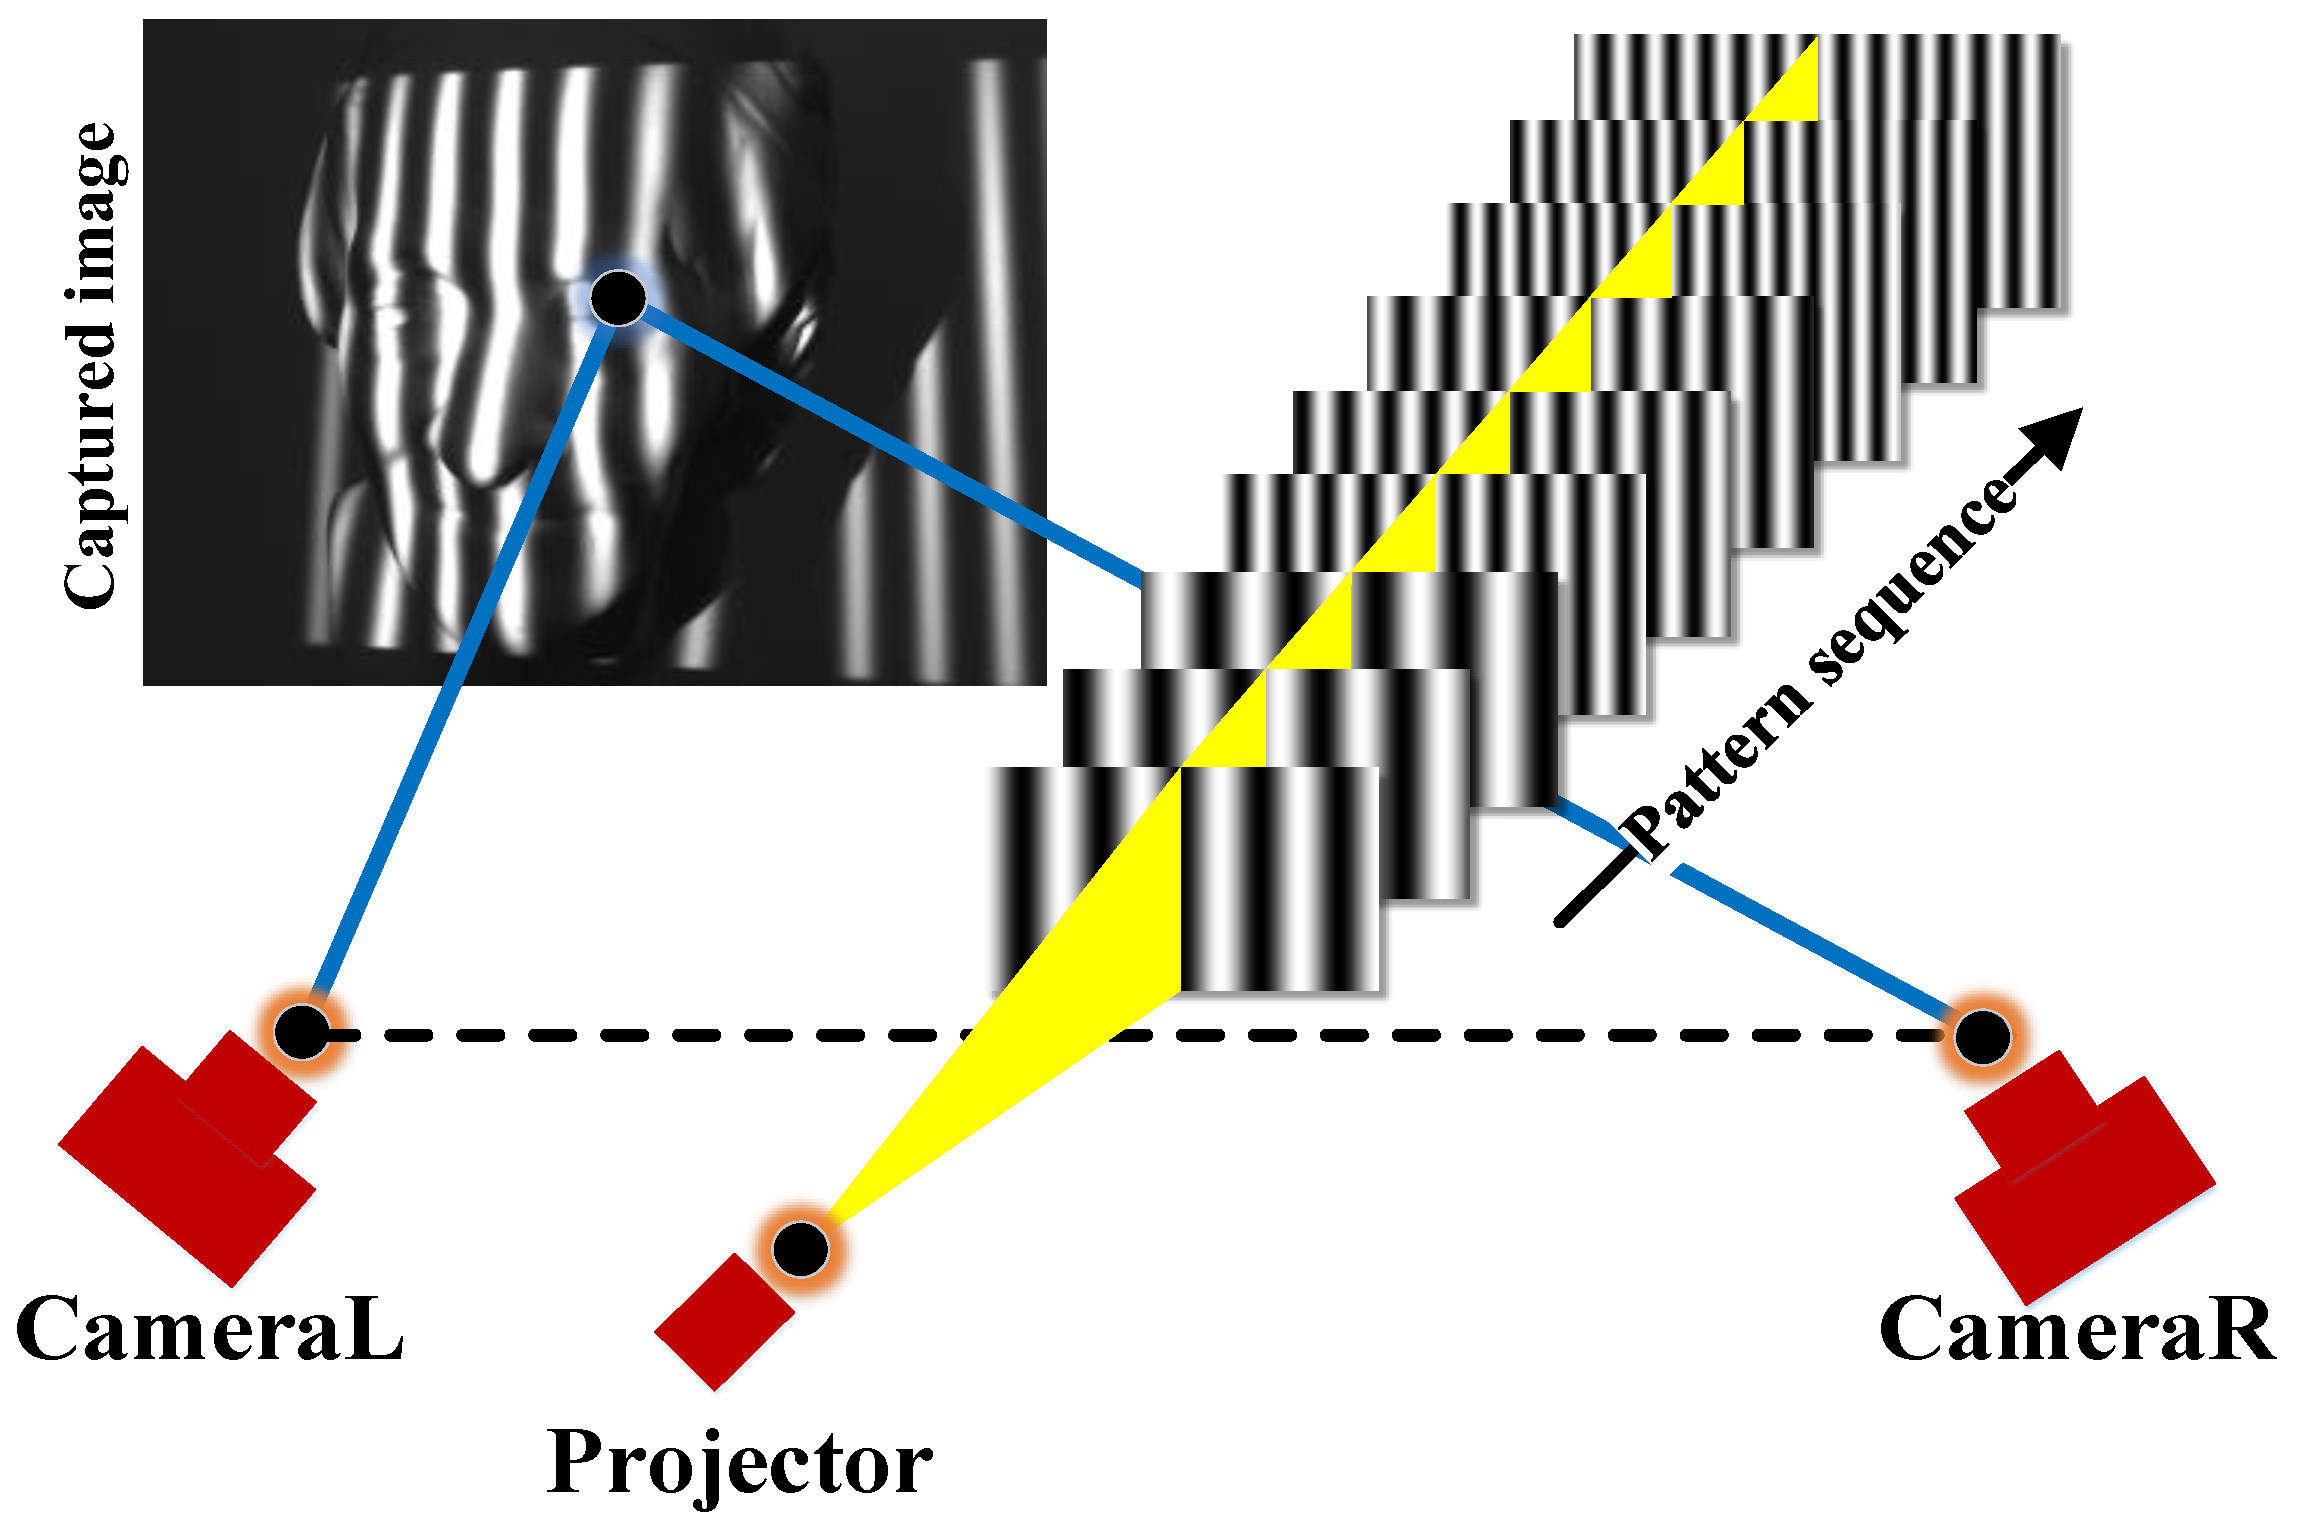
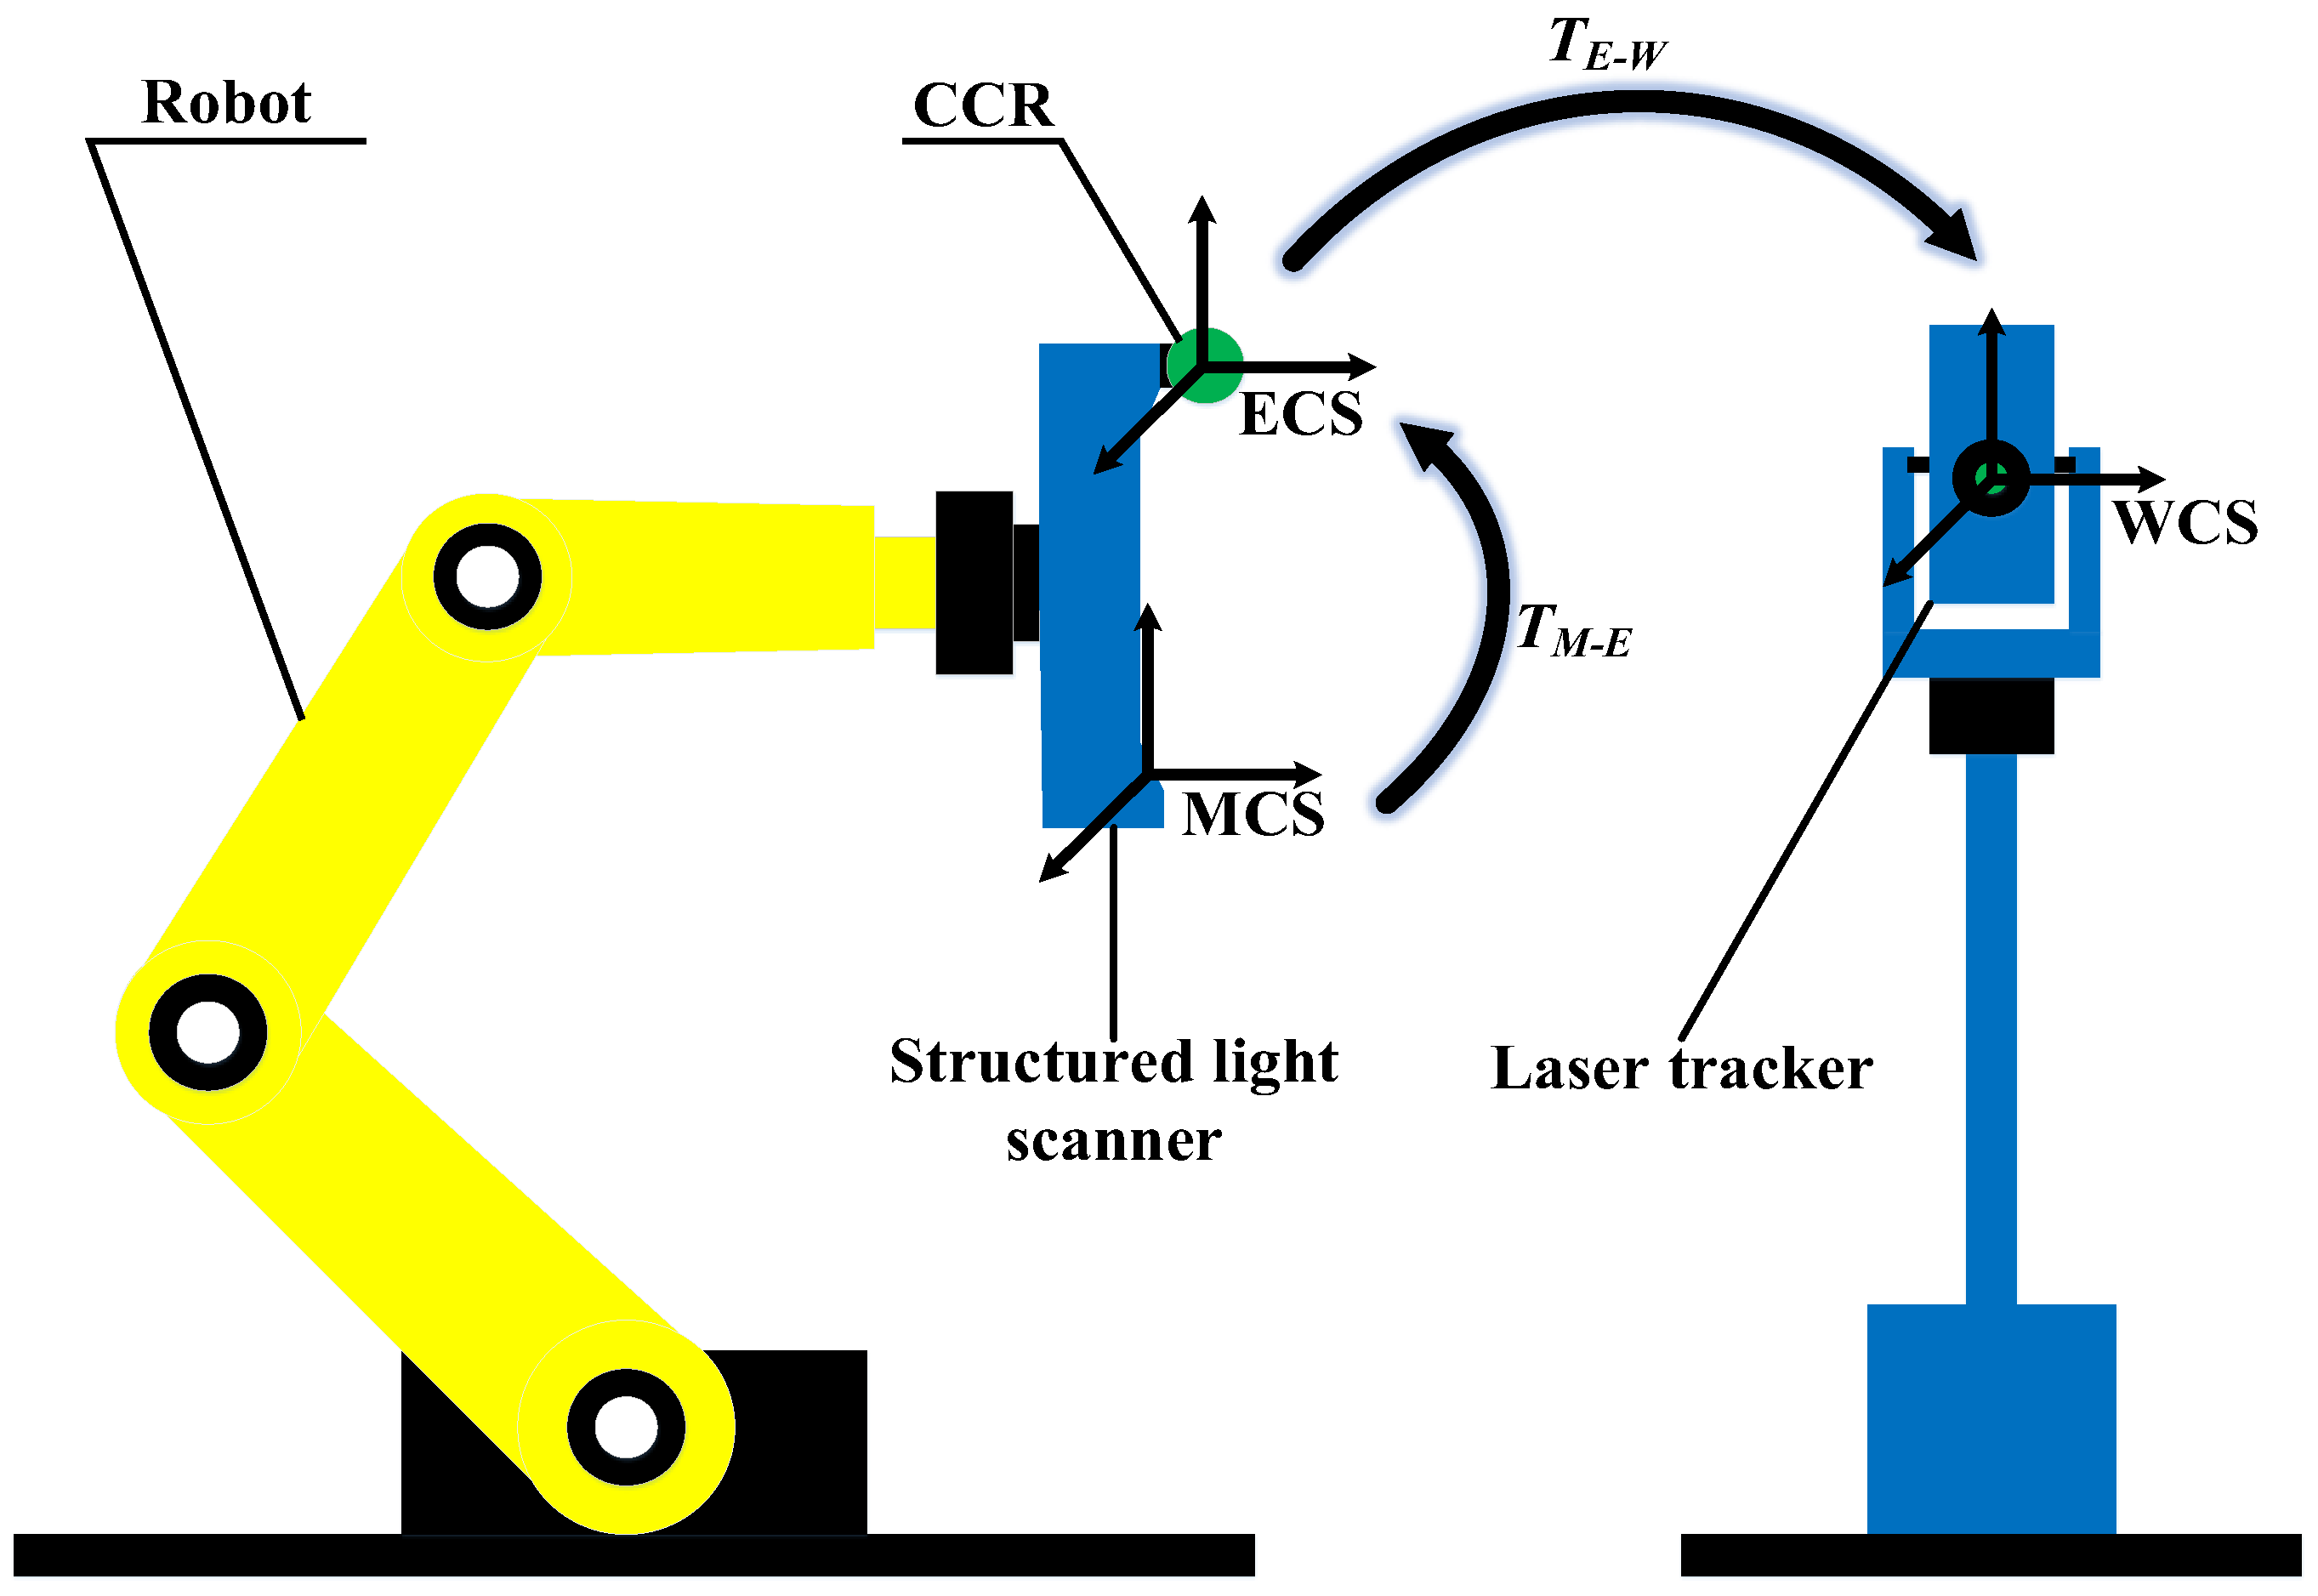
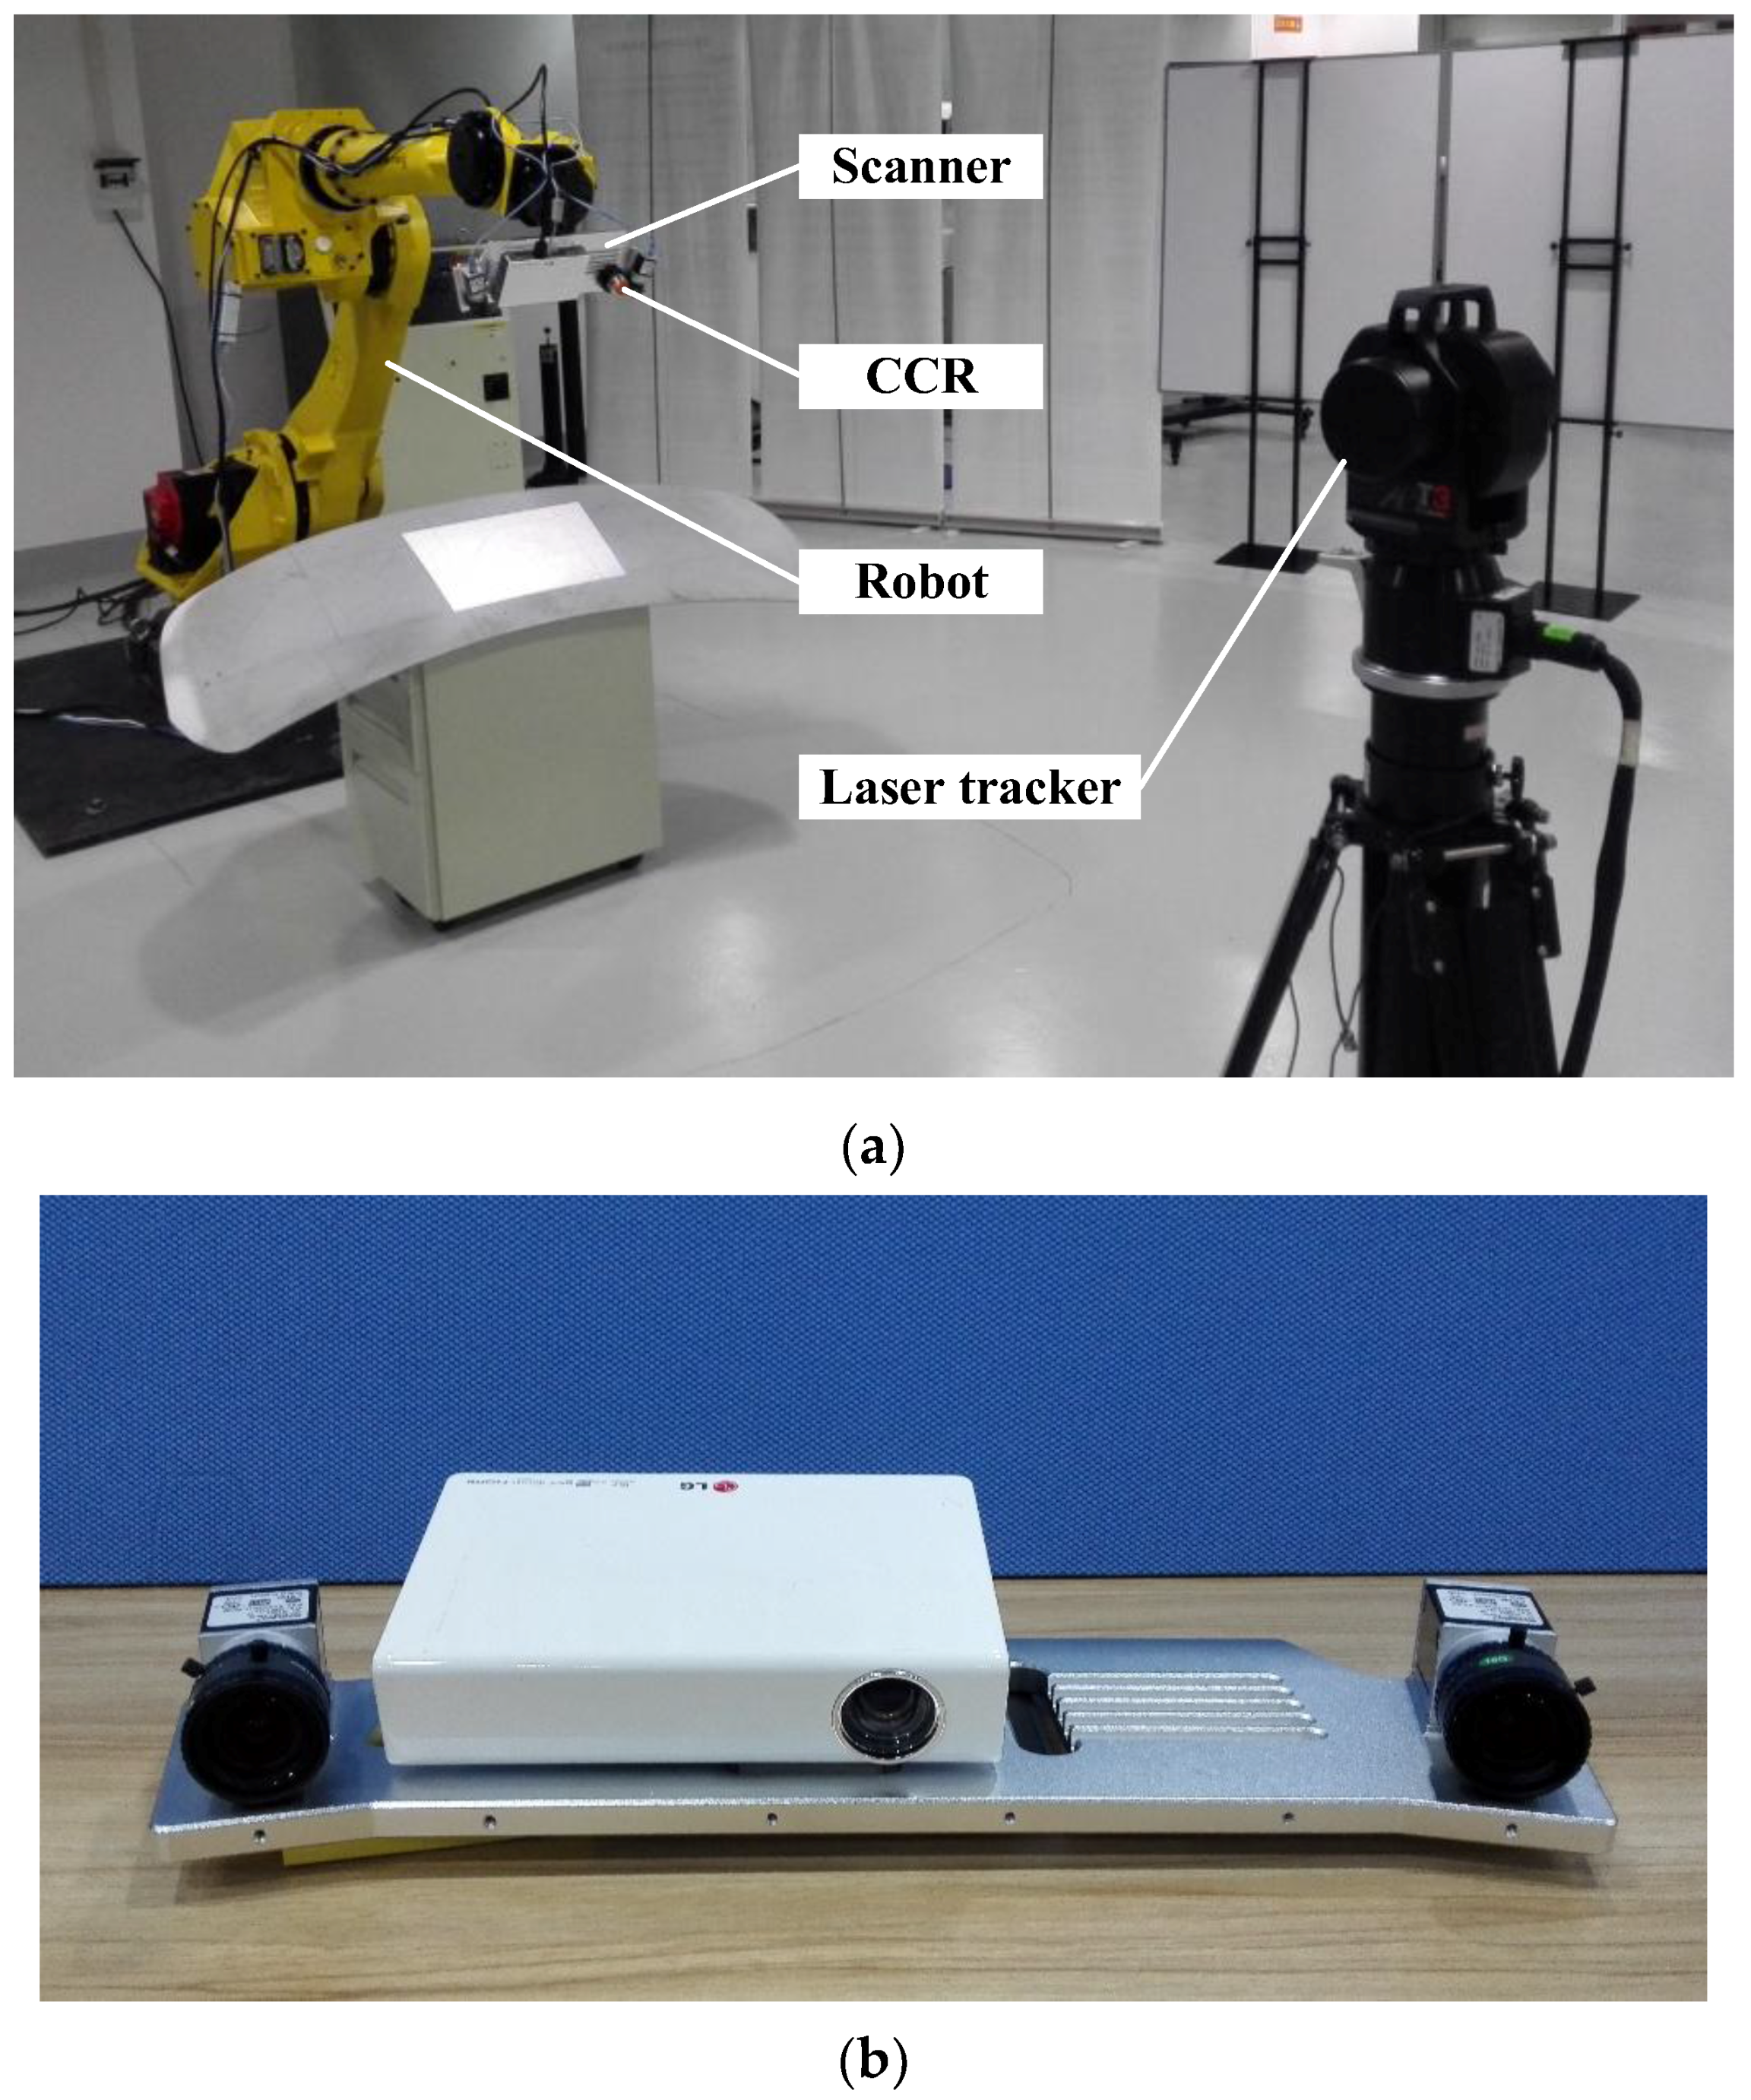
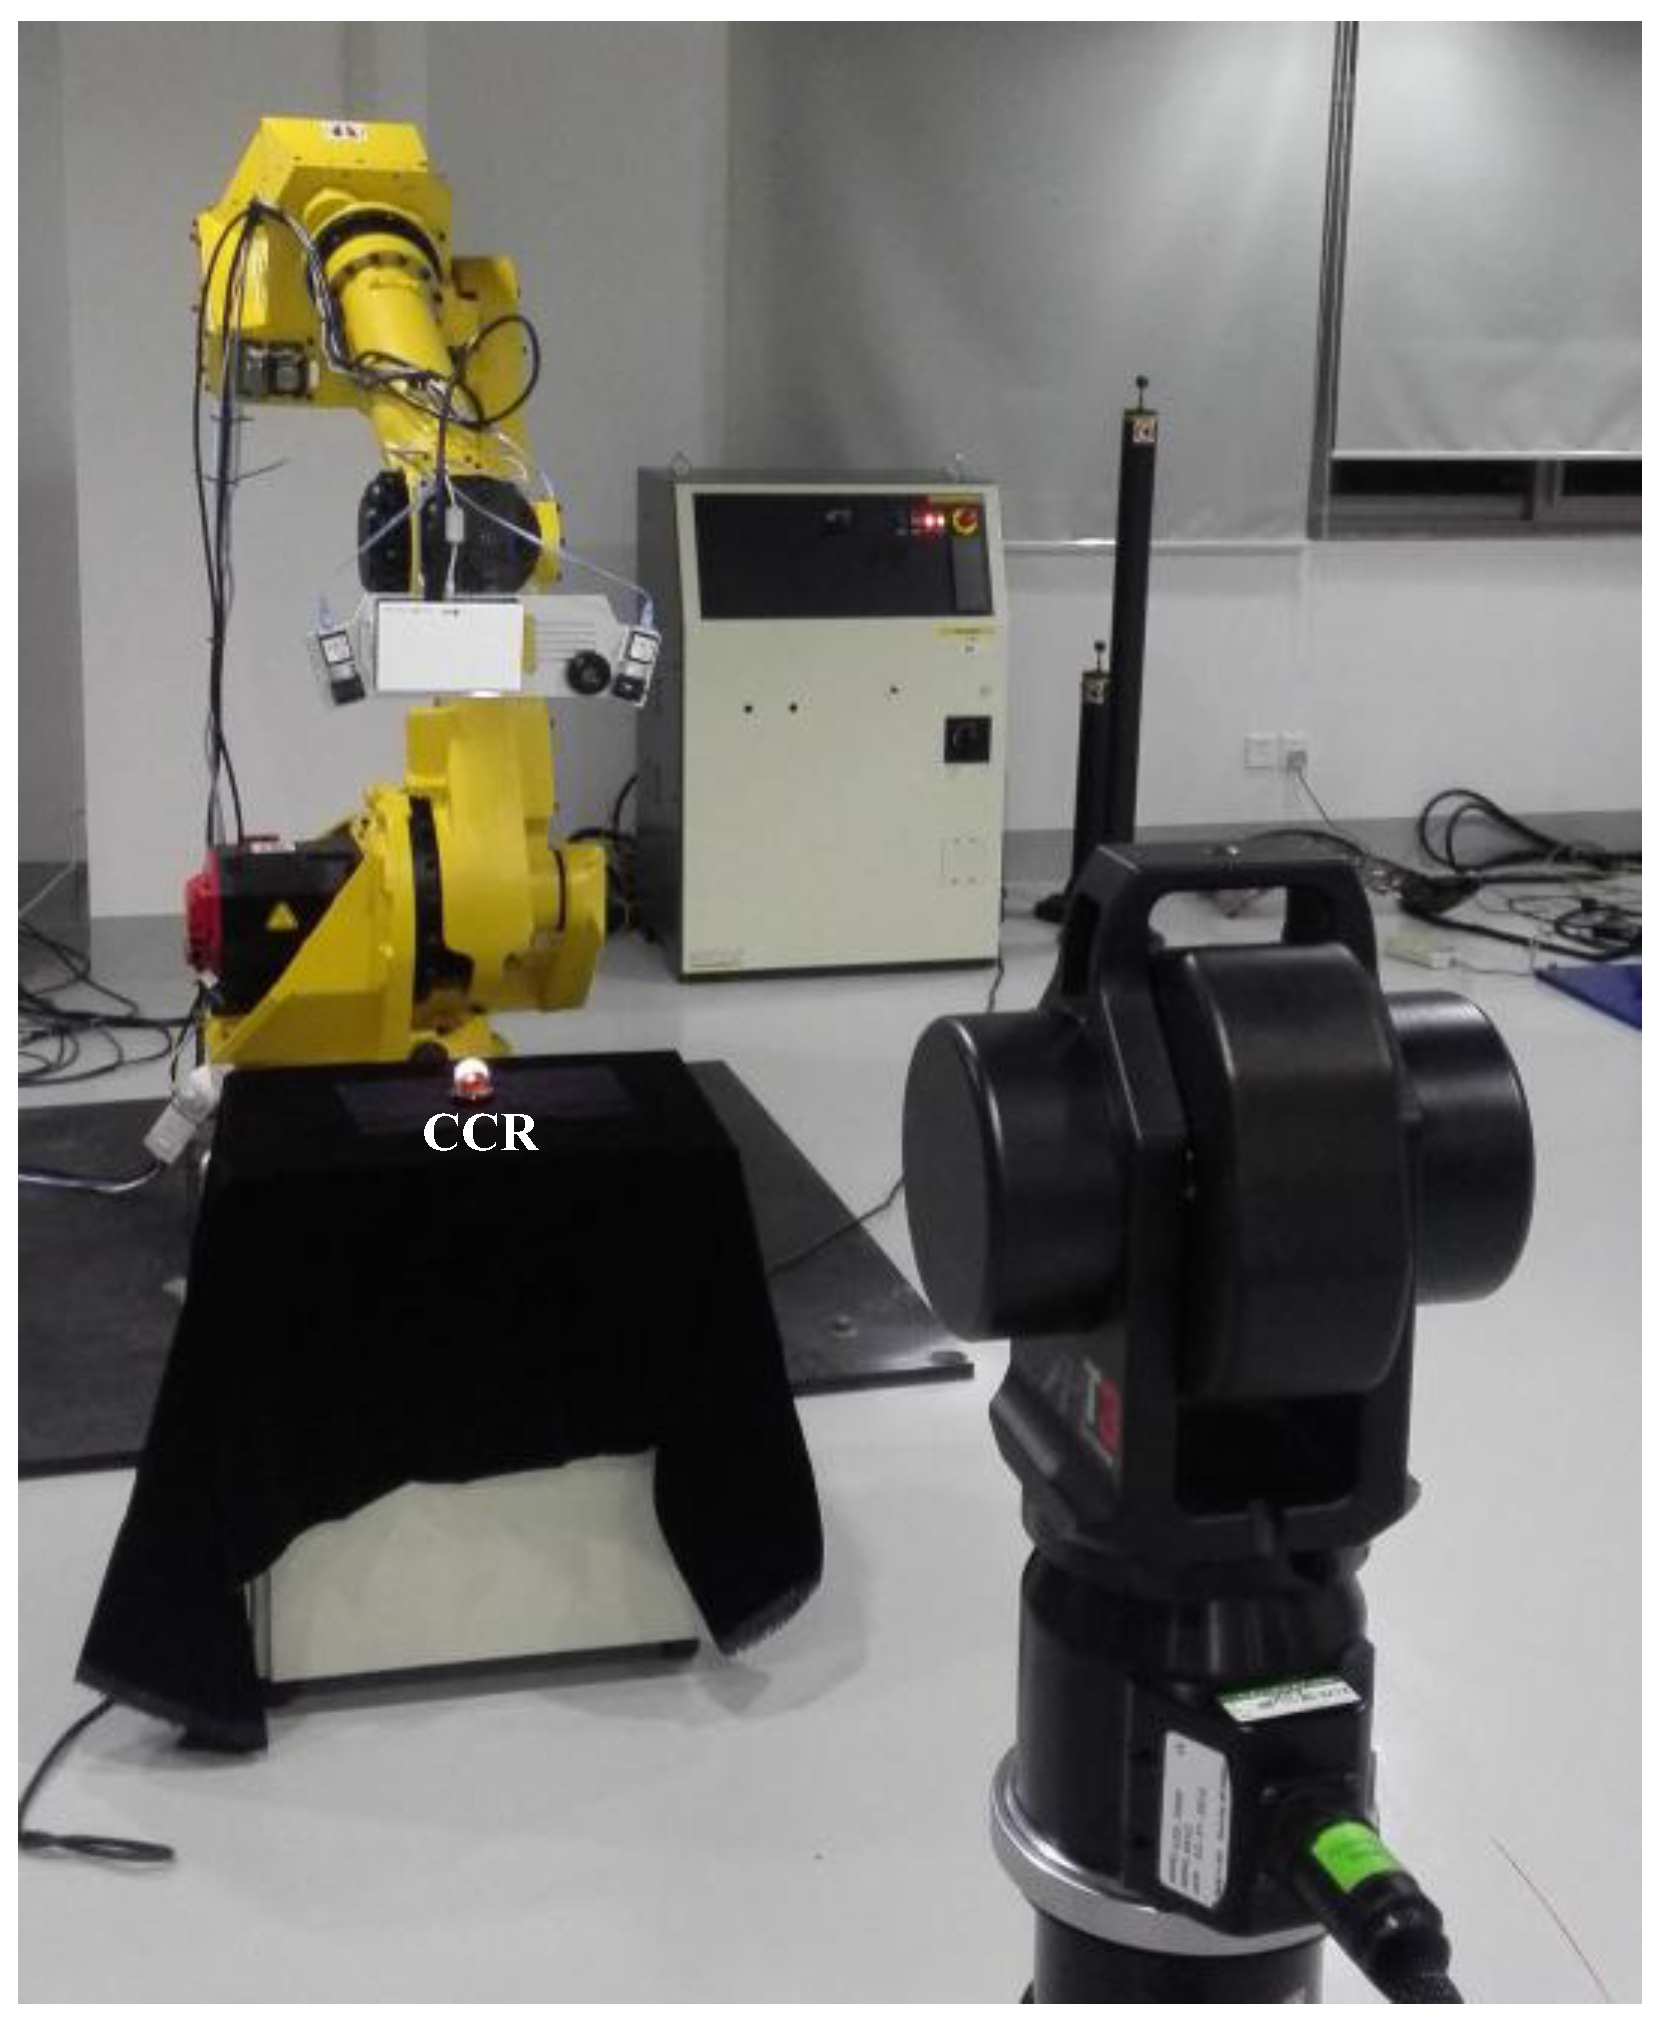
2.1. Measurement Model and System Construction
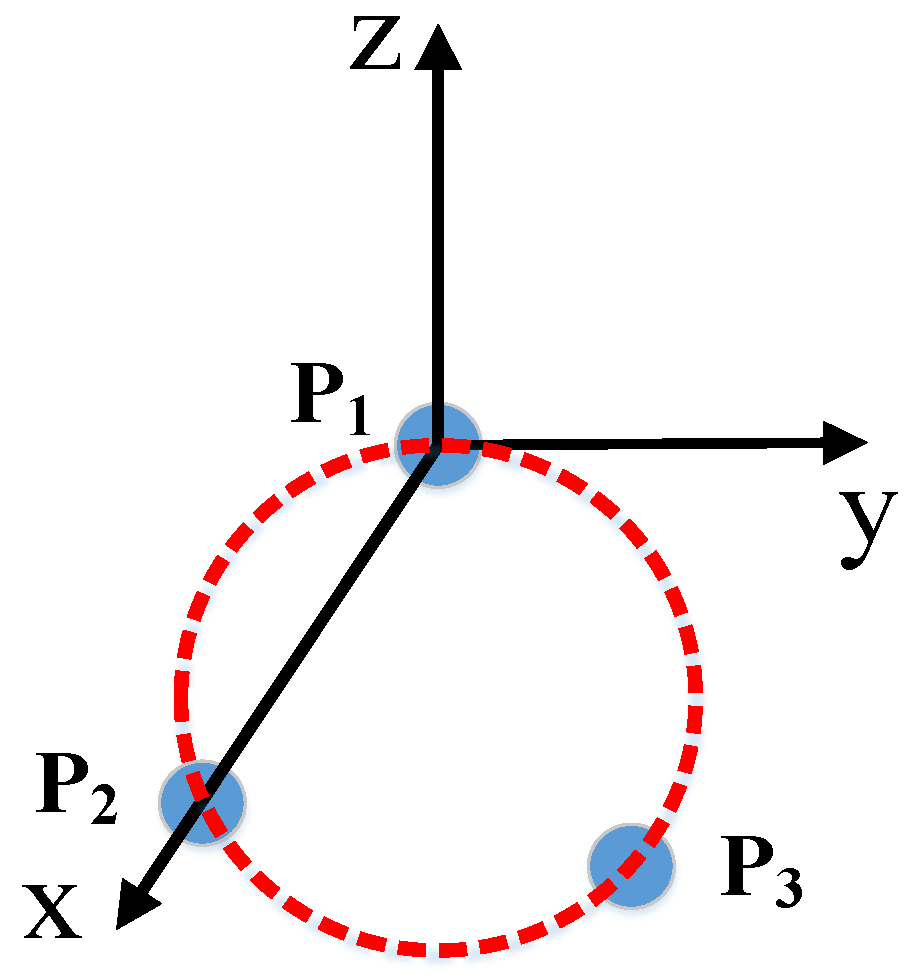
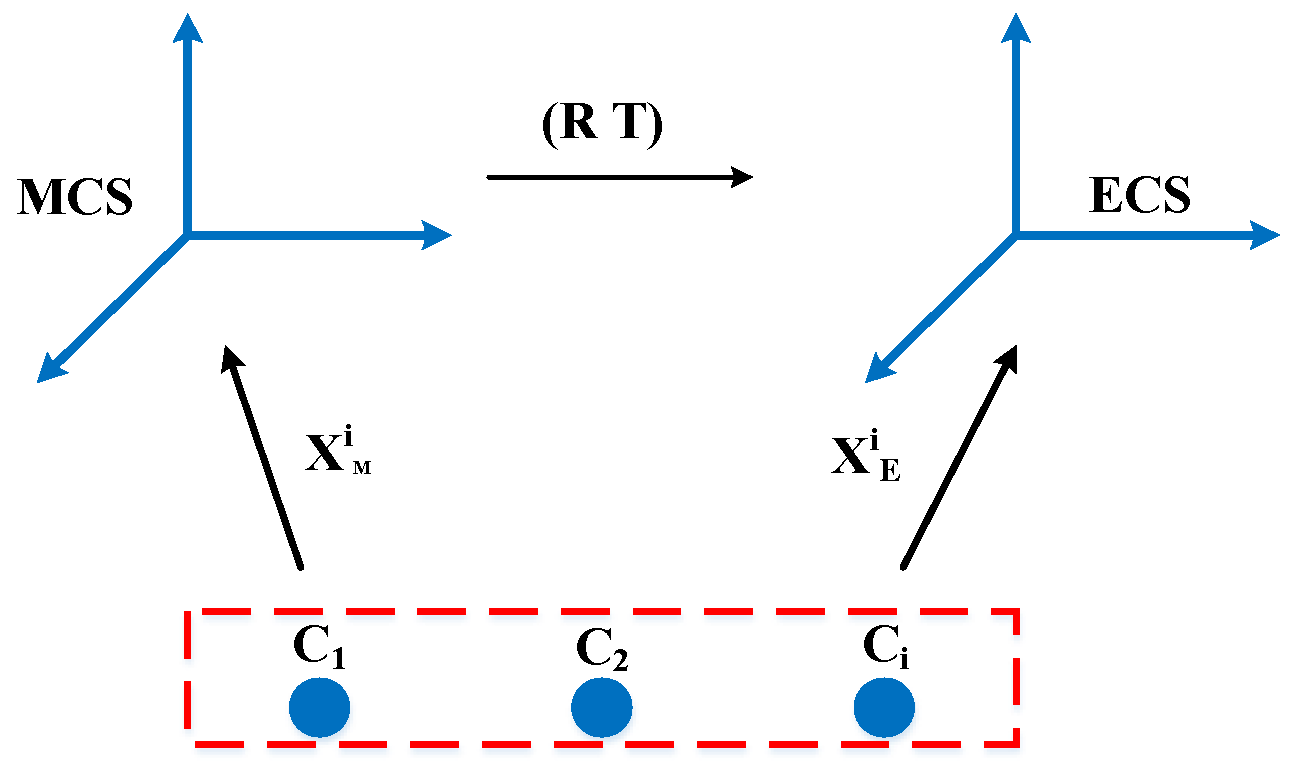
2.2. End Coordinate System Construction
2.3. Hand-Eye Calibration
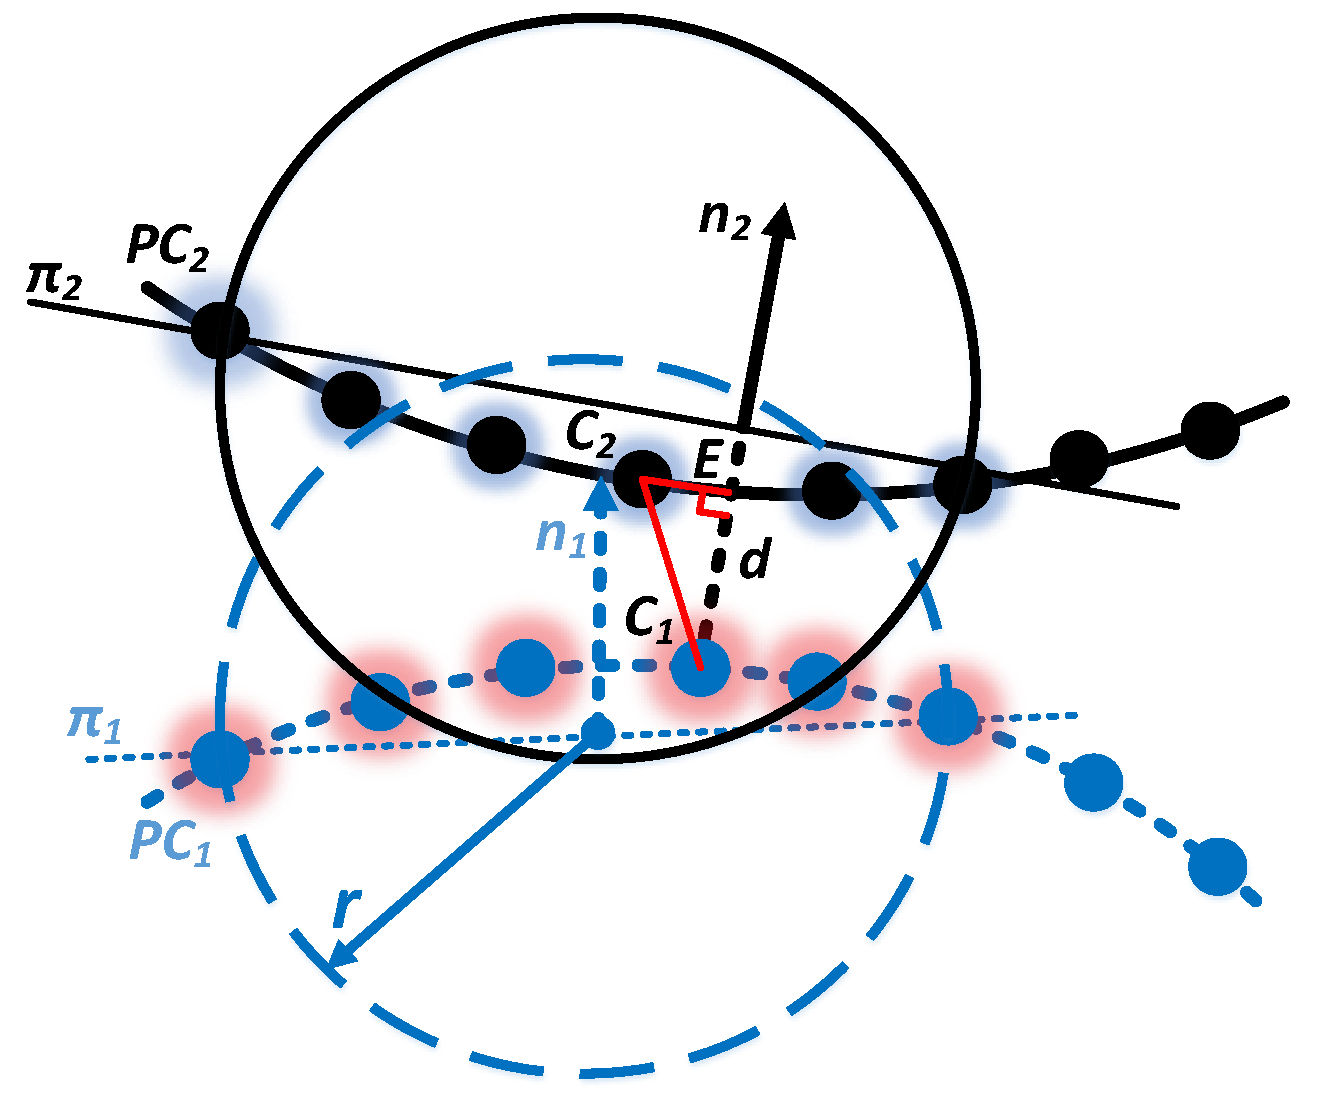
2.4. Global Data Fusion Model
3. Results
3.1. Hand-Eye Calibration
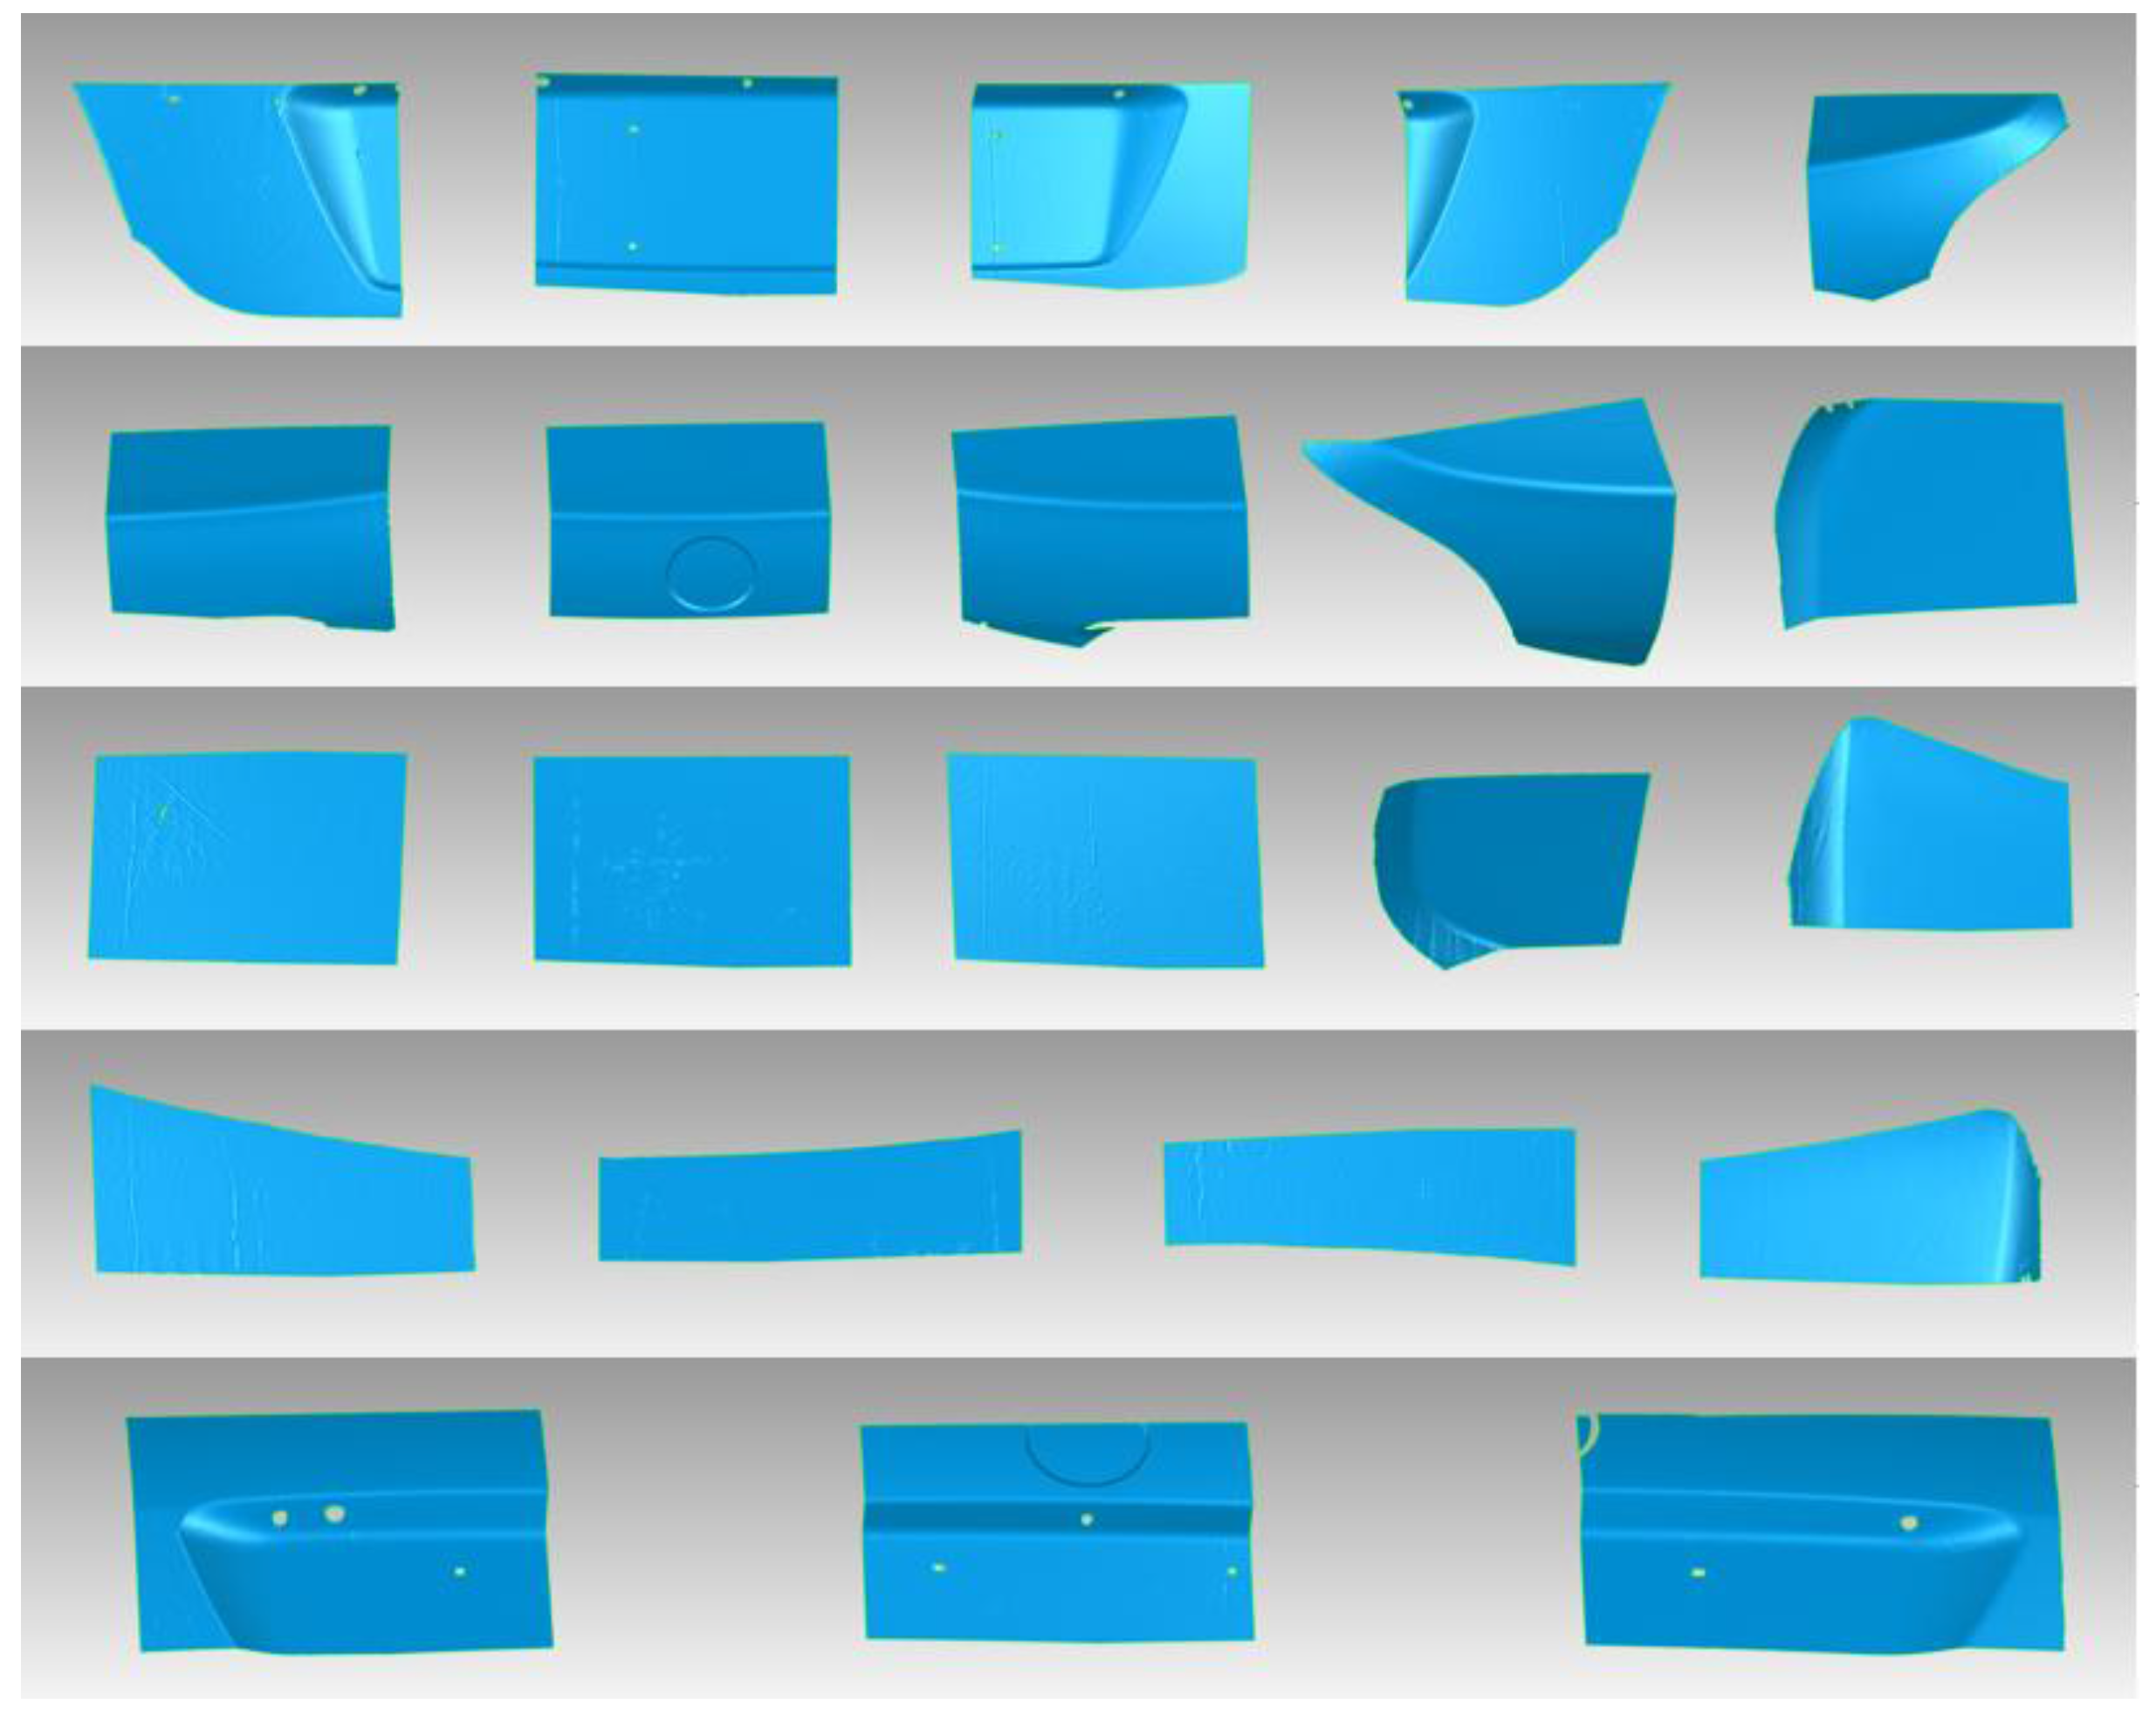
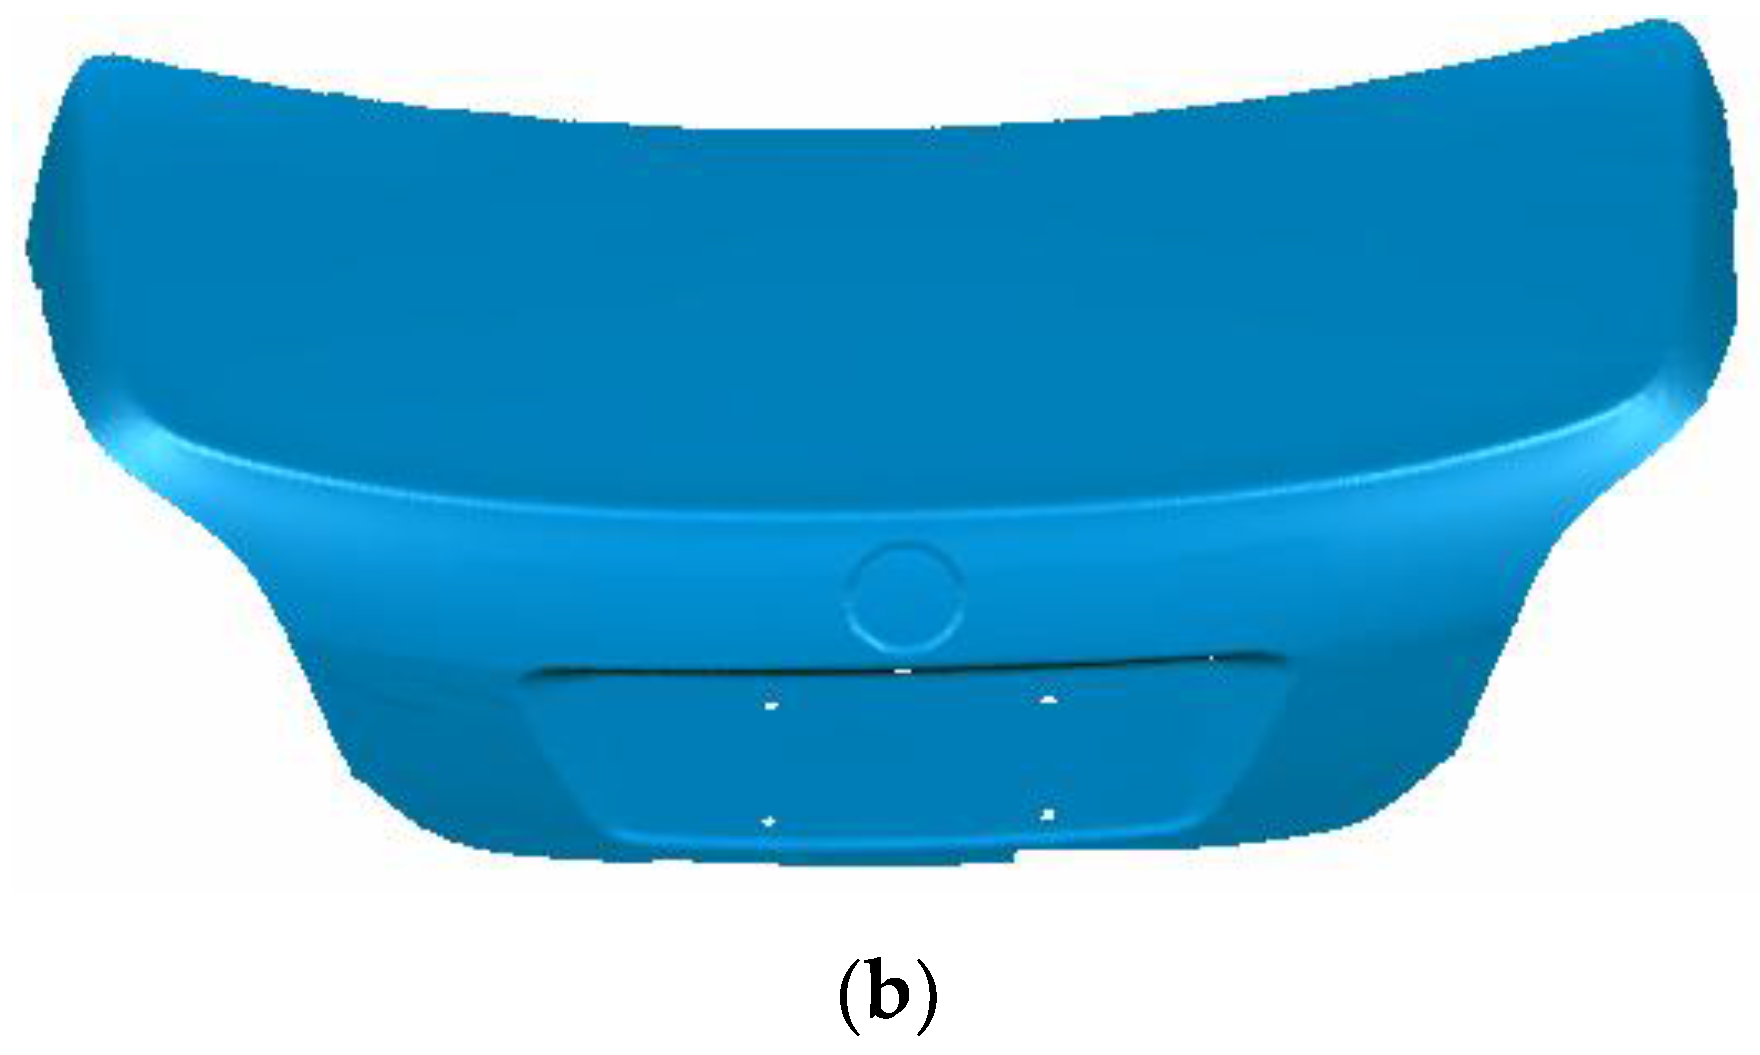
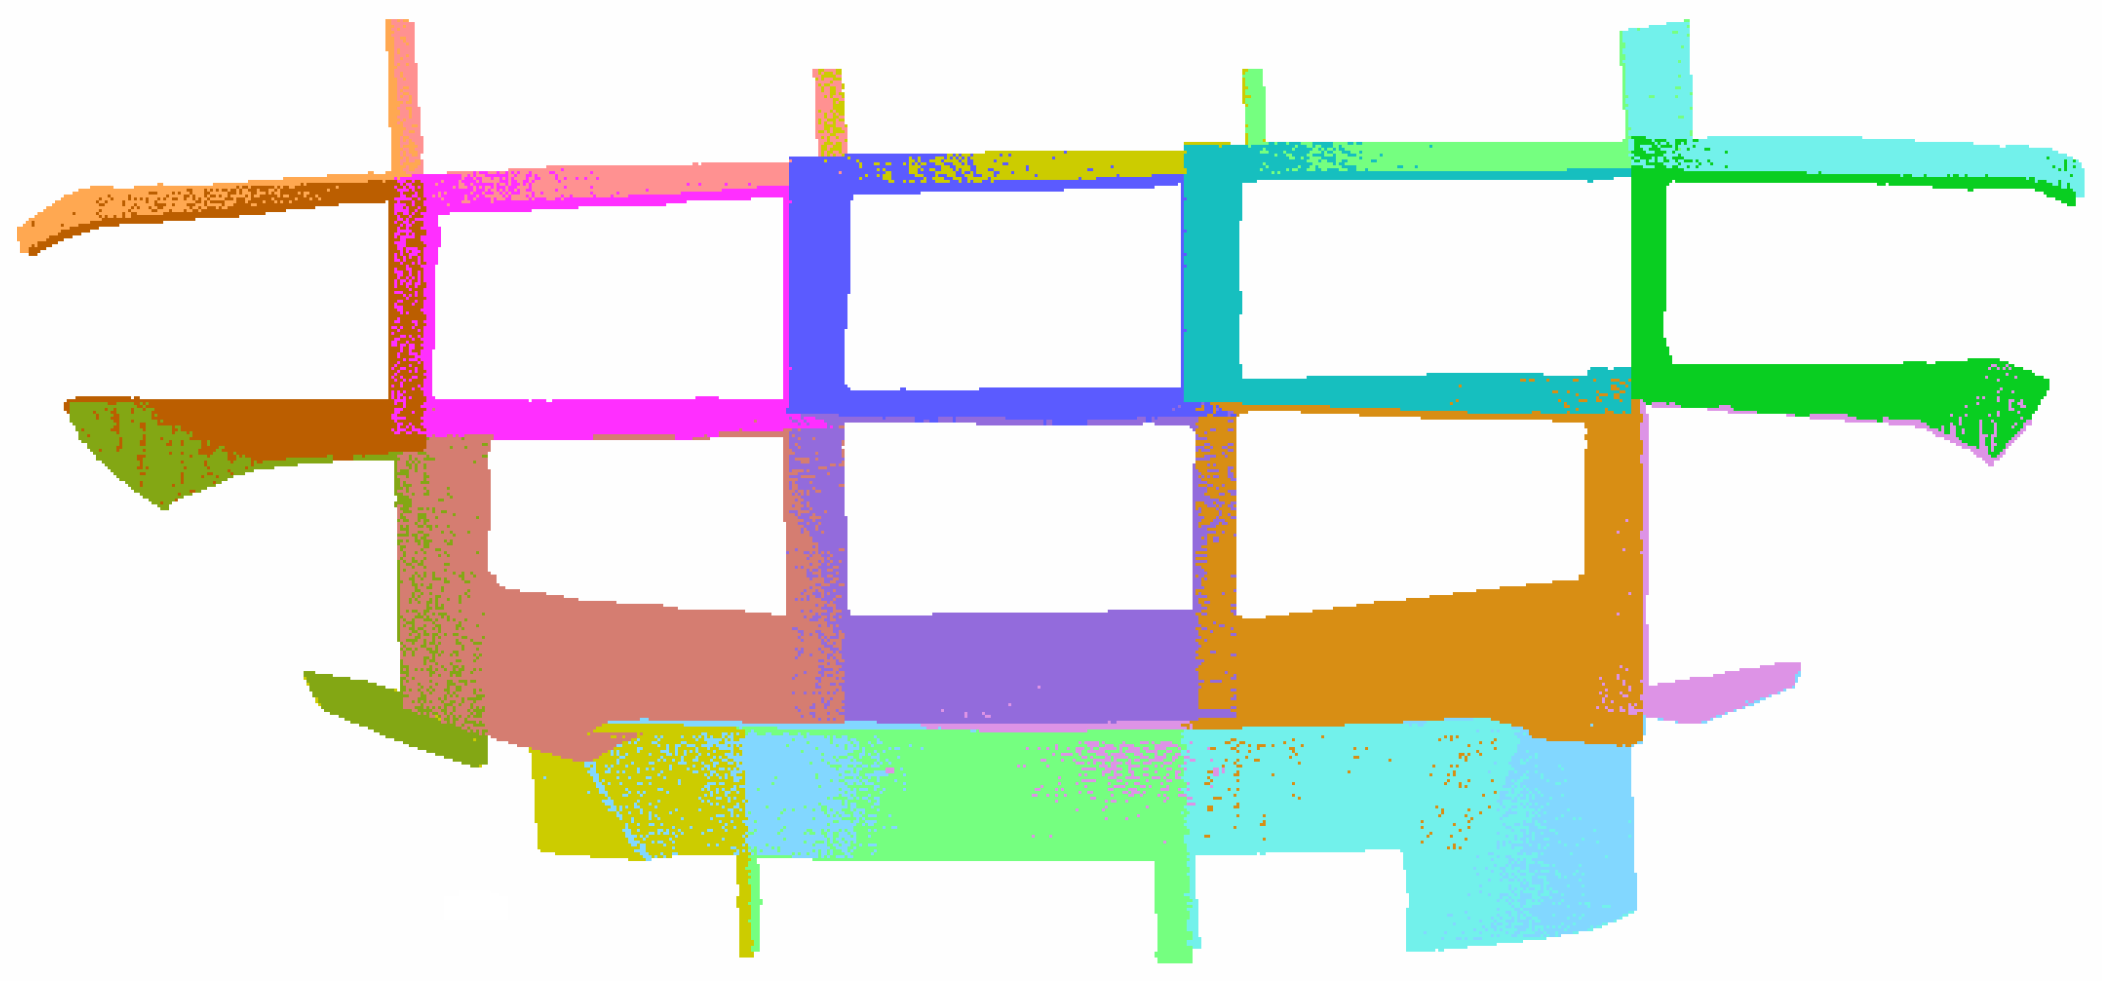
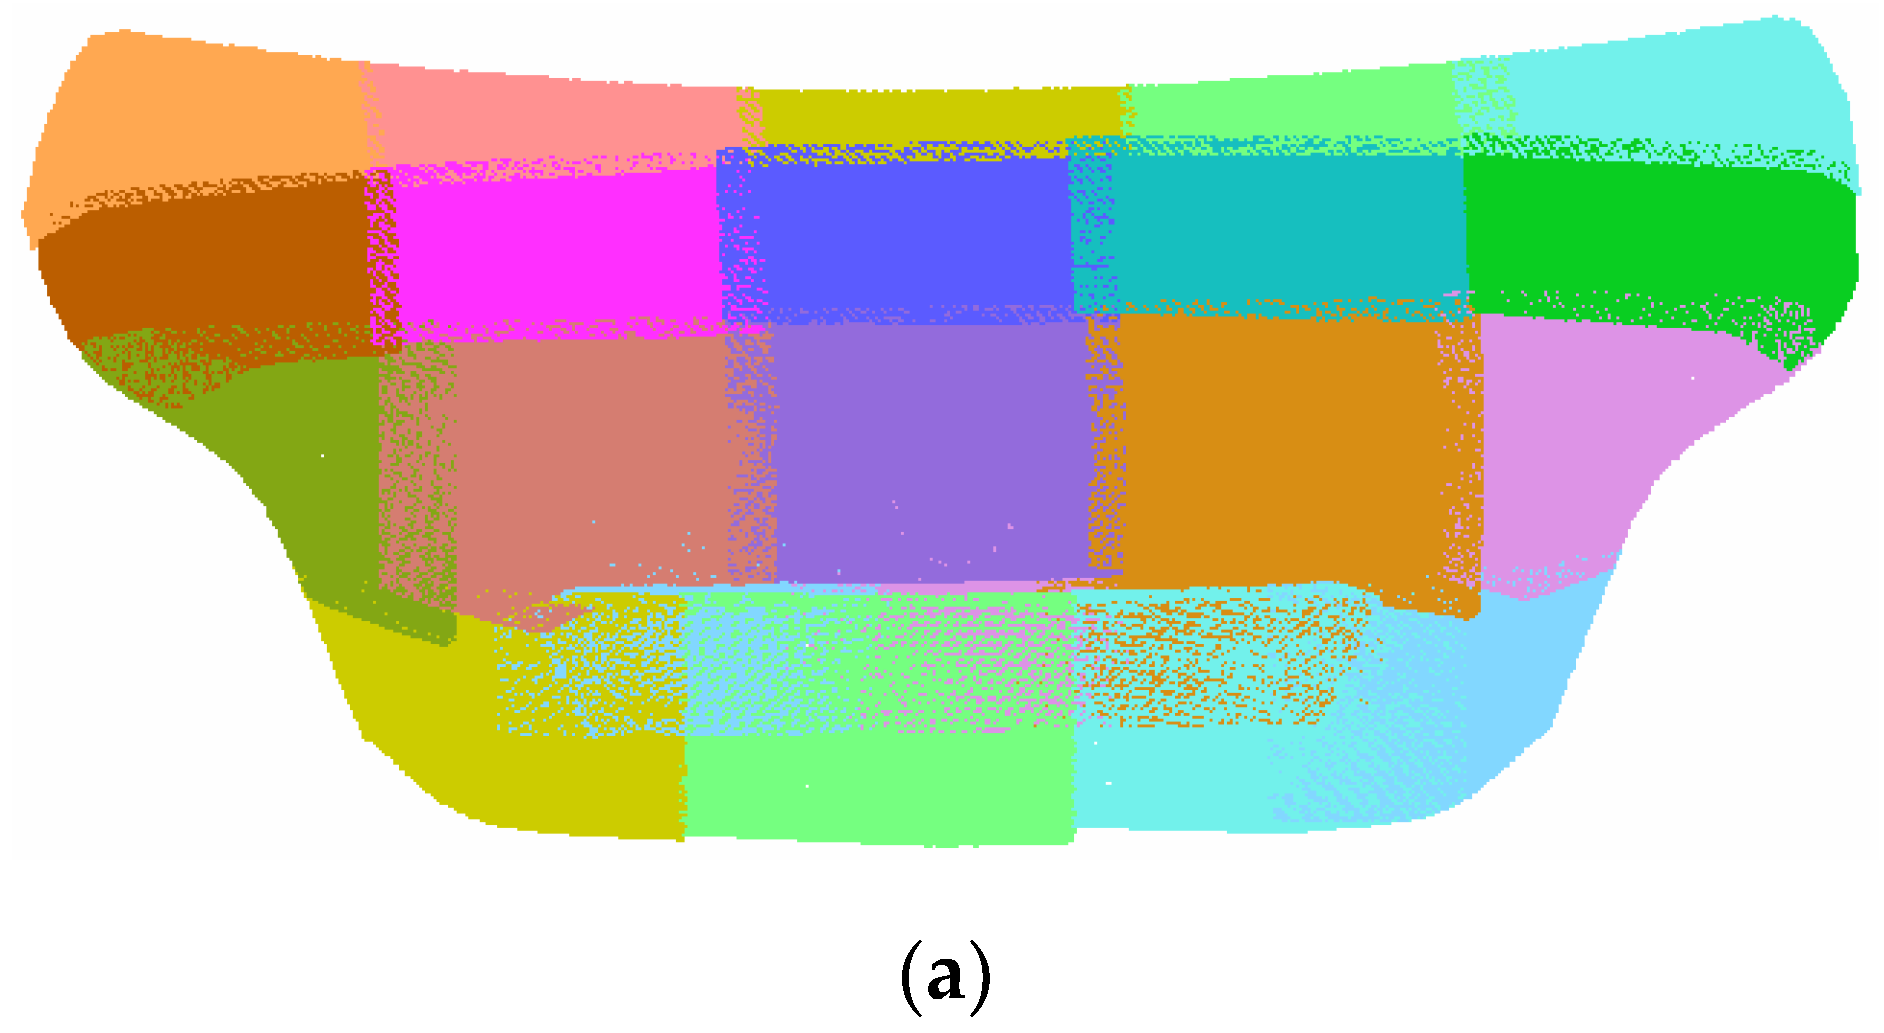
3.2. Global Data Fusion
4. Conclusions
Acknowledgments
Author Contributions
Conflicts of Interest
References
- Chen, F.; Brown, G.M. Overview of 3-D shape measurement using optical methods. Opt. Eng. 2000, 39, 10–22. [Google Scholar]
- Mendikute, A.; Yagüefabra, J.A.; Zatarain, M.; Bertelsen, Á.; Leizea, I. Self-calibrated in-process photogrammetry for large raw part measurement and alignment before machining. Sensors 2017, 17, 2066. [Google Scholar] [CrossRef] [PubMed]
- Sun, B.; Zhu, J.; Yang, L.; Yang, S.; Guo, Y. Sensor for in-motion continuous 3D shape measurement based on dual line-scan cameras. Sensors 2016, 16, 1949. [Google Scholar] [CrossRef] [PubMed]
- Jin, Z.; Yu, C.; Li, J.; Ke, Y. Configuration analysis of the ers points in large-volume metrology system. Sensors 2015, 15, 24397–24408. [Google Scholar] [CrossRef] [PubMed]
- Hexagon T-Scan. Available online: http://www.hexagonmi.com/products/3d-laser-scanners/leica-tscan-5 (accessed on 7 December 2017).
- Kosarevsky, S. Practical way to measure large-scale 2D parts using repositioning on coordinate-measuring machines. Measurement 2010, 43, 837–841. [Google Scholar] [CrossRef]
- Feng, C.X.J.; Saal, A.L.; Salsbury, J.G.; Ness, A.R.; Lin, G.C.S. Design and analysis of experiments in cmm measurement uncertainty study. Precis. Eng. 2007, 31, 94–101. [Google Scholar] [CrossRef]
- Saito, K.; Miyoshi, T.; Yoshikawa, H. Noncontact 3-D digitizing and machining system for free-form surfaces. CIRP Ann. Manuf. Technol. 1991, 40, 483–486. [Google Scholar] [CrossRef]
- Gong, C.; Yuan, J.; Ni, J. Nongeometric error identification and compensation for robotic system by inverse calibration. Int. J. Mach. Tools Manuf. 2000, 40, 2119–2137. [Google Scholar] [CrossRef]
- Ye, S.; Wang, Y.; Ren, Y.; Li, D. Robot Calibration Using Iteration and Differential Kinematics. J. Phys. Conf. Ser. 2006, 48, 1–6. [Google Scholar] [CrossRef]
- Li, J.; Guo, Y.; Zhu, J.; Lin, X.; Xin, Y.; Duan, K.; Tang, Q. Large depth-of-view portable three-dimensional laser scanner and its segmental calibration for robot vision. Opt. Lasers Eng. 2007, 45, 1077–1087. [Google Scholar] [CrossRef]
- Larsson, S.; Kjellander, J.A.P. An Industrial Robot and a Laser Scanner as a Flexible Solution towards an Automatic System for Reverse Engineering of Unknown Objects. In Proceedings of the ASME Biennial Conference on Engineering Systems Design and Analysis, Manchester, UK, 19–22 July 2004; pp. 341–350. [Google Scholar]
- Yu, C.; Chen, X.; Xi, J. Modeling and calibration of a novel one-mirror galvanometric laser scanner. Sensors 2017, 17, 164. [Google Scholar] [CrossRef] [PubMed]
- Li, J.; Chen, M.; Jin, X.; Chen, Y.; Dai, Z.; Ou, Z.; Tang, Q. Calibration of a multiple axes 3-D laser scanning system consisting of robot, portable laser scanner and turntable. Opt.-Int. J. Light Electron Opt. 2011, 122, 324–329. [Google Scholar] [CrossRef]
- Stenz, U.; Hartmann, J.; Paffenholz, J.A.; Neumann, I. A framework based on reference data with superordinate accuracy for the quality analysis of terrestrial laser scanning-based multi-sensor-systems. Sensors 2017, 17, 1886. [Google Scholar] [CrossRef] [PubMed]
- Yin, S.; Ren, Y.; Guo, Y.; Zhu, J.; Yang, S.; Ye, S. Development and calibration of an integrated 3D scanning system for high-accuracy large-scale metrology. Measurement 2014, 54, 65–76. [Google Scholar] [CrossRef]
- Kumar, U.P.; Somasundaram, U.; Kothiyal, M.P.; Mohan, N.K. Single frame digital fringe projection profilometry for 3-d surface shape measurement. Opt.-Int. J. Light Electron Opt. 2013, 124, 166–169. [Google Scholar] [CrossRef]
- Bräuerburchardt, C.; Breitbarth, A.; Kühmstedt, P.; Notni, G. High-speed three-dimensional measurements with a fringe projection-based optical sensor. Opt. Eng. 2014, 53, 112213. [Google Scholar] [CrossRef]
- Gao, B.Z.; Wang, M.; Peng, X.; Liu, X.; Yin, Y. Fringe projection 3D microscopy with the general imaging model. Opt. Express 2015, 23, 6846–6857. [Google Scholar]
- Zhang, C.; Zhao, H.; Gu, F.; Ma, Y. Phase unwrapping algorithm based on multi-frequency fringe projection and fringe background for fringe projection profilometry. Meas. Sci. Technol. 2015, 26, 045203. [Google Scholar] [CrossRef]
- Zhang, C.; Zhao, H.; Zhang, L.; Wang, X. Full-field phase error detection and compensation method for digital phase-shifting fringe projection profilometry. Meas. Sci. Technol. 2015, 26, 035201. [Google Scholar] [CrossRef]
- Chen, X.; Xi, J.T.; Jiang, T.; Jin, Y. Research and development of an accurate 3D shape measurement system based on fringe projection: Model analysis and performance evaluation. Precis. Eng. 2008, 32, 215–221. [Google Scholar]
- Chen, X.; Xi, J.; Jin, Y. Accuracy improvement for 3D shape measurement system based on gray-code and phase-shift structured light projection. In Proceedings of the International Symposium on Multispectral Image Processing and Pattern Recognition, Wuhan, China, 15 November 2007. [Google Scholar]
- Paoli, A.; Razionale, A.V. Large yacht hull measurement by integrating optical scanning with mechanical tracking-based methodologies. Robot. Comput.-Integr. Manuf. 2012, 28, 592–601. [Google Scholar] [CrossRef]
- Chen, X.; Xi, J.; Jin, Y.; Sun, J. Accurate calibration for a camera–projector measurement system based on structured light projection. Opt. Lasers Eng. 2009, 47, 310–319. [Google Scholar] [CrossRef]
- Zhang, Z. A flexible new technique for camera calibration. IEEE Trans. Pattern Anal. Mach. Intell. 2000, 22, 1330–1334. [Google Scholar] [CrossRef]
- Rusu, R.B. Semantic 3D object maps for everyday manipulation in human living environments. KI Künstliche Intell. 2010, 24, 345–348. [Google Scholar] [CrossRef]
- Mitra, N.J.; Nguyen, A. Estimating surface normals in noisy point cloud data. Int. J. Comput. Geom. Appl. 2004, 14, 0400147. [Google Scholar] [CrossRef]


| WCS | ECS | MCS | |||||||
|---|---|---|---|---|---|---|---|---|---|
| X | Y | Z | X | Y | Z | X | Y | Z | |
| No.1 | −603.234 | −570.824 | −623.064 | −654.862 | −154.646 | −104.806 | 289.155 | 88.323 | 605.415 |
| No.2 | −527.529 | −541.327 | −623.513 | −667.577 | −167.702 | −25.628 | 285.935 | 9.639 | 622.489 |
| No.3 | −440.814 | −505.516 | −621.711 | −679.309 | −183.062 | 66.197 | 280.02 | −81.623 | 639.968 |
| No.4 | −456.599 | −455.086 | −621.325 | −649.743 | −226.843 | 67.418 | 227.691 | −83.119 | 640.253 |
| No.5 | −540.046 | −475.961 | −622.876 | −631.899 | −223.167 | −16.662 | 220.646 | 0.517 | 624.339 |
| No.6 | −634.259 | −513.428 | −622.370 | −616.476 | −206.324 | −115.448 | 225.462 | 98.891 | 602.866 |
| No.7 | −657.153 | −469.599 | −621.906 | −587.494 | −245.701 | −122.851 | 176.813 | 106.193 | 601.124 |
| No.8 | −581.189 | −435.511 | −622.558 | −598.298 | −262.613 | −42.041 | 169.253 | 25.723 | 618.982 |
| No.9 | −476.216 | −395.233 | −620.951 | −614.414 | −278.986 | 68.033 | 165.075 | 49.782 | 551.496 |
| No.10 | −494.938 | −344.801 | −620.797 | −584.017 | −323.345 | 66.487 | 111.551 | −82.539 | 640.278 |
| No.11 | −577.894 | −369.441 | −621.975 | −567.816 | −316.284 | −18.234 | 107.993 | 1.811 | 623.791 |
| No.12 | −671.393 | −671.393 | −621.606 | −549.986 | −304.248 | −114.556 | 107.749 | 97.758 | 603.093 |
| No.13 | −690.162 | −353.111 | −621.409 | −520.717 | −346.523 | −116.918 | 56.707 | 99.861 | 602.826 |
| No.14 | −618.261 | −325.513 | −621.534 | −532.745 | −358.414 | −41.782 | 53.710 | 25.136 | 618.746 |
| No.15 | −513.567 | −284.161 | −620.443 | −548.676 | −375.996 | 68.258 | 48.626 | −84.303 | 640.652 |
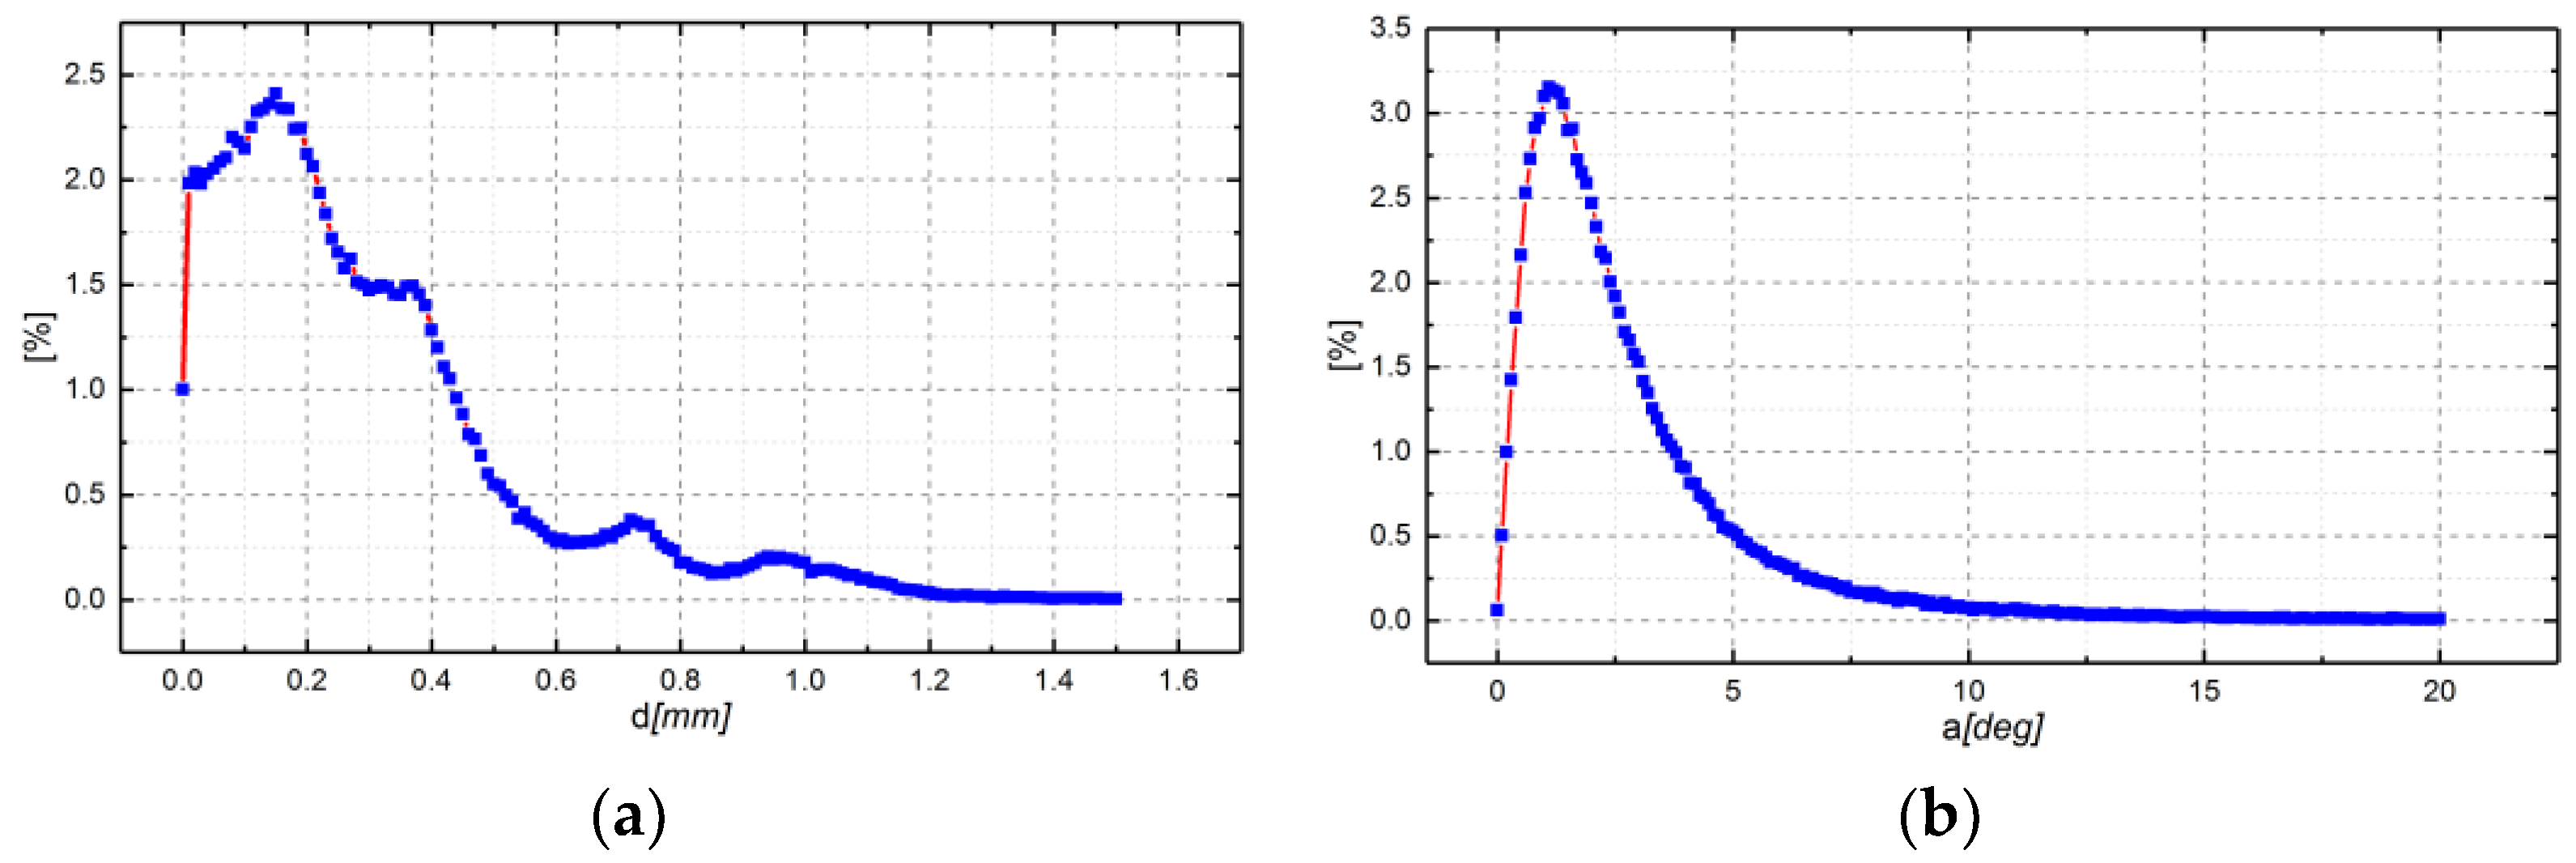
| max | min | |||
|---|---|---|---|---|
| d (mm) | 1.5081 | 0 | 0.2965 | 0.2465 |
| A (deg.) | 20.0841 | 0.0029 | 2.8333 | 2.6185 |
© 2017 by the authors. Licensee MDPI, Basel, Switzerland. This article is an open access article distributed under the terms and conditions of the Creative Commons Attribution (CC BY) license (http://creativecommons.org/licenses/by/4.0/).
Share and Cite
Du, H.; Chen, X.; Xi, J.; Yu, C.; Zhao, B. Development and Verification of a Novel Robot-Integrated Fringe Projection 3D Scanning System for Large-Scale Metrology. Sensors 2017, 17, 2886. https://doi.org/10.3390/s17122886
Du H, Chen X, Xi J, Yu C, Zhao B. Development and Verification of a Novel Robot-Integrated Fringe Projection 3D Scanning System for Large-Scale Metrology. Sensors. 2017; 17(12):2886. https://doi.org/10.3390/s17122886
Chicago/Turabian StyleDu, Hui, Xiaobo Chen, Juntong Xi, Chengyi Yu, and Bao Zhao. 2017. "Development and Verification of a Novel Robot-Integrated Fringe Projection 3D Scanning System for Large-Scale Metrology" Sensors 17, no. 12: 2886. https://doi.org/10.3390/s17122886
APA StyleDu, H., Chen, X., Xi, J., Yu, C., & Zhao, B. (2017). Development and Verification of a Novel Robot-Integrated Fringe Projection 3D Scanning System for Large-Scale Metrology. Sensors, 17(12), 2886. https://doi.org/10.3390/s17122886