High-Speed Focus Inspection System Using a Position-Sensitive Detector

 ,
, 
Abstract
:1. Introduction
2. The Conventional Focus Inspection System
3. Proposed Focus Inspection System
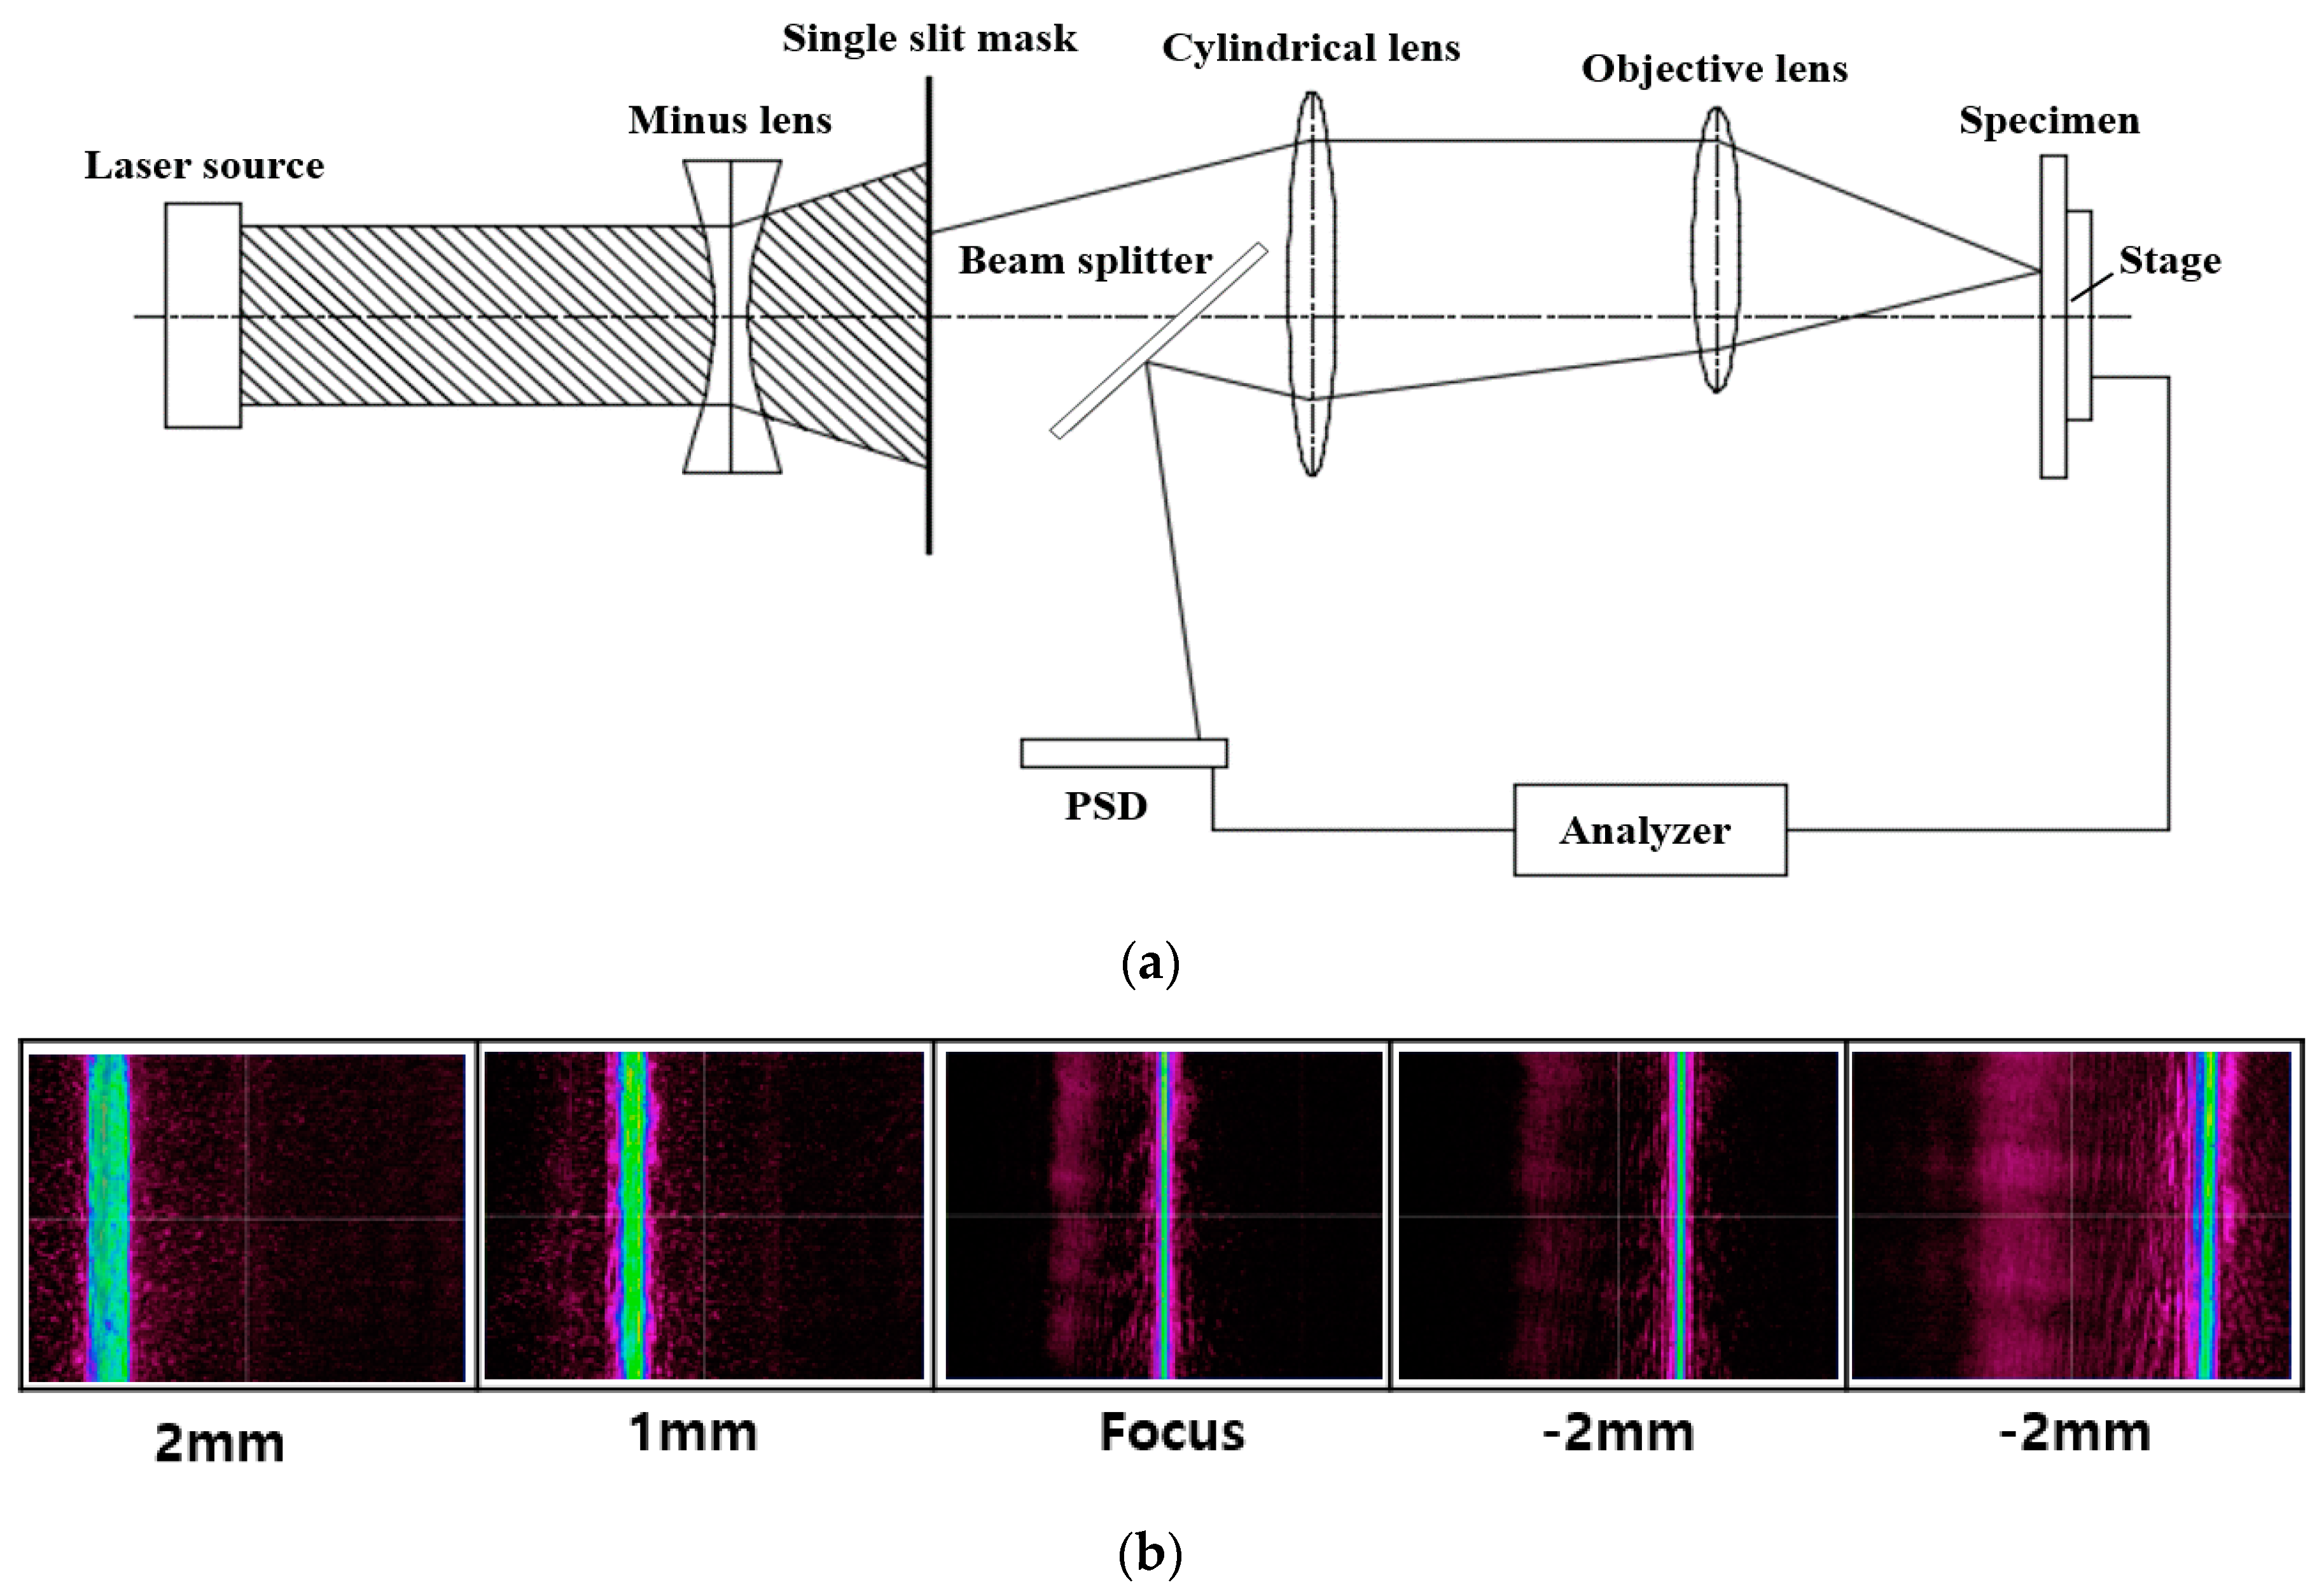
3.1. Methodology
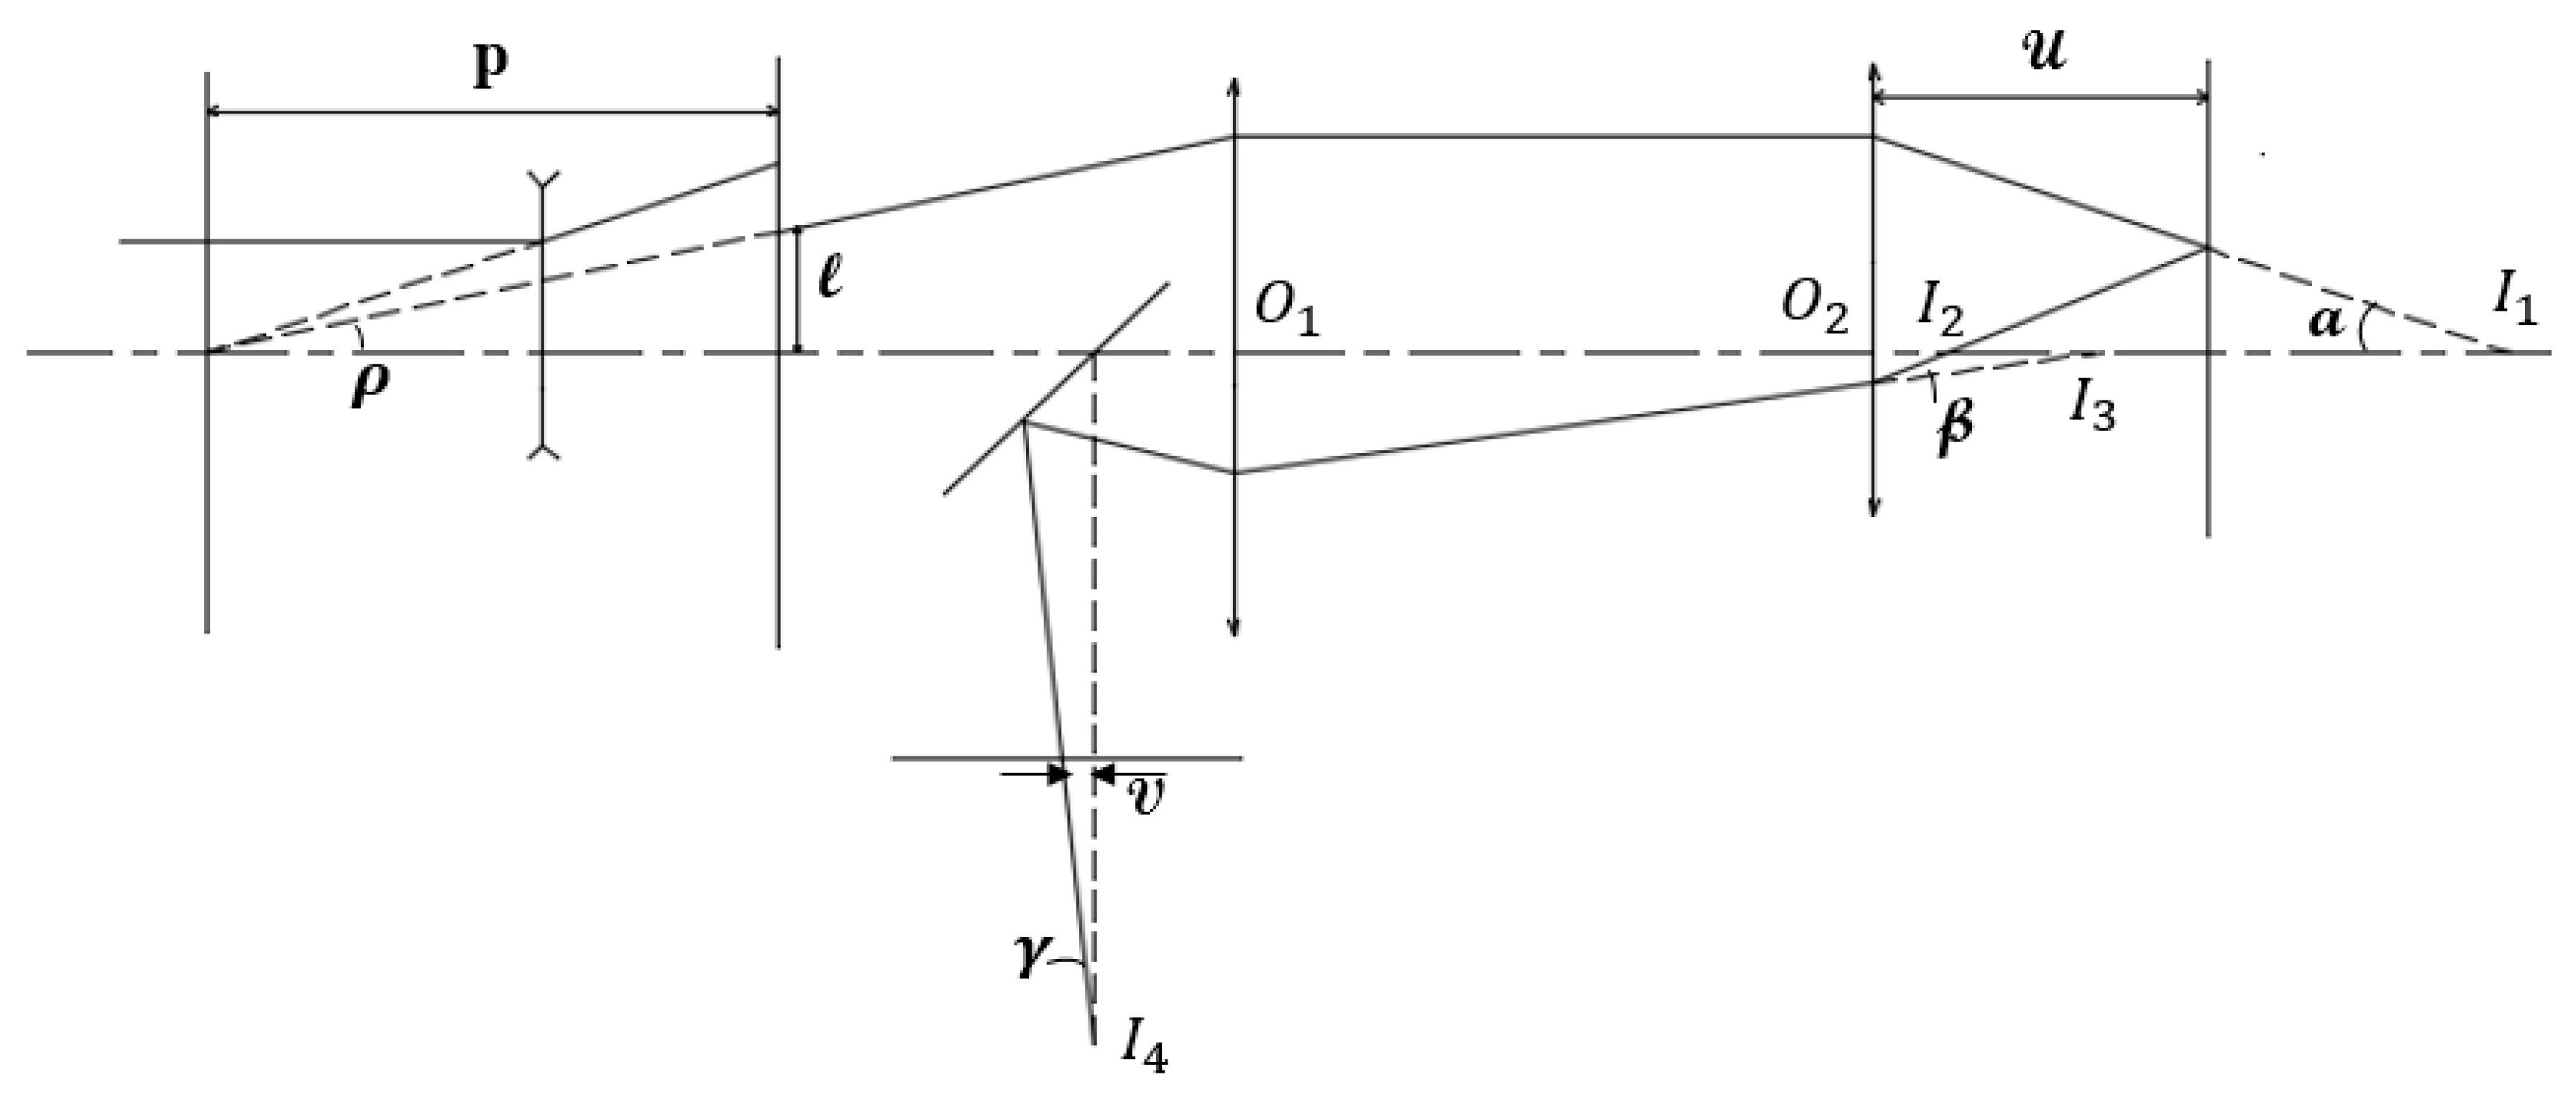
3.2. Analytical Model
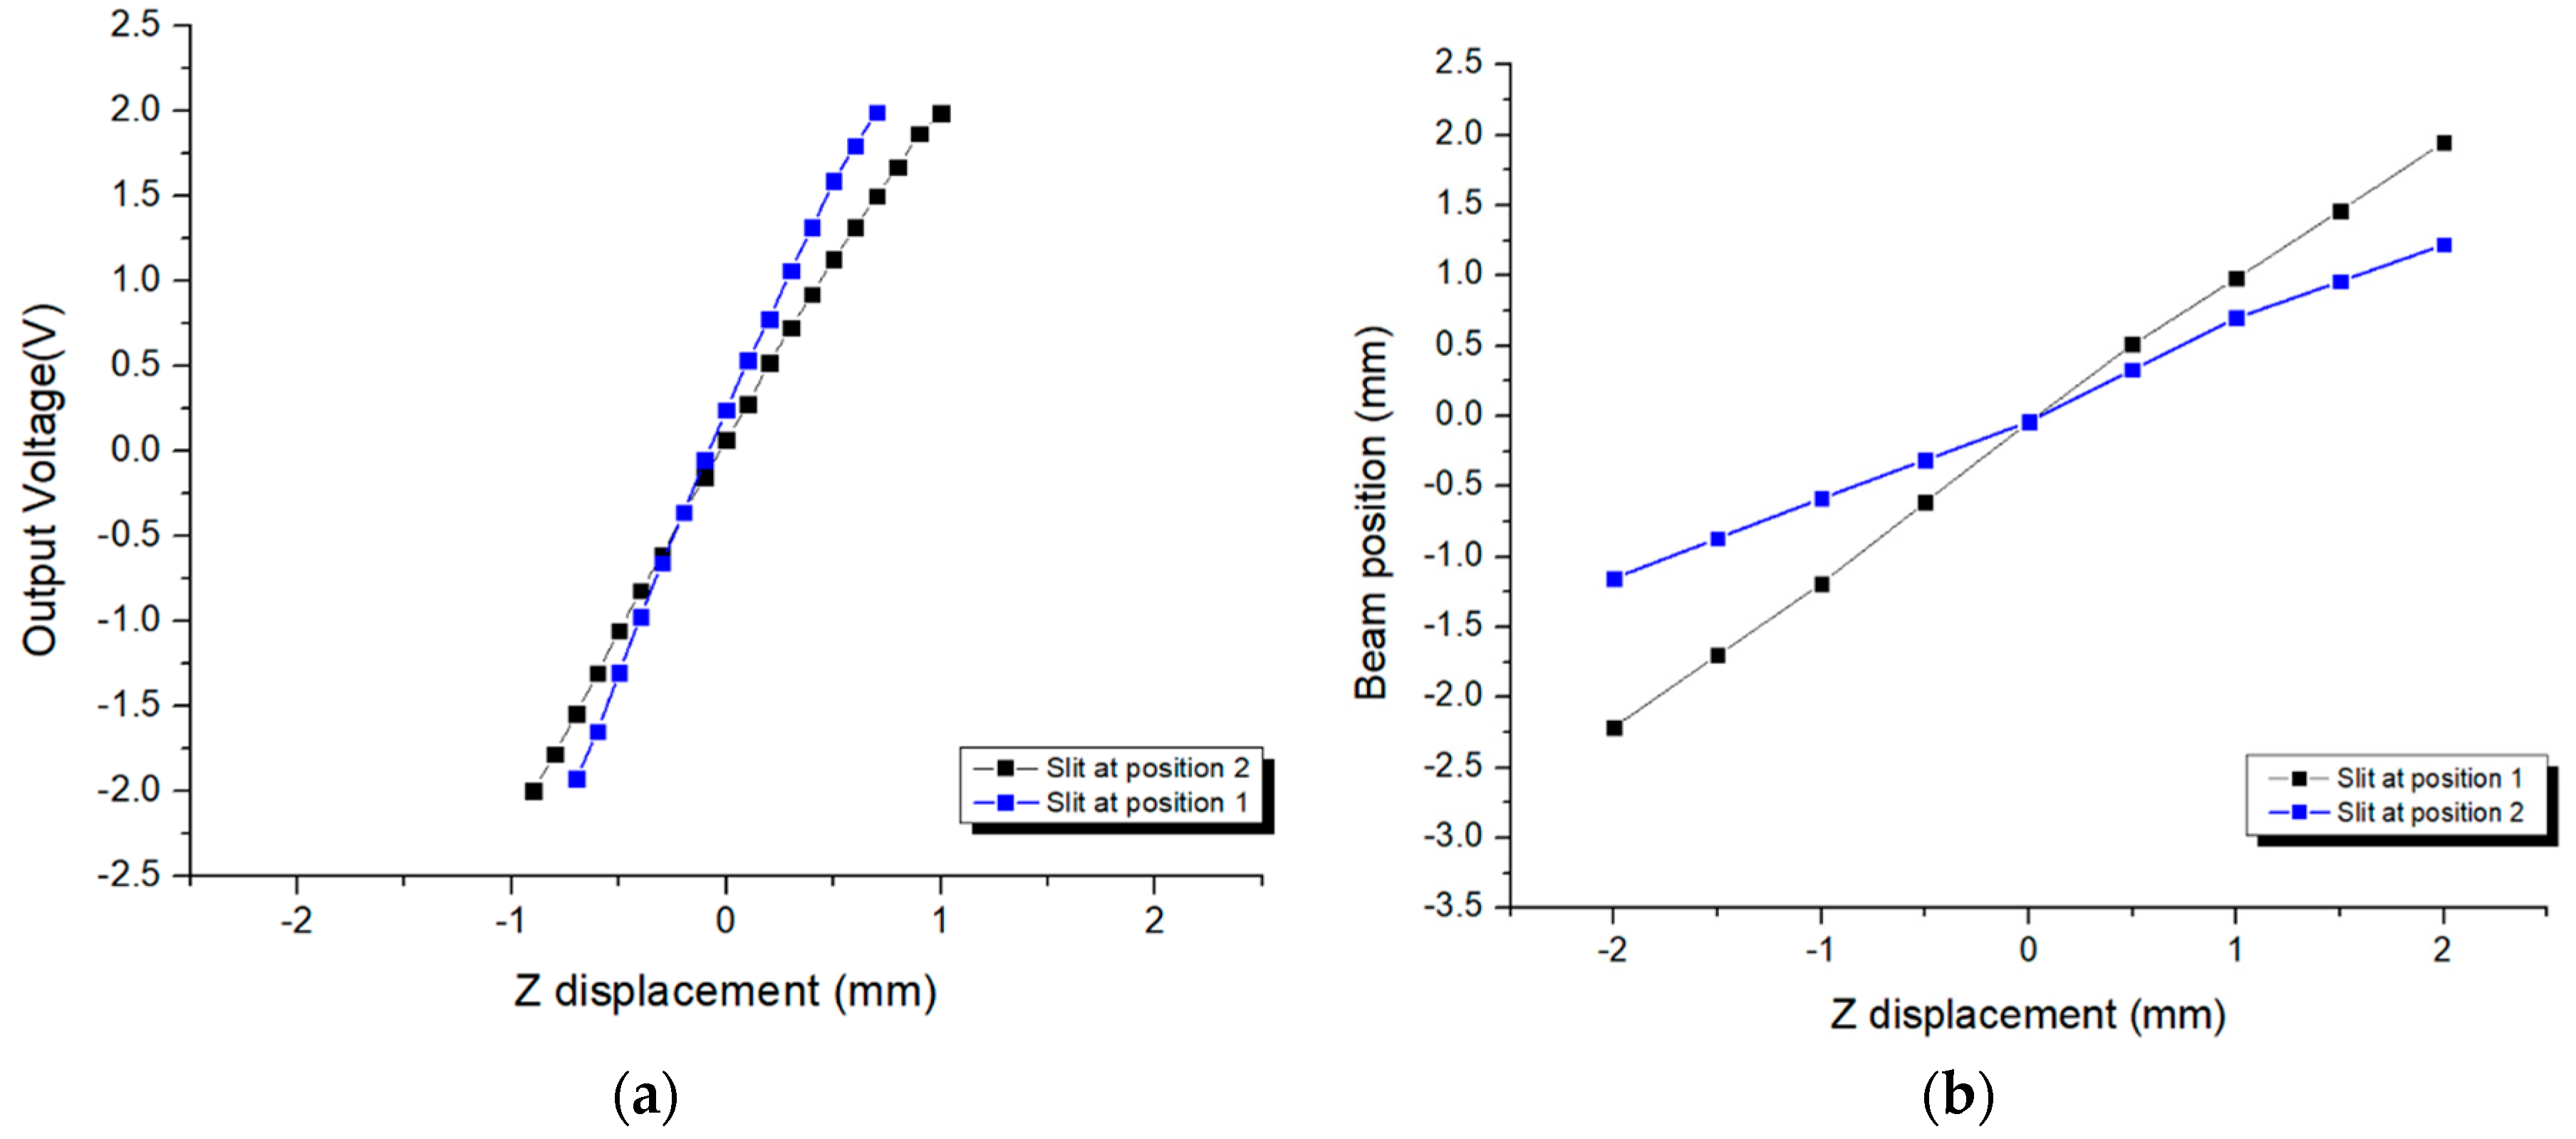
4. Experimental Evaluation of the Conventional and Proposed Focus Inspection Systems
5. Conclusions
Acknowledgments
Author Contributions
Conflicts of Interest
References
- Fan, K.C.; Chu, C.L.; Mou, J.I. Development of a low-cost focusing probe for profile measurement. Meas. Sci. Technol. 2001, 12, 2137–2146. [Google Scholar] [CrossRef]
- Rhee, H.G.; Kim, D.I.; Lee, Y.W. Realization and performance evaluation of high speed autofocusing for direct laser lithography. Rev. Sci. Instrum. 2009, 80, 073103. [Google Scholar] [CrossRef] [PubMed]
- Luo, J.; Liang, Y.; Yang, G. Realization of autofocusing system for laser direct writing on non-planar surfaces. Rev. Sci. Instrum. 2012, 83, 053102. [Google Scholar] [CrossRef] [PubMed]
- Jung, B.J.; Kong, H.J.; Jeon, B.G.; Yang, D.Y.; Son, Y.; Lee, K.S. Autofocusing method using fluorescence detection for precise two-photon nanofabrication. Opt. Express 2011, 19, 22659–22668. [Google Scholar] [CrossRef] [PubMed]
- Cao, B.X.; Le Hoang, P.; Ahn, S.; Kim, J.O.; Noh, J. High-precision detection of focal position on a curved surface for laser processing. Precis. Eng. 2017, 50, 204–210. [Google Scholar] [CrossRef]
- Li, Z.; Wu, K. Autofocus system for space cameras. Opt. Eng. 2005, 44, 053001-1–053001-5. [Google Scholar] [CrossRef]
- Wang, D.; Ding, X.; Zhang, T.; Kuang, H. A fast auto-focusing technique for the long focal lens TDI CCD camera in remote sensing applications. Opt. Laser Technol. 2003, 45, 190–197. [Google Scholar] [CrossRef]
- Martínez, I.A.; Petrov, D. Back-focal-plane position detection with extended linear range for photonic force microscopy. Appl. Opt. 2012, 51, 5973–5977. [Google Scholar] [CrossRef] [PubMed]
- Kim, T.; Poon, T. Autofocusing in optical scanning holography. Appl. Opt. 2009, 48, H153–H159. [Google Scholar] [CrossRef] [PubMed]
- Moscaritolo, M.; Jampel, H.; Knezevich, F.; Zeimer, R. An image based auto-focusing algorithm for digital fundus photography. IEEE Trans. Med. Imaging 2009, 28, 1703–1707. [Google Scholar] [CrossRef] [PubMed]
- Oku, H.; Ishikawa, M. High-speed autofocusing of a cell using diffraction patterns. Opt. Express 2006, 14, 3952–3960. [Google Scholar] [CrossRef]
- Abdullah, S.J.; Ratnam, M.M.; Samad, Z. Error-based autofocus system using image feedback in a liquid-filled diaphragm lens. Opt. Eng. 2009, 48, 123602-1–123602-9. [Google Scholar] [CrossRef]
- Lee, J.Y.; Wang, Y.H.; Lai, L.J.; Lin, Y.J.; Chang, Y.H. Development of an auto-focus system based on the Moire´ method. Measurement 2011, 44, 1793–1800. [Google Scholar] [CrossRef]
- Liu, C.S.; Hu, P.H.; Lin, Y.C. Design and experimental validation of novel optics-based autofocusing microscope. Appl. Phys. B 2012, 109, 259. [Google Scholar] [CrossRef]
- Liu, C.S.; Lin, Y.C.; Hu, P.H. Design and characterization of precise laser-based autofocusing microscope with reduced geometrical fluctuations. Microsyst Technol. 2013, 19, 1717–1724. [Google Scholar] [CrossRef]
- Liu, C.S.; Jiang, S.H. Design and experimental validation of novel enhanced-performance autofocusing microscope. Appl. Phys. B 2014, 117, 1161–1171. [Google Scholar] [CrossRef]
- Liu, C.S.; Wang, Z.Y.; Chang, Y.C. Design and characterization of high-performance autofocusing microscope with zoom in/out functions. Appl. Phys. B 2015, 121, 69–80. [Google Scholar] [CrossRef]
- Liu, C.S.; Jiang, S.H. Precise autofocusing microscope with rapid response. Opt. Laser. Eng. 2015, 66, 294–300. [Google Scholar] [CrossRef]
- Weiss, A.; Obotnine, A.; Lasinski, A. Method and Apparatus for the Auto-Focusing Infinity Corrected Microscopes. U.S. Patent 7700903 B2, 20 April 2010. [Google Scholar]
- Cao, B.X.; Hoang, P.L.; Ahn, S.; Kim, J.-O.; Kang, H.; Noh, J. In-Situ Real-Time Focus Detection during Laser Processing Using Double-Hole Masks and Advanced Image Sensor Software. Sensors 2017, 17, 1540. [Google Scholar] [CrossRef] [PubMed]
- Hamamatsu. 1-D PSD with Small Plastic Package. Available online: www.hamamatsu.com/resources/pdf/ssd/s4581-04_etc_kpsd1009e.pdf (accessed on 5 December 2017).


| Conventional System | Proposed System | |
|---|---|---|
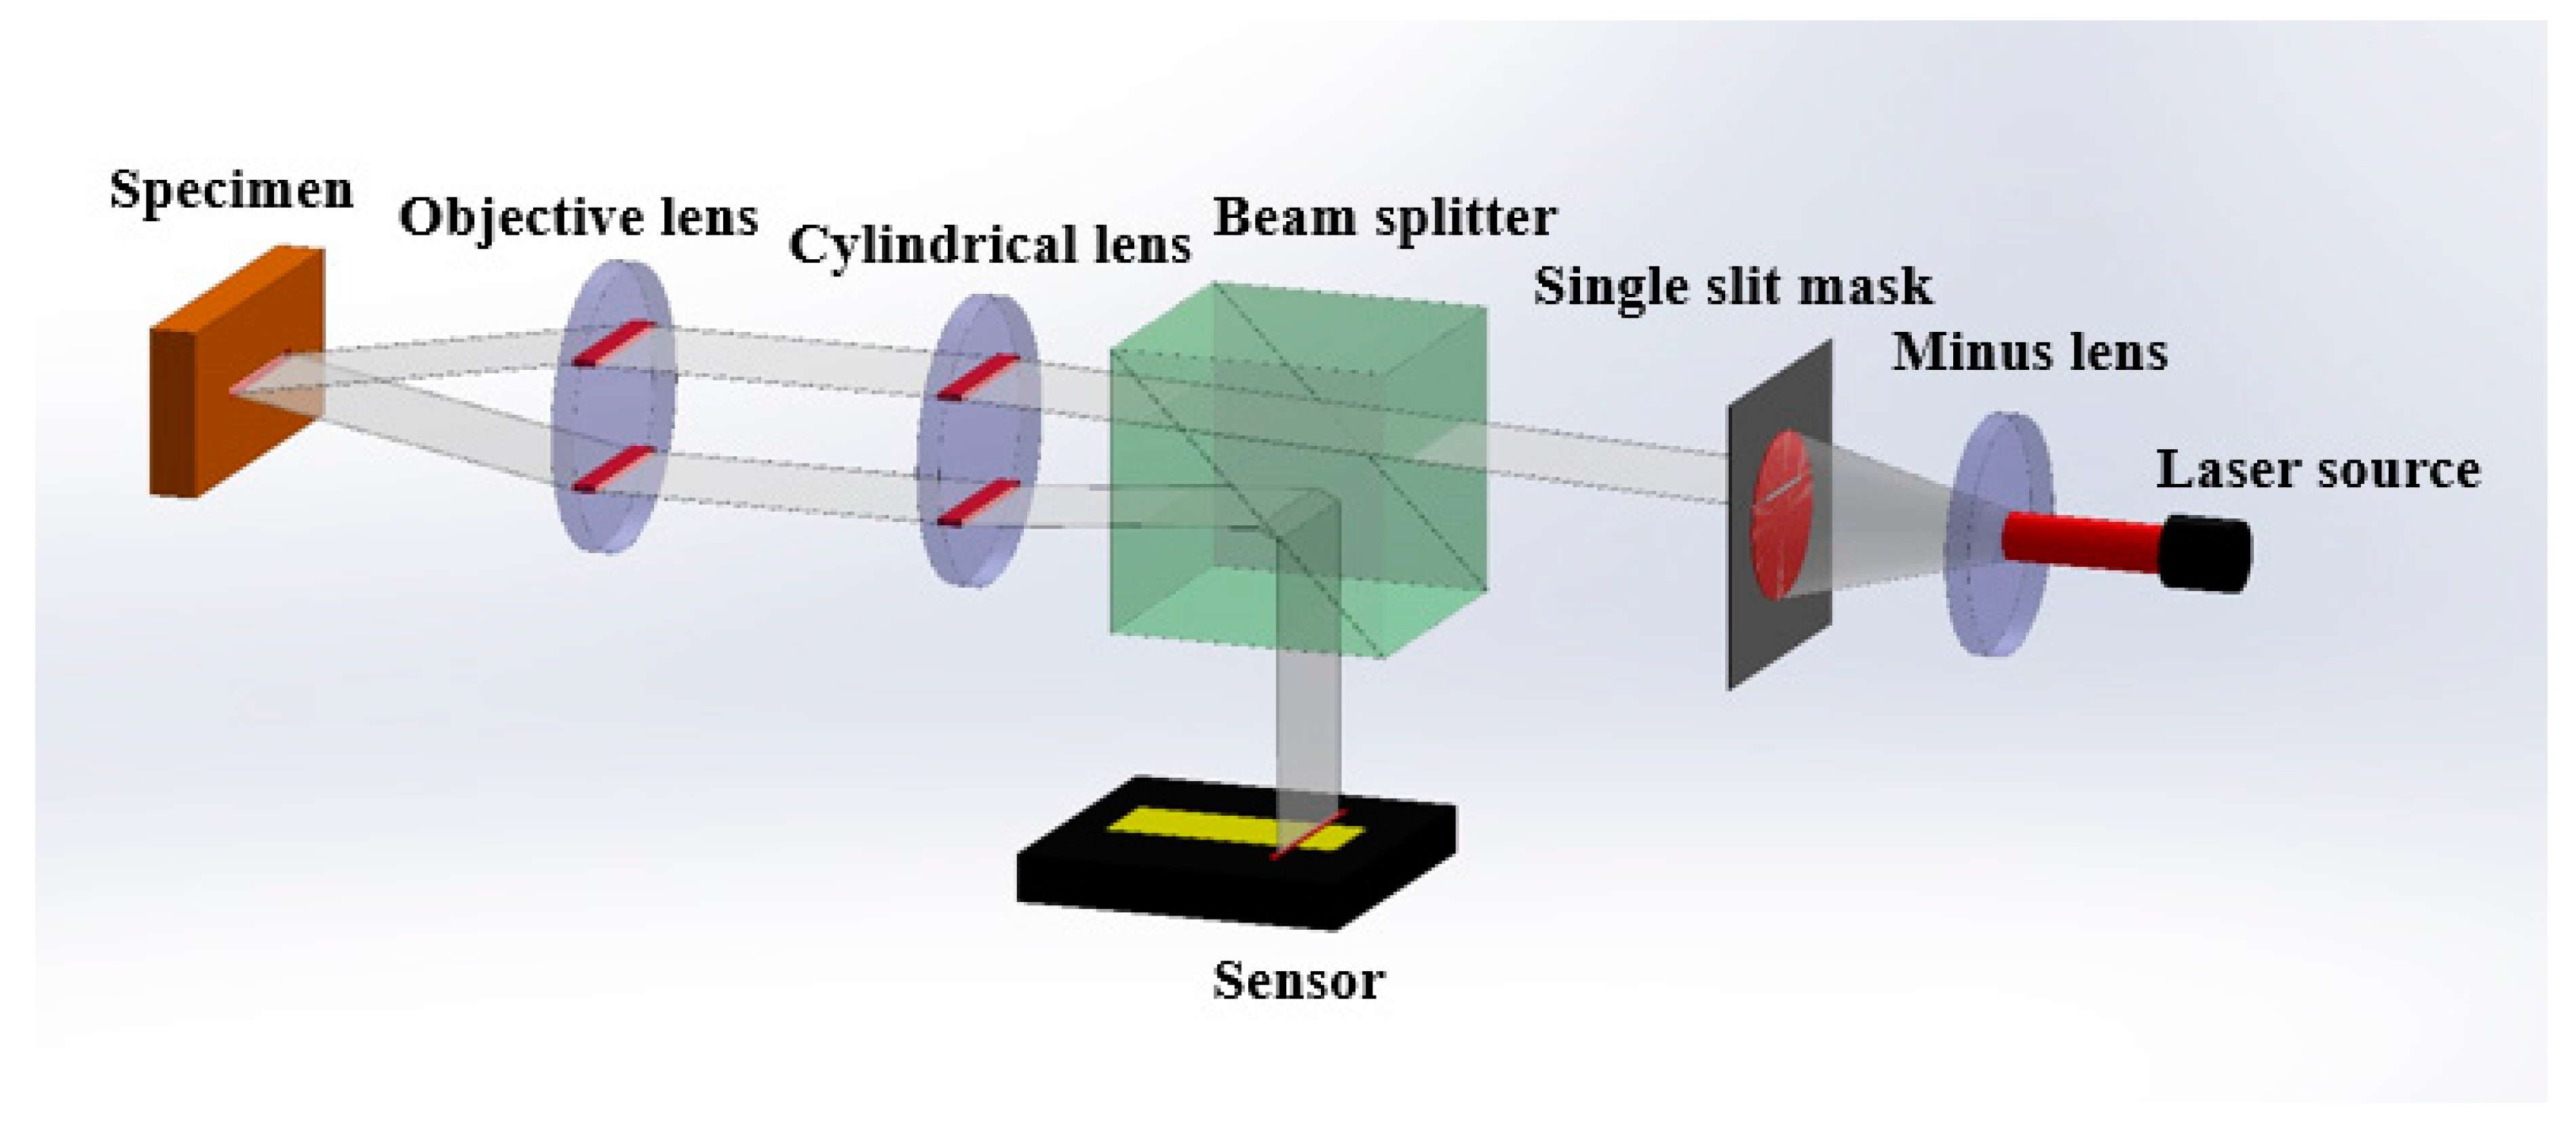
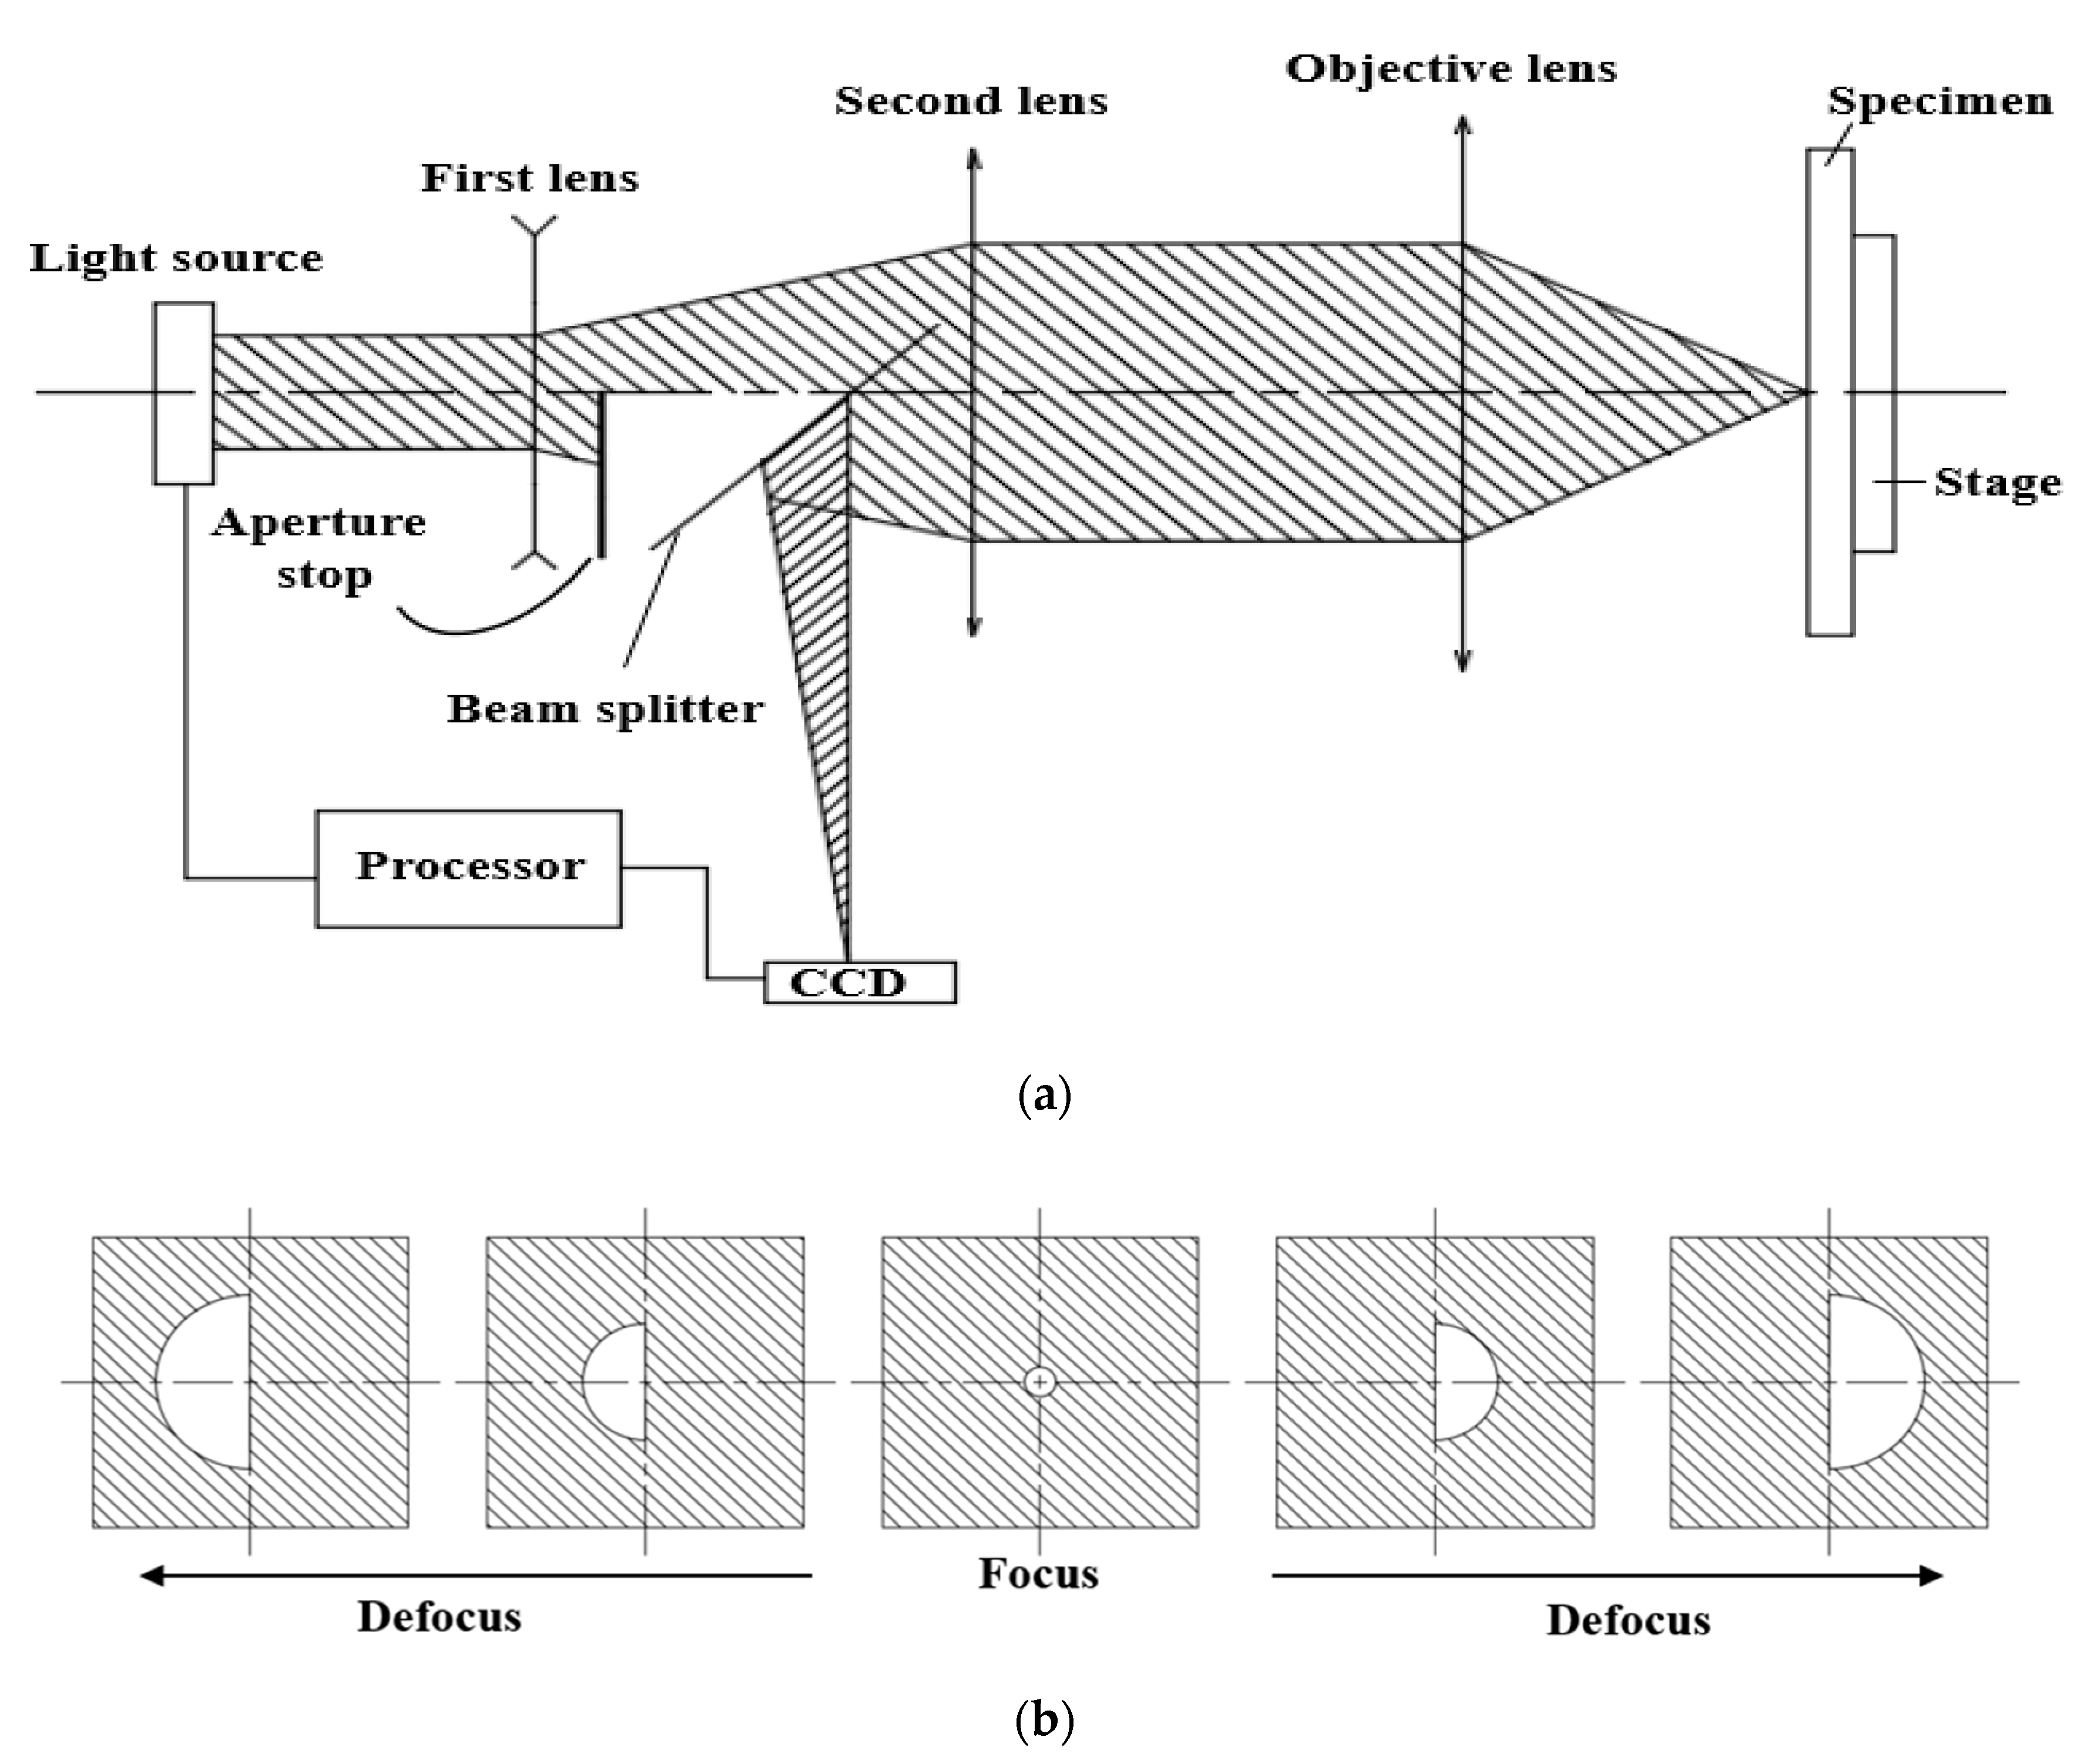
| Optical apparatus | Laser source, Minus lens, Beam splitter, Single lens, Objective lens, Specimen, Micropositioning stage | Laser source, Minus lens, Beam splitter, Cylindrical lens, Objective lens, Specimen, Micropositioning stage |
| Image Sensor | CCD | PSD |
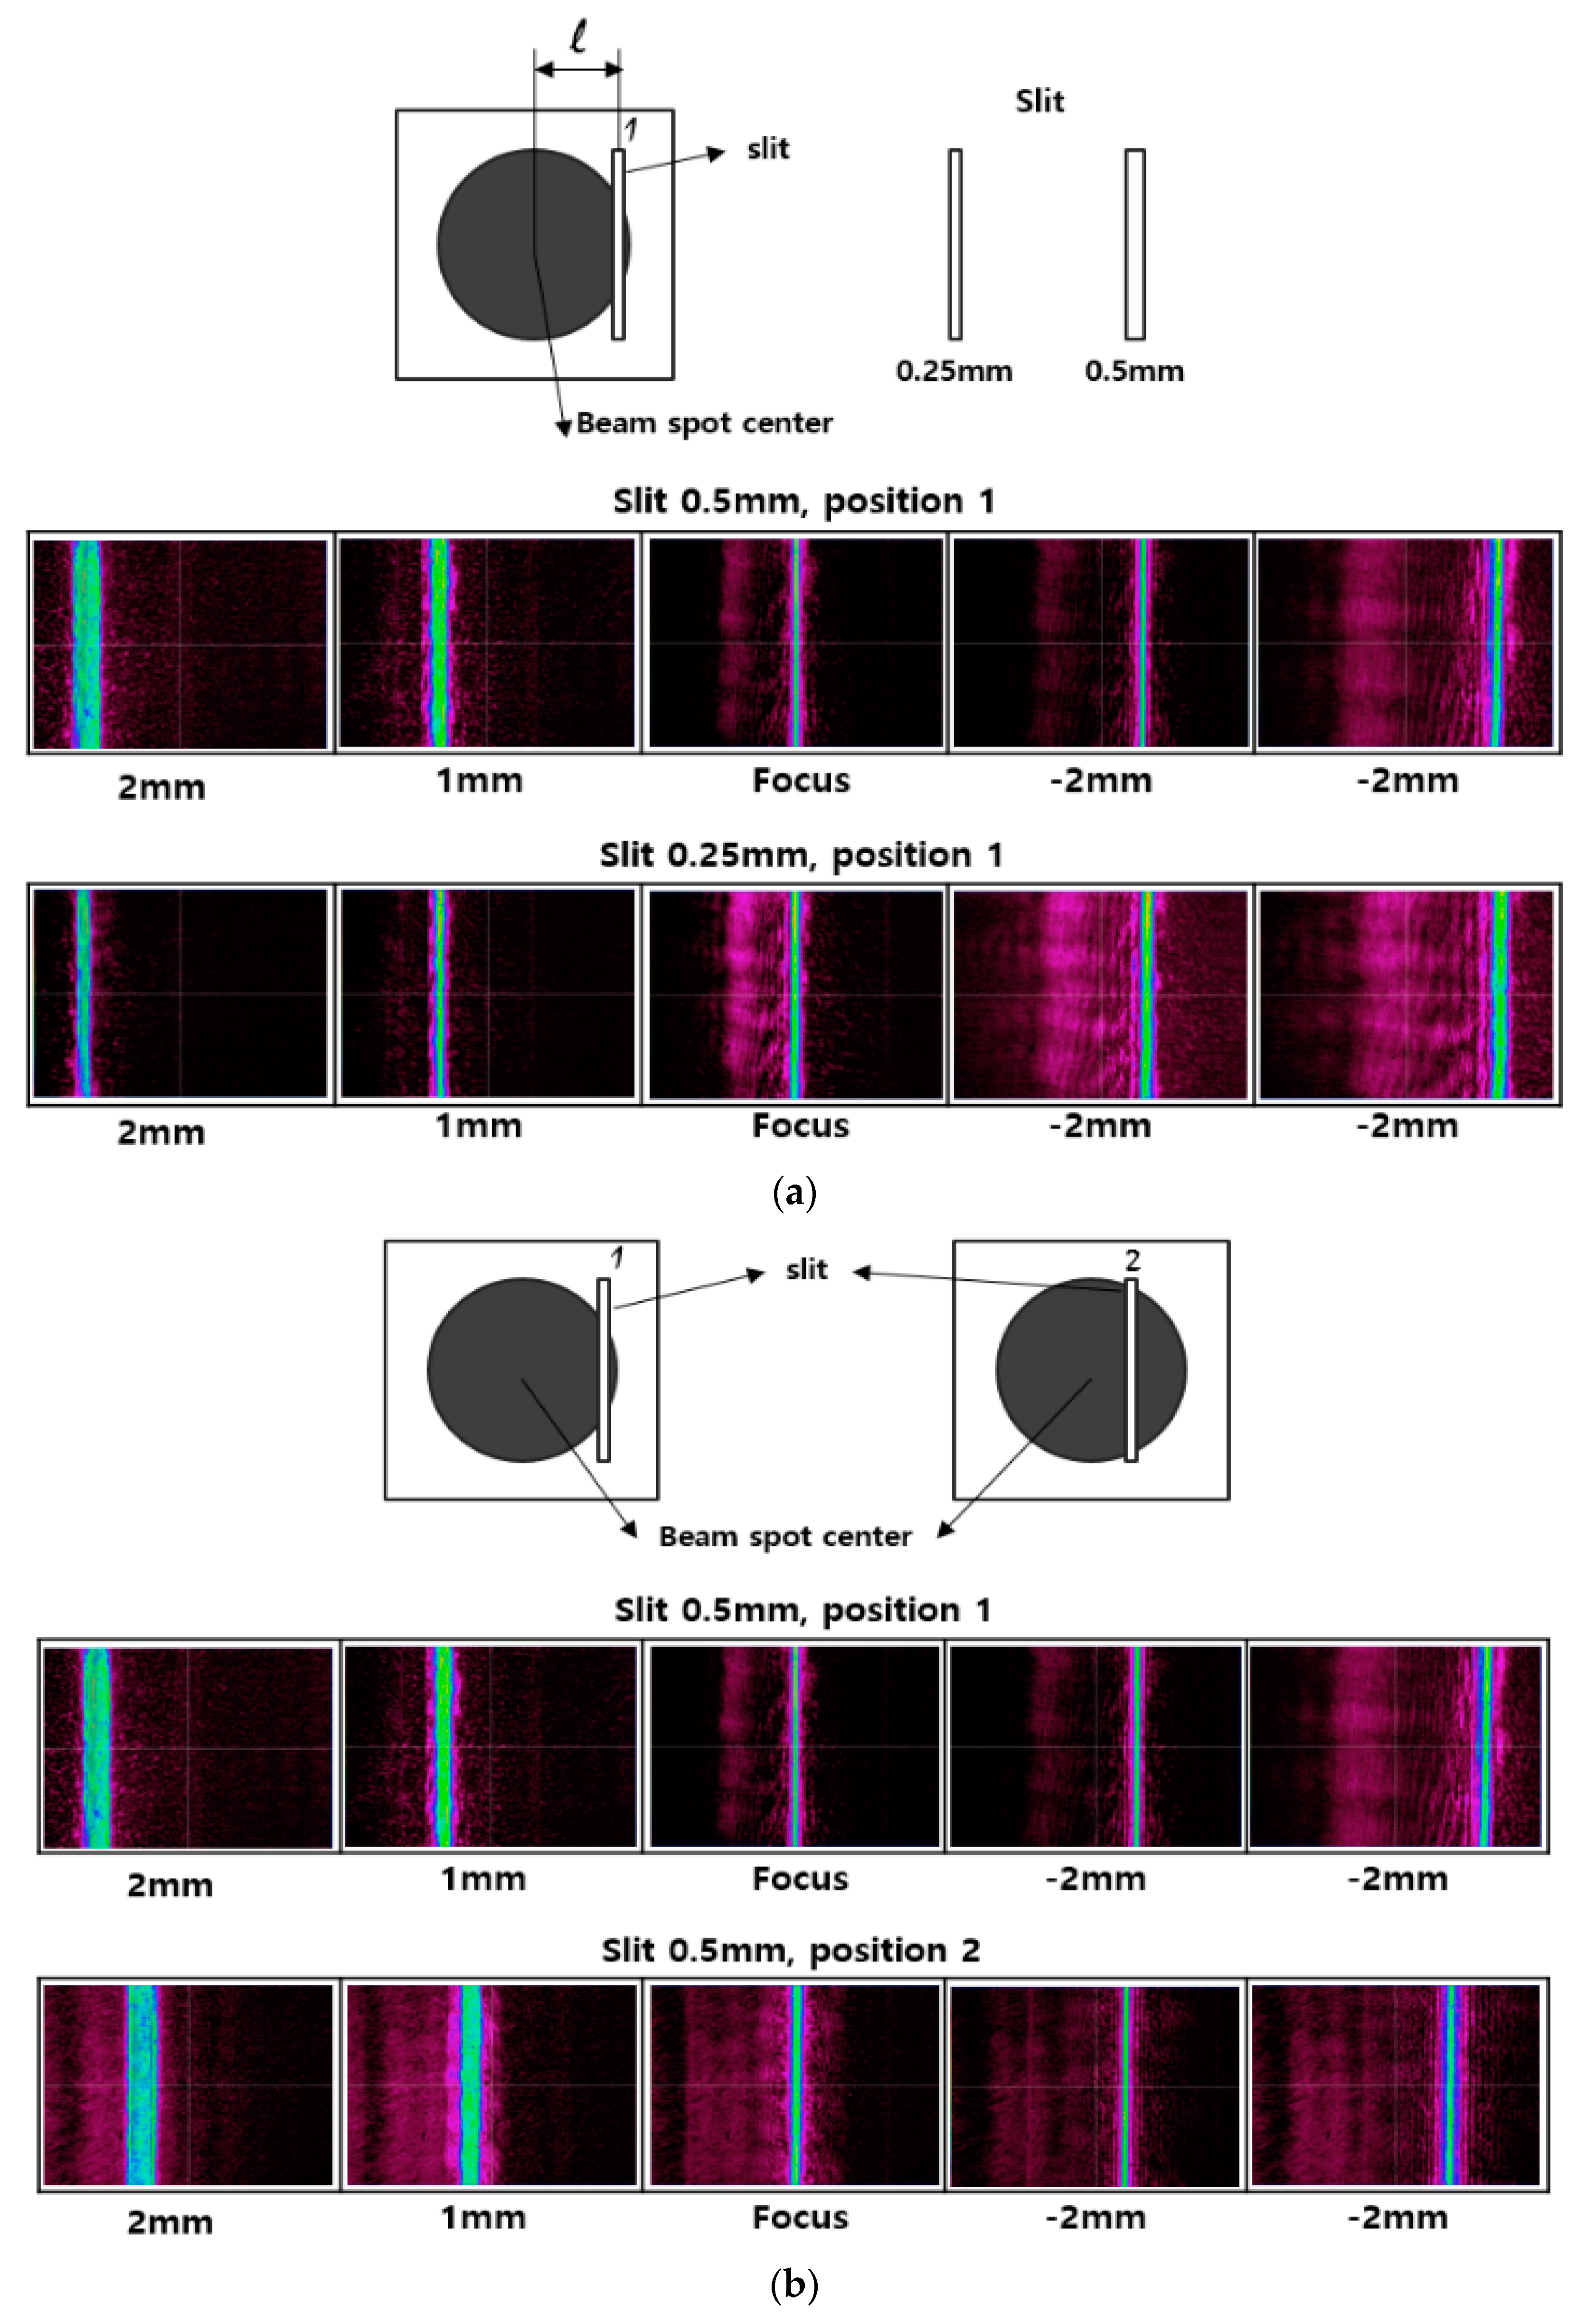
| Aperture | Bisected aperture | Single-slit aperture (changeable design for purpose) |
| Measurement method | Reflected image shape and centroid calculation | Slit image position |
| Linear relation | Reflected image centroid and specimen position | Slit image position and specimen position |
| Response time | 0.02 s | 3 μs |
| Detection range | −0.2 to 0.2 mm | −2 to 2 mm |
© 2017 by the authors. Licensee MDPI, Basel, Switzerland. This article is an open access article distributed under the terms and conditions of the Creative Commons Attribution (CC BY) license (http://creativecommons.org/licenses/by/4.0/).
Share and Cite
Cao, B.X.; Hoang, P.L.; Ahn, S.; Kang, H.; Kim, J.; Noh, J. High-Speed Focus Inspection System Using a Position-Sensitive Detector. Sensors 2017, 17, 2842. https://doi.org/10.3390/s17122842
Cao BX, Hoang PL, Ahn S, Kang H, Kim J, Noh J. High-Speed Focus Inspection System Using a Position-Sensitive Detector. Sensors. 2017; 17(12):2842. https://doi.org/10.3390/s17122842
Chicago/Turabian StyleCao, Binh Xuan, Phuong Le Hoang, Sanghoon Ahn, Heeshin Kang, Jengo Kim, and Jiwhan Noh. 2017. "High-Speed Focus Inspection System Using a Position-Sensitive Detector" Sensors 17, no. 12: 2842. https://doi.org/10.3390/s17122842
APA StyleCao, B. X., Hoang, P. L., Ahn, S., Kang, H., Kim, J., & Noh, J. (2017). High-Speed Focus Inspection System Using a Position-Sensitive Detector. Sensors, 17(12), 2842. https://doi.org/10.3390/s17122842