Real-Time and In-Flow Sensing Using a High Sensitivity Porous Silicon Microcavity-Based Sensor

 , ,
, , 
Abstract
1. Introduction
2. Materials and Methods
2.1. PSMC Design
2.2. PSMC Fabrication
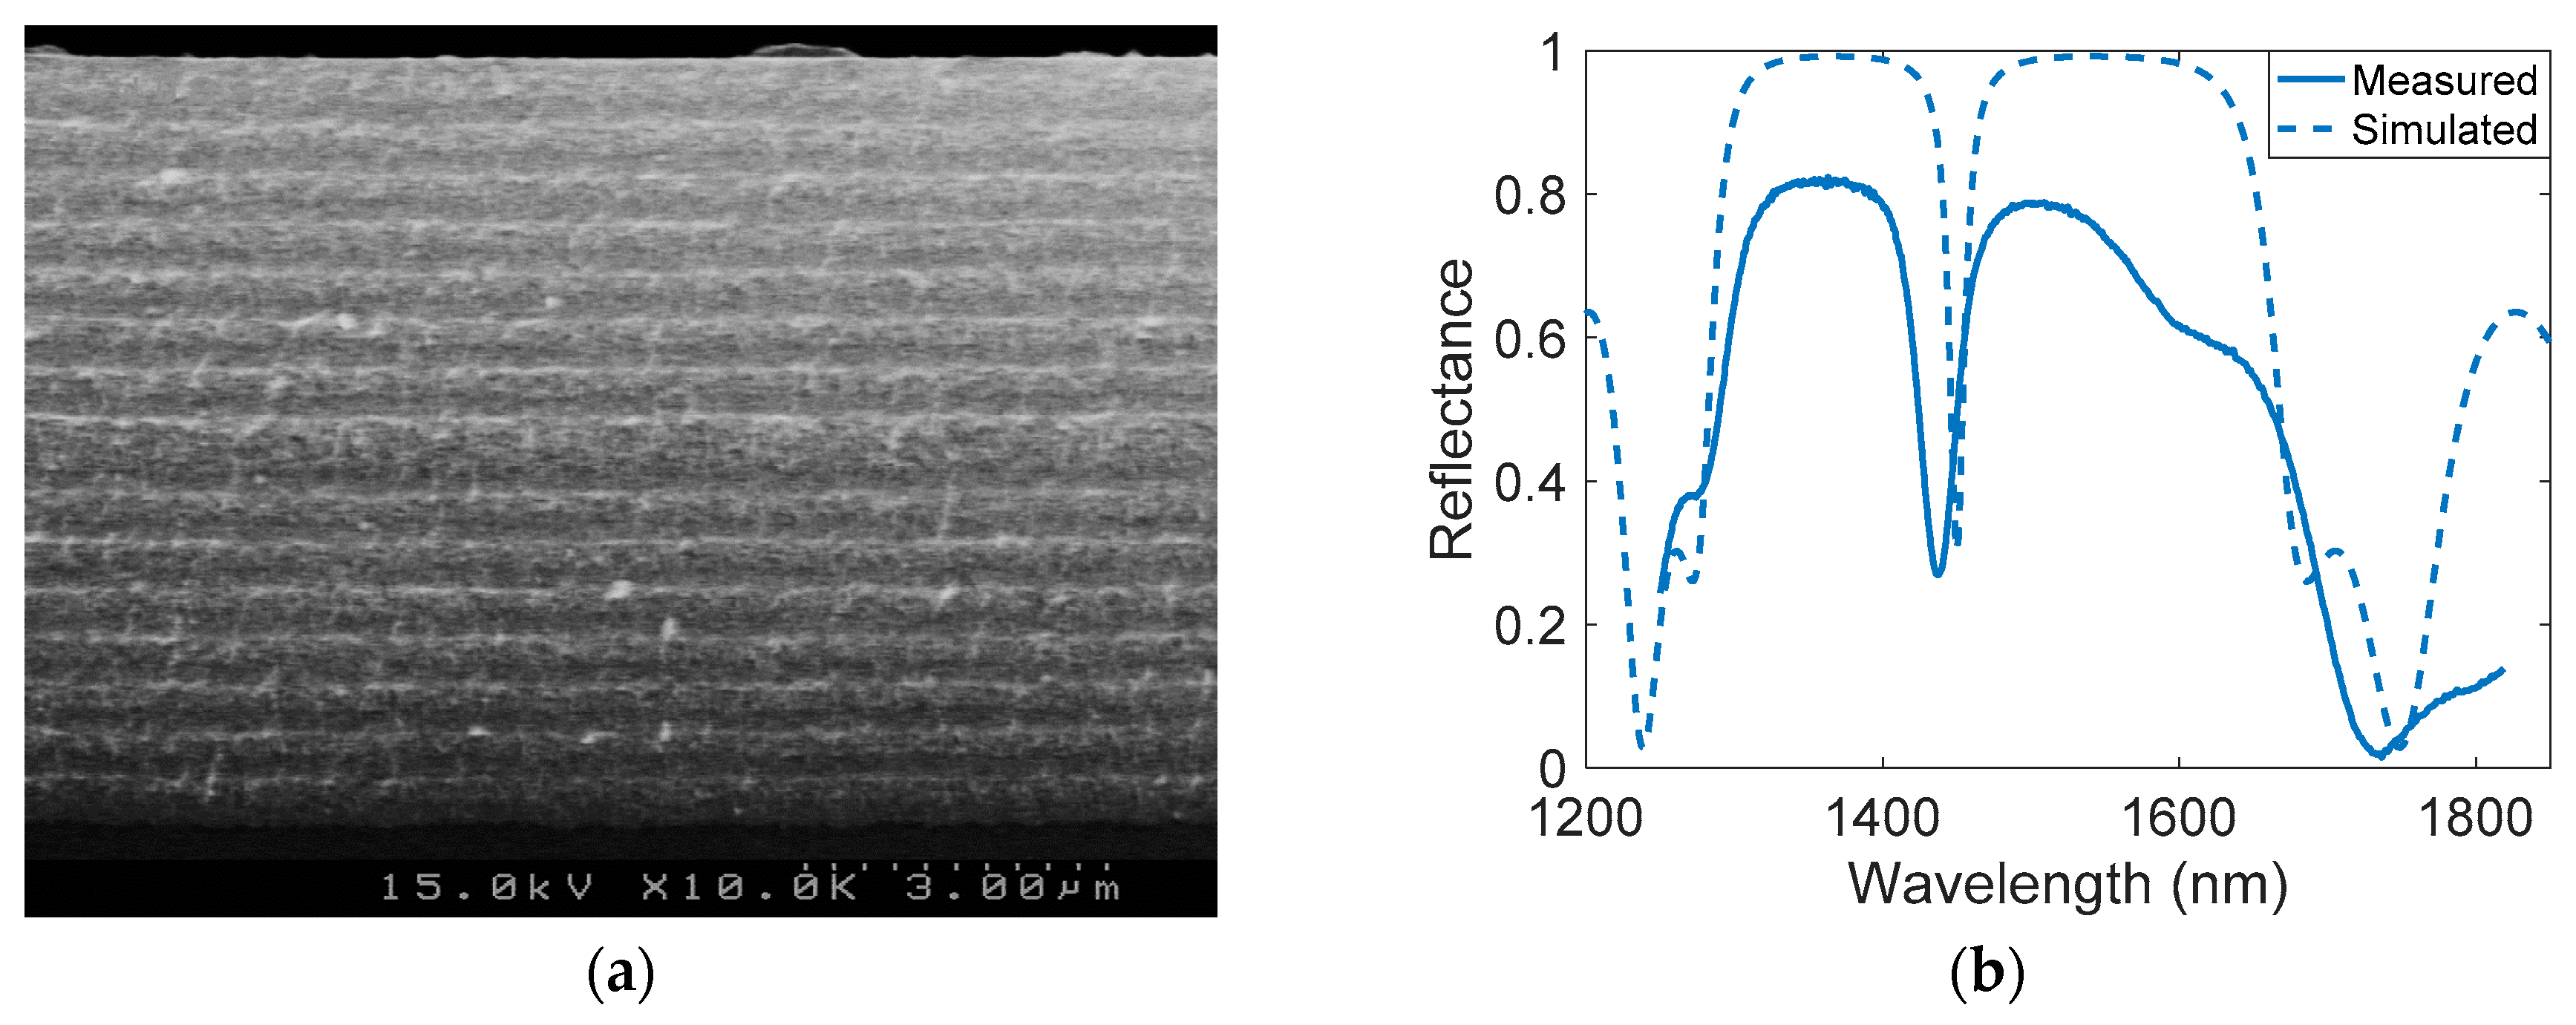
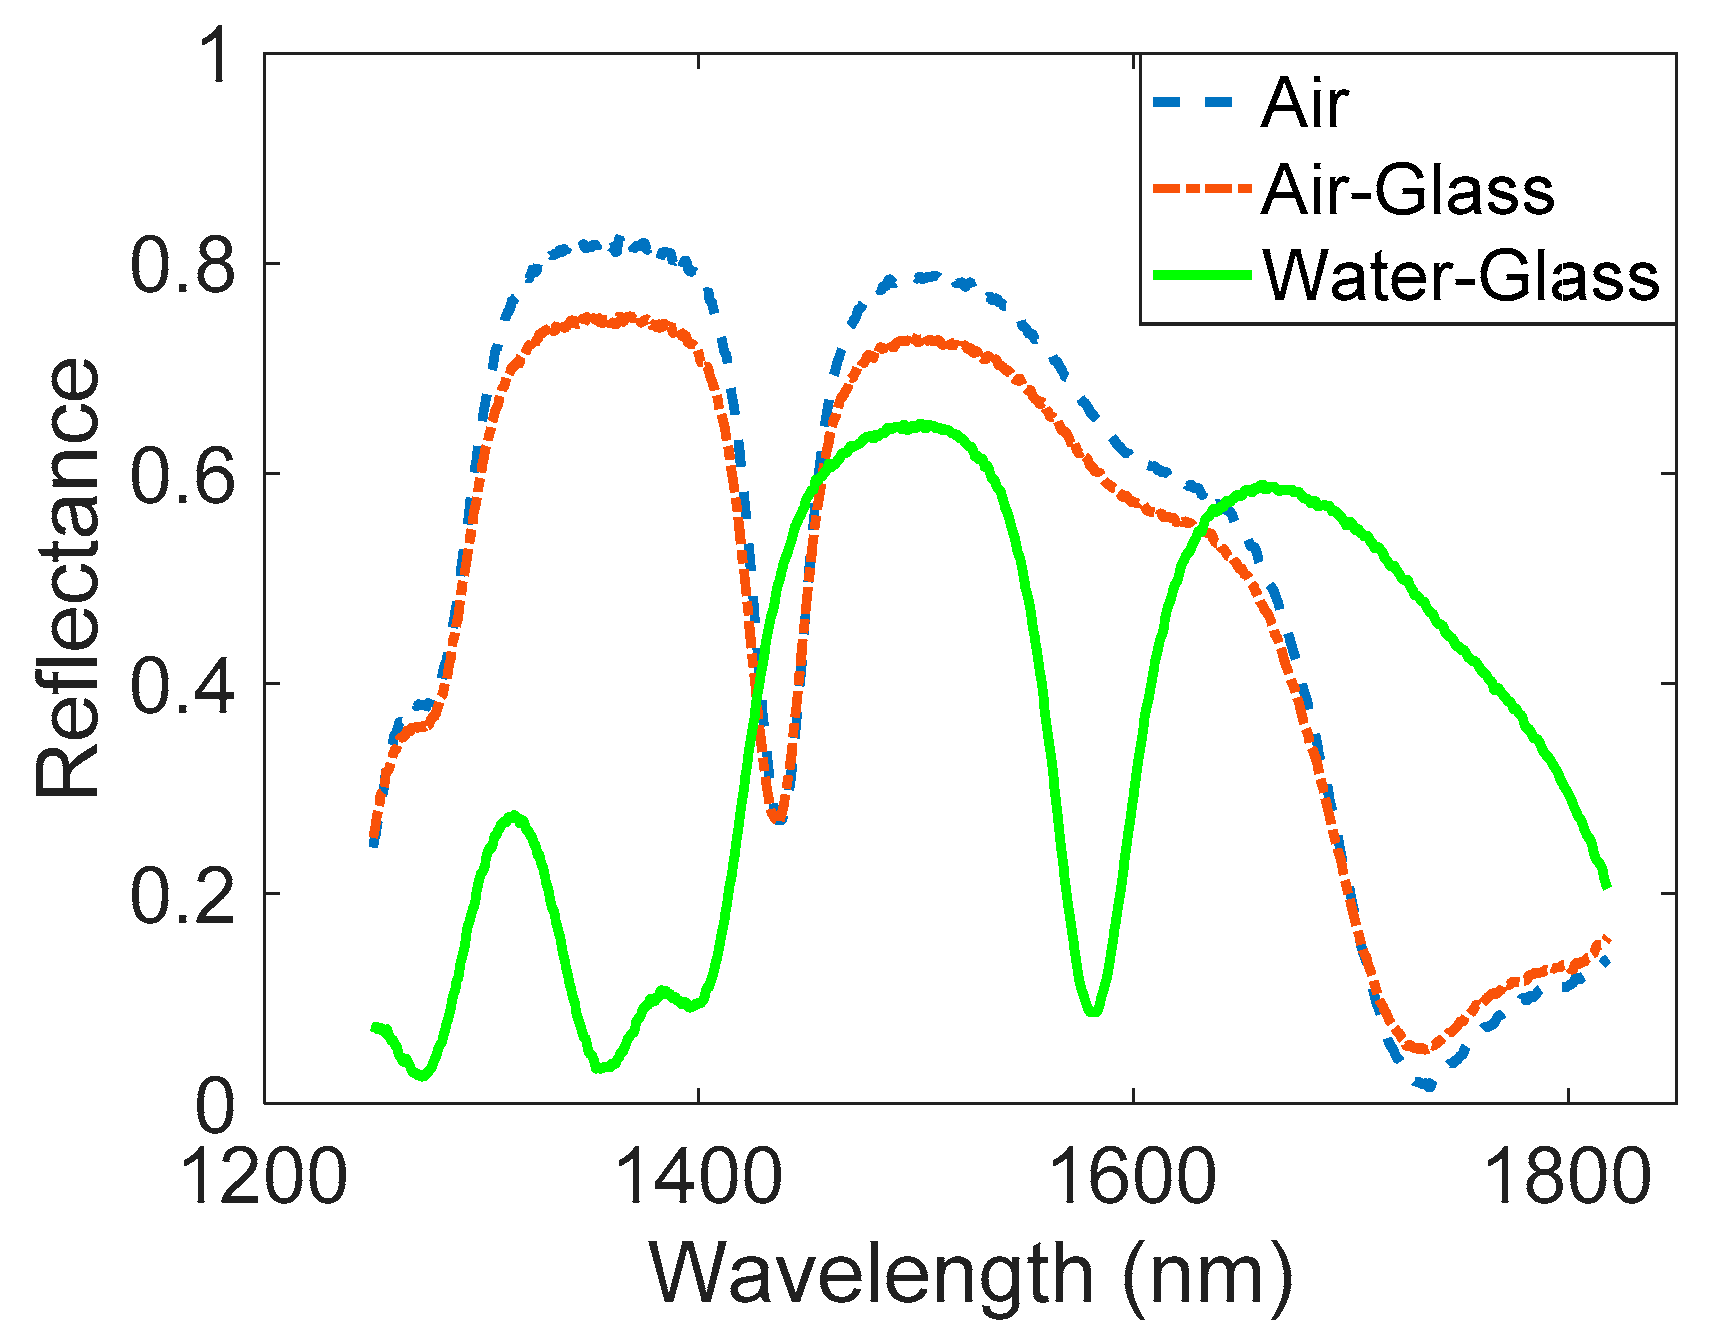
2.3. PSMC Physical and Optical Characterization
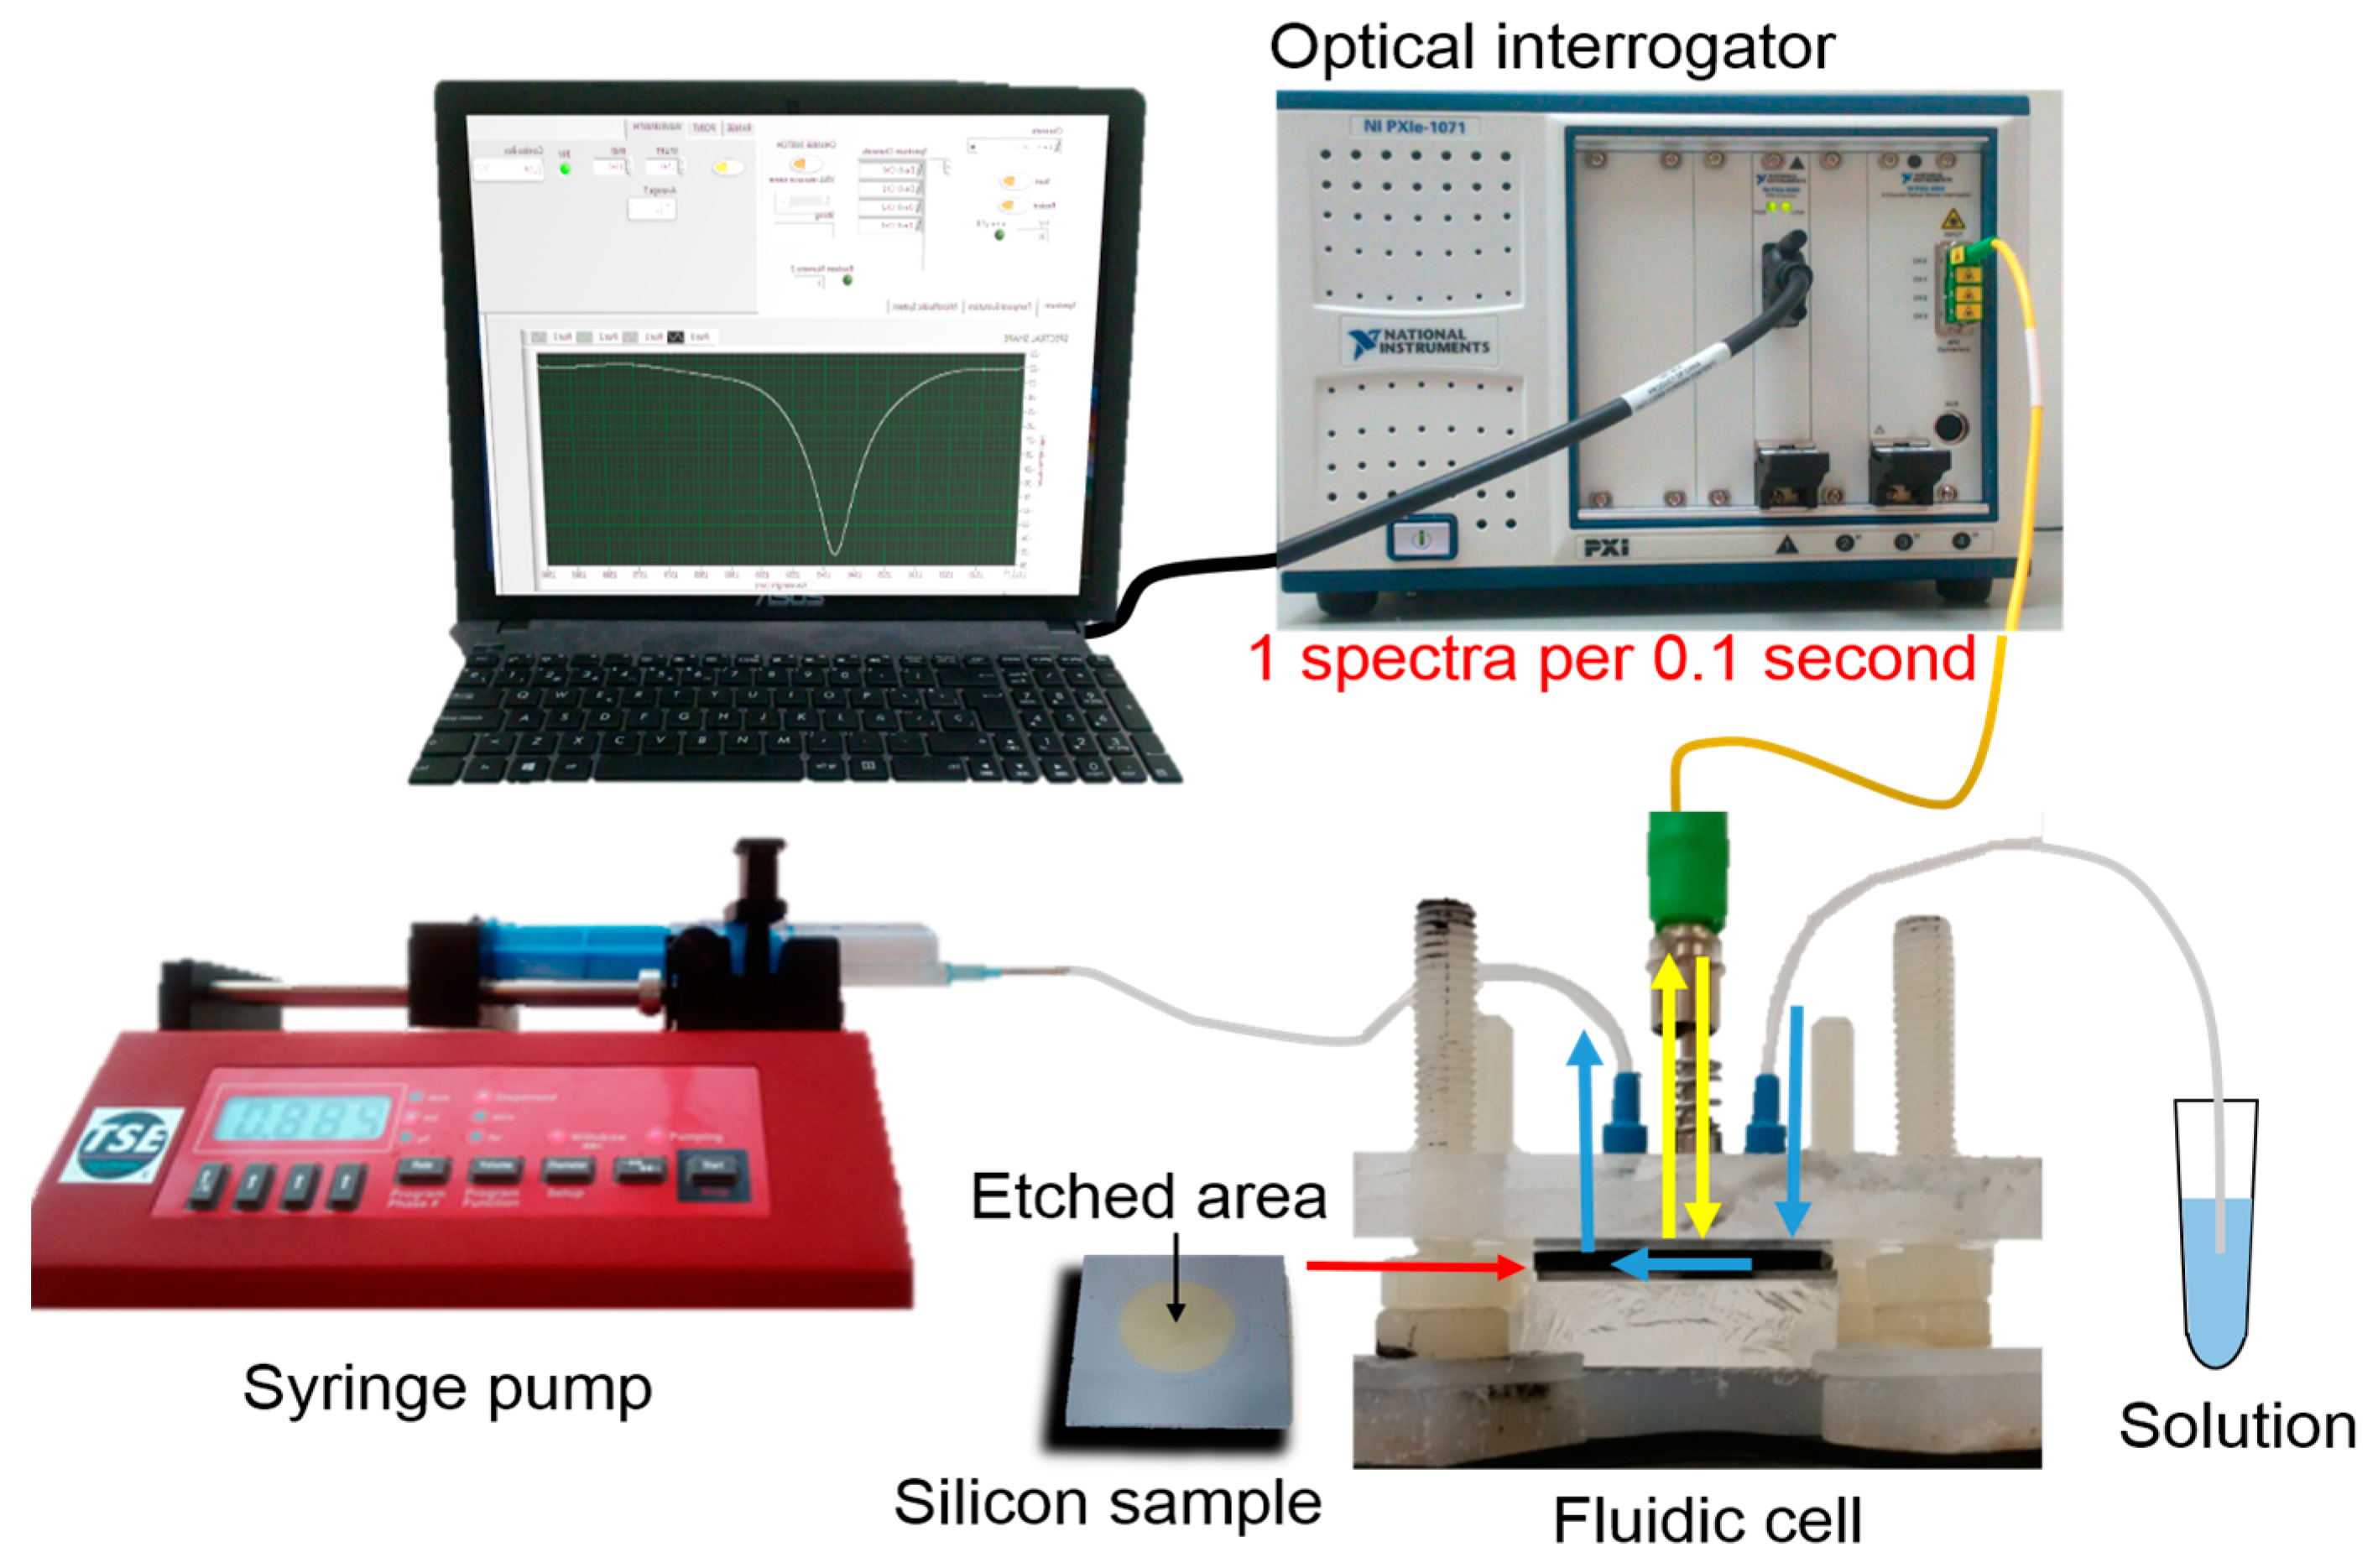
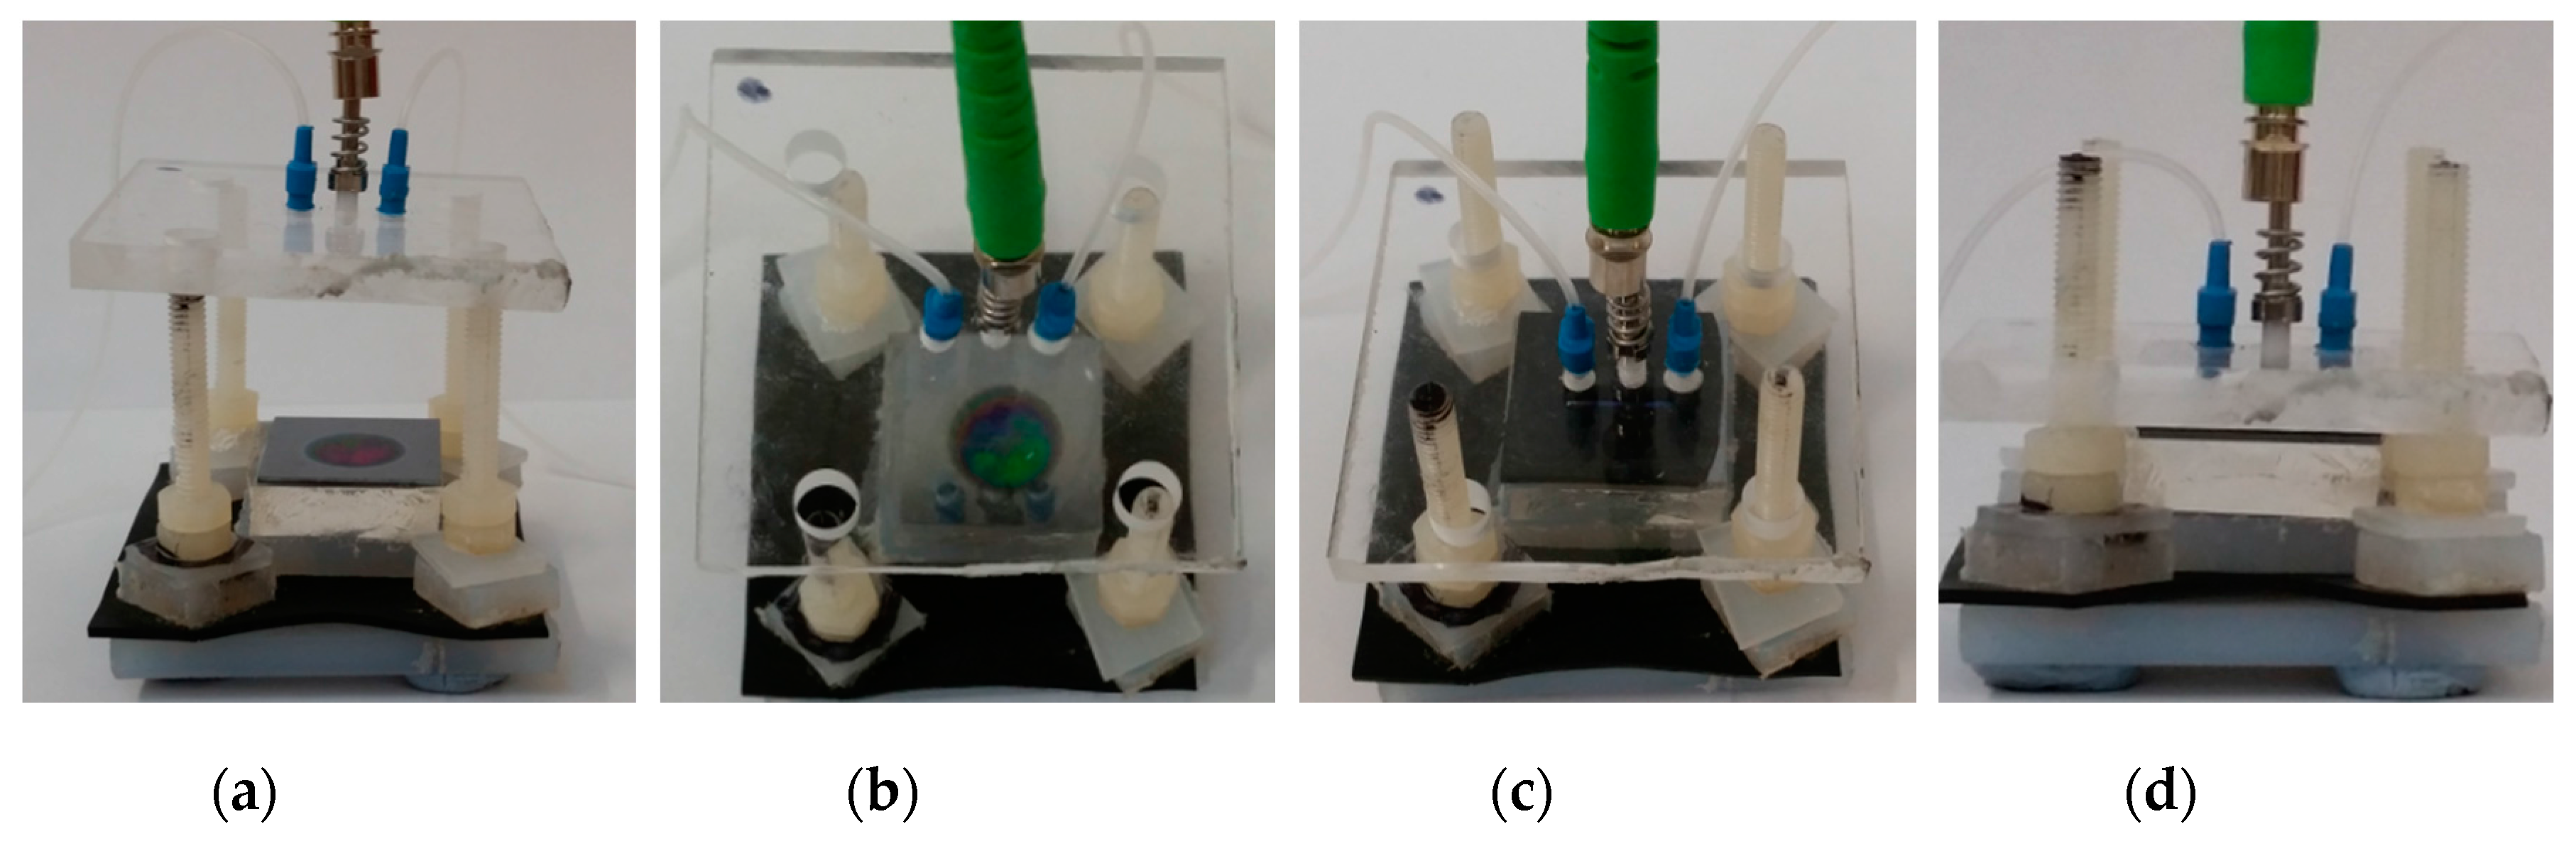
2.4. Experimental Setup
3. Results
4. Discussion
5. Conclusions
Acknowledgments
Author Contributions
Conflicts of Interest
References
- Luchansky, M.S.; Bailey, R.C. High-Q optical sensors for chemical and biological analysis. Anal. Chem. 2012, 84, 793–821. [Google Scholar] [CrossRef] [PubMed]
- Estevez, M.C.; Alvarez, M.; Lechuga, L.M. Integrated optical devices for lab-on-a-chip biosensing applications. Laser Photon. Rev. 2012, 6, 463–487. [Google Scholar] [CrossRef]
- Jane, A.; Dronov, R.; Hodges, A.; Voelcker, N.H. Porous silicon biosensors on the advance. Trends Biotechnol. 2009, 27, 230–239. [Google Scholar] [CrossRef] [PubMed]
- Dhanekar, S.; Jain, S. Porous silicon biosensor: Current status. Biosens. Bioelectron. 2013, 41, 54–64. [Google Scholar] [CrossRef] [PubMed]
- Bisi, O.; Ossicini, S.; Pavesi, L. Porous silicon: A quantum sponge structure for silicon based optoelectronics. Surf. Sci. Rep. 2000, 38, 1–126. [Google Scholar] [CrossRef]
- Harraz, F.A. Porous silicon chemical sensors and biosensors: A review. Sens. Actuators B Chem. 2014, 202, 897–912. [Google Scholar] [CrossRef]
- Pacholski, C. Photonic crystal sensors based on porous silicon. Sensors 2013, 13, 4694–4713. [Google Scholar] [CrossRef] [PubMed]
- Zhao, Y.; Rodriguez, G.A.; Graham, Y.M.; Cao, T.; Gaur, G.; Weiss, S.M. Resonant photonic structures in porous silicon for biosensing. Front. Biol. Detect. Nanosens. Syst. IX 2017, 10081, 100810D. [Google Scholar] [CrossRef]
- Mariani, S.; Pino, L.; Strambini, L.M.; Tedeschi, L.; Barillaro, G. 10,000-fold improvement in protein detection using nanostructured porous silicon interferometric aptasensors. ACS Sens. 2016, 1, 1471–1479. [Google Scholar] [CrossRef]
- De Stefano, L.; Rotiroti, L.; Rea, I.; Moretti, L.; Di Francia, G.; Massera, E.; Lamberti, A.; Arcari, P.; Sanges, C.; Rendina, I. Porous silicon-based optical biochips. J. Opt. A Pure Appl. Opt. 2006, 8, S540–S544. [Google Scholar] [CrossRef]
- Lin, H.; Gao, T.; Fantini, J.; Sailor, M.J. A porous silicon-palladium composite film for optical interferometric sensing of hydrogen. Langmuir 2004, 20, 5104–5108. [Google Scholar] [CrossRef] [PubMed]
- Orosco, M.M.; Pacholski, C.; Sailor, M.J. Real-time monitoring of enzyme activity in a mesoporous silicondouble layer. Nat. Nanotechnol. 2009, 4, 255–258. [Google Scholar] [CrossRef] [PubMed]
- Snow, P.A.; Squire, E.K.; Russell, P.S.J.; Canham, L.T. Vapor sensing using the optical properties of porous silicon Bragg mirrors. J. Appl. Phys. 1999, 86, 1781–1784. [Google Scholar] [CrossRef]
- Rendina, I.; Rea, I.; Rotiroti, L.; De Stefano, L. Porous silicon-based optical biosensors and biochips. Phys. E Low-Dimens. Syst. Nanostruct. 2007, 38, 188–192. [Google Scholar] [CrossRef]
- Anderson, M.A.; Allcock, P.; Perkins, E.A.; Snow, P.; Hollings, M.; Smith, R.G.; Reeves, C.; Squirrell, D.J.; Nicklin, S.; Cox, T.I. Sensitivity of the optical properties of porous silicon layers to the refractive index of liquid in the pores. Phys. Status Solidi A Appl. Mater. Sci. 2003, 197, 528–533. [Google Scholar] [CrossRef]
- DeLouise, L.A.; Kou, P.M.; Miller, B.L. Cross-correlation of optical microcavity biosensor response with immobilized enzyme activity. Insights into biosensor sensitivity. Anal. Chem. 2005, 77, 3222–3230. [Google Scholar] [CrossRef] [PubMed]
- Ouyang, H.; Striemer, C.C.; Fauchet, P.M. Quantitative analysis of the sensitivity of porous silicon optical biosensors. Appl. Phys. Lett. 2006, 88, 1–4. [Google Scholar] [CrossRef]
- Huanca, D.R.; Ramirez-Fernandez, F.J.; Salcedo, W.J. Porous silicon optical cavity structure applied to high sensitivity organic solvent sensor. Microelectron. J. 2008, 39, 499–506. [Google Scholar] [CrossRef]
- Zhang, H.; Jia, Z.; Lv, X.; Zhou, J.; Chen, L.; Liu, R.; Ma, J. Porous silicon optical microcavity biosensor on silicon-on-insulator wafer for sensitive DNA detection. Biosens. Bioelectron. 2013, 44, 89–94. [Google Scholar] [CrossRef] [PubMed]
- Lasave, L.C.; Urteaga, R.; Koropecki, R.R.; Gonzalez, V.D.; Arce, R.D. Real-time study of protein adsorption kinetics in porous silicon. Colloids Surf. B Biointerf. 2013, 111, 354–359. [Google Scholar] [CrossRef] [PubMed]
- Pham, V.H.; Van Nguyen, T.; Nguyen, T.A.; Pham, V.D.; Bui, H. Nano porous silicon microcavity sensor for determination organic solvents and pesticide in water. Adv. Nat. Sci. Nanosci. Nanotechnol. 2014, 5, 45003. [Google Scholar] [CrossRef]
- Li, P.; Jia, Z.; Lü, X.; Liu, Y.; Ning, X.; Mo, J.; Wang, J. Spectrometer-free biological detection method using porous silicon microcavity devices. Opt. Express 2015, 23, 24626. [Google Scholar] [CrossRef] [PubMed]
- Rodriguez, G.A.; Ryckman, J.D.; Jiao, Y.; Weiss, S.M. A size selective porous silicon grating-coupled Bloch surface and sub-surface wave biosensor. Biosens. Bioelectron. 2014, 53, 486–493. [Google Scholar] [CrossRef] [PubMed]
- Rodriguez, G.A.; Lonai, J.D.; Mernaugh, R.L.; Weiss, S.M. Porous silicon Bloch surface and sub-surface wave structure for simultaneous detection of small and large molecules. Nanoscale Res. Lett. 2014, 9, 383. [Google Scholar] [CrossRef] [PubMed]
- Álvarez, J.; Bettotti, P.; Suárez, I.; Kumar, N.; Hill, D.; Chirvony, V.; Pavesi, L.; Martínez-Pastor, J. Birefringent porous silicon membranes for optical sensing. Opt. Express 2011, 19, 26106. [Google Scholar] [CrossRef] [PubMed]
- Alvarez, J.; Bettotti, P.; Kumar, N; Suarez, I.; Hill, D.; Martinez-Pastor, J. Highly-sensitive anisotropic porous silicon based optical sensors. Proc. SPIE 2012, 8212, 821209-1. [Google Scholar]
- Baratto, C.; Faglia, G.; Comini, E.; Sberveglieri, G.; Taroni, A.; La Ferrara, V.; Quercia, L.; Di Francia, G. A novel porous silicon sensor for detection of sub-ppm NO2 concentrations. Sens. Actuators B Chem. 2001, 77, 62–66. [Google Scholar] [CrossRef]
- Zhao, Y.; Gaur, G.; Retterer, S.T.; Laibinis, P.E.; Weiss, S.M. Flow-through porous silicon membranes for real-time label-free biosensing. Anal. Chem. 2016, 88, 10940–10948. [Google Scholar] [CrossRef] [PubMed]
- Kim, K.; Murphy, T. Porous silicon integrated Mach-Zehnder interferometer waveguide for biological and chemical sensing. Opt. Express 2013, 21, 2229–2233. [Google Scholar] [CrossRef] [PubMed]
- Rodriguez, G.A.; Hu, S.; Weiss, S.M. Porous silicon ring resonator for compact, high sensitivity biosensing applications. Opt. Express 2015, 23, 7111. [Google Scholar] [CrossRef] [PubMed]
- Girault, P.; Azuelos, P.; Lorrain, N.; Poffo, L.; Lemaitre, J.; Pirasteh, P.; Hardy, I.; Thual, M.; Guendouz, M.; Charrier, J. Porous silicon micro-resonator implemented by standard photolithography process for sensing application. Opt. Mater. 2017, 72, 596–601. [Google Scholar] [CrossRef]
- Balili, R.B. Transfer matrix method in nanophotonics. Int. J. Mod. Phys. Conf. Ser. 2012, 17, 159–168. [Google Scholar] [CrossRef]
- Pavesi, L. Porous silicon dielectric multilayers and microcavities. Riv. del Nuovo Cim. 1997, 20, 1–76. [Google Scholar] [CrossRef]
- Bruggeman, D.A.G. Dielectric constant and conductivity of mixtures of isotropic materials. Ann. Phys. 1935, 24, 636–679. [Google Scholar] [CrossRef]
- García-Rupérez, J.; Toccafondo, V.; Bañuls, M.J.; Castelló, J.G.; Griol, A.; Peransi-Llopis, S.; Maquieira, Á. Label-free antibody detection using band edge fringes in SOI planar photonic crystal waveguides in the slow-light regime. Opt. Express 2010, 18, 24276–24286. [Google Scholar] [CrossRef] [PubMed]
- Acquaroli, L.N.; Urteaga, R.; Berli, C.L.A.; Koropecki, R.R. Capillary filling in nanostructured porous silicon. Langmuir 2011, 27, 2067–2072. [Google Scholar] [CrossRef] [PubMed]
- Rasband, W.S. ImageJ, U.S. Available online: https://imagej.nih.gov/ij/ (accessed on 1 December 2017).


| Layer | [HF] | J (mA/cm2) | T (s) |
|---|---|---|---|
| nH | 16% | 16 | 10.3 |
| nL | 16% | 45 | 6.9 |
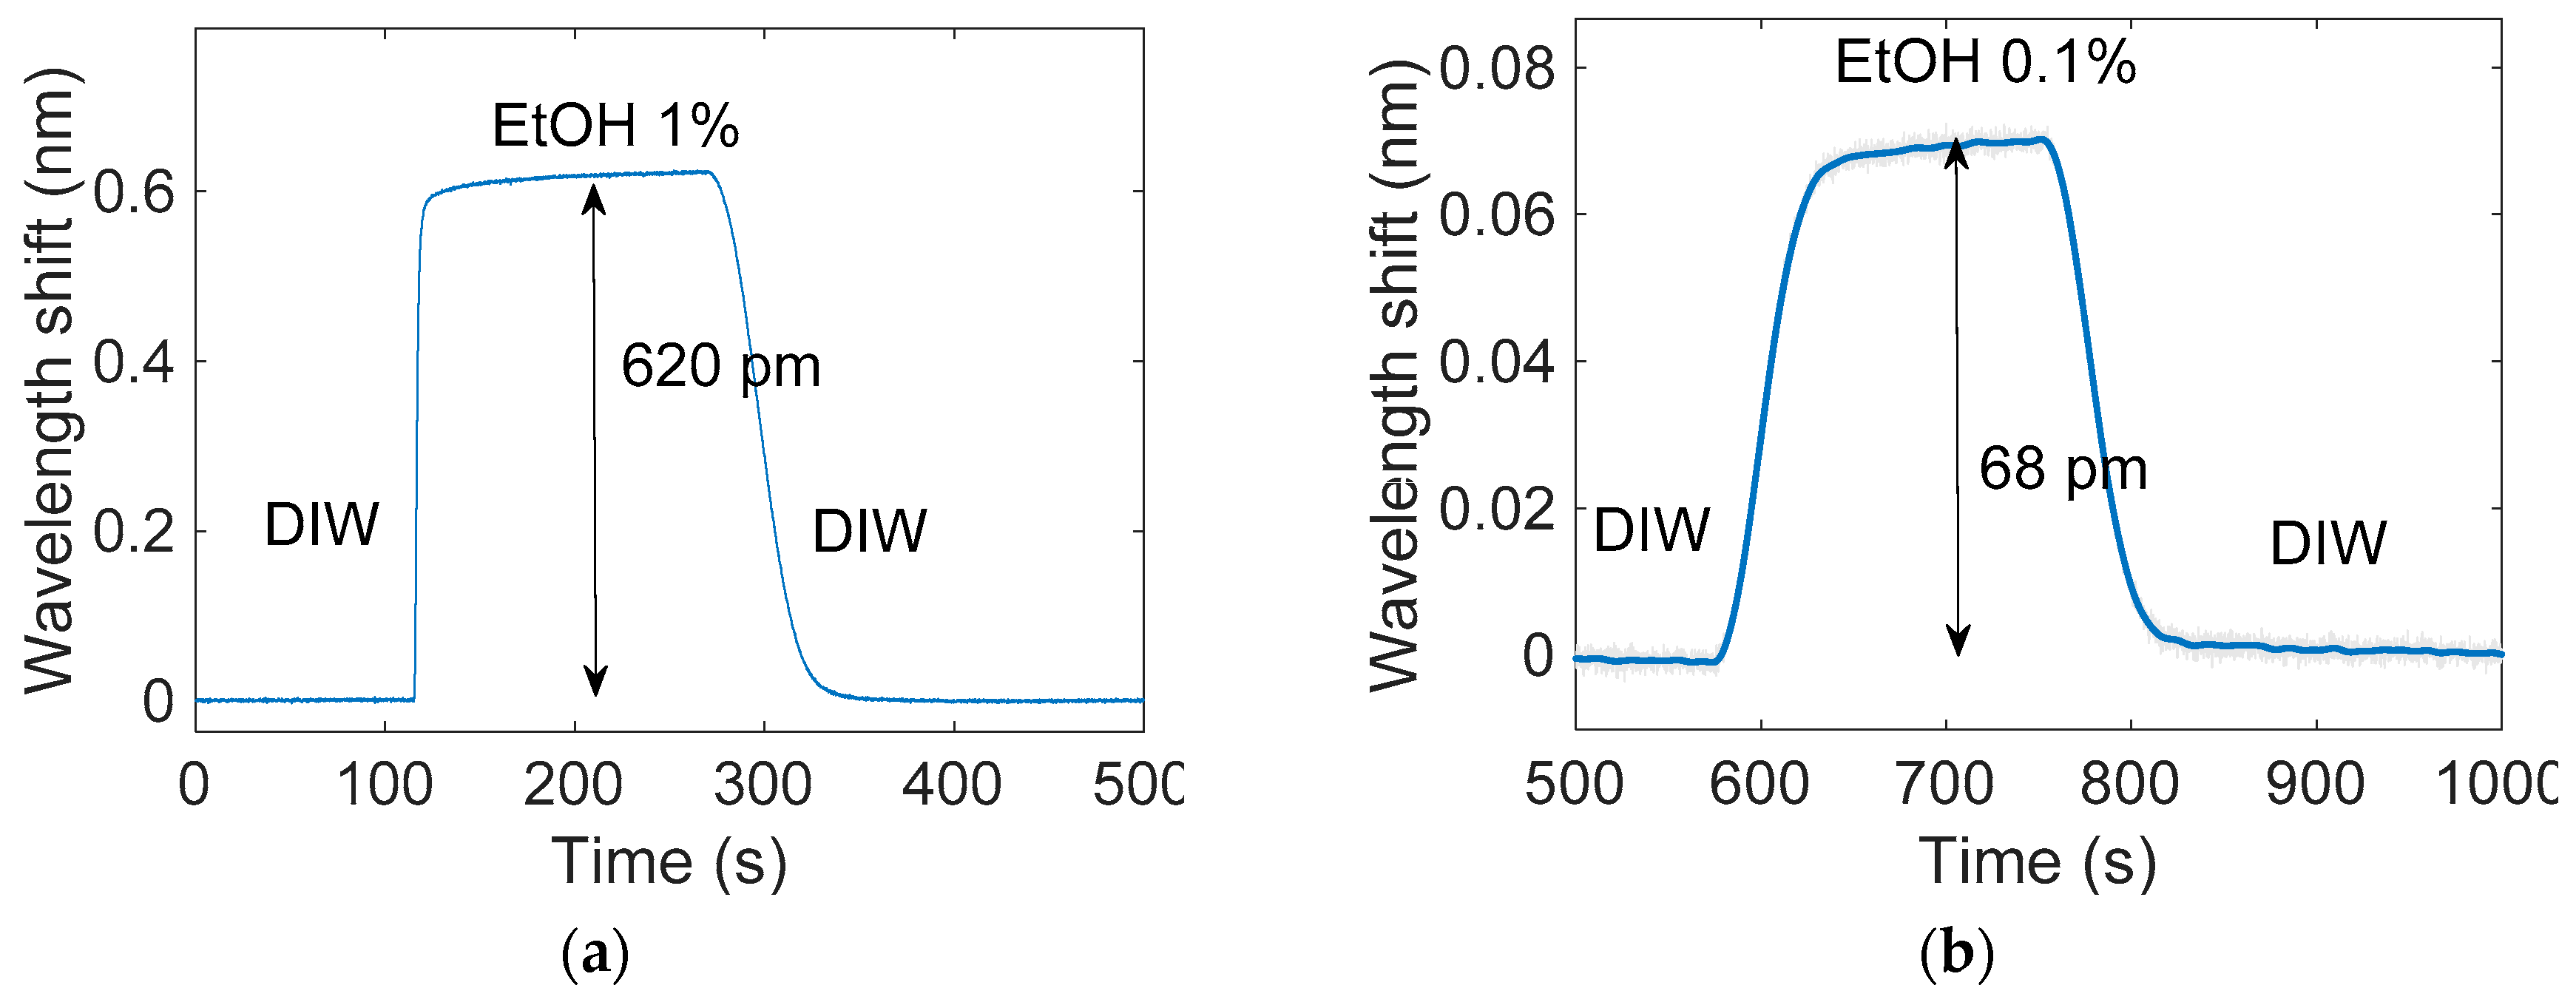
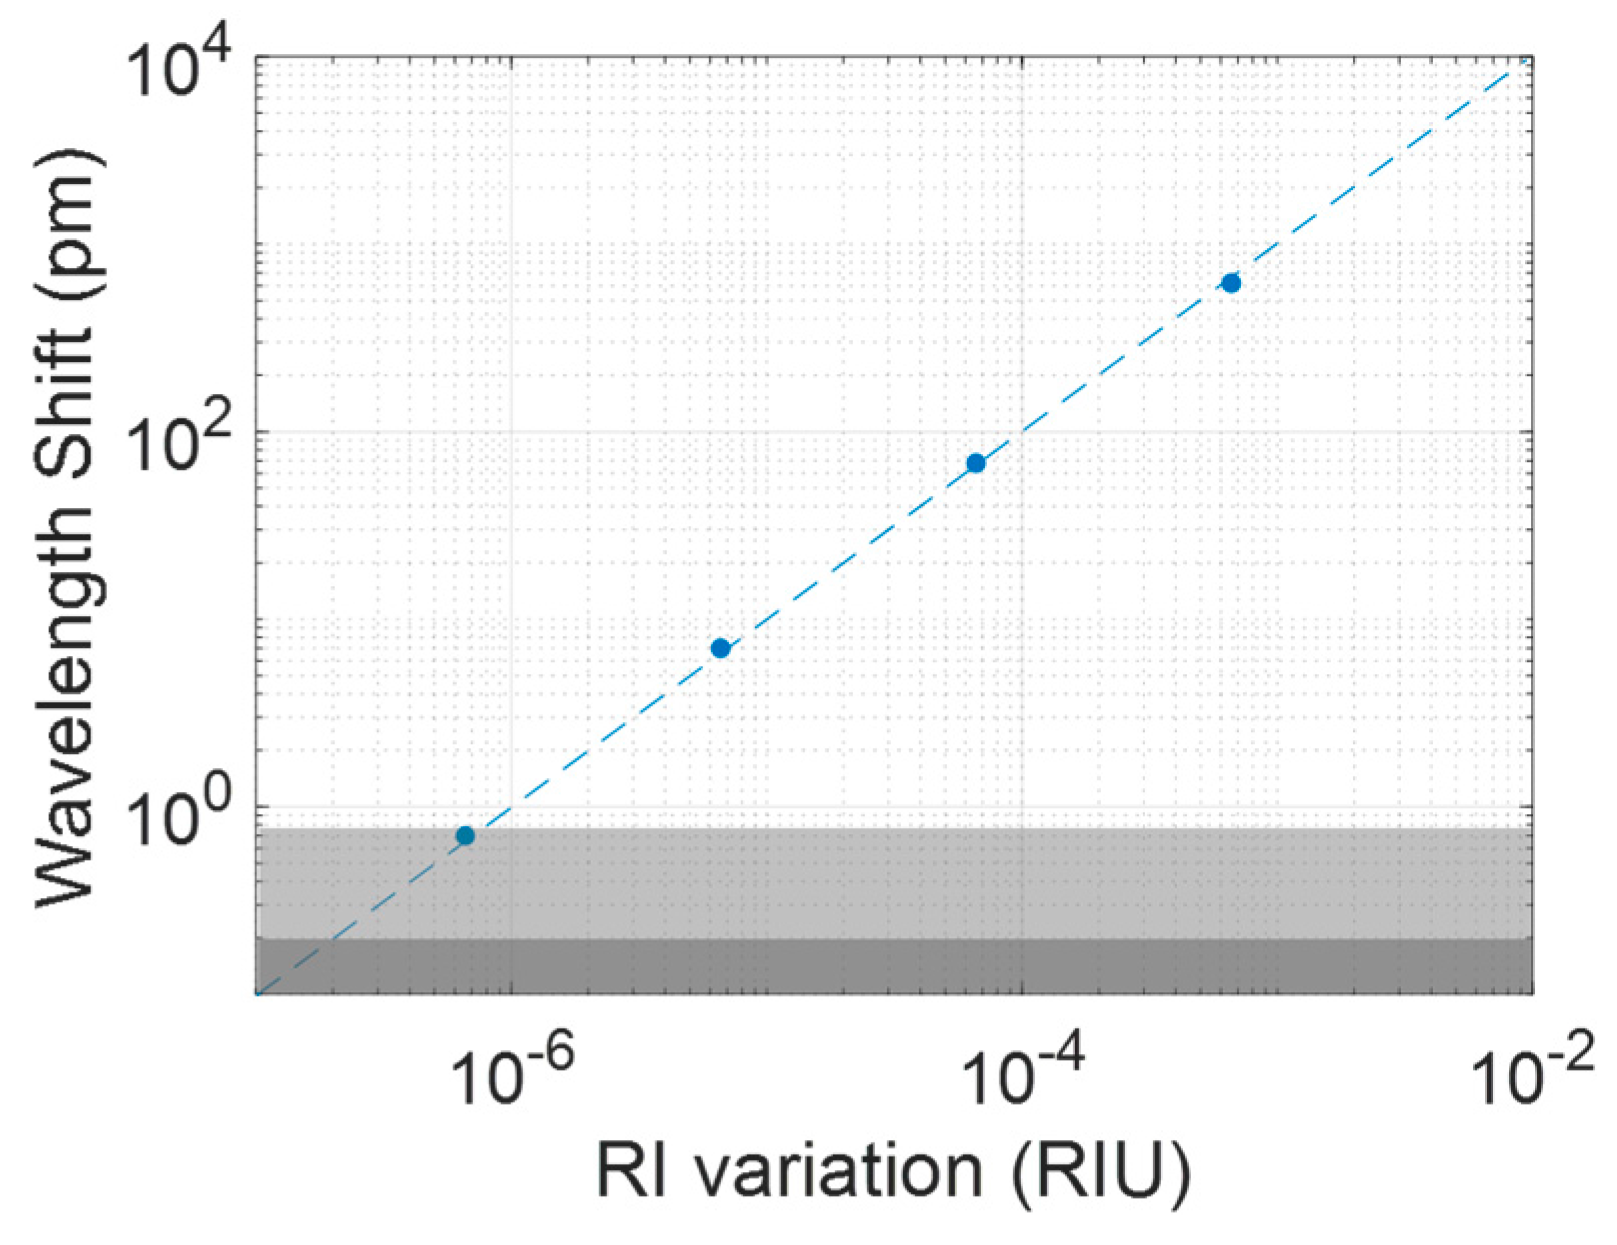
| [EtOH] (%) | ΔRI (RIU) | Δλ (pm) |
|---|---|---|
| 1 | 6.6 × 10⁻⁴ | 620 |
| 0.1 | 6.6 × 10⁻⁵ | 68 |
| 0.01 | 6.6 × 10⁻⁶ | 7 |
| 0.001 | 6.6 × 10⁻⁷ | 0.7 |
| PS Structure | Target Substance | Interrogation Equipment | Sensitivity (nm/RIU) | Continuous Flow | Acquisition Period | Reference |
|---|---|---|---|---|---|---|
| MC | Sucrose | Spectrometer | n/a | ✓ | 8 s | [15] |
| FP | Hydrogen | Spectrometer | n/a | ✓ | 8 s | [11] |
| MC | Solvents | Spectrometer | 425 | n/a | n/a | [16] |
| BR | Gas | Spectrometer | 470 ± 40 | n/a | n/a | [14] |
| MC | Solvents | Spectrometer | ~550 | n/a | n/a | [18] |
| DL | Proteases | Spectrometer | n/a | ✓ | 2 s | [12] |
| MC | Ethanol | Spectrometer | ~350 | ✓ | 4 s | [20] |
| MC | Solvents | Spectrometer | 200 | ✓ | n/a | [21] |
| RR | NaCl | Tunable laser | 380 | n/a | n/a | [30] |
| MC | Streptavidin | Spectrometer | n/a | ✓ | 20 s | [26] |
| RR | Glucose | Tunable laser | 560 | n/a | n/a | [31] |
| MC | Ethanol | Optical interrogator | ~1000 | ✓ | 0.1 s | This work |
© 2017 by the authors. Licensee MDPI, Basel, Switzerland. This article is an open access article distributed under the terms and conditions of the Creative Commons Attribution (CC BY) license (http://creativecommons.org/licenses/by/4.0/).
Share and Cite
Caroselli, R.; Martín Sánchez, D.; Ponce Alcántara, S.; Prats Quilez, F.; Torrijos Morán, L.; García-Rupérez, J. Real-Time and In-Flow Sensing Using a High Sensitivity Porous Silicon Microcavity-Based Sensor. Sensors 2017, 17, 2813. https://doi.org/10.3390/s17122813
Caroselli R, Martín Sánchez D, Ponce Alcántara S, Prats Quilez F, Torrijos Morán L, García-Rupérez J. Real-Time and In-Flow Sensing Using a High Sensitivity Porous Silicon Microcavity-Based Sensor. Sensors. 2017; 17(12):2813. https://doi.org/10.3390/s17122813
Chicago/Turabian StyleCaroselli, Raffaele, David Martín Sánchez, Salvador Ponce Alcántara, Francisco Prats Quilez, Luis Torrijos Morán, and Jaime García-Rupérez. 2017. "Real-Time and In-Flow Sensing Using a High Sensitivity Porous Silicon Microcavity-Based Sensor" Sensors 17, no. 12: 2813. https://doi.org/10.3390/s17122813
APA StyleCaroselli, R., Martín Sánchez, D., Ponce Alcántara, S., Prats Quilez, F., Torrijos Morán, L., & García-Rupérez, J. (2017). Real-Time and In-Flow Sensing Using a High Sensitivity Porous Silicon Microcavity-Based Sensor. Sensors, 17(12), 2813. https://doi.org/10.3390/s17122813