Assembled Cantilever Fiber Touch Trigger Probe for Three-Dimensional Measurement of Microstructures

Abstract
1. Introduction
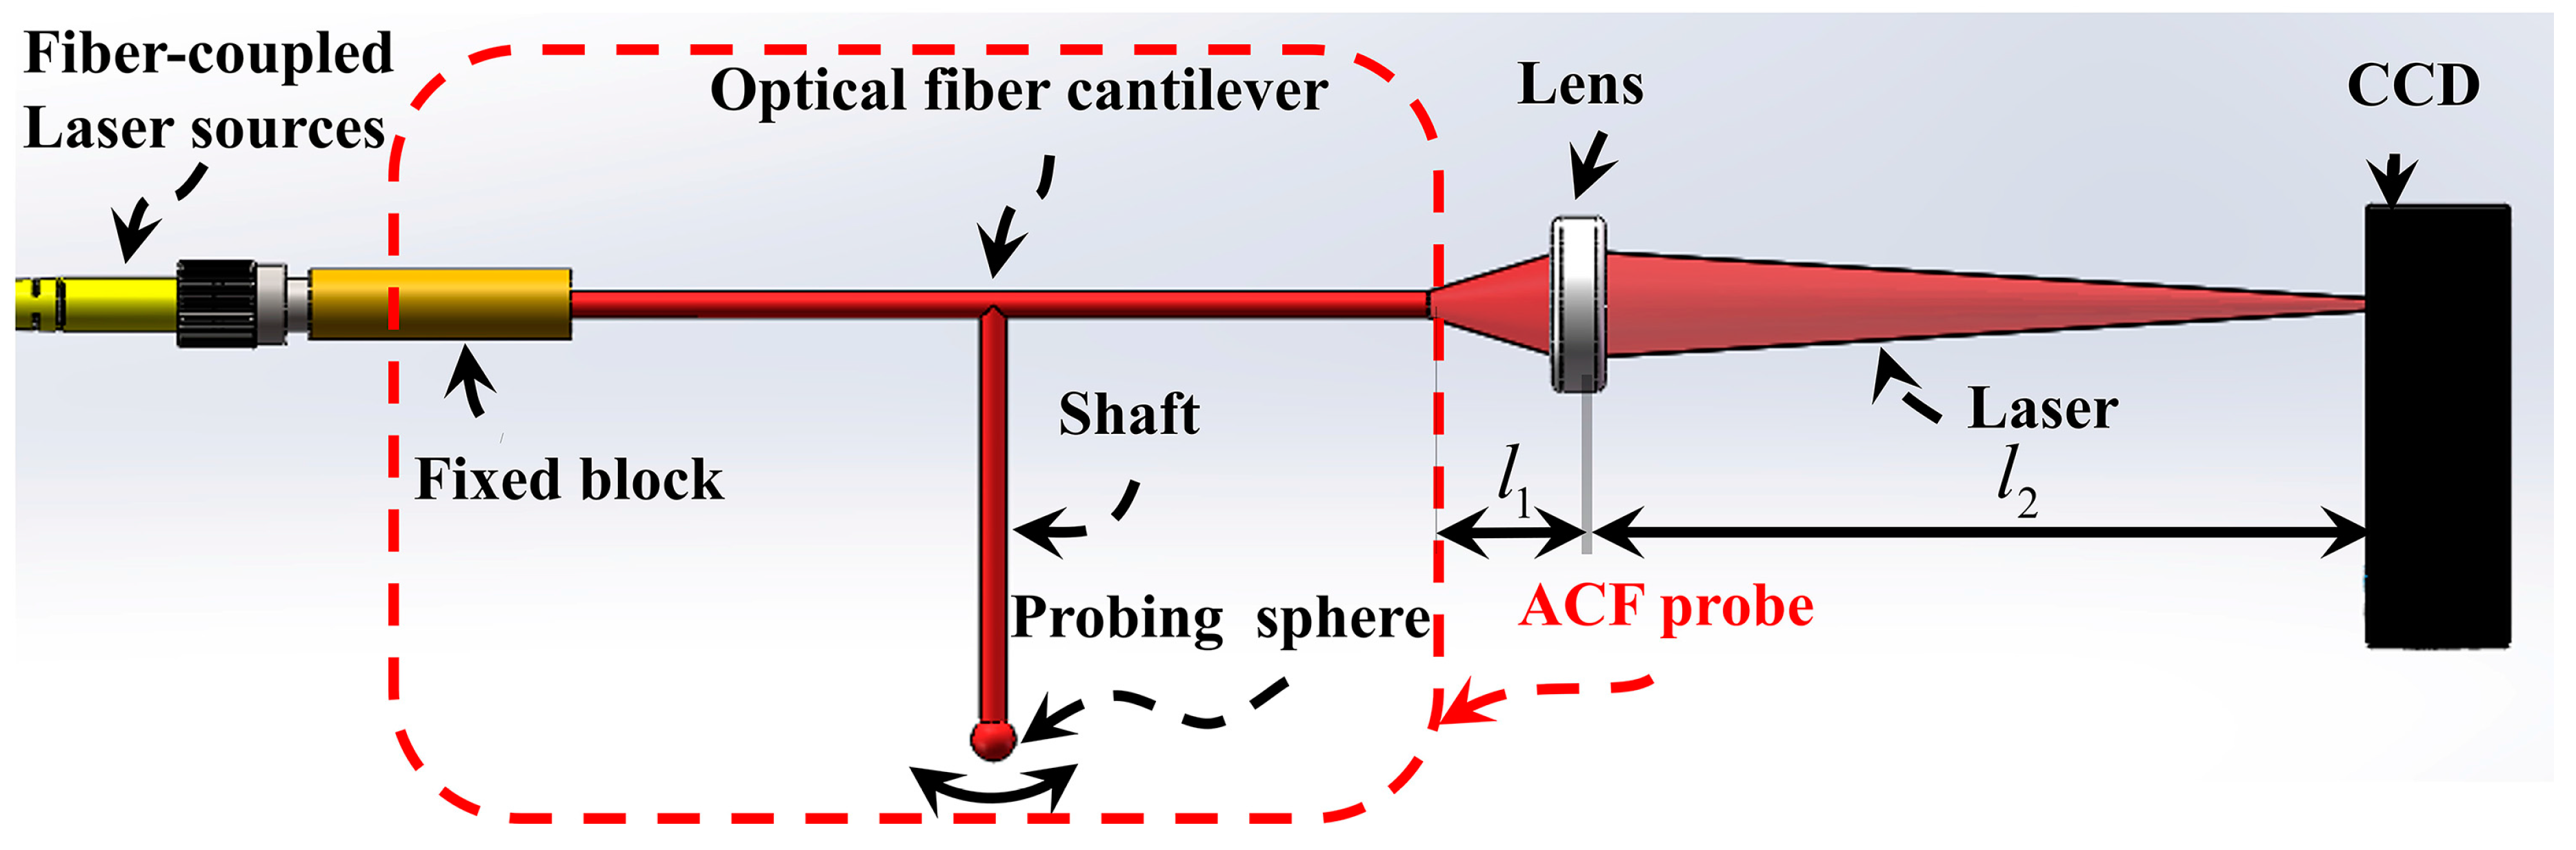
2. Principle
3. Analysis and Design of the Probe
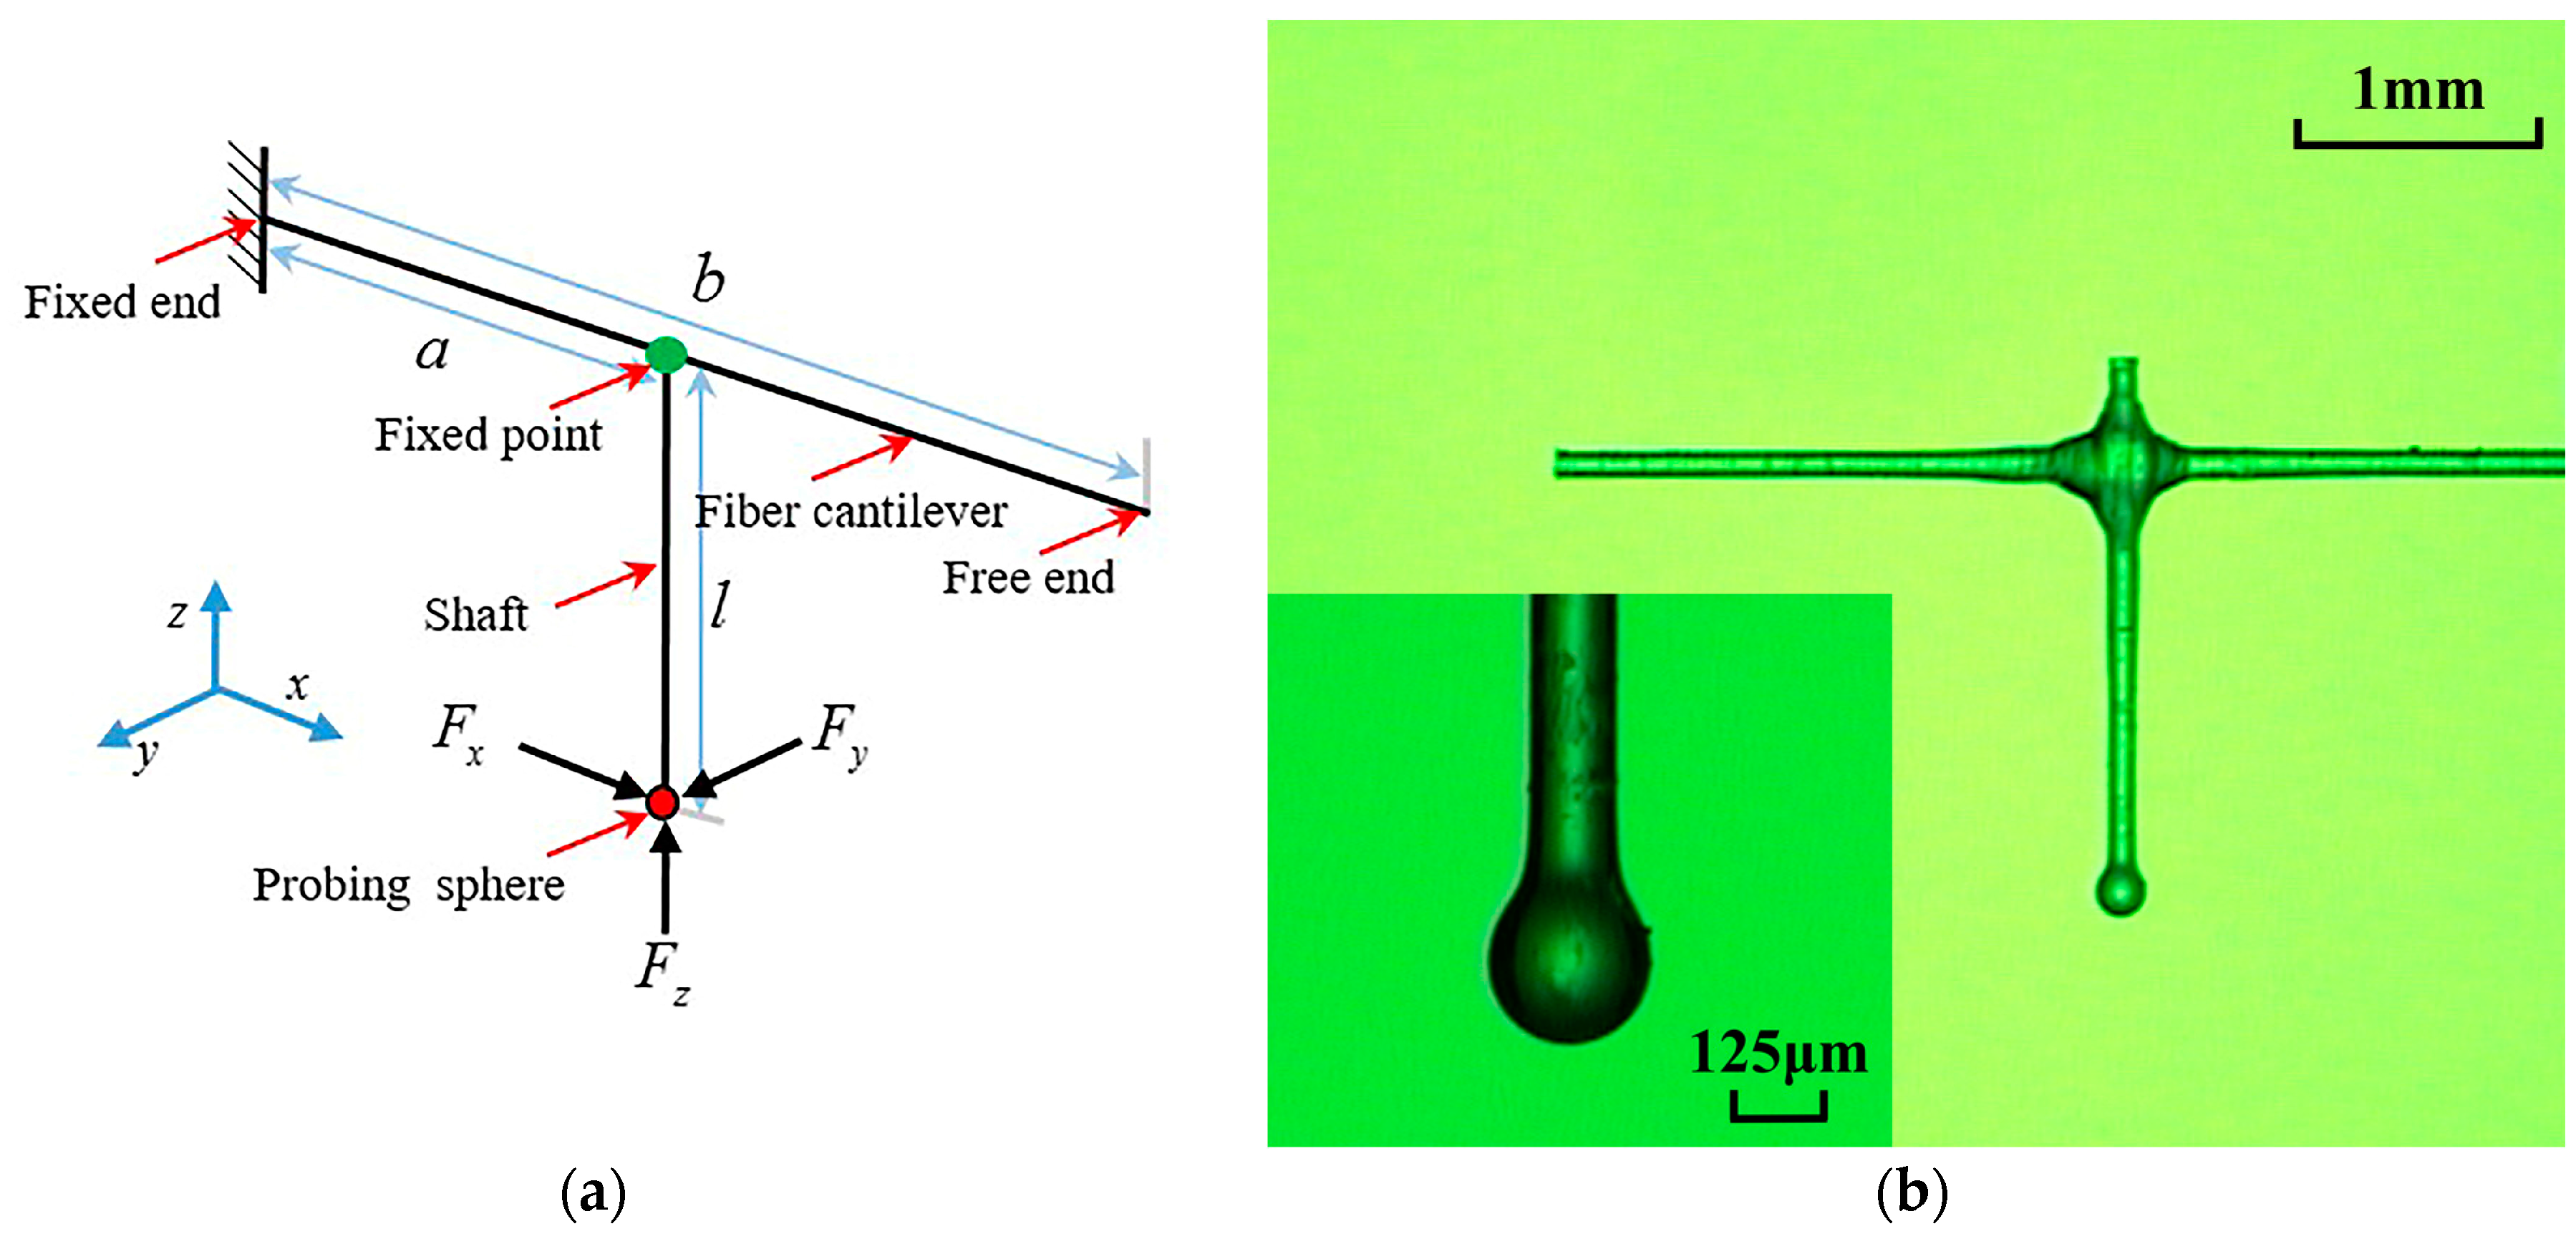
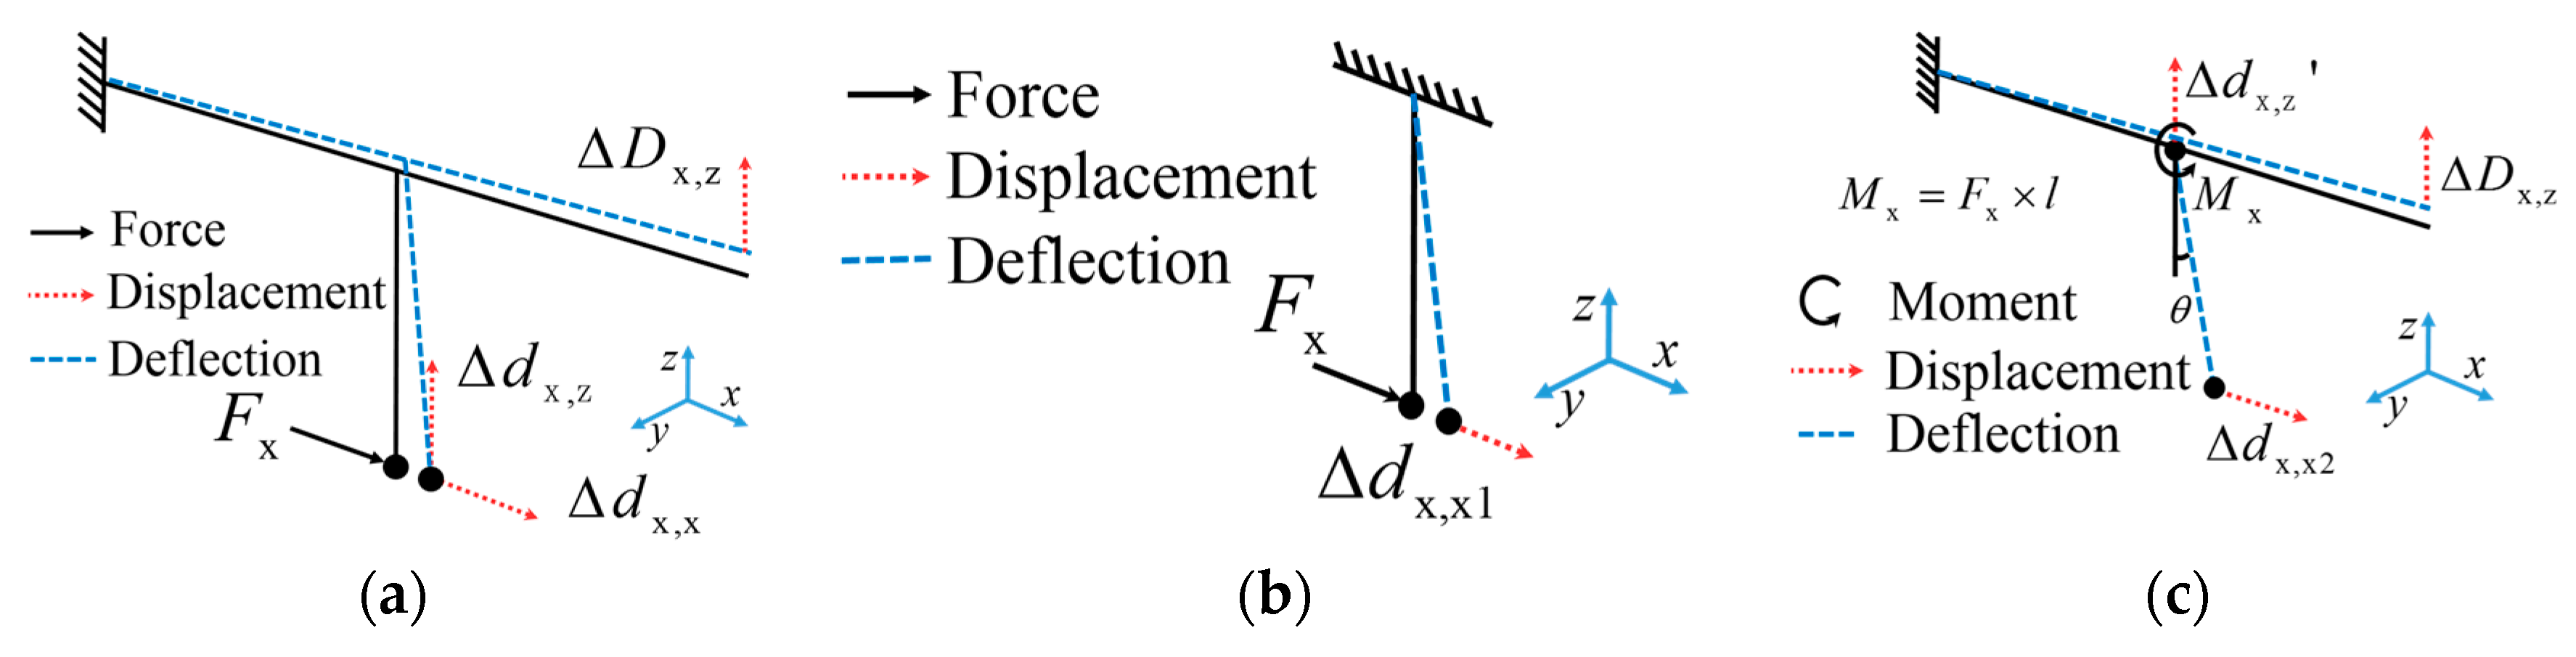
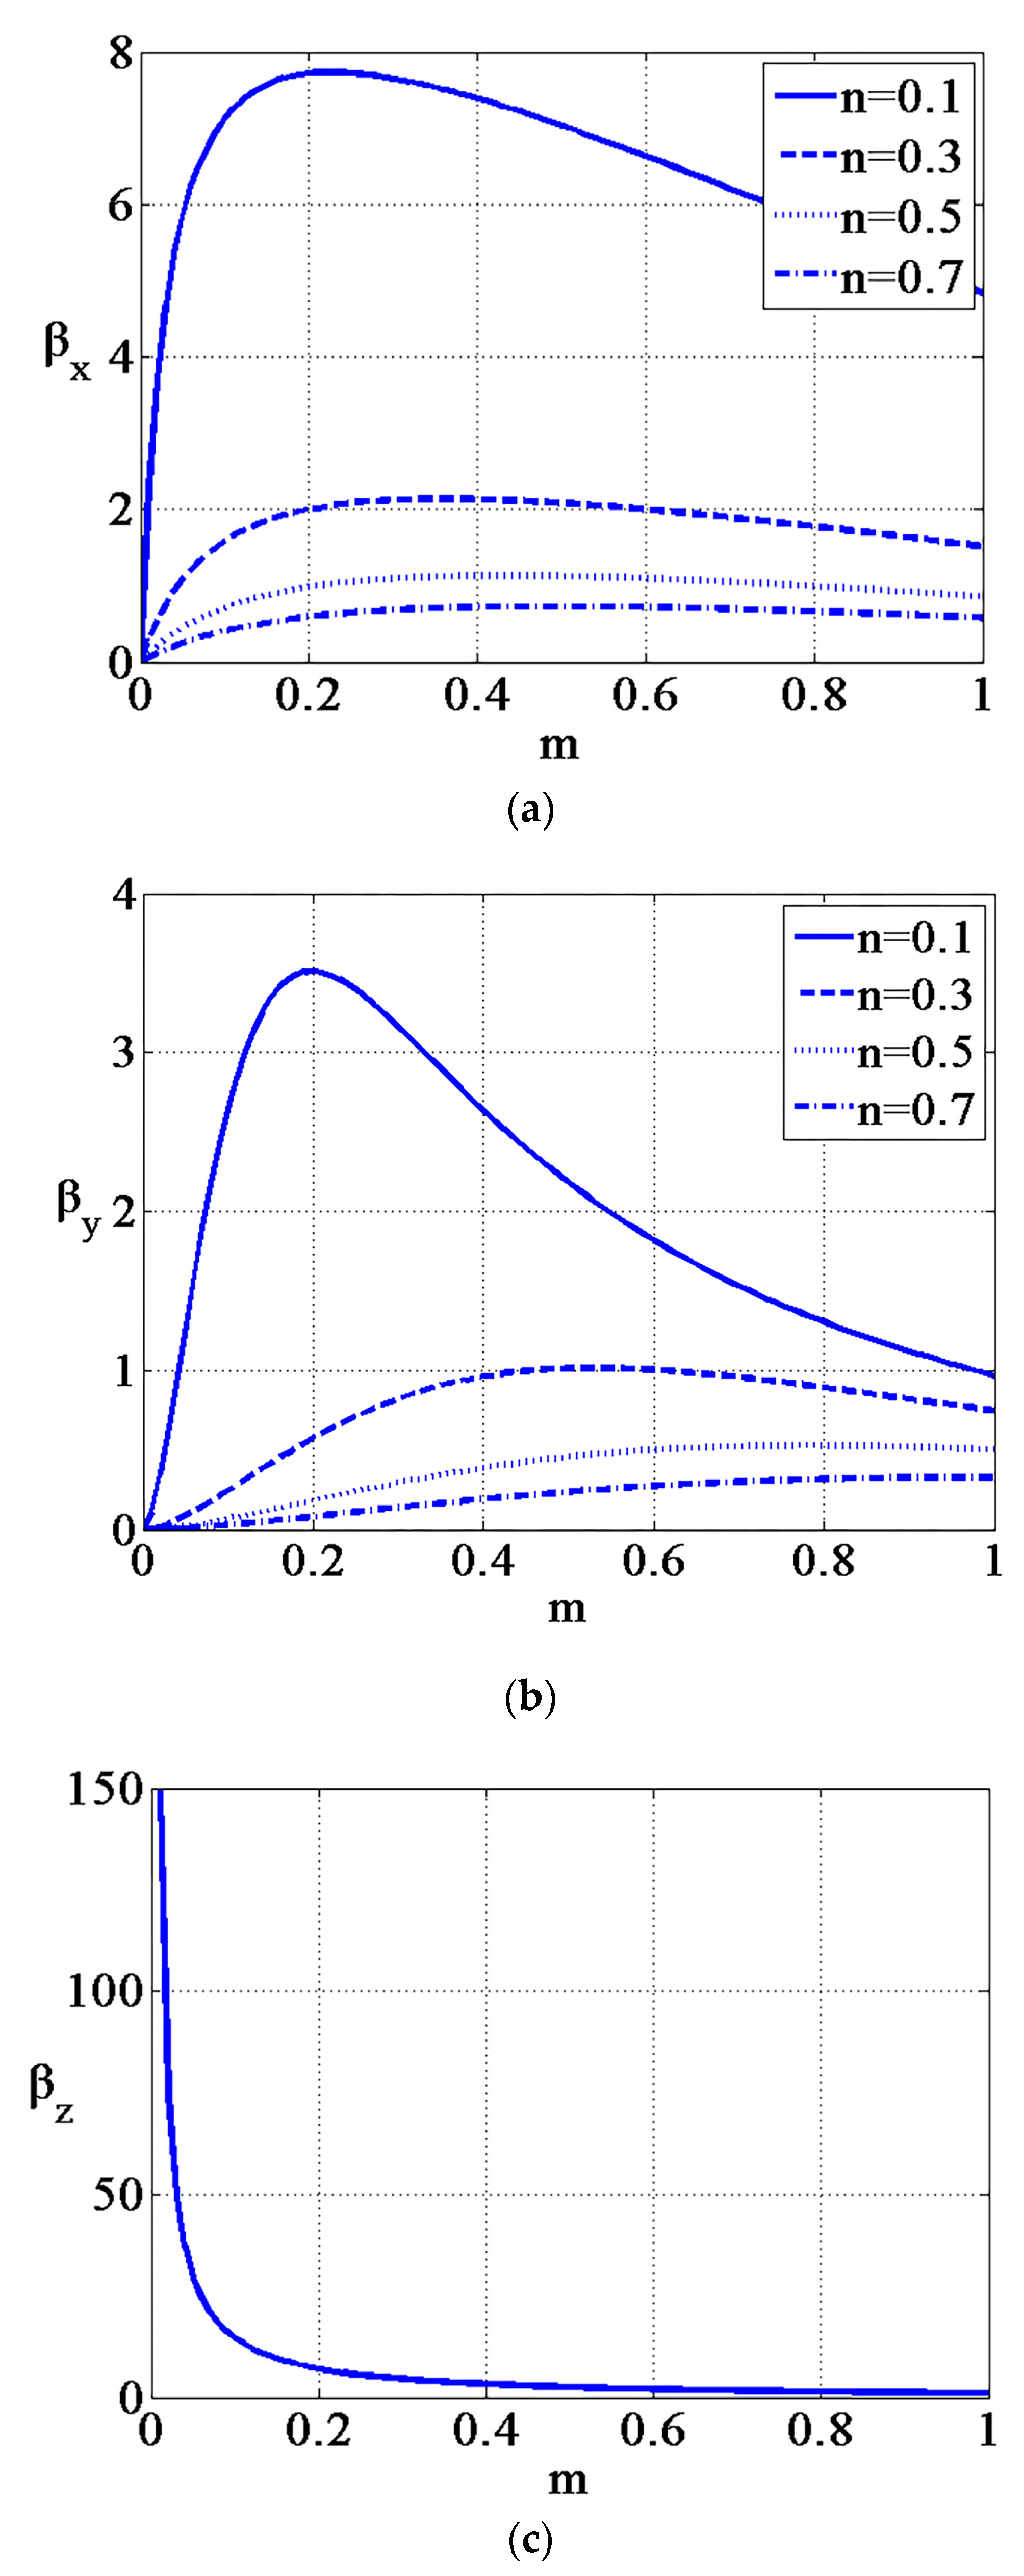
3.1. Displacement Transfer Function of the Probe
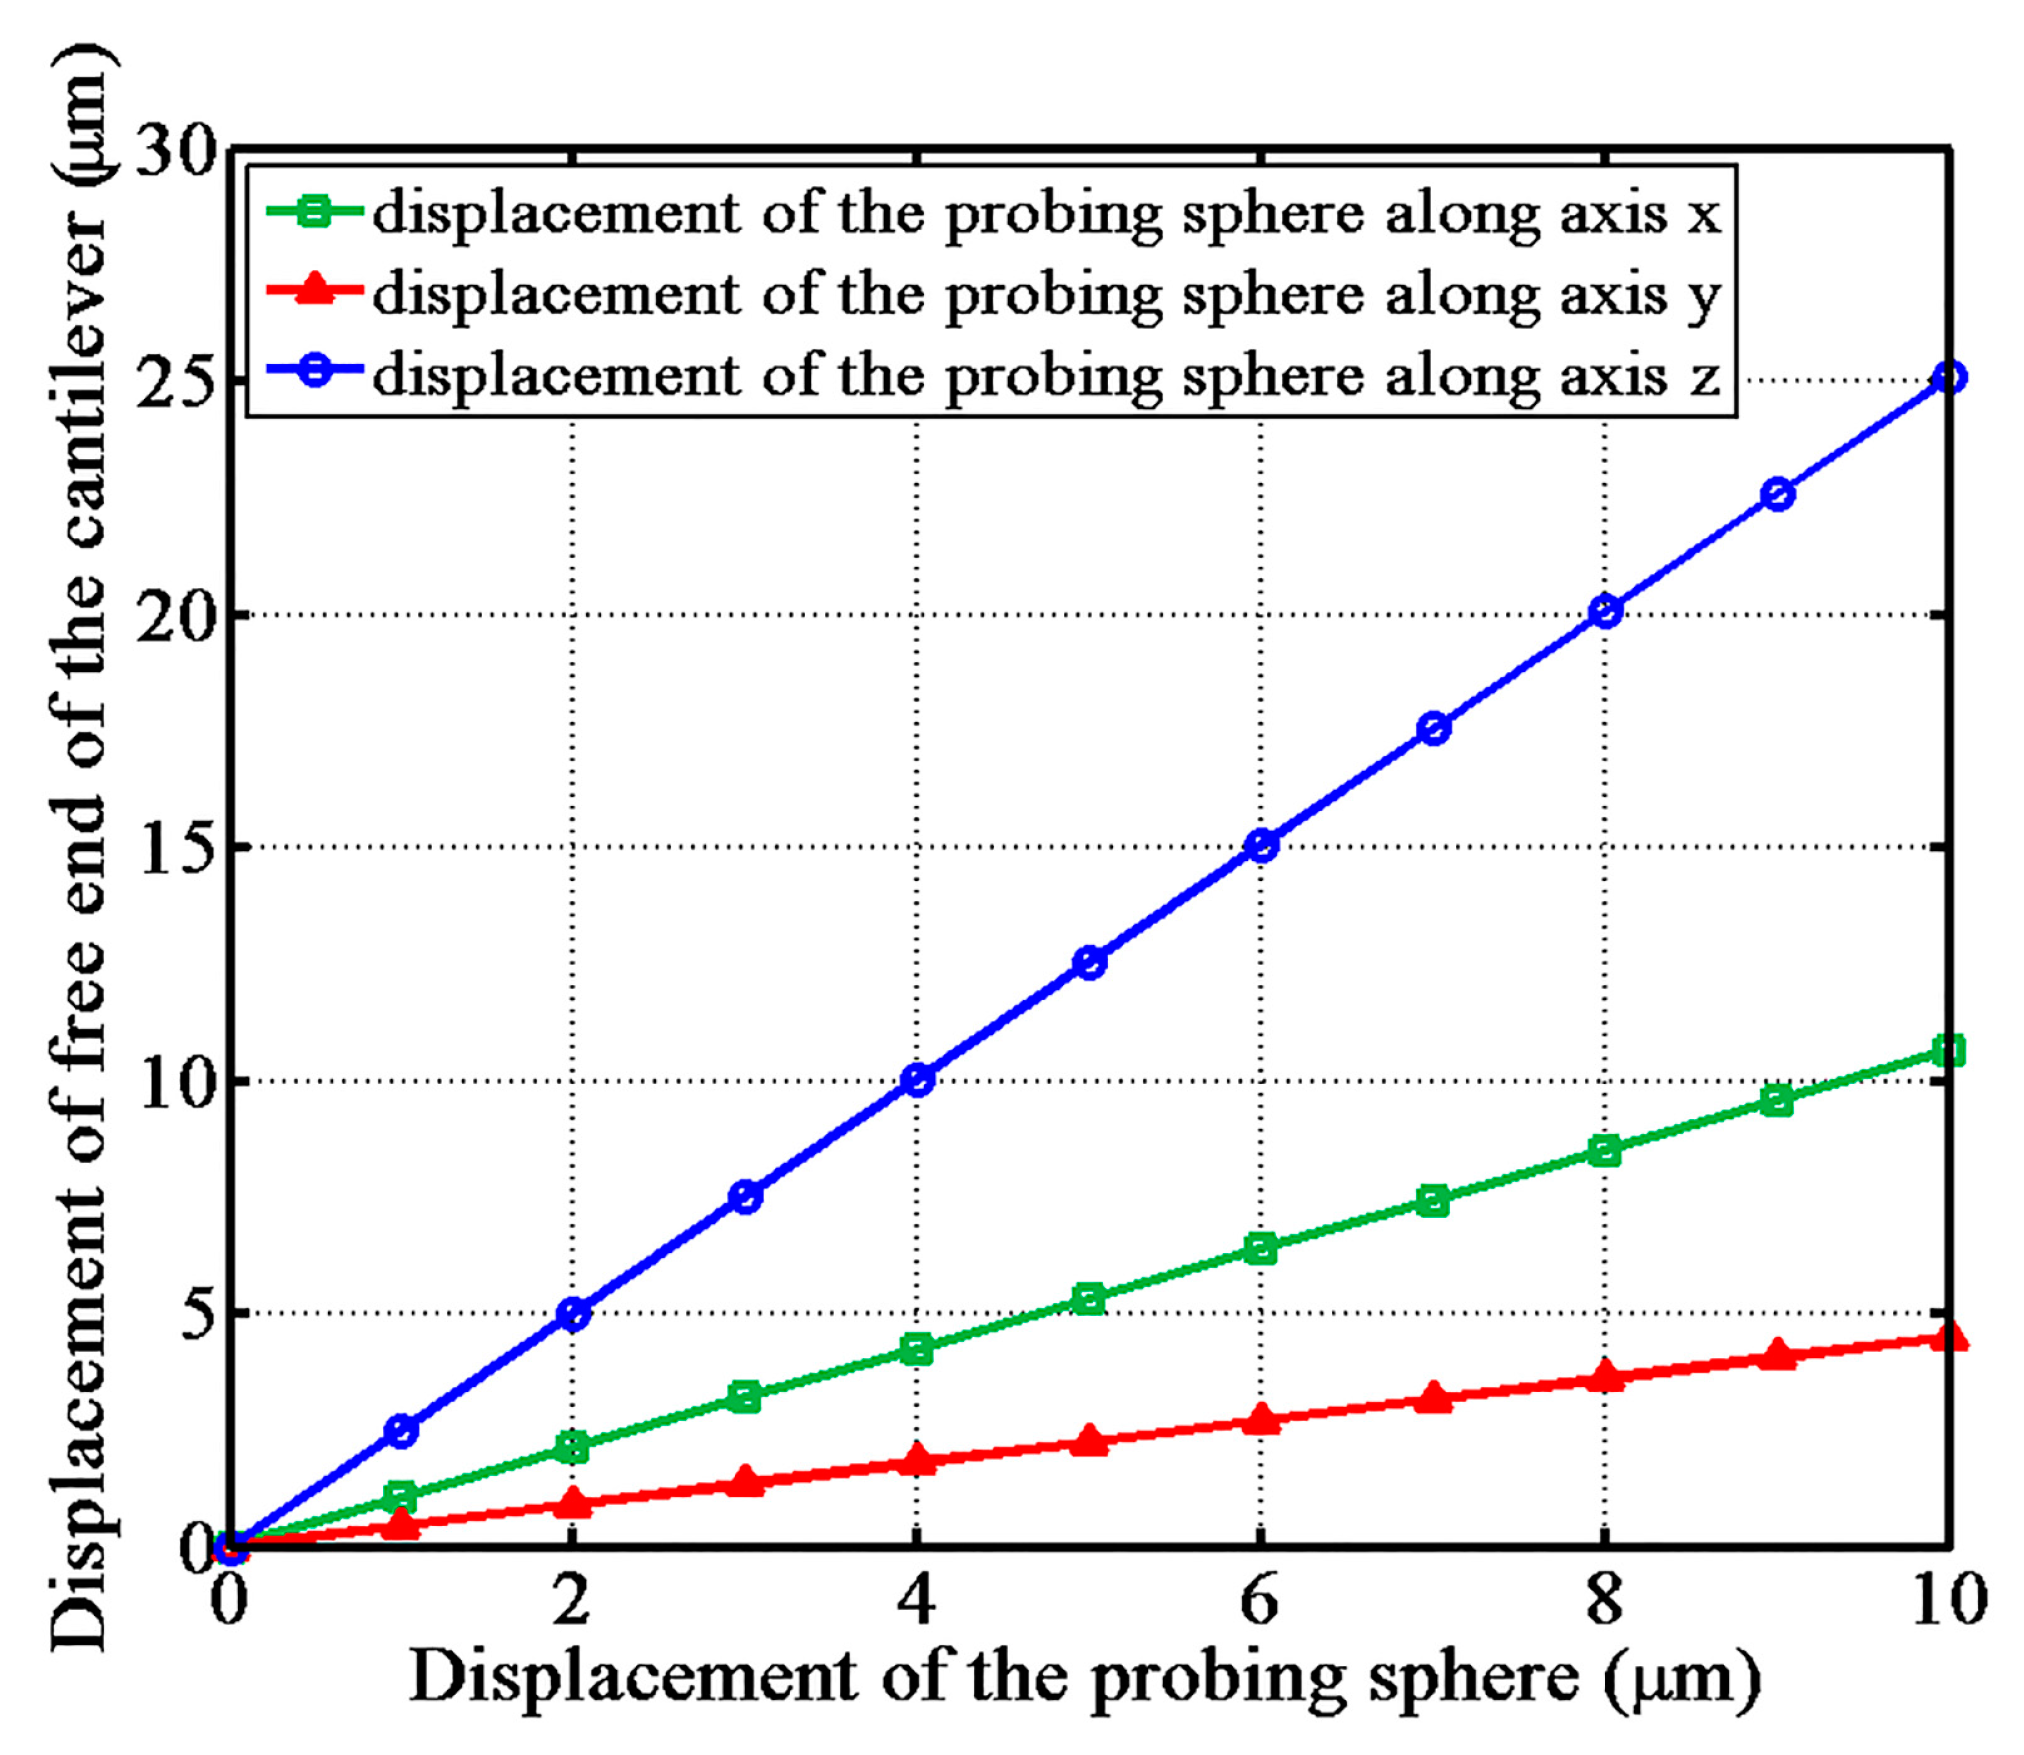
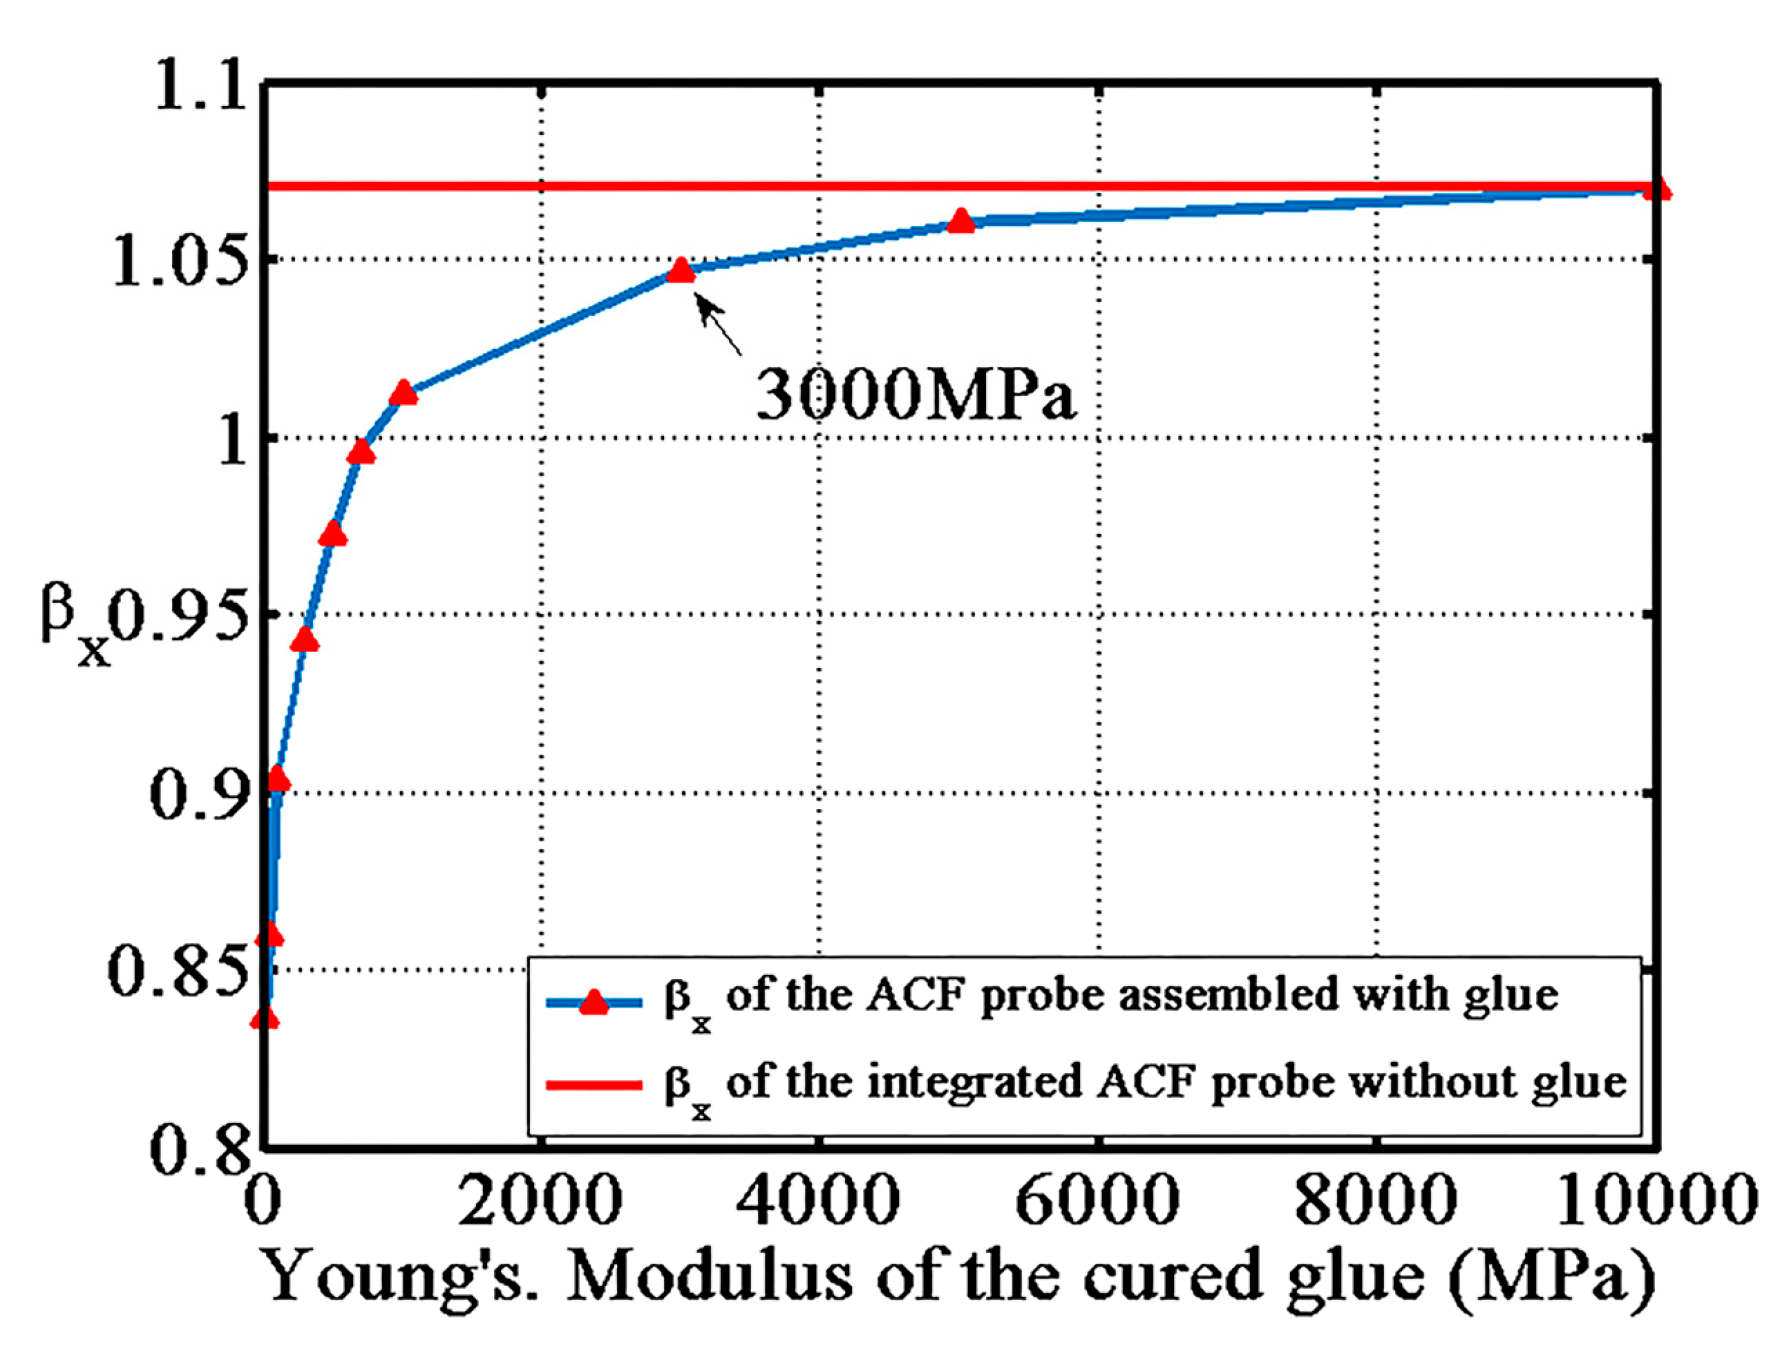
3.2. Finite Element Analysis of the Probe
3.3. Optimal Design of the Probe
4. Experiment
4.1. Fabrication of the ACF Probe
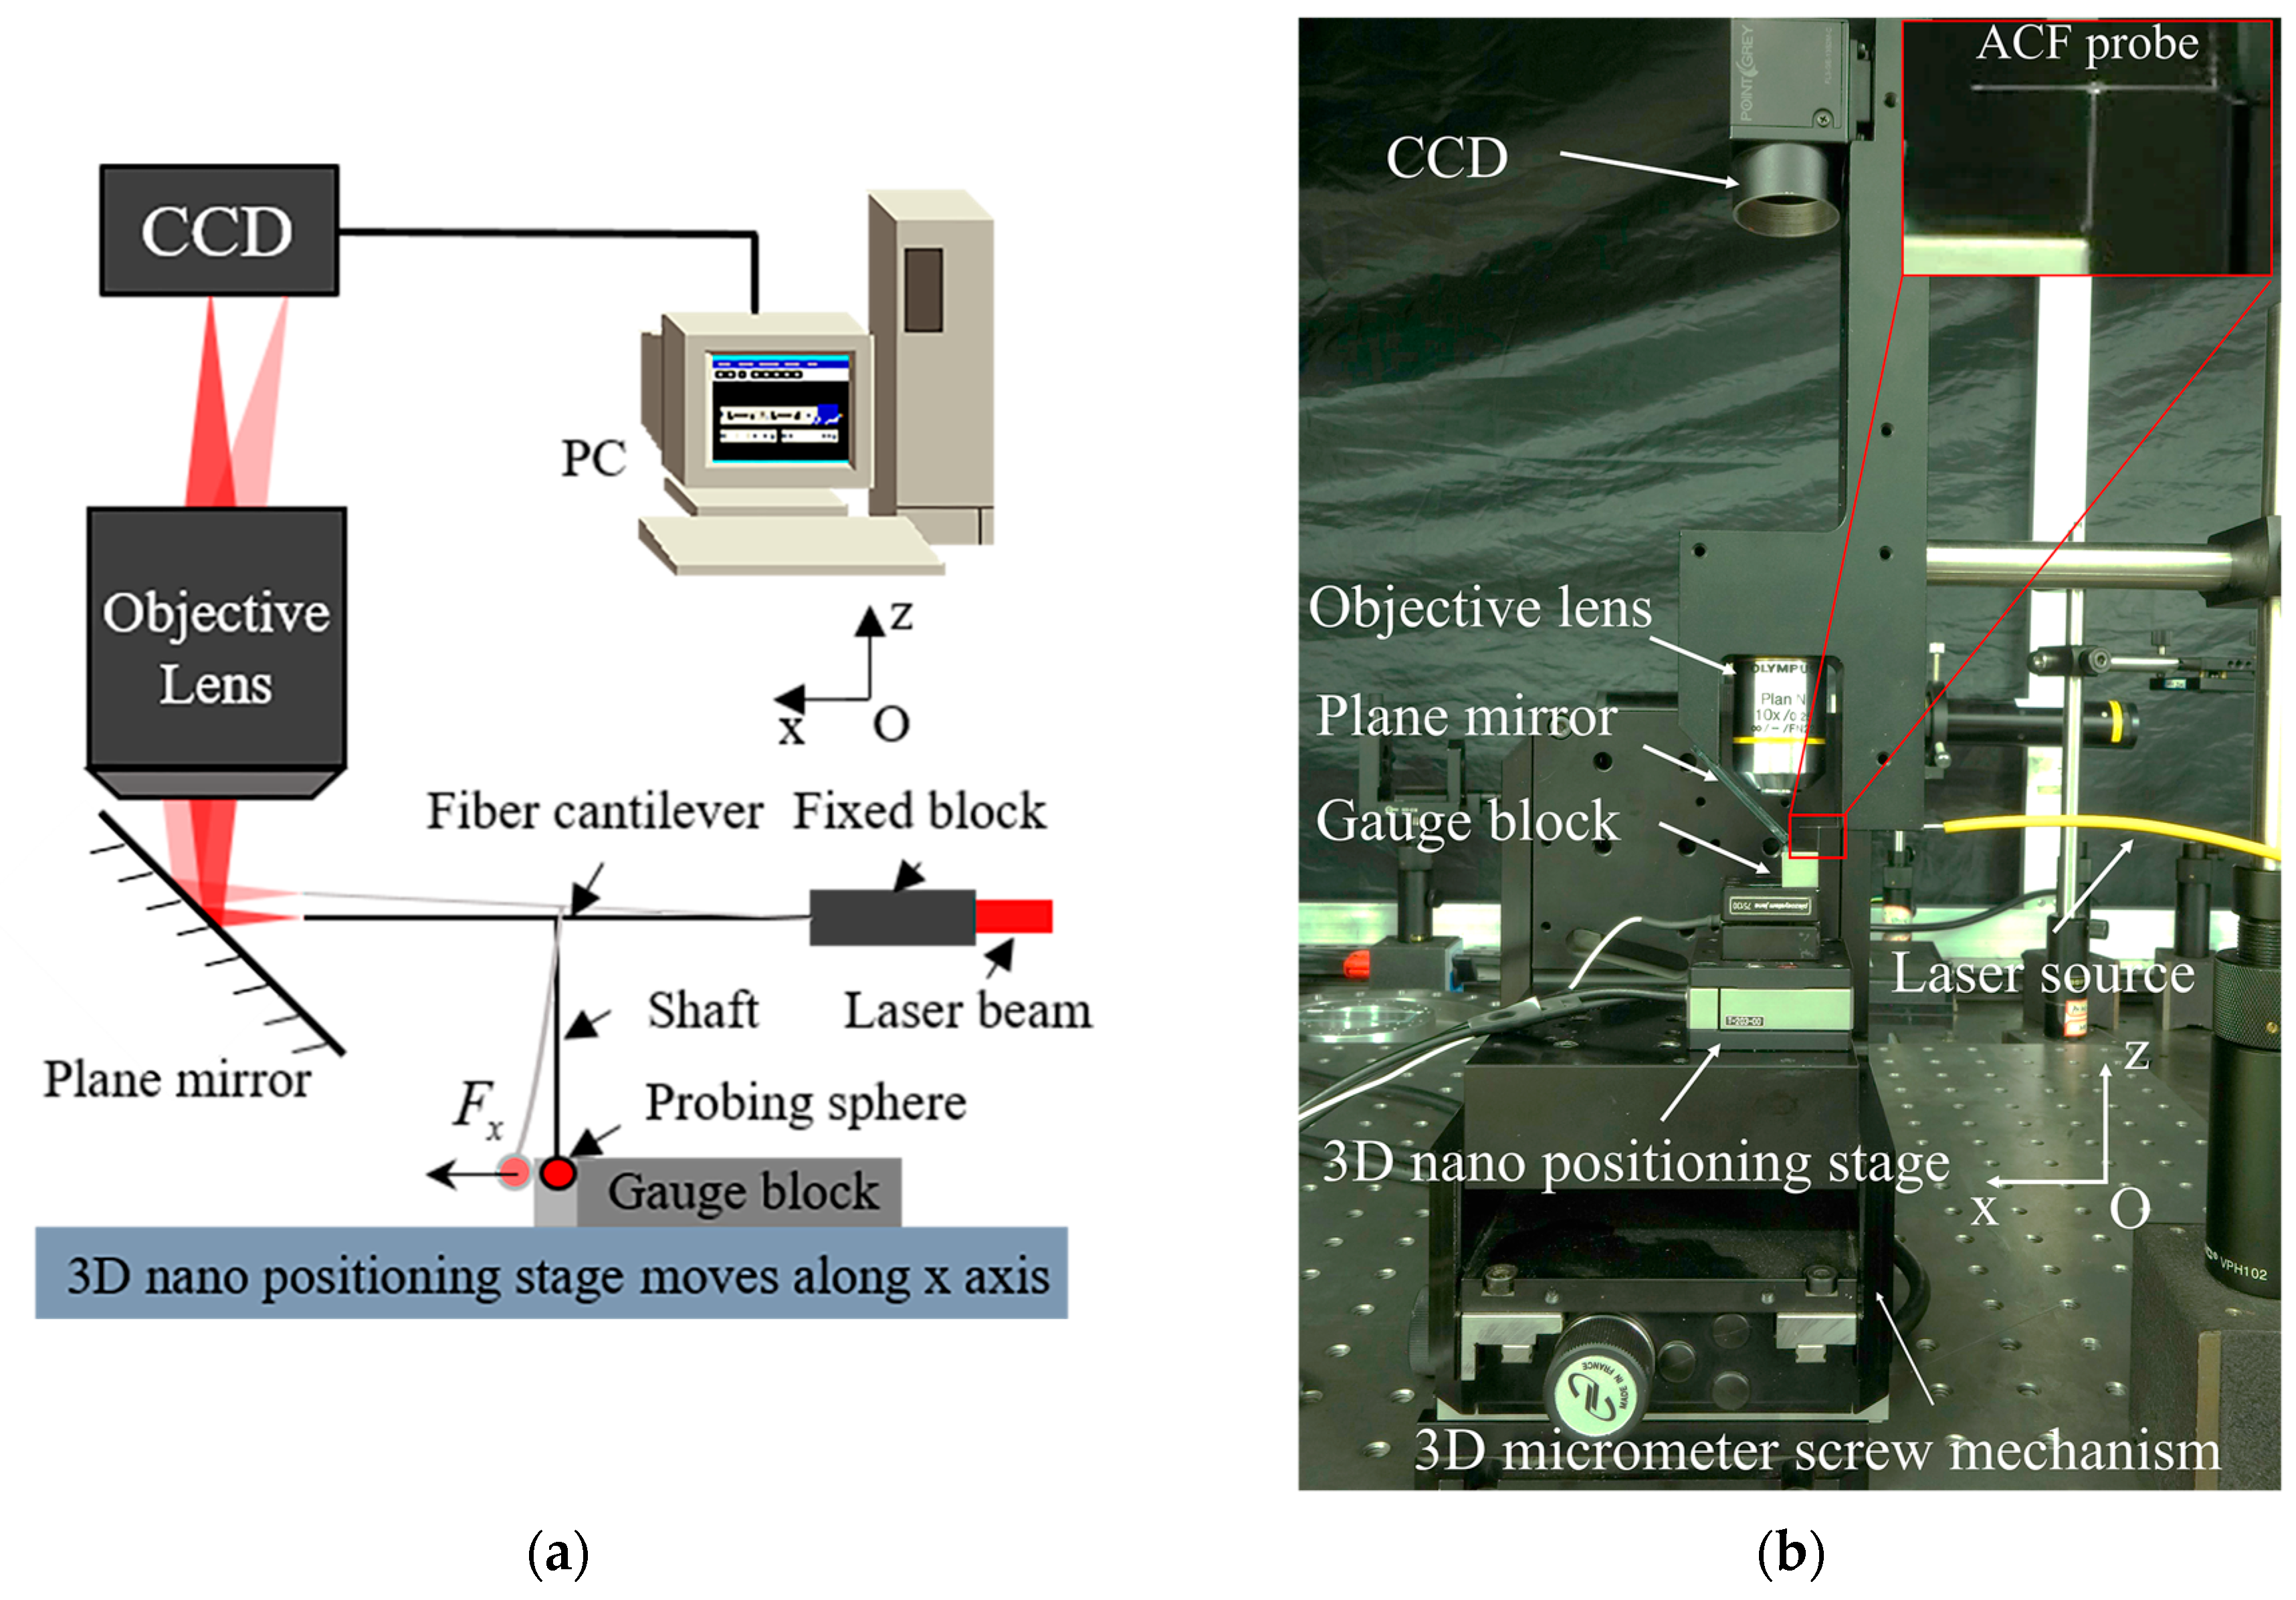
4.2. Experimental Setup
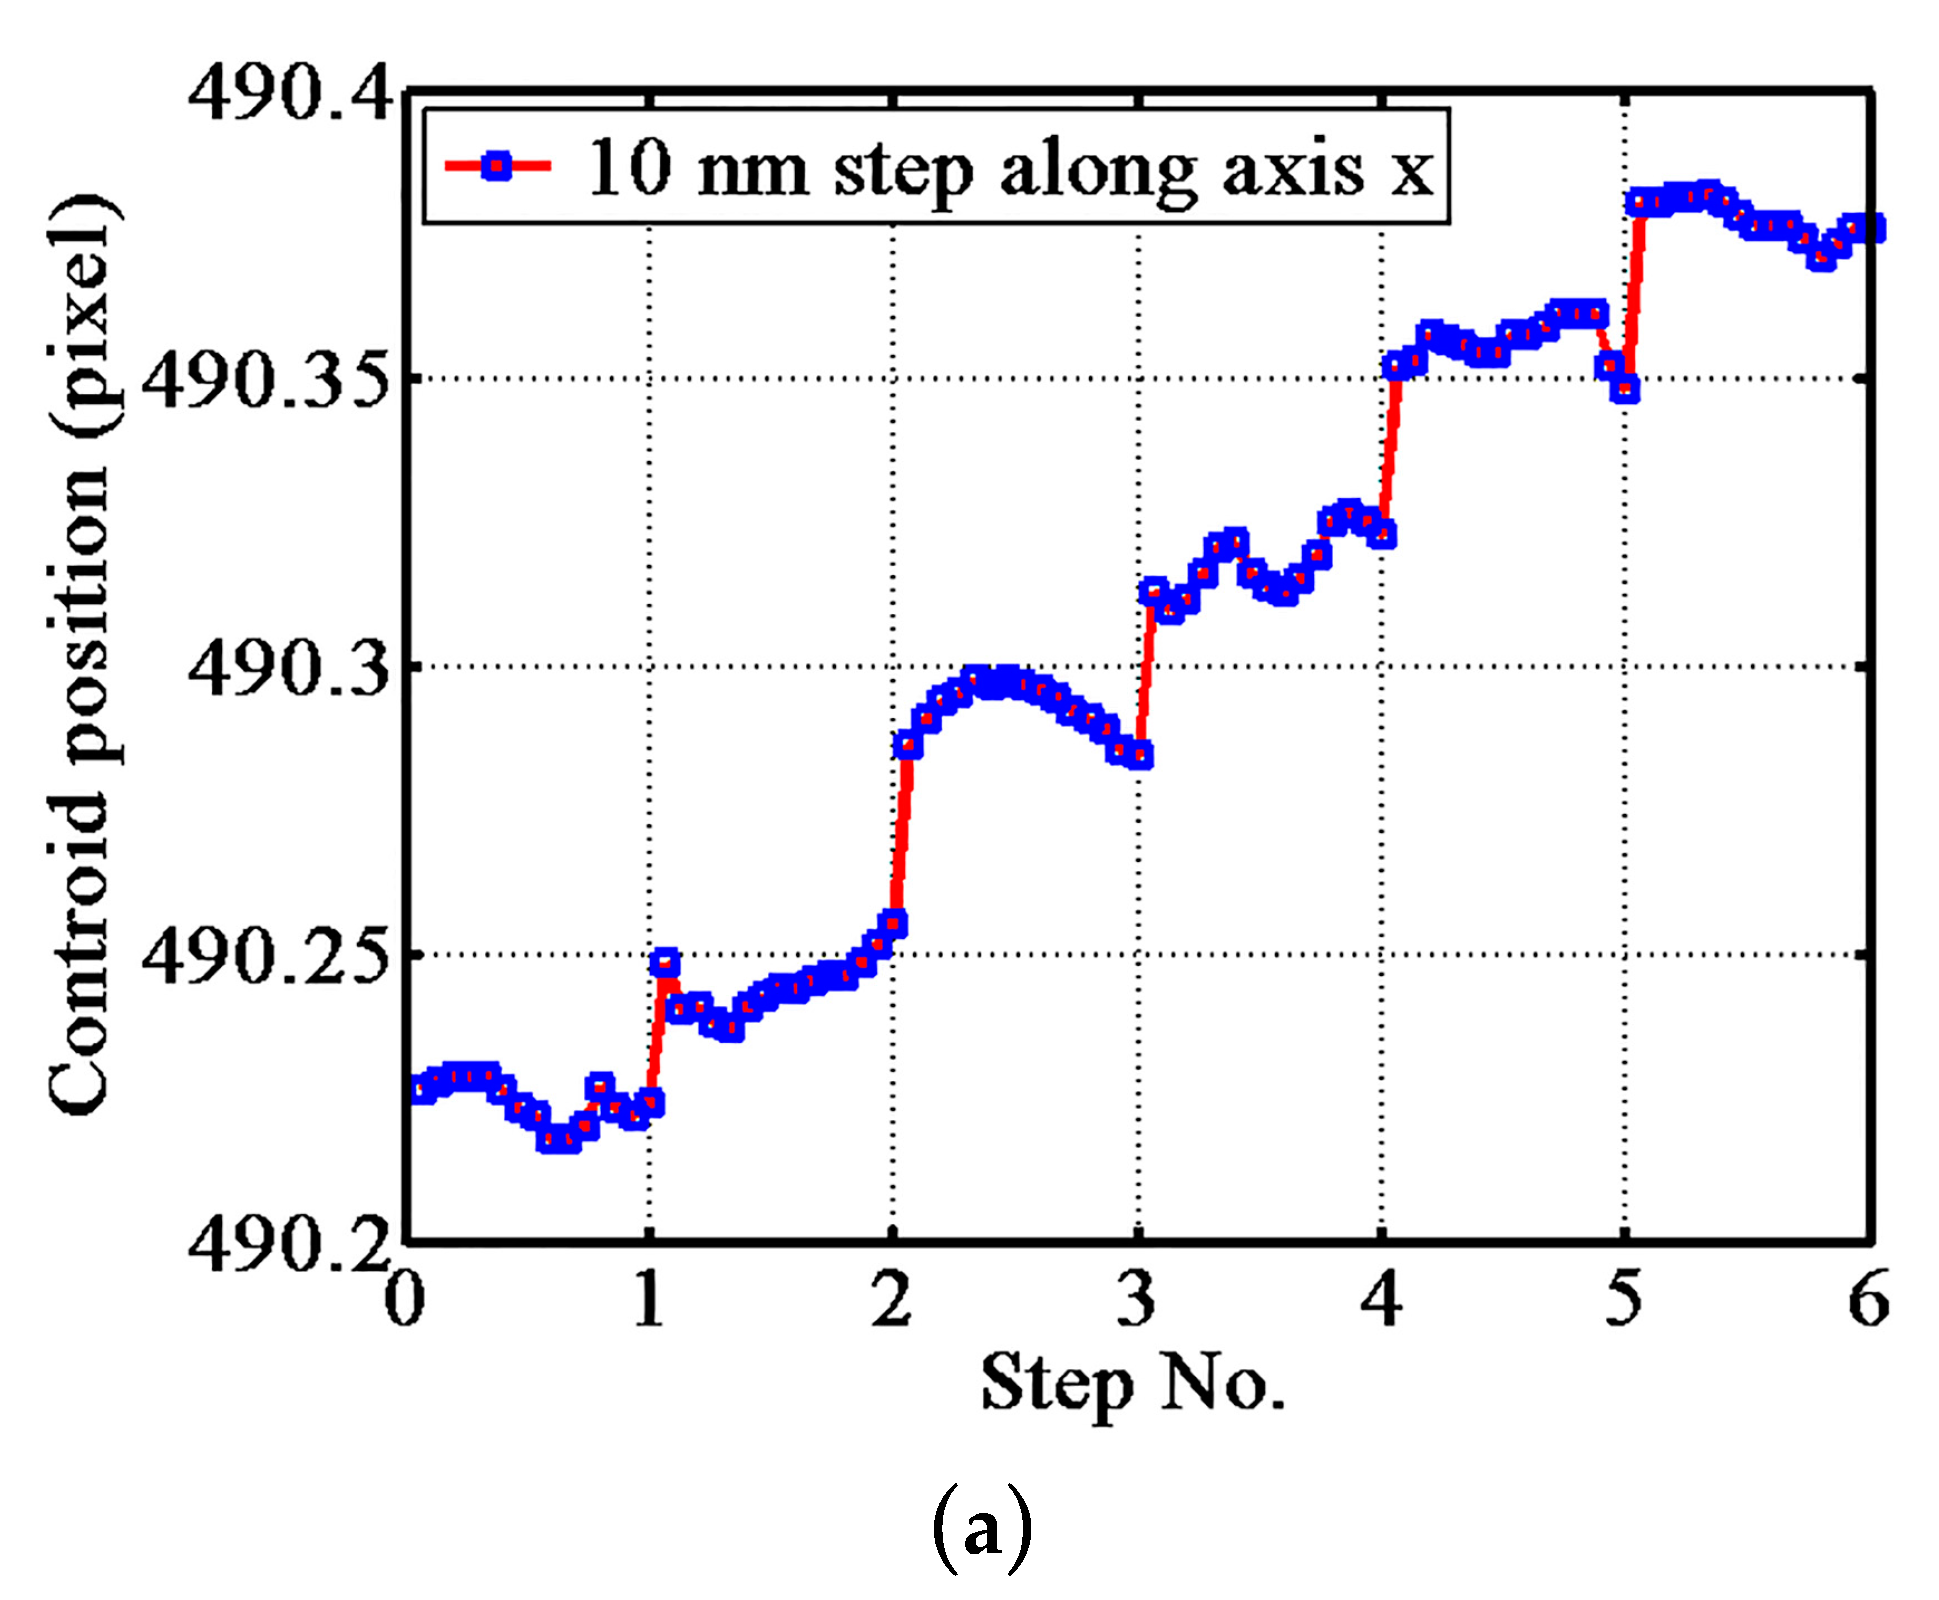
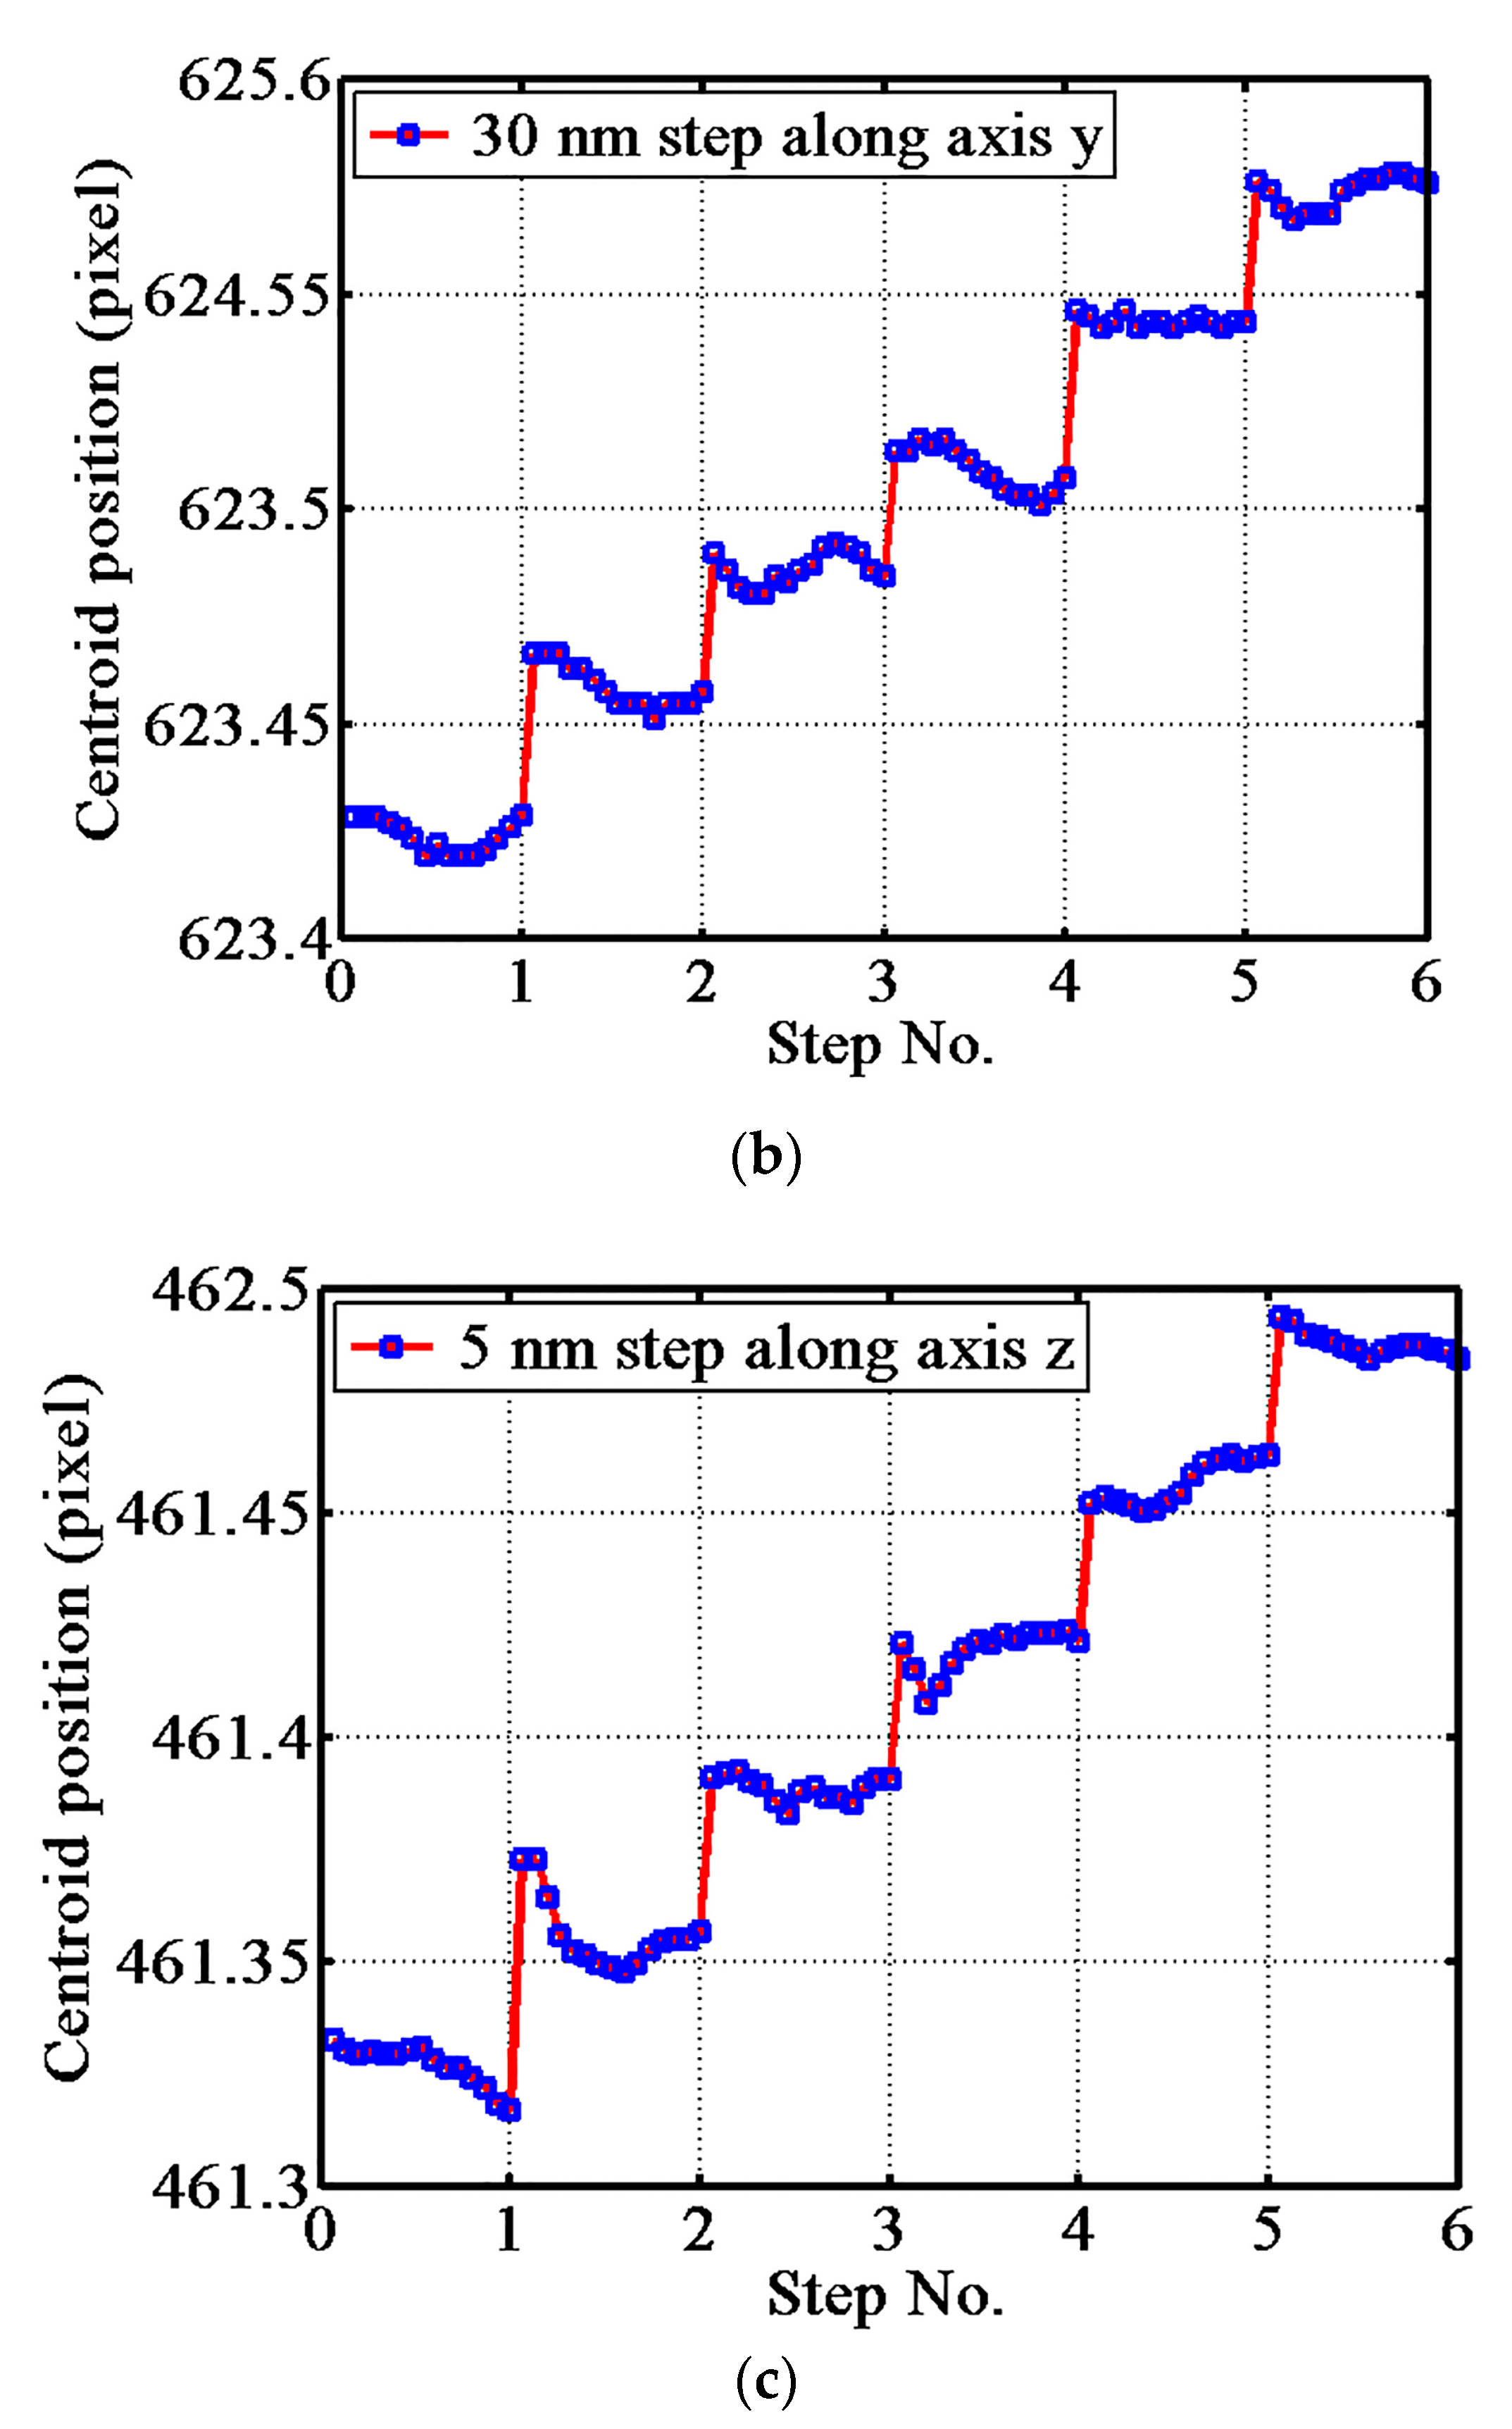
4.3. Probe Performance Experiment
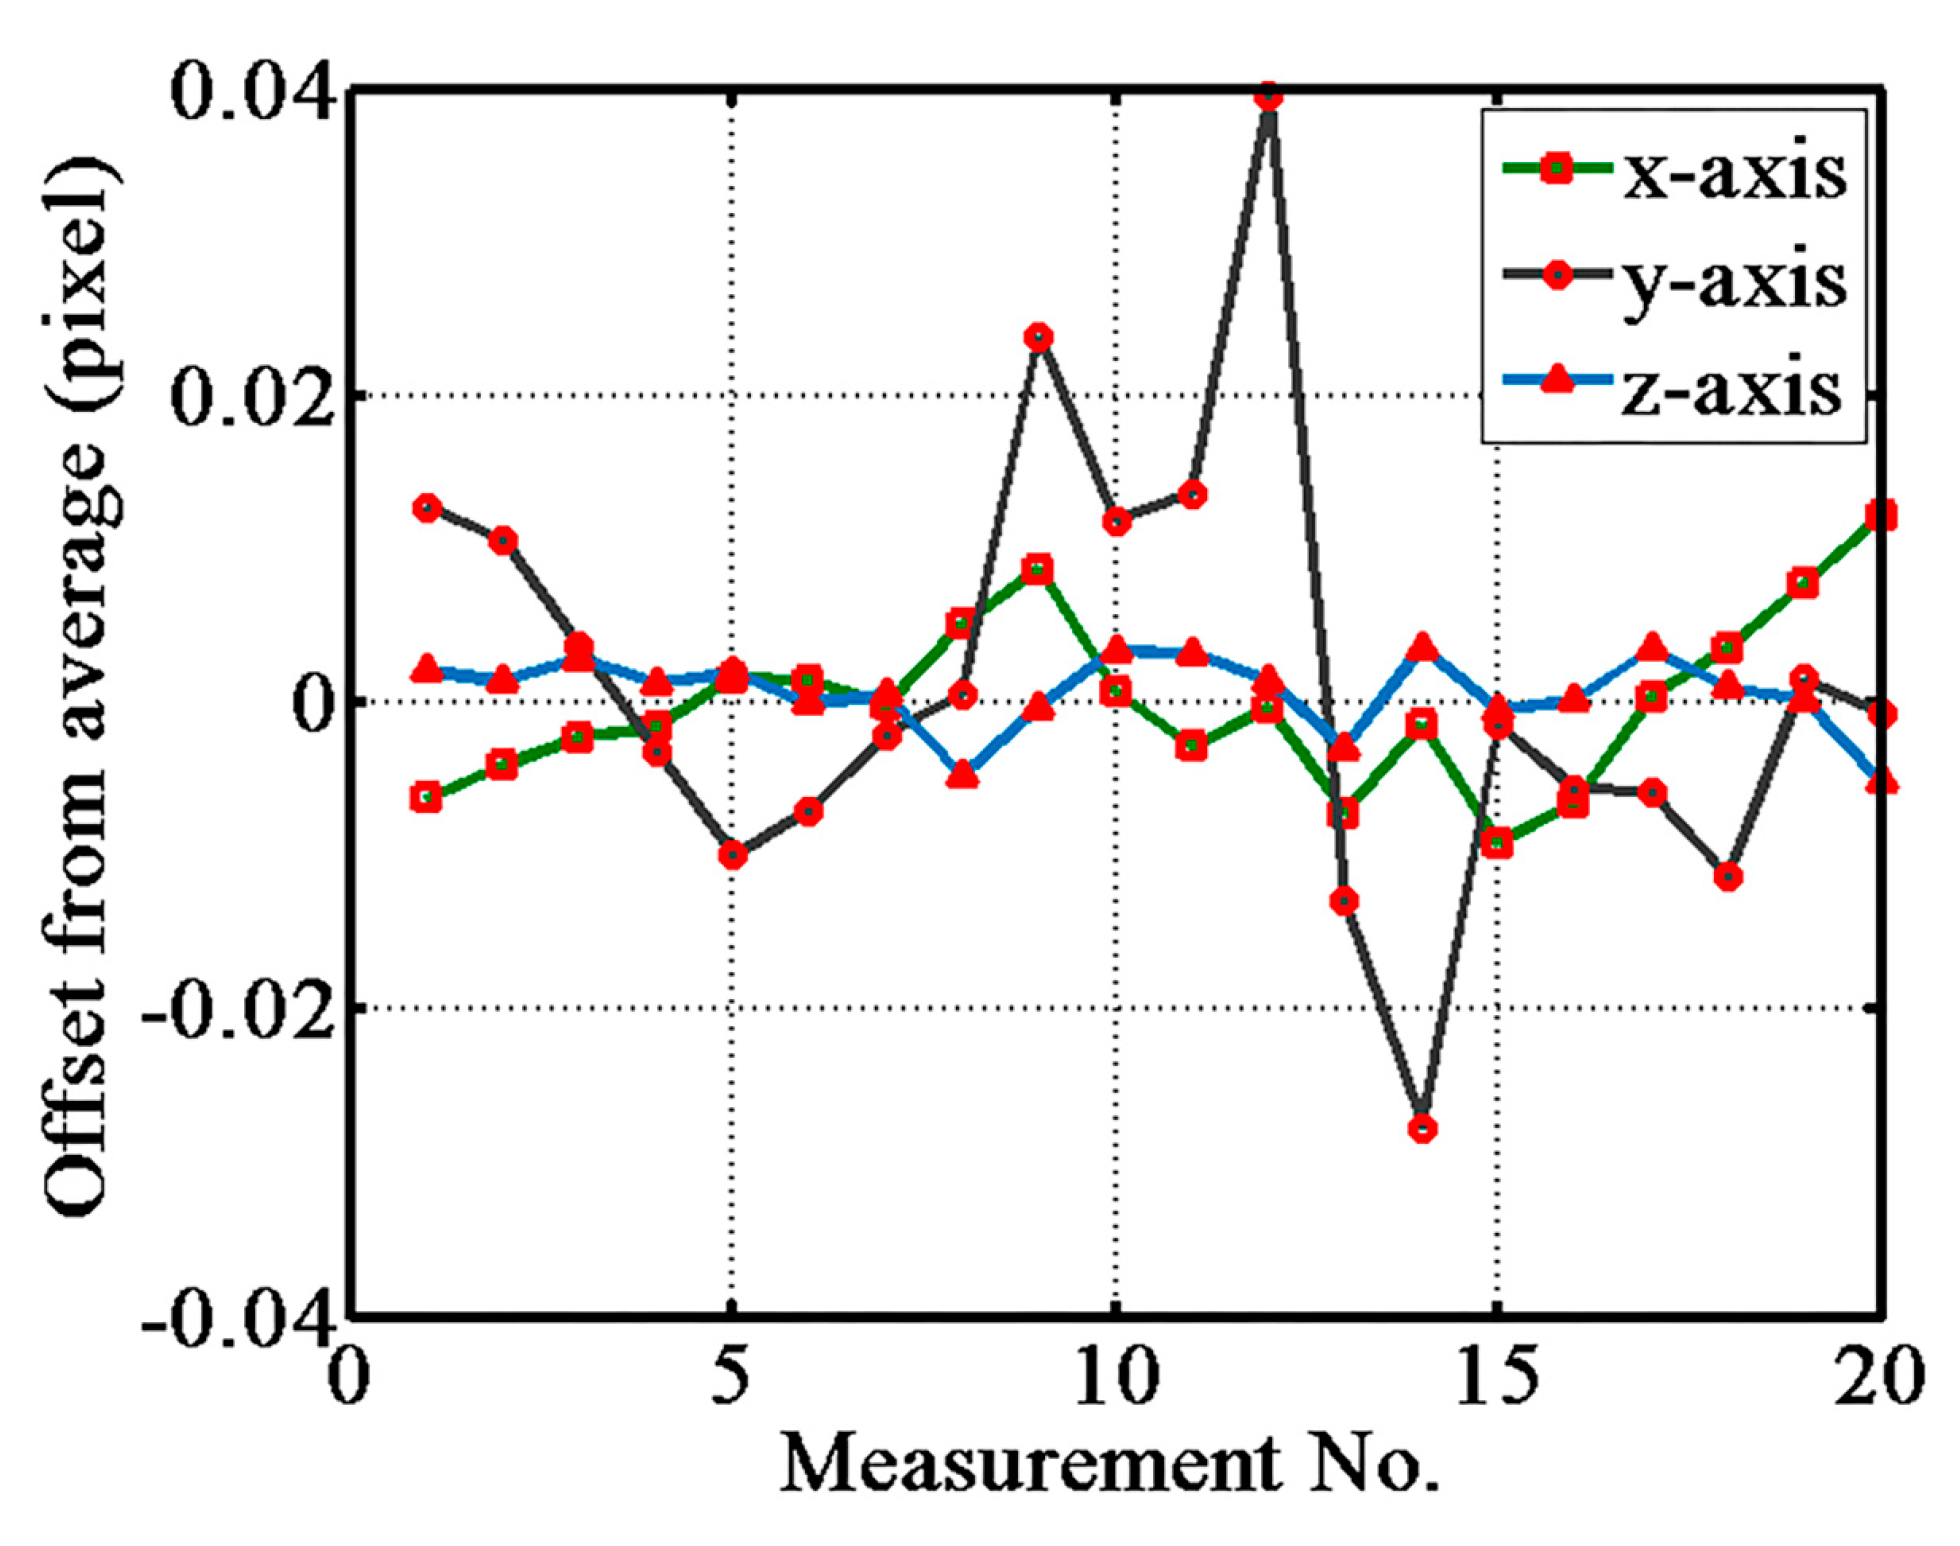
4.4. Calibration Experiments and Uncertainty Analyses
5. Conclusions
Acknowledgments
Author Contributions
Conflicts of Interest
References
- Dai, G.; Pohlenz, F.; Xu, M.; Koenders, L.; Danzebrink, H.U.; Wilkening, G. Accurate and traceable measurement of nano- and microstructures. Meas. Sci. Technol. 2006, 17, 545–552. [Google Scholar] [CrossRef]
- Weckenmann, A.; Peggs, G.; Hoffmann, J. Probing systems for dimensional micro- and nano-metrology. Meas. Sci. Technol. 2006, 17, 504–509. [Google Scholar] [CrossRef]
- Thalmann, R.; Meli, F.; Küng, A. State of the art of tactile micro coordinate metrology. Appl. Sci. 2016, 6, 150. [Google Scholar] [CrossRef]
- Manske, E.; Jäger, G.; Hausotte, T.; Füßl, R. Recent developments and challenges of nanopositioning and nanomeasuring technology. Meas. Sci. Technol. 2012, 23, 074001. [Google Scholar] [CrossRef]
- Weckenmann, A.; Estler, T.; Peggs, G.; Mcmurtry, D. Probing systems in dimensional metrology. CIRP Ann. 2004, 53, 657–684. [Google Scholar] [CrossRef]
- Bos, E.J.C. Aspects of tactile probing on the micro scale. Precis. Eng. 2011, 35, 228–240. [Google Scholar] [CrossRef]
- Peggs, G.N.; Lewis, A.J.; Oldfield, S. Design for a compact high-accuracy CMM. CIRP Ann. 1999, 48, 417–420. [Google Scholar] [CrossRef]
- Dai, G.; Bütefisch, S.; Pohlenz, F.; Danzebrink, H.U. A high precision micro/nano CMM using piezoresistive tactile probes. Meas. Sci. Technol. 2009, 20, 084001. [Google Scholar] [CrossRef]
- Wu, J.; Lei, L.; Chen, X.; Cai, X.; Li, Y.; Han, T. A Three-Dimensional Microdisplacement Sensing System Based on MEMS Bulk-Silicon Technology. Sensors 2014, 14, 20533–20542. [Google Scholar] [CrossRef] [PubMed]
- He, M.; Liu, R.; Li, Y.; Wang, H.; Lu, X.; Ding, G.; Wu, J.; Zhang, T.; Zhao, X. Tactile probing system based on micro-fabricated capacitive sensor. Sens. Actuator A Phys. 2013, 194, 128–134. [Google Scholar] [CrossRef]
- Küng, A.; Meli, F.; Thalmann, R. Ultraprecision micro-CMM using a low force 3D touch probe. Meas. Sci. Technol. 2007, 18, 319–327. [Google Scholar] [CrossRef]
- Meli, F.; Fracheboud, M.; Bottinelli, S.; Bieri, M.; Thalmann, R.; Breguet, J.M.; Clavel, R. High precision, low force 3D touch probe for measurements on small objects. In Proceedings of the EUSPEN International Topical Conference, Aachen, Germany, 19–20 May 2003. [Google Scholar]
- Alblalaihid, K.; Kinnell, P.; Lawes, S.; Desgaches, D.; Leach, R. Performance Assessment of a New Variable Stiffness Probing System for micro-CMMs. Sensors 2016, 16, 492. [Google Scholar] [CrossRef] [PubMed]
- Claverley, J.D.; Leach, R.K. Development of a three-dimensional vibrating tactile probe for miniature CMMs. Precis. Eng. 2013, 37, 491–499. [Google Scholar] [CrossRef]
- Huang, Q.; Chen, C.; Wu, K.; Zhang, L.; Li, R.; Fan, K.C. A Three-Dimensional Resonant Triggering Probe for Micro-CMM. Appl. Sci. 2017, 7, 403. [Google Scholar] [CrossRef]
- Bauza, M.B.; Hocken, R.J.; Smith, S.T.; Woody, S.C. Development of a virtual probe tip with an application to high aspect ratio microscale features. Rev. Sci. Instrum. 2005, 76. [Google Scholar] [CrossRef]
- Balzer, F.G.; Hausotte, T.; Dorozhovets, N.; Manske, E.; Jäger, G. Tactile 3D microprobe system with exchangeable styli. Meas. Sci. Technol. 2011, 22, 094018. [Google Scholar] [CrossRef]
- Li, R.J.; Fan, K.C.; Huang, Q.X.; Zhou, H.; Gong, E.M.; Xing, M. A long-stroke 3D contact scanning probe for micro/nano coordinate measuring machine. Precis. Eng. 2015, 43, 220–229. [Google Scholar] [CrossRef]
- Li, R.J.; Xiang, M.; He, Y.X.; Fan, K.C.; Cheng, Z.Y.; Huang, Q.X.; Zhou, B. Development of a high-precision touch-trigger probe using a single sensor. Appl. Sci. 2016, 6, 86. [Google Scholar] [CrossRef]
- Dai, G.; Wolff, H.; Pohlenz, F.; Danzebrink, H.U.; Wilkening, G. Atomic force probe for sidewall scanning of nano- and microstructures. Appl. Phys. Lett. 2006, 88, 171908. [Google Scholar] [CrossRef]
- Dai, G.; Wolff, H.; Danzebrink, H.U. Atomic force microscope cantilever based microcoordinate measuring probe for true three-dimensional measurements of microstructures. Appl. Phys. Lett. 2007, 91, 121912. [Google Scholar] [CrossRef]
- Petz, M.; Tutsch, R.; Christoph, R.; Andraes, M.; Hopp, B. Tactile–optical probes for three-dimensional microparts. Measurement 2012, 45, 2288–2298. [Google Scholar] [CrossRef]
- Schwenke, H.; Wäldele, F.; Weiskirch, C.; Kunzmann, H. Opto-tactile sensor for 2D and 3D measurement of small structures on coordinate measuring machines. CIRP Ann. 2001, 50, 361–364. [Google Scholar] [CrossRef]
- Cui, J.; Li, L.; Tan, J. Optical fiber probe based on spherical coupling of light energy for inner-dimension measurement of microstructures with high aspect ratios. Opt. Lett. 2011, 36, 4689–4691. [Google Scholar] [CrossRef] [PubMed]
- Feng, K.; Cui, J.; Zhao, S.; Li, J.; Tan, J. A twin FBG probe and integration with a microhole-measuring machine for the measurement of microholes of high aspect ratios. IEEE/ASME Trans. Mechatron. 2016, 21, 1242–1251. [Google Scholar] [CrossRef]
- Muralikrishnan, B.; Stone, J.A.; Stoup, J.R. Fiber deflection probe for small hole metrology. Precis. Eng. 2006, 30, 154–164. [Google Scholar] [CrossRef]
- Tan, J.; Wang, F.; Cui, J. Fiber deflection probing method based on micro focal-length collimation. Opt. Express 2010, 18, 2925–2933. [Google Scholar] [CrossRef] [PubMed]
- Cui, J.; Li, J.; Feng, K.; Tan, J. Three-dimensional fiber probe based on orthogonal micro focal-length collimation for the measurement of micro parts. Opt. Express 2015, 23, 26386–26398. [Google Scholar] [CrossRef] [PubMed]
- Cui, J.; Li, J.; Feng, K.; Tan, J.; Zhang, J. A 3D fiber probe based on orthogonal micro focal-length collimation and fiber Bragg grating. Meas. Sci. Technol. 2016, 27, 074005. [Google Scholar] [CrossRef]
- Chen, Y.L.; Ito, S.; Kikuchi, H.; Kobayashi, R.; Shimizu, Y.; Gao, W. On-line qualification of a micro probing system for precision length measurement of micro-features on precision parts. Meas. Sci. Technol. 2016, 27, 074008. [Google Scholar] [CrossRef]


| Parameter | Value |
|---|---|
| Young’s modulus of the optical fiber (Gpa) | 80 |
| Diameter of the optical fiber (μm) | 125 |
| (mm) | 4 |
| (mm) | 2 |
| (mm) | 2 |
| Diameter of the probing sphere (μm) | 150 |
| Contact force (μN) | 20 |
| Poisson ratio of the fiber | 0.16 |
| Theoretical transfer coefficient (∆Dz/∆dx) | 0.1875 |
| Theoretical transfer coefficient (∆Dy/∆dy) | 0.4562 |
| Theoretical transfer coefficient (∆Dz/∆dz) | 2.500 |
© 2017 by the authors. Licensee MDPI, Basel, Switzerland. This article is an open access article distributed under the terms and conditions of the Creative Commons Attribution (CC BY) license (http://creativecommons.org/licenses/by/4.0/).
Share and Cite
Zou, L.; Ni, H.; Zhang, P.; Ding, X. Assembled Cantilever Fiber Touch Trigger Probe for Three-Dimensional Measurement of Microstructures. Sensors 2017, 17, 2652. https://doi.org/10.3390/s17112652
Zou L, Ni H, Zhang P, Ding X. Assembled Cantilever Fiber Touch Trigger Probe for Three-Dimensional Measurement of Microstructures. Sensors. 2017; 17(11):2652. https://doi.org/10.3390/s17112652
Chicago/Turabian StyleZou, Limin, He Ni, Peng Zhang, and Xuemei Ding. 2017. "Assembled Cantilever Fiber Touch Trigger Probe for Three-Dimensional Measurement of Microstructures" Sensors 17, no. 11: 2652. https://doi.org/10.3390/s17112652
APA StyleZou, L., Ni, H., Zhang, P., & Ding, X. (2017). Assembled Cantilever Fiber Touch Trigger Probe for Three-Dimensional Measurement of Microstructures. Sensors, 17(11), 2652. https://doi.org/10.3390/s17112652