Time Series UAV Image-Based Point Clouds for Landslide Progression Evaluation Applications

 ,
,  ,
, 

Abstract
:
1. Introduction
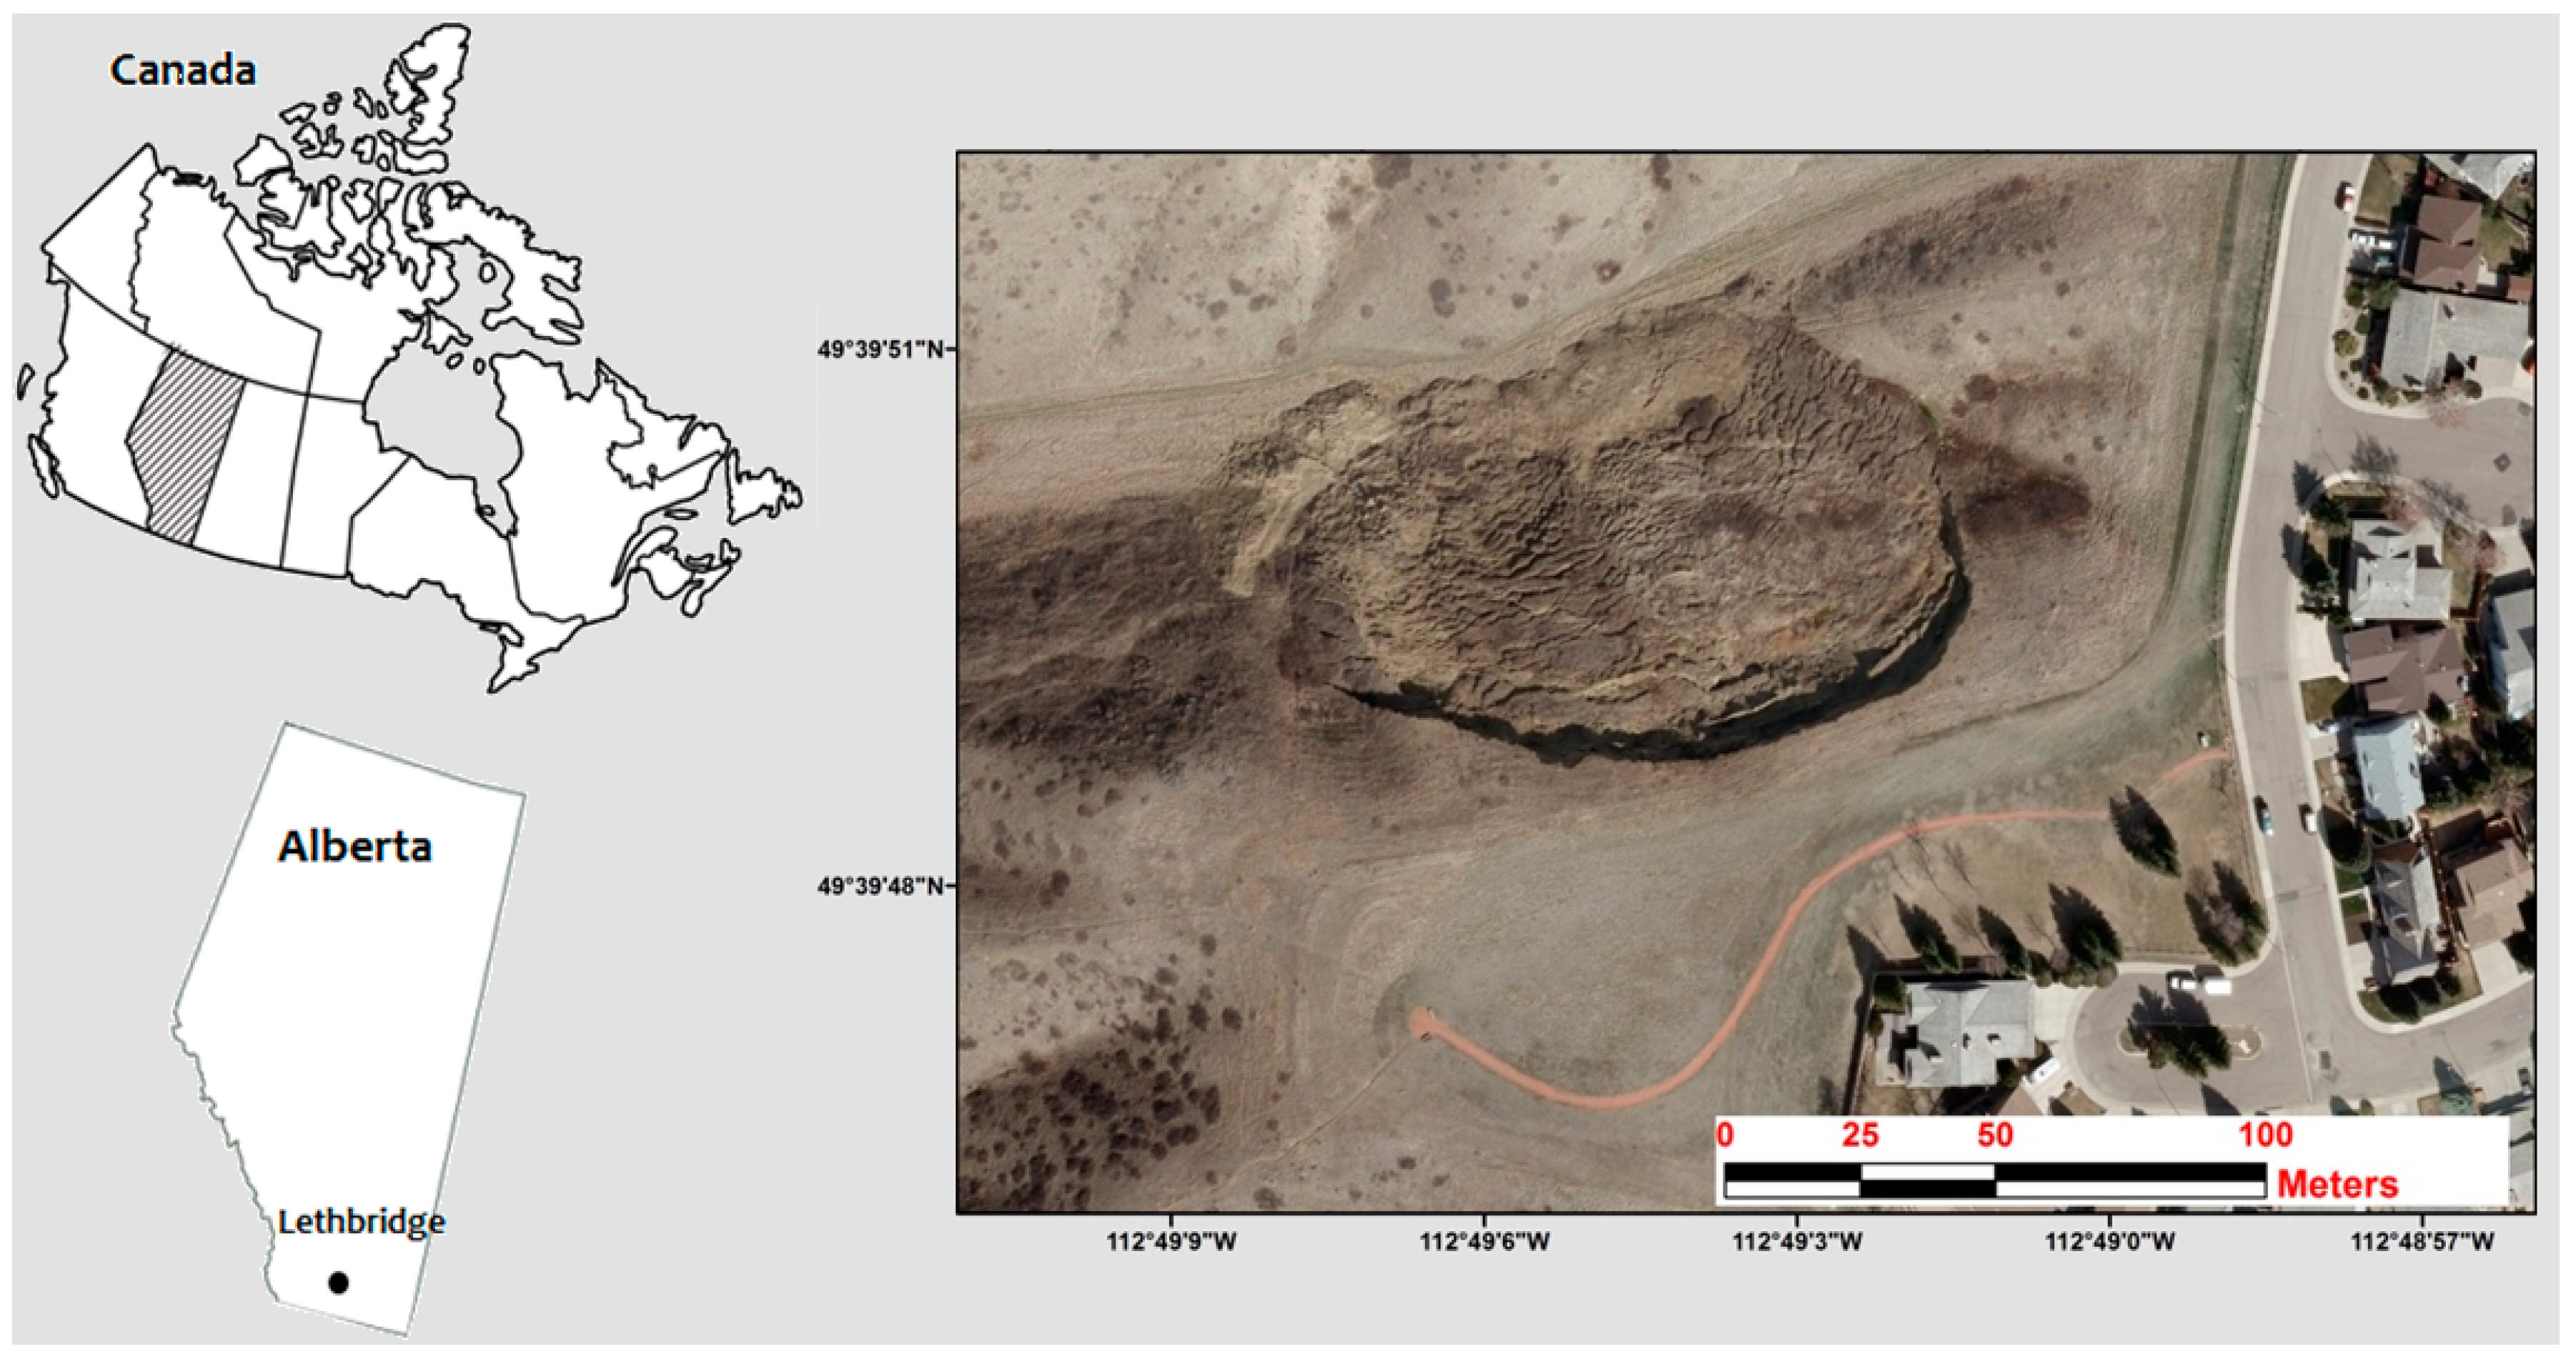
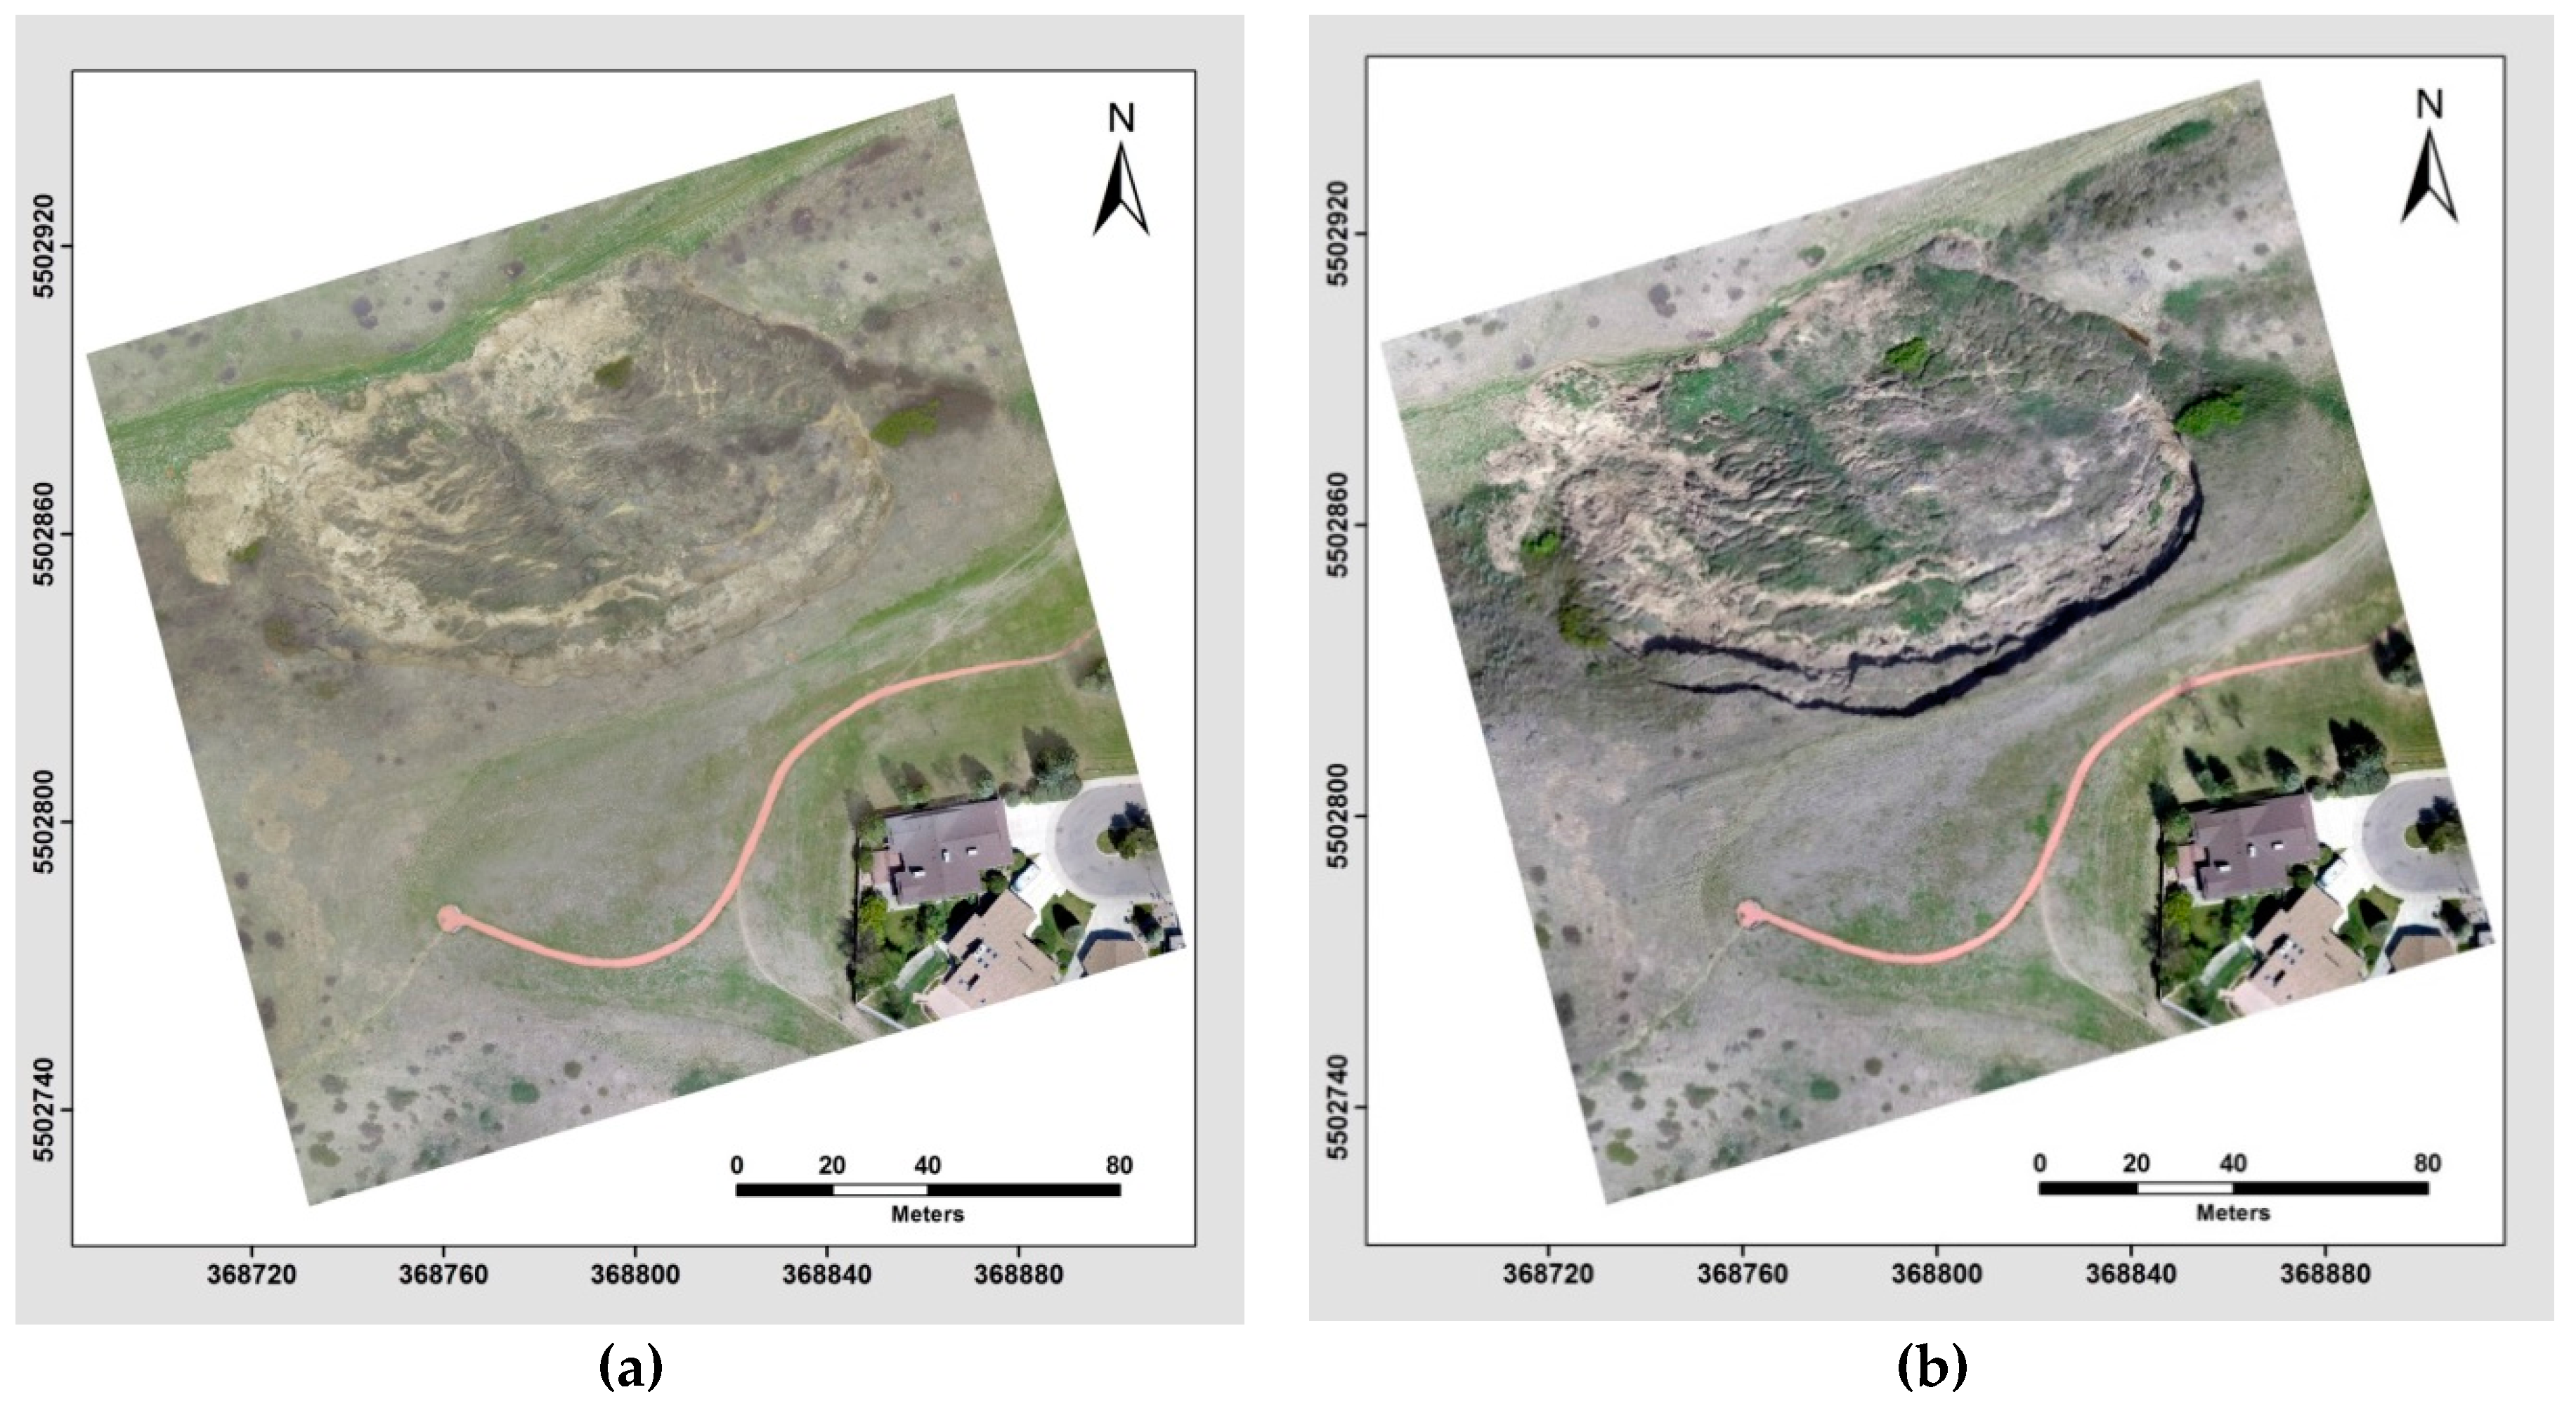
2. Study Area
3. Methodology
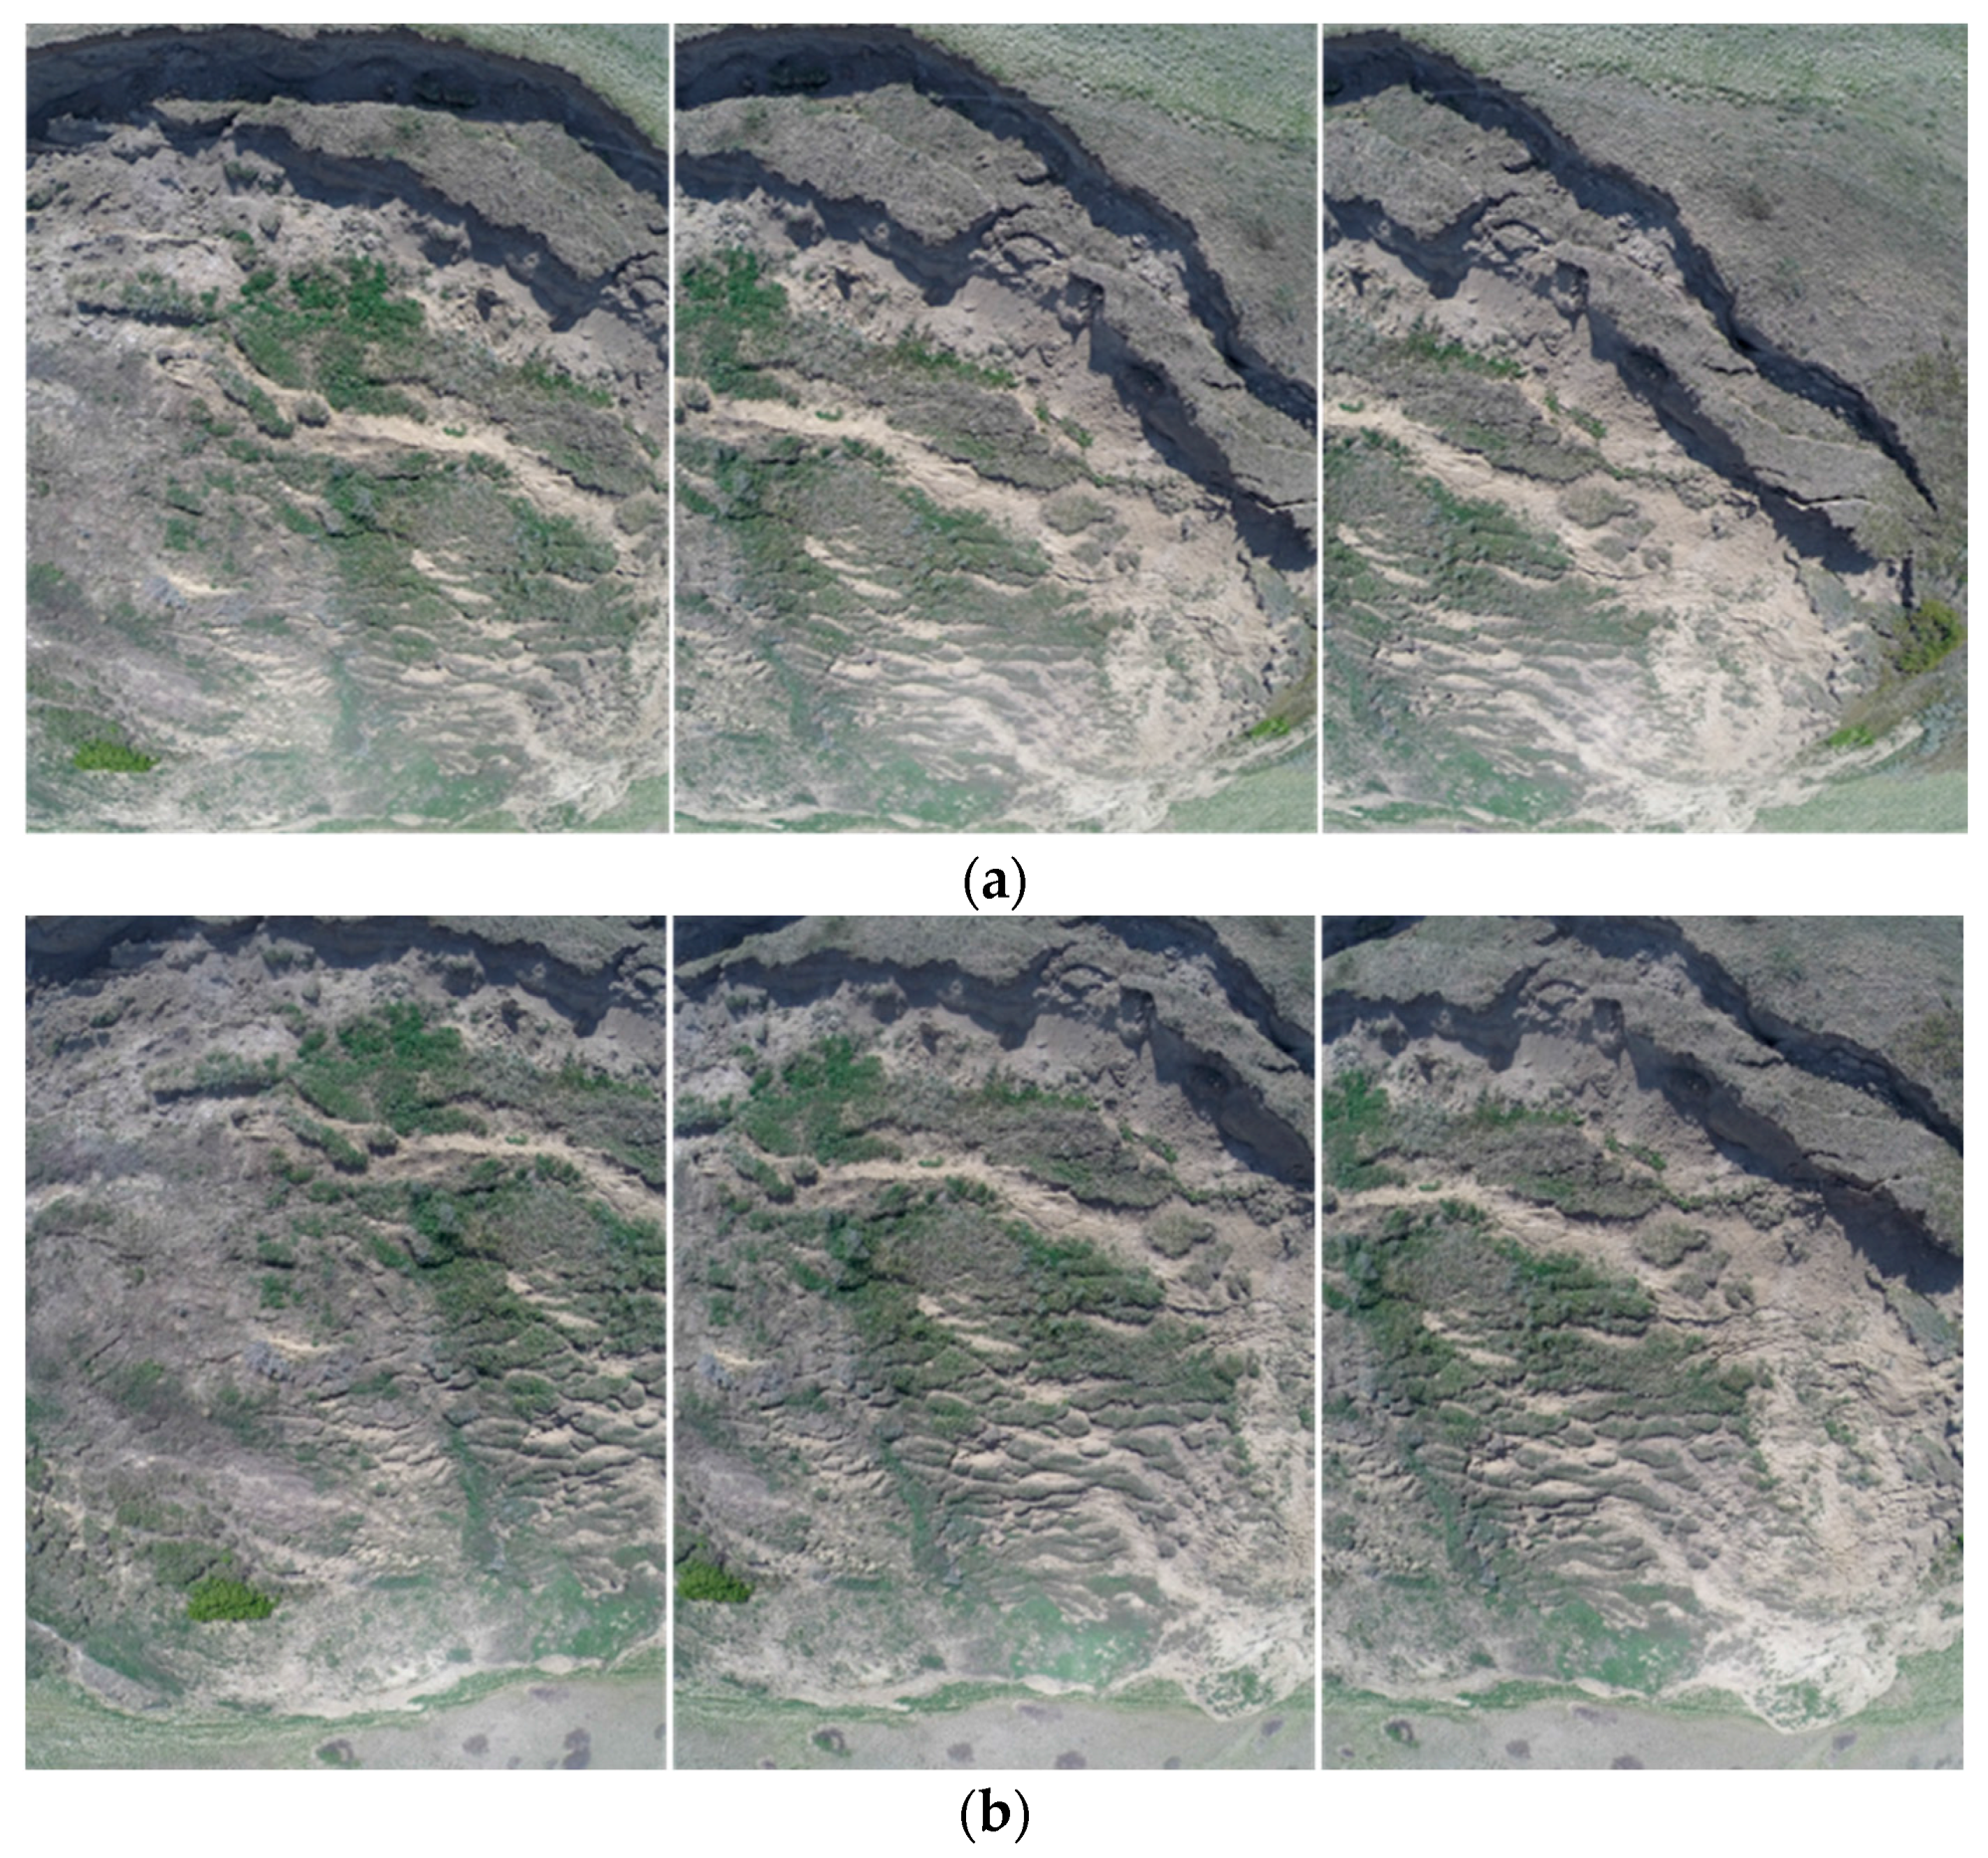
3.1. Mission Planning and Data Collection
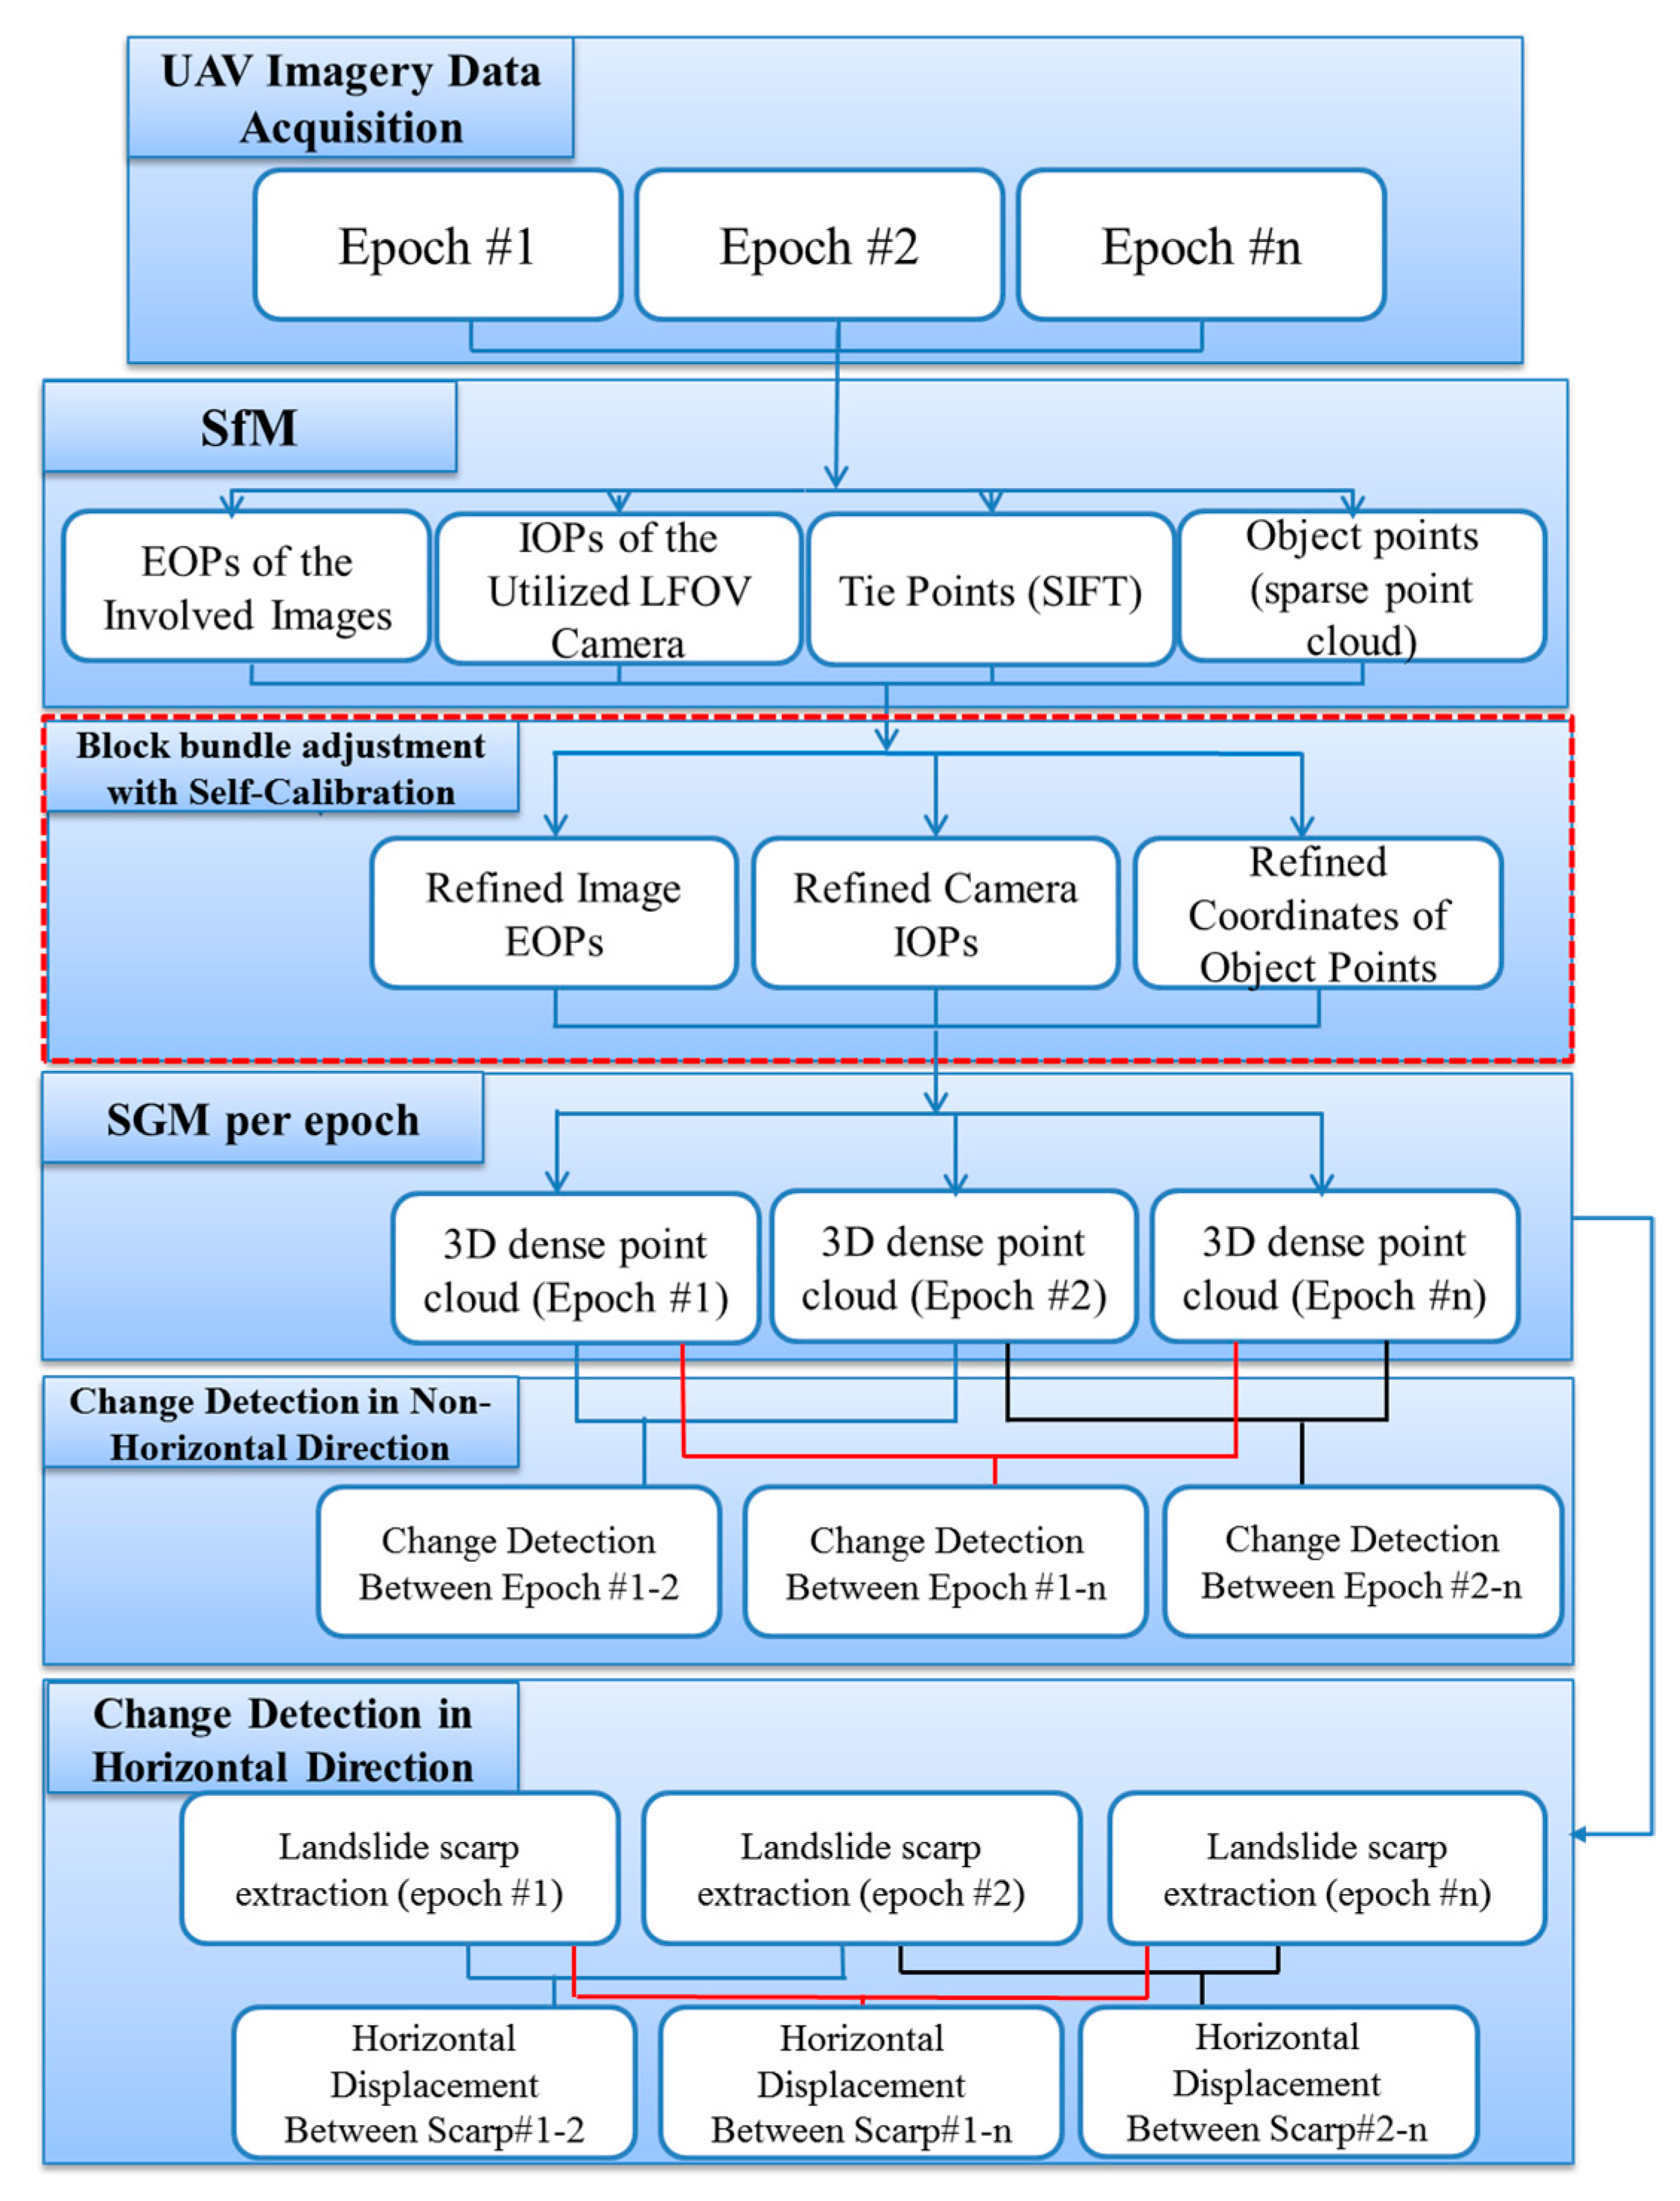
3.2. A Novel Automatic UAV Image-Based Registration
- In the first step, the relative orientation parameters (ROPs) related to the stereo images from both epochs are derived using the coplanarity equations, where the closed-form Nistér five-point approach is used for the approximate values [36]. In this study, these conjugate point features are automatically identified through a SIFT detector and descriptor [37]. The ROP are estimated by choosing an arbitrary local coordinate system (i.e., arbitrarily fixing the position and orientation of one of the images in the block and the base distance to a neighboring image station). Thus, the ROPs are established using an arbitrary defined datum where the origin and orientation are established by the fixed image and the scale is established through the set base.
- Once the ROPs of all possible stereo-pairs are estimated, an incremental approach developed by He and Habib [35] is used for the initial recovery of the images EOPs from both epochs. This incremental approach is initiated by defining a local coordinate frame. Then, all the images are sequentially augmented into a final image block or trajectory.
- As the derived sparse point cloud from both epochs using the SfM approach is only defined in an arbitrary local coordinate system, an absolute orientation process must be applied for transforming the derived sparse point cloud as well as the estimated image EOPs relative to the mapping reference frame. In this study, we use GPS measurements which are recorded at each image exposure time by a consumer-grade GPS receiver mounted on the utilized UAV platform. The image positions that are derived from the implemented SfM approach and the absolute orientation process is performed for the estimation of the 3D Helmert transformation parameters (i.e., scale factor, three translation parameters, and three rotation angles) relating the two involved coordinate systems. Although the imagery blocks of both epochs are now registered to the mapping frame coordinate system, it still does not satisfy the required level of accuracy required in this research. Therefore, a global bundle adjustment is performed using manually measured GCPs with ±3 cm accuracy. It should be noted that the GCPs are not required for all epochs, since the imagery from all the epochs are integrated in one block bundle adjustment.
- The fourth step is semi-global dense matching procedure implemented to generate a dense 3D point cloud for each observed epoch using images captured only at that particular epoch. Note that the separate point clouds are now effectively co-registered to a common reference frame as a result of the bundle adjustment procedure.
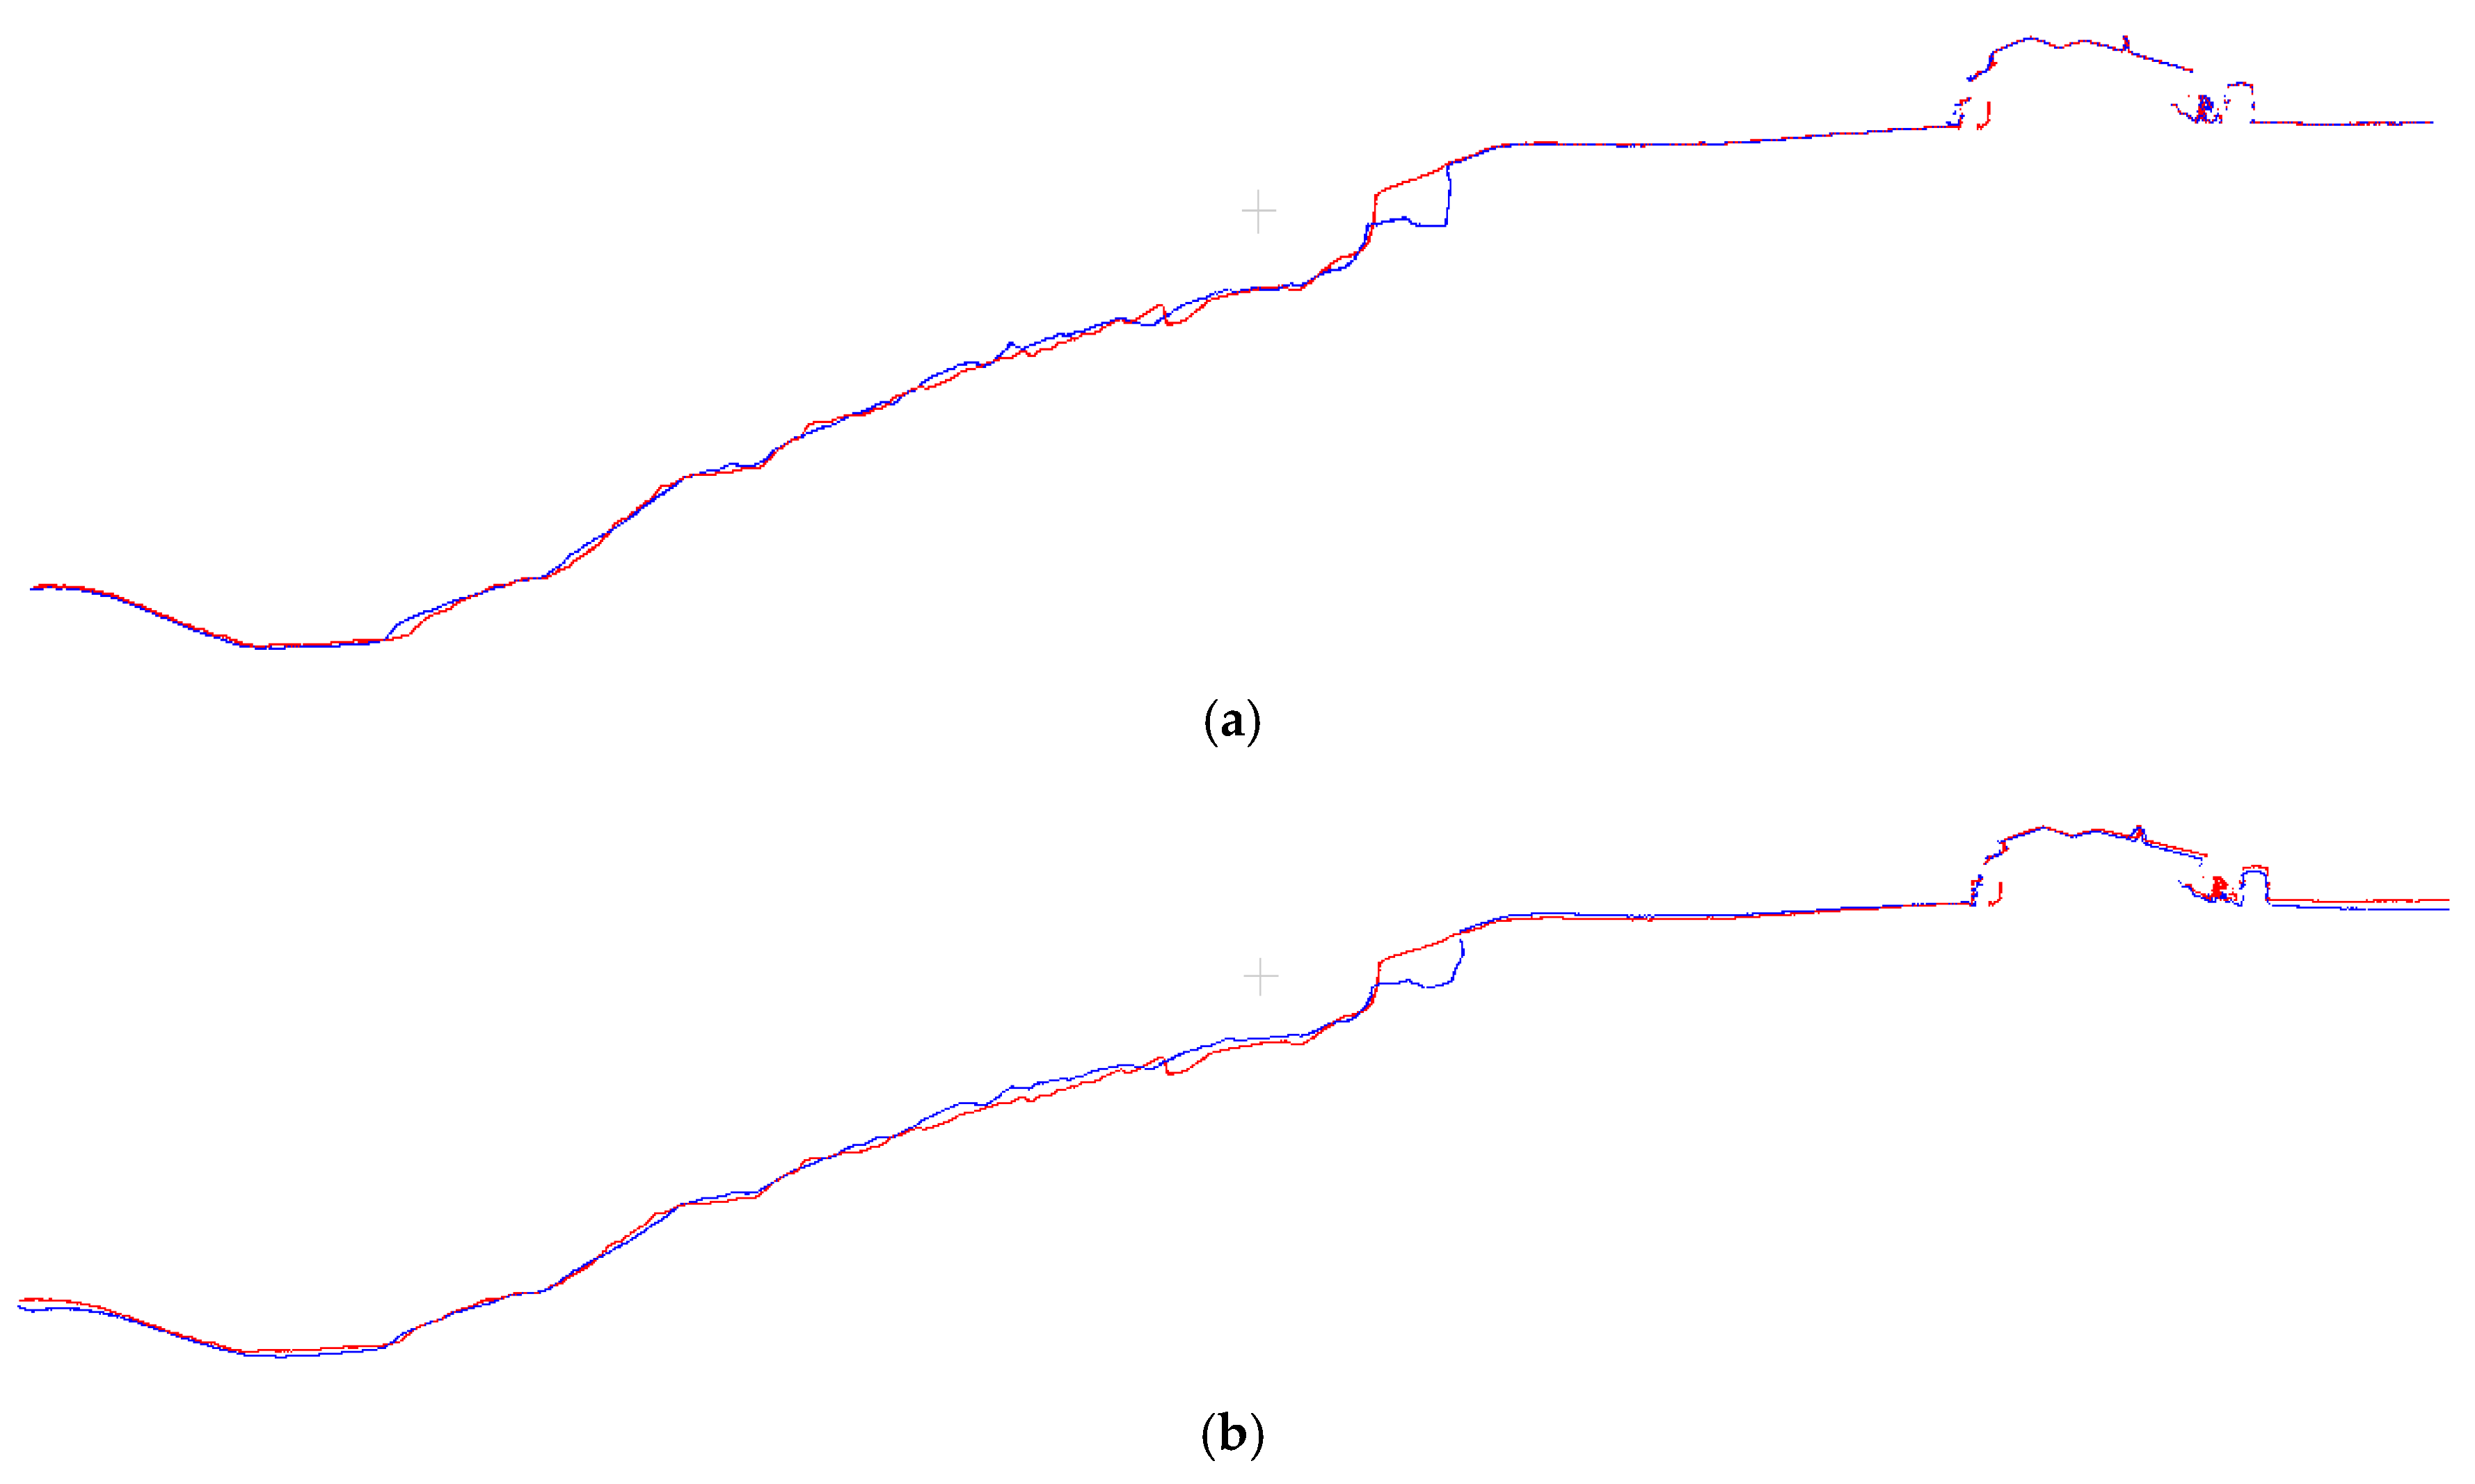
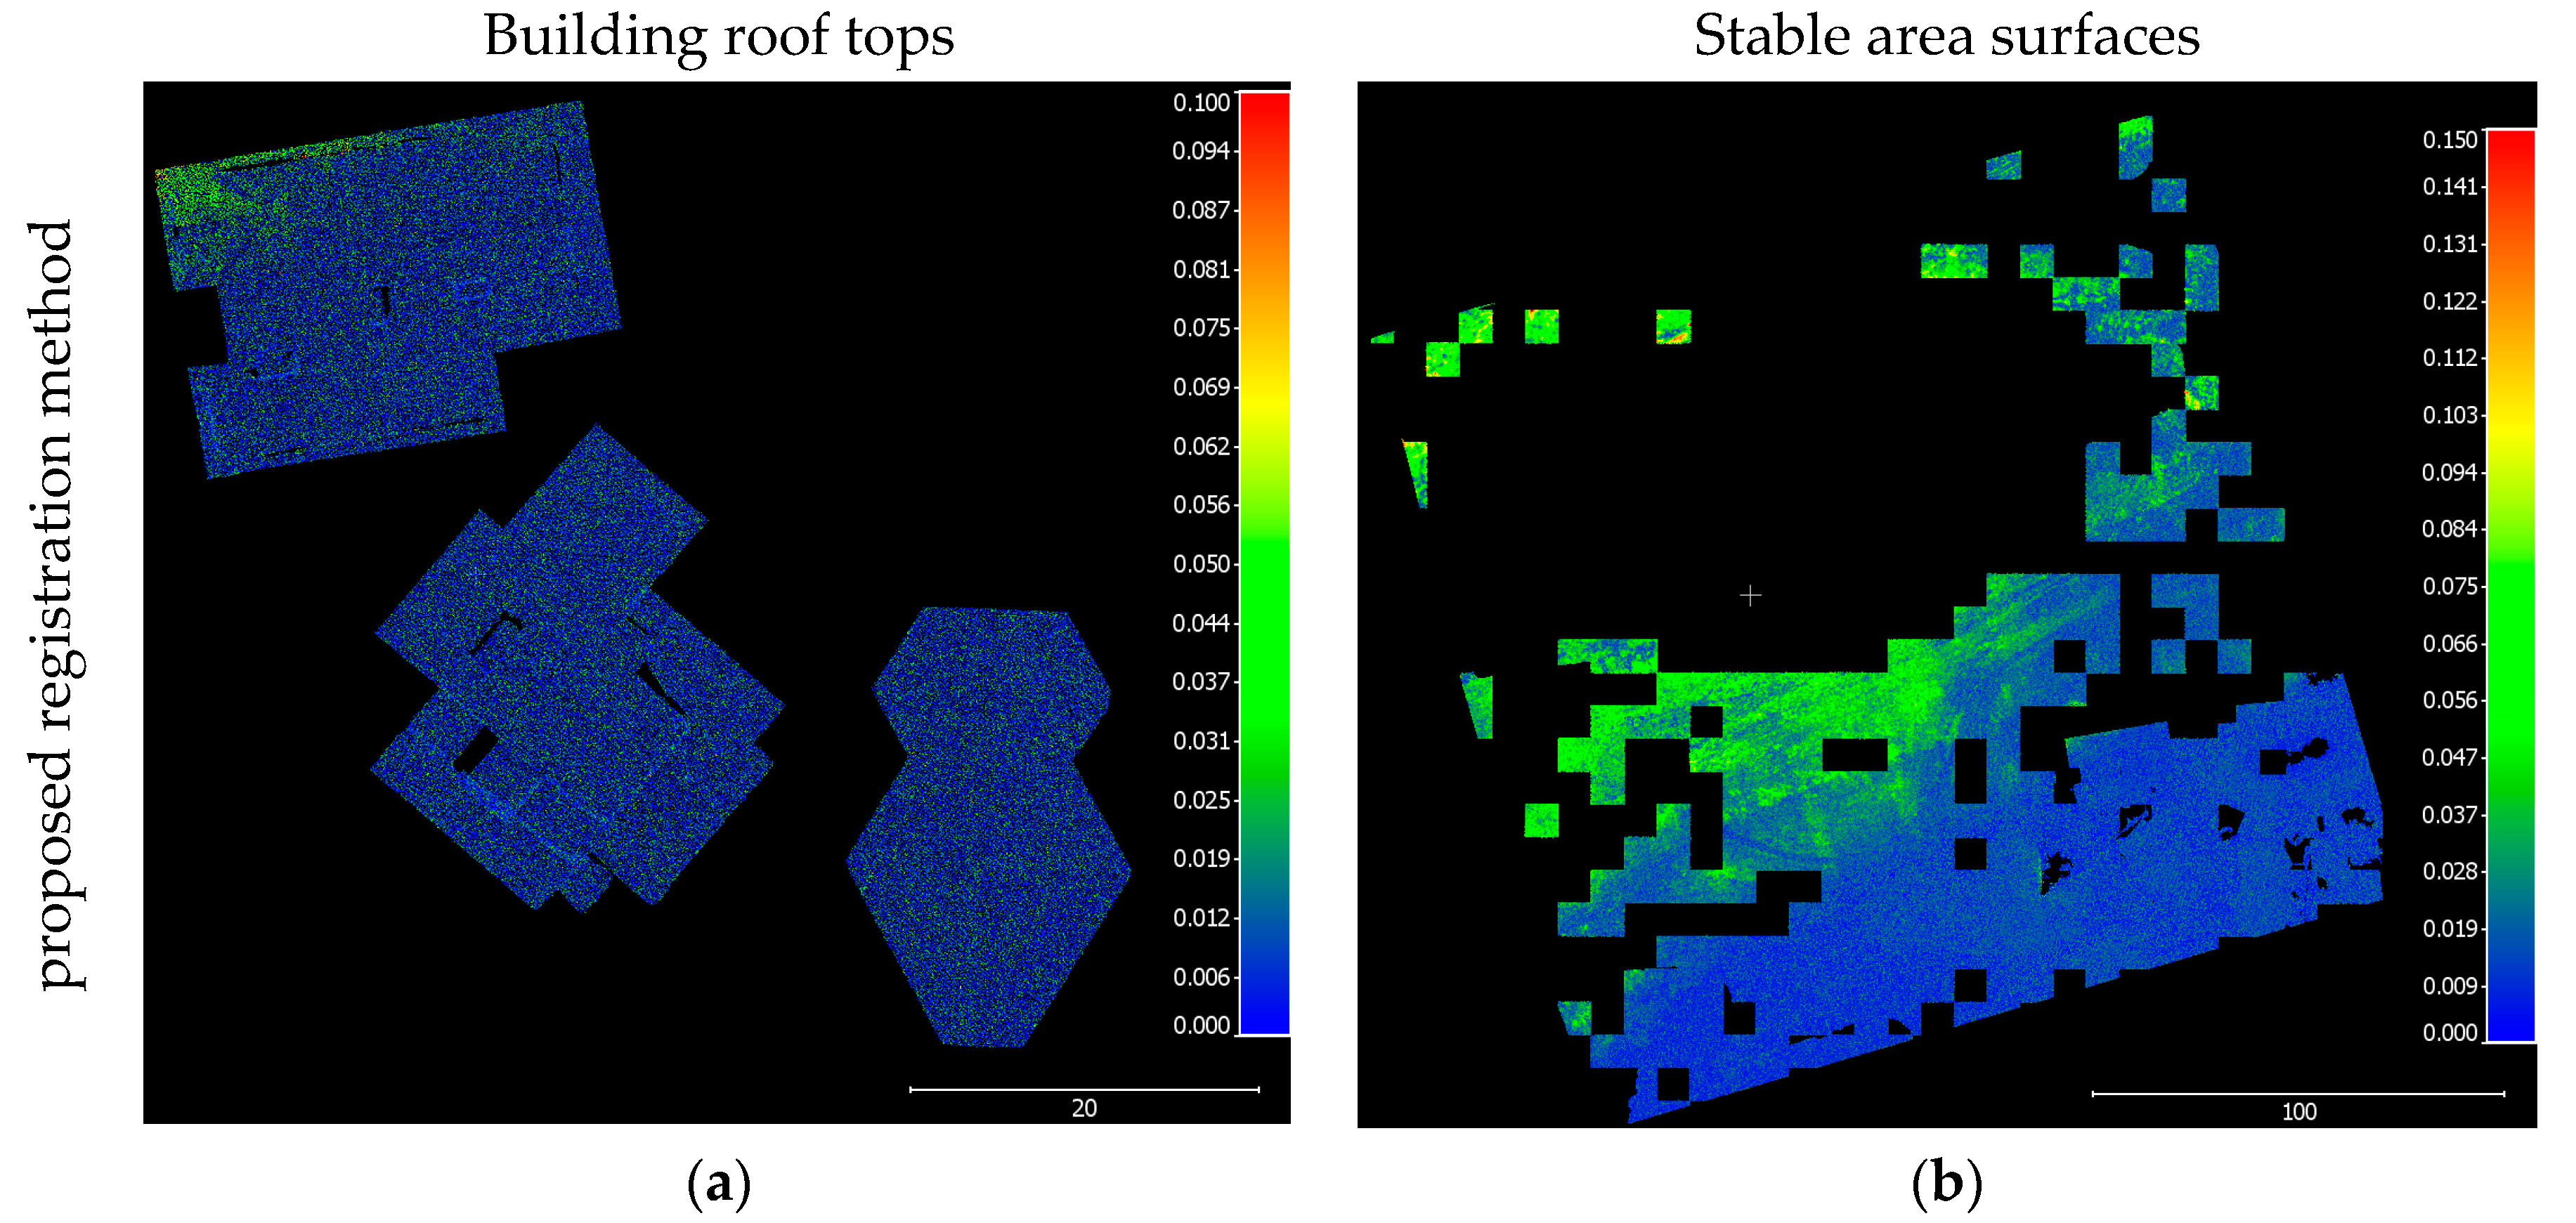
3.3. Evaluation of The Proposed Registration Method
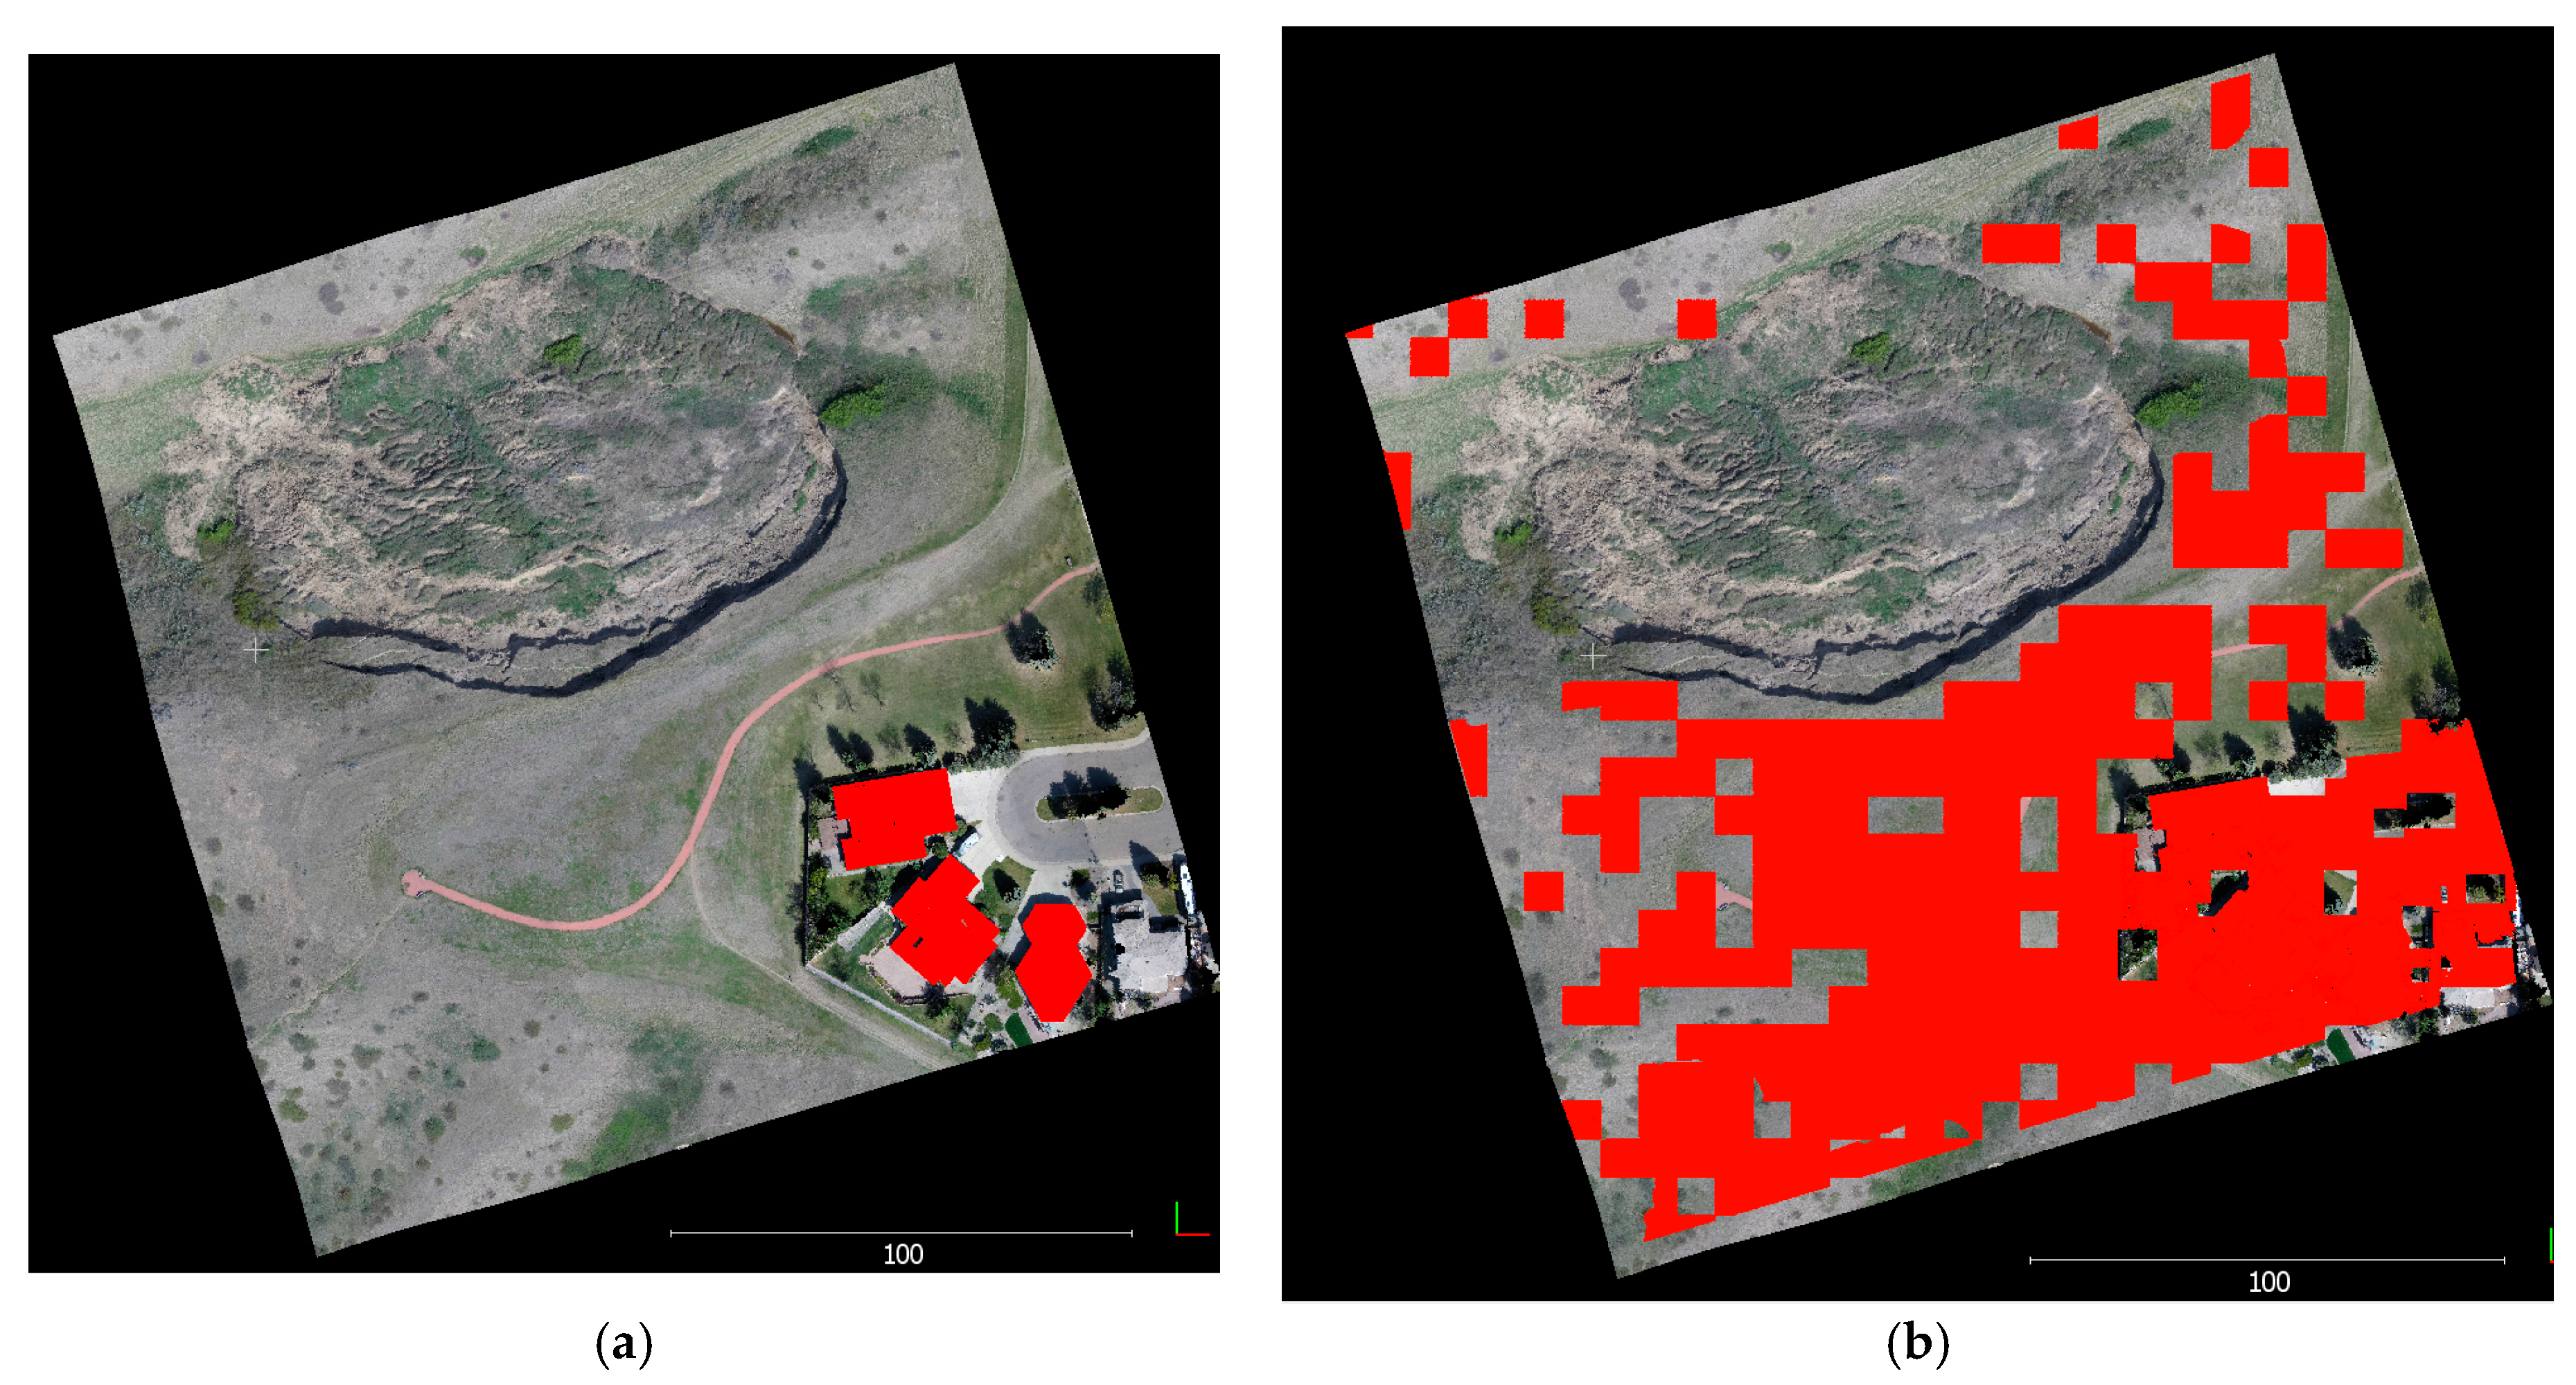
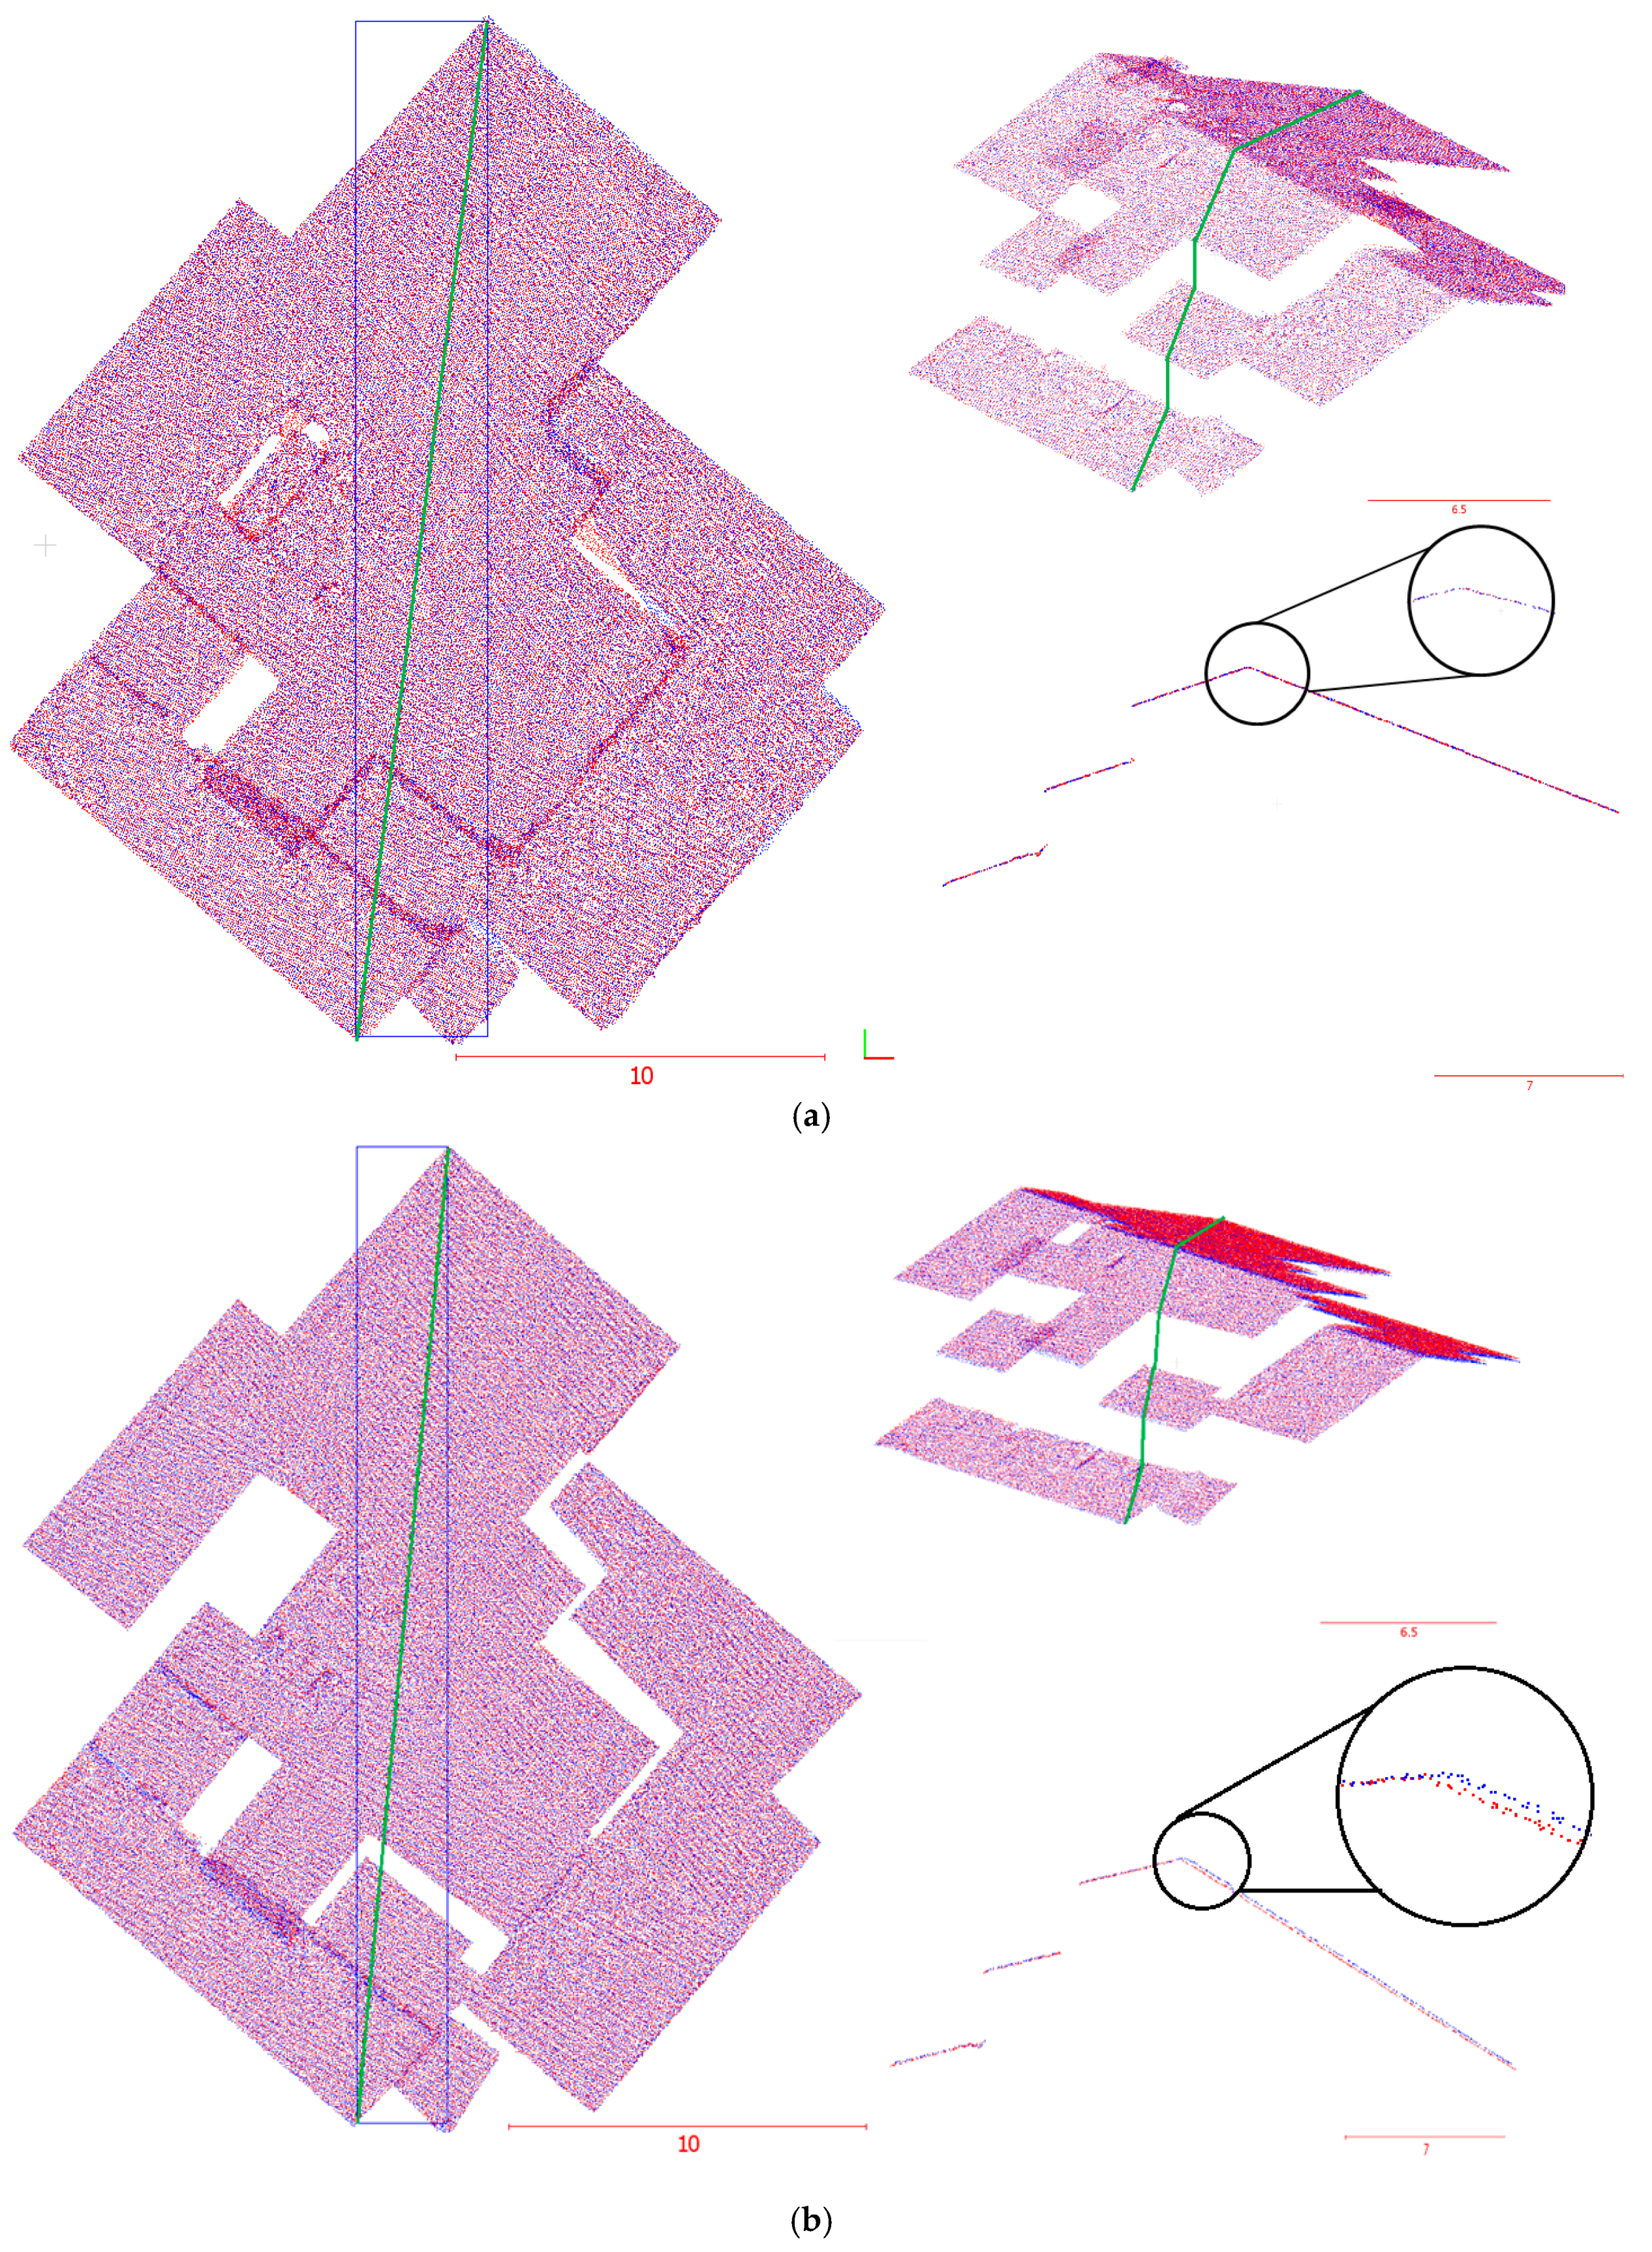
- The conjugate features in the non-active areas, including building rooftops and stable bare earth surfaces, are extracted. Building rooftops were extracted manually from both point clouds (see Figure 4a) and stable bare earth surfaces are extracted automatically based on the iterative closest proximity algorithm (ICProx-algorithm) proposed by Wujanz [31] (see Figure 4b). The ICProx-algorithm follows a geometrically-motivated strategy to overcome the low breakdown point of the L2-norm and to identify geometrically stable areas that are suitable for computation of the transformation parameters within point clouds. This is achieved by a bottom-up approach that divides the point clouds into spatially equal large segments by using an octree structure [38]. The basic idea is to locally increase the influence of outliers in order to identify them based on suitable criteria.All the segments are individually aligned via ICP, which leads to different sets of transformation parameters. Based on this outcome, congruent areas are identified by suitable criteria (e.g., A point from scan 1 needs to be located within the area that is described by its corresponding point and two adjacent points; a corresponding point has to lie on the surface that has been described in the previous step; and, at last, a corresponding point needs to be located within a partial area that has been derived from the area described by the first criterion). Finally, transformation parameters are determined by using the largest congruent cluster, which then is used integrally rather than in segments as during the diagnostic phase. This assumption can be made as the arbitrary deformation of an object or area leads to inconsistent changes and consequently different transformation parameters.
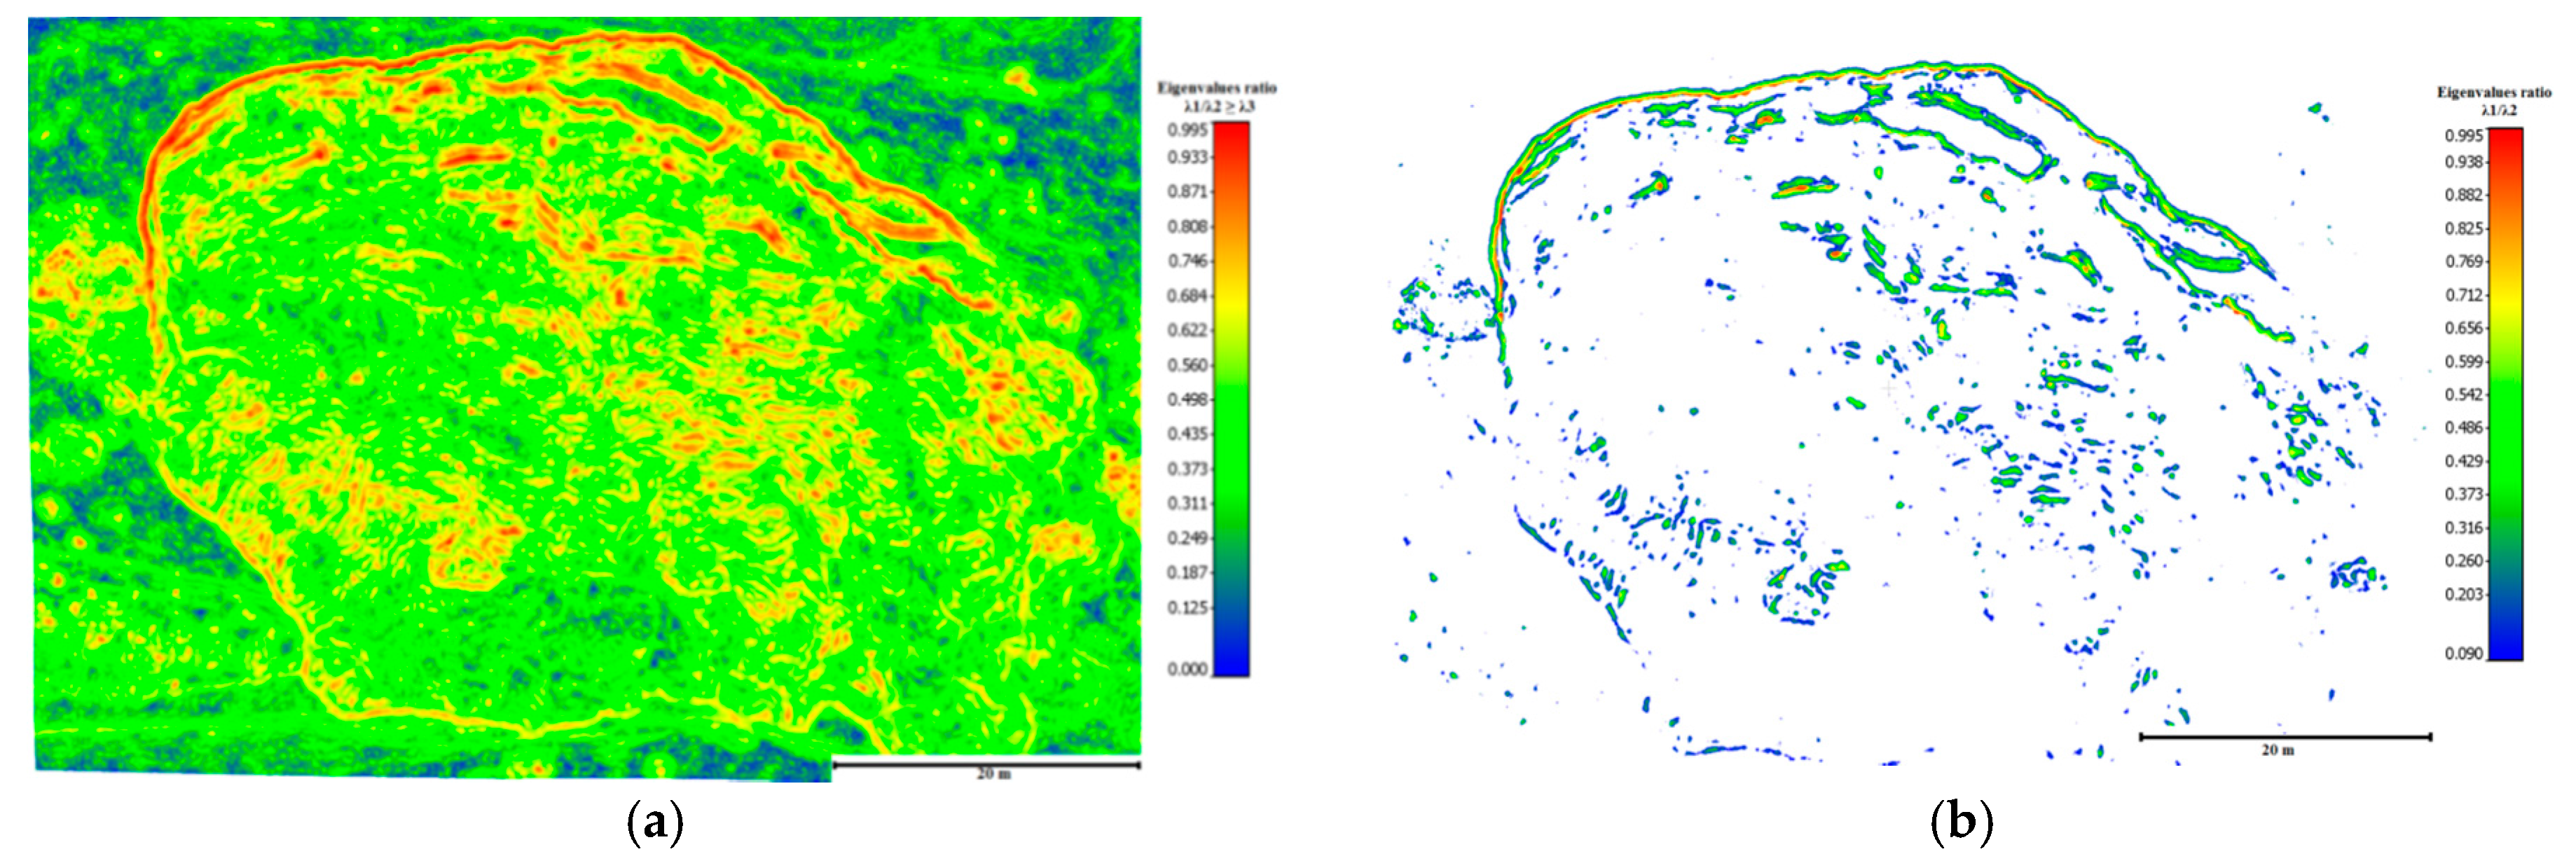
- The root mean square error (RMSE), mean, and standard deviation of the calculated point-to-plane normal distances for each plane are calculated using Equations (1)–(3), respectively.
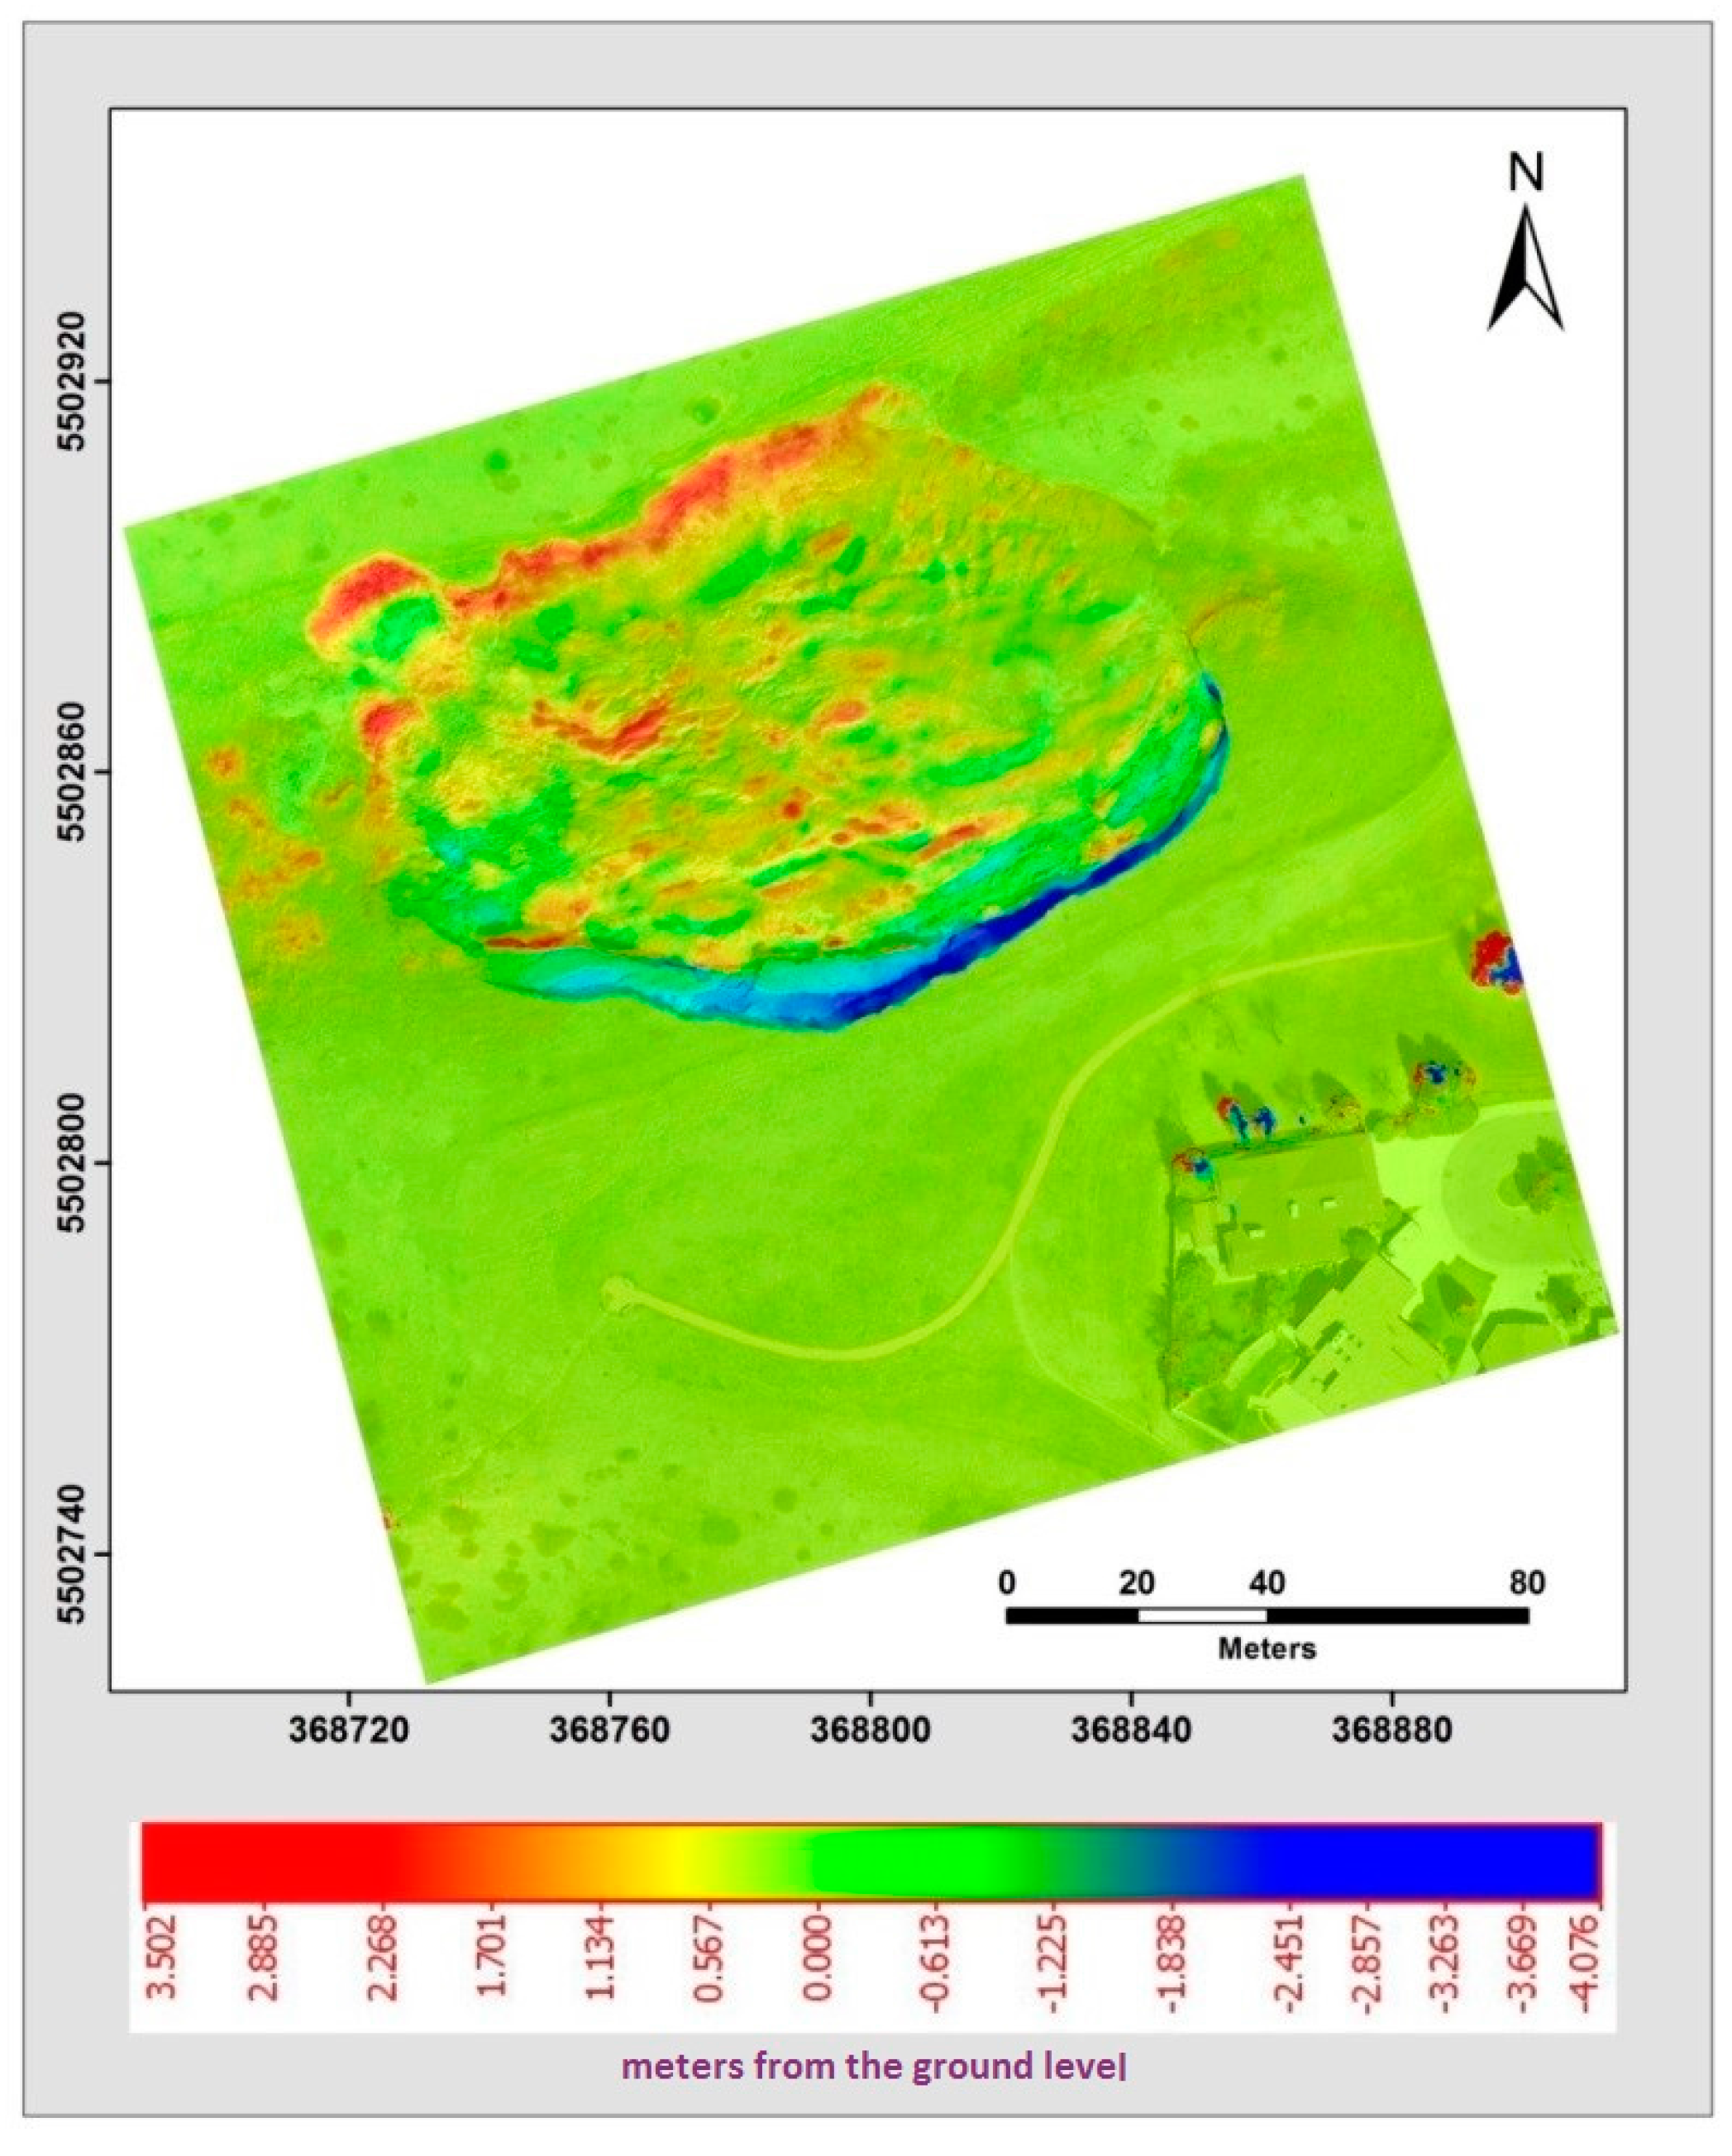
3.4. Volumetric Change Detection Analysis
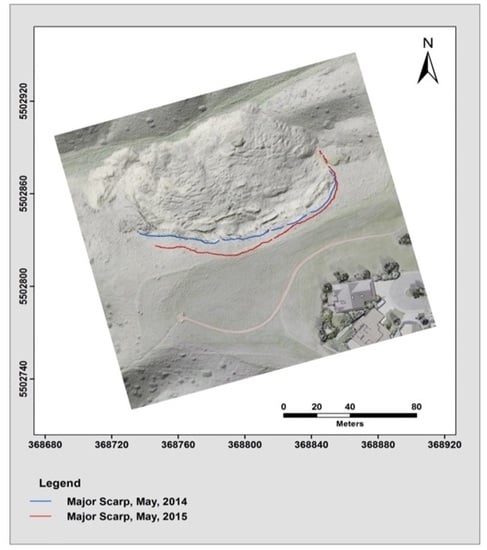
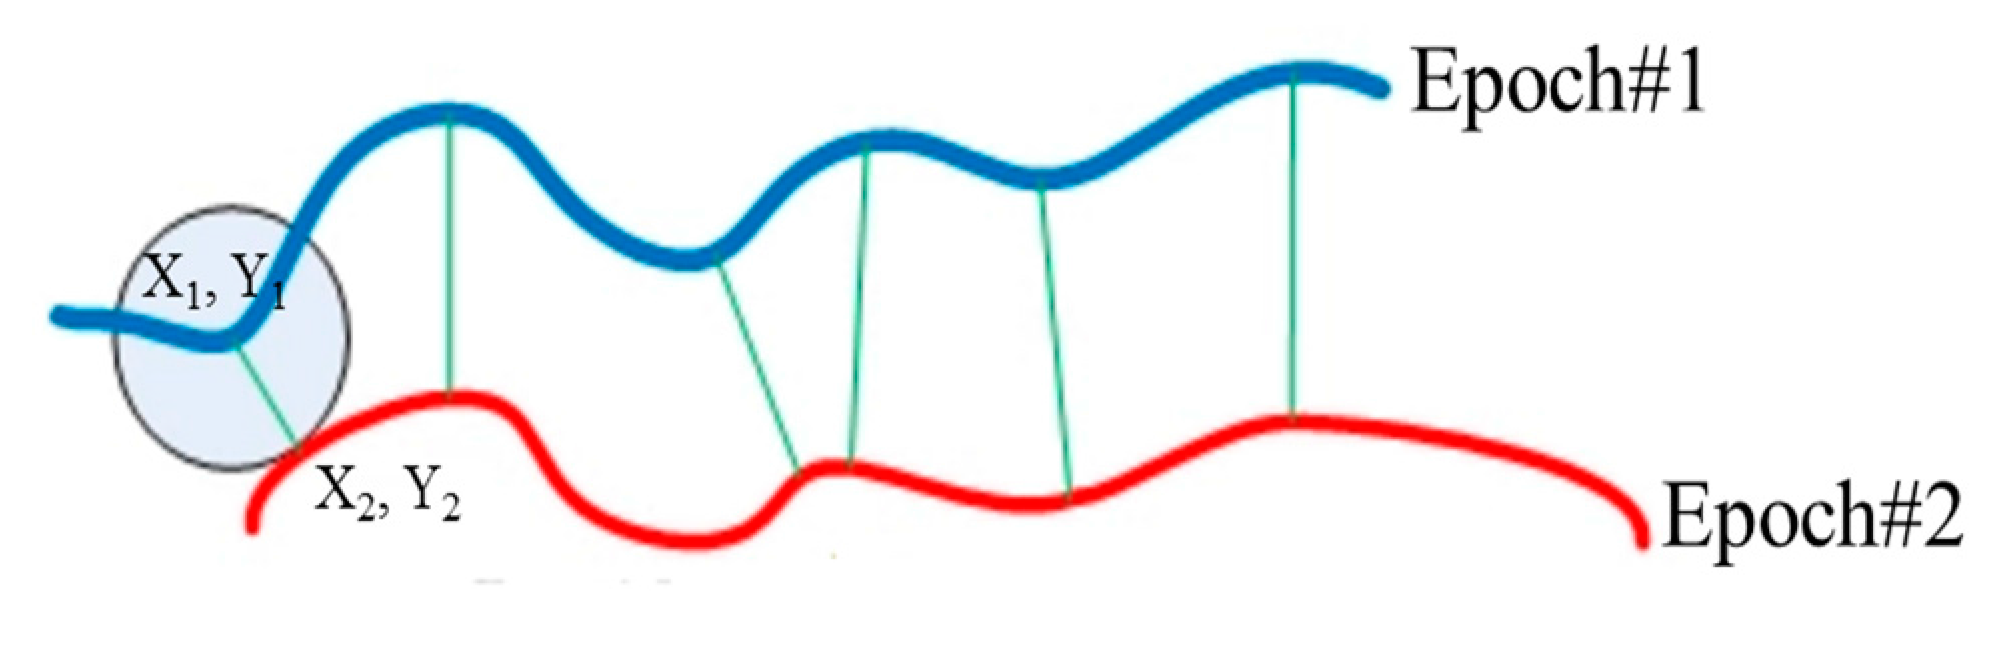
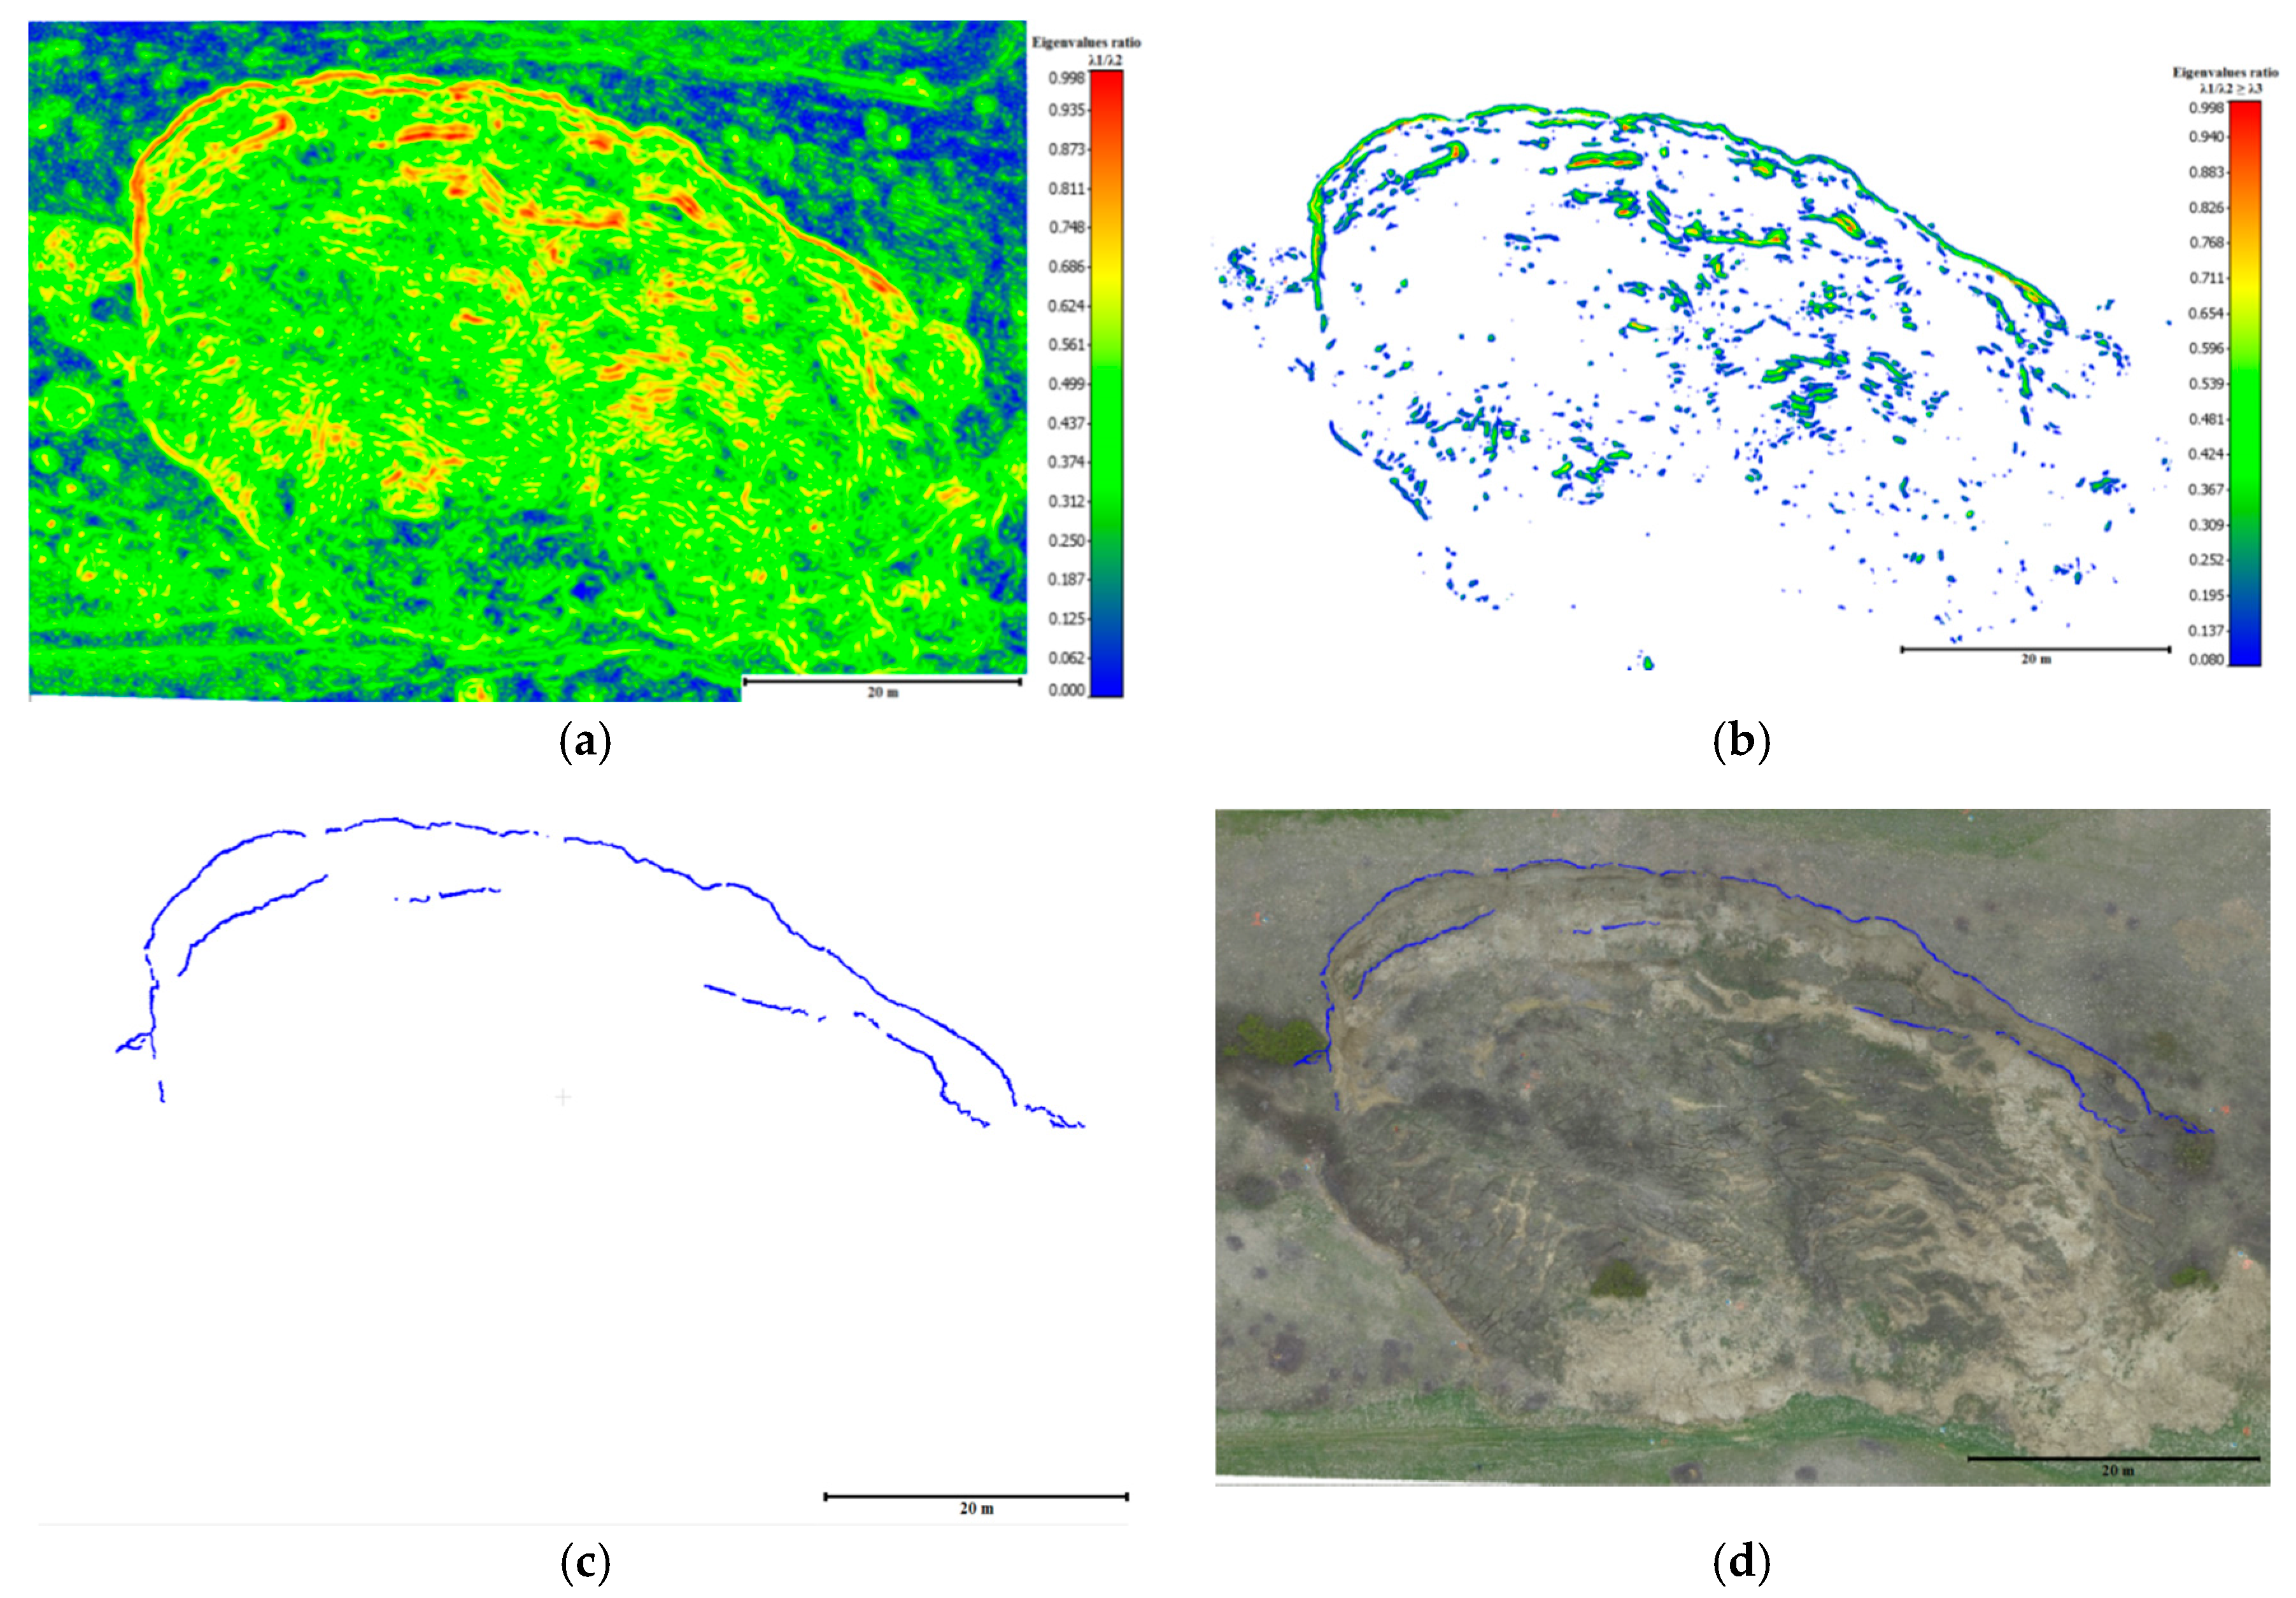
3.5. Change Detection Analysis in The Horizontal Direction
4. Results and Discussion
4.1. Data Description
4.2. 3D Surface Reconstruction
4.3. Quality Control of the Registration Results
4.4. Change Detection Analysis
4.4.1. Volumetric Change Detection Measurements Analysis
4.4.2. Displacements Measurements Analysis in Horizontal Direction
5. Conclusions
Supplementary Materials
Acknowledgments
Author Contributions
Conflicts of Interest
References
- Murakami, H.; Nakagawa, K.; Hasegawa, H.; Shibata, T.; Iwanami, E. Change detection of buildings using an airborne laser scanner. ISPRS J. Photogramm. Remote Sens. 1999, 54, 148–152. [Google Scholar] [CrossRef]
- Vögtle, T.; Steinle, E. Detection and recognition of changes in building geometry derived from multitemporal laserscanning data. Int. Arch. Photogramm. Remote Sens. Spat. Inf. Sci. 2004, 35, 428–433. [Google Scholar]
- Matikainen, L.; Hyyppä, J.; Kaartinen, H. Automatic detection of changes from laser scanner and aerial image data for updating building maps. Int. Arch. Photogramm. Remote Sens. Spat. Inf. Sci. 2004, 35, 434–439. [Google Scholar]
- Foroutan, M.; Zimbelman, J.R. Semi-automatic mapping of linear-trending bedforms using ‘self-organizing maps’ algorithm. Geomorphology 2017, 293, 156–166. [Google Scholar] [CrossRef]
- Tsakiri, M.; Anagnostopoulos, V. Change detection in terrestrial laser scanner data via point cloud correspondence. IJEIR 2015, 4, 476–486. [Google Scholar]
- Bogoslovsky, V.; Ogilvy, A. Geophysical methods for the investigation of landslides. Geophysics 1977, 42, 562–571. [Google Scholar] [CrossRef]
- Schuster, R.L.; Fleming, R.W. Economic losses and fatalities due to landslides. Bull. Assoc. Eng. Geol. 1986, 23, 11–28. [Google Scholar] [CrossRef]
- Guzzetti, F. Landslide fatalities and the evaluation of landslide risk in Italy. Eng. Geol. 2000, 58, 89–107. [Google Scholar] [CrossRef]
- Zhang, J.-X. 3S-aided landslide hazard monitoring and modeling. Eng. Surv. Mapp. 2005, 2, 001. [Google Scholar]
- Mahler, C.F.; Varanda, E.; de Oliveira, L.C. Analytical model of landslide risk using GIS. Open J. Geol. 2012, 2, 182. [Google Scholar]
- International Consortium on Landslides (ICL). (2006) International Consortium on Landslides: Database of Landslides of the World. Available online: http://www2.co-conv.jp/~landslide/v2/landslide/simple.php (accessed on 11 April 2007).
- Niethammer, U.; Rothmund, S.; James, M.; Travelletti, J.; Joswig, M. Uavbased remote sensing of landslides. Int. Arch. Photogramm. Remote Sens. Spat. Inf. Sci. 2010, 38 Pt 5, 496–501. [Google Scholar]
- Martha, T.R.; Kerle, N.; Jetten, V.; Van Westen, J.; Kumar, K. Landslide volumetric analysis using cartosat-1-derived dems. Geosci. Remote Sens. Lett. IEEE 2010, 7, 582–586. [Google Scholar] [CrossRef]
- Kang, Z.; Lu, Z. The change detection of building models using epochs of terrestrial point clouds. In Proceedings of the 2011 International Workshop on Multi-Platform/Multi-Sensor Remote Sensing and Mapping (m2rsm), Xiamen, China, 10–12 January 2011; pp. 1–6. [Google Scholar]
- Lucieer, A.; Turner, D.; King, D.; Robinson, S. Using an unmanned aerial vehicle (UAV) to capture micro-topography of antarctic moss beds. Int. J. Appl. Earth Obs. Geoinf. 2014, 27, 53–62. [Google Scholar] [CrossRef]
- Dou, J.; Chang, K.-T.; Chen, S.; Yunus, A.; Liu, J.-K.; Xia, H.; Zhu, Z. Automatic case-based reasoning approach for landslide detection: Integration of object-oriented image analysis and a genetic algorithm. Remote Sens. 2015, 7, 4318–4342. [Google Scholar] [CrossRef]
- Lato, M.; Diederichs, M.; Hutchinson, J.; Harrap, R. Optimization of lidar scanning and processing for automated structural evaluation of discontinuities in rockmasses. Int. J. Rock Mech. Min. Sci. 2009, 46, 194–199. [Google Scholar] [CrossRef]
- Lichti, D.; Skaloud, J. Airborne and Terrestrial Laser Scanning, Registration and Calibration; CRC Press: Boca Raton, FL, USA, 2010. [Google Scholar]
- Liang, Y.-B.; Zhan, Q.-M.; Che, E.-Z.; Chen, M.-W.; Zhang, D.-L. Automatic registration of terrestrial laser scanning data using precisely located artificial planar targets. Geosci. Remote Sens. Lett. IEEE 2014, 11, 69–73. [Google Scholar] [CrossRef]
- Schuhmacher, S.; Böhm, J. Georeferencing of Terrestrial Lasers Scanner Data for Applications in Architectural Modelling. In Proceedings of the 3D-ARCH 2005: Virtual Reconstruction and Visualization of Complex Architectures, Mestre, Italy, 22–24 August 2005; Volume XXXVI, p. 7. [Google Scholar]
- Al-Durgham, M.; Habib, A. A framework for the registration and segmentation of heterogeneous LiDAR data. Photogramm. Eng. Remote Sens. 2013, 79, 135–145. [Google Scholar] [CrossRef]
- Habib, A.; Kersting, A.; Ruifang, Z.; Al-Durgham, M.; Kim, C.; Lee, D. Lidar strip adjustment using conjugate linear features in overlapping strips. Int. Arch. Photogramm. Remote Sens. Spat. Inf. Sci. 2008, 37, 385–390. [Google Scholar]
- Habib, A.; Detchev, I.; Bang, K. A comparative analysis of two approaches for multiple-surface registration of irregular point clouds. Int. Arch. Photogramm. Remote Sens. Spat. Inf. Sci. 2010, 61–66. [Google Scholar]
- Wen, C.; Qin, L.; Zhu, Q.; Wang, C.; Jonathan Li, J. Three-dimensional indoor mobile mapping with fusion of two-dimensional laser scanner and rgb-d camera data. IEEE Geosci. Remote Sens. Lett. 2014, 11, 843–847. [Google Scholar]
- Wilkinson, B.; Mohamed, A.; Dewitt, B.; Seedahmed, G. A novel approach to terrestrial lidar georeferencing. Photogramm. Eng. Remote Sens. 2010, 76, 683–690. [Google Scholar] [CrossRef]
- Lari, Z.; El-Sheimy, N.; Habib, A. System considerations and challendes in 3d mapping and modeling using low-Cost uav systems. Int. Arch. Photogramm. Remote Sens. Spat. Inf. Sci. 2015, 40, 343. [Google Scholar] [CrossRef]
- Besl, P.J. Active, optical range imaging sensors. Mach. Vis. Appl. 1988, 1, 127–152. [Google Scholar] [CrossRef]
- Tombari, F.; Remondino, F. Feature-Based Automatic 3D Registration for Cultural Heritage Applications. In Proceedings of the 2013 Digital Heritage International Congress (DigitalHeritage), Marseille, France, 28 October–1 November 2013; pp. 55–62. [Google Scholar]
- Immerzeel, W.; Kraaijenbrink, P.; Shea, J.; Shrestha, A.; Pellicciotti, F.; Bierkens, M.; De Jong, S. High-resolution monitoring of himalayan glacier dynamics using unmanned aerial vehicles. Remote Sens. Environ. 2014, 150, 93–103. [Google Scholar] [CrossRef]
- Wang, Q.; Wu, L.; Chen, S.; Shu, D.; Xu, Z.; Li, F.; Wang, R. Accuracy evaluation of 3d geometry from low-attitude uav collections a case at zijin mine. Int. Arch. Photogramm. Remote Sens. Spat. Inf. Sci. 2014, 40, 297. [Google Scholar] [CrossRef]
- Wujanz, D. Towards transparent quality measures in surface based registration processes: Effects of deformation onto commercial and scientific implementations. In Proceedings of the XXII Congress of the International Society of Photogrammetry and Remote Sensing, Melbourne, Australia, 25 August–1 September 2012. [Google Scholar]
- Environment and Climate Change Canada. Canadian Climate Normals 1971–2010. Available online: http://climate.weather.gc.ca/climate_normals/index_e.html (accessed on 18 April 2016).
- Environment and Climate Change Canada. Canadian Climate Normals 1981–2010. Available online: http://climate.weather.gc.ca/climate_normals/index_e.html (accessed on 18 April 2016).
- Light, D. The new camera calibration system at the US geological survey. Photogramm. Eng. Remote Sens. 1992, 58, 185–188. [Google Scholar]
- He, F.; Habib, A. Linear approach for initial recovery of the exterior orientation parameters of randomly captured images by low-cost mobile mapping systems. Int. Arch. Photogramm. Remote Sens. Spat. Inf. Sci. 2014, 40, 149. [Google Scholar] [CrossRef]
- Nistér, D. An efficient solution to the five-point relative pose problem. IEEE Trans. Pattern Anal. Mach. Intell. 2004, 26, 756–770. [Google Scholar] [CrossRef] [PubMed]
- Lowe, D. Distinctive image features from scale-invariant keypoints. Int. J. Comput. Vis. 2004, 60, 91–110. [Google Scholar] [CrossRef]
- Samet, H. Foundations of Multidimensional and Metric Data Structures (The Morgan Kaufmann Series in Computer Graphics and Geometric Modeling); Morgan Kaufmann Publishers Inc.: San Francisco, CA, USA, 2005. [Google Scholar]
- Vosselman, G.; Maas, H.-G. Airborne and Terrestrial Laser Scanning; CRC: Boca Raton, FL, USA, 2010; p. 318. [Google Scholar]
- Al-Rawabdeh, A.; He, F.; Mousaa, A.; El-Sheimy, N.; Habib, A.; Habib, A. Using an unmanned aerial vehicle-based digital imaging system to derive a 3d point cloud for landslide scarp recognition. Remote Sens. 2016, 8, 95. [Google Scholar] [CrossRef]


| Flight Date | Area Covered (km2) | Flight Direction | Duration (min) | Number of Images Taken | Number of Images Used |
|---|---|---|---|---|---|
| May 2014 | 0.0317 | N–S | 11.23 | 497 | 387 |
| 0.0387 | E–W | 8.57 | 500 | 325 | |
| May 2015 | 0.0307 | N–S | 12.08 | 602 | 411 |
| 0.0387 | E–W | 9.35 | 639 | 420 |
| No. of Images | 1543 | No. of Tie Points | 1,054,494 |
|---|---|---|---|
| Average Flying altitude | 27 m | Image space error | 1.33 pix |
| Ground resolution | 0.02 m/pix | Coverage area | 0.044 km2 |
| Registration Methods | Building Rooftops | Stable Area Surfaces | |
|---|---|---|---|
| Proposed Method | Mean (mm) | 0.8 | 24.9 |
| Standard deviation (mm) | 15.2 | 27.3 | |
| RMSE (mm) | 15.3 | 36.9 | |
| ICPP Method | Mean (mm) | 55.9 | 60.7 |
| Standard deviation (mm) | 46.2 | 32.4 | |
| RMSE (mm) | 67.5 | 68.8 |
| Dataset | Algorithm Approache | Overall Quality (%) | Completeness (%) (Producer’s Accuracy) | Correctness (%) (User’s Accuracy) | Kappa Coefficient (%) | Degree of Agreement |
|---|---|---|---|---|---|---|
| May 2014 | Topographic surface Eigenvalue ratios | 96.1 | 94.03 | 74.62 | 81 | Very good |
| May 2015 | 95.74 | 96.6 | 69.10 | 71.31 | Very good |
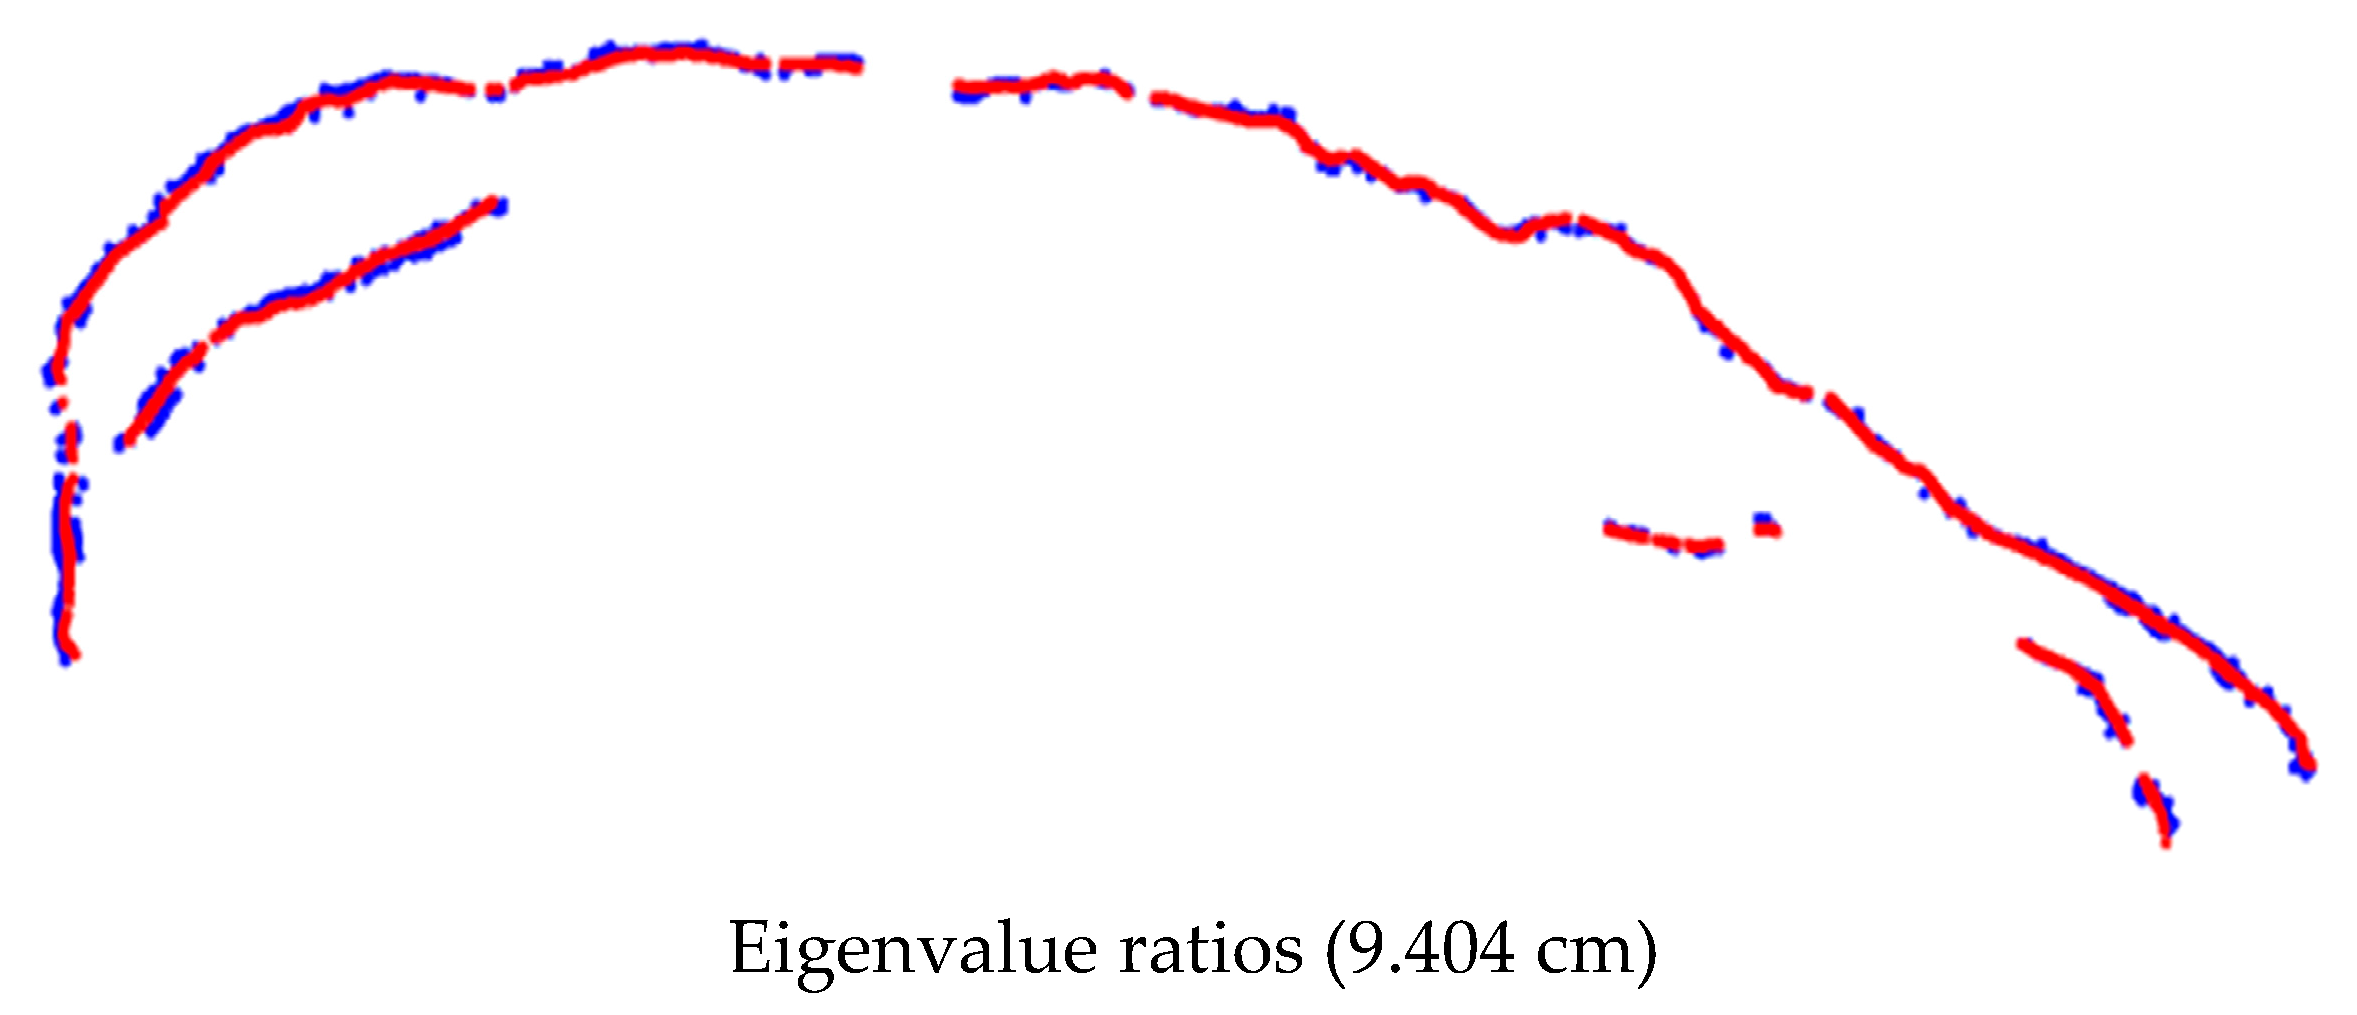
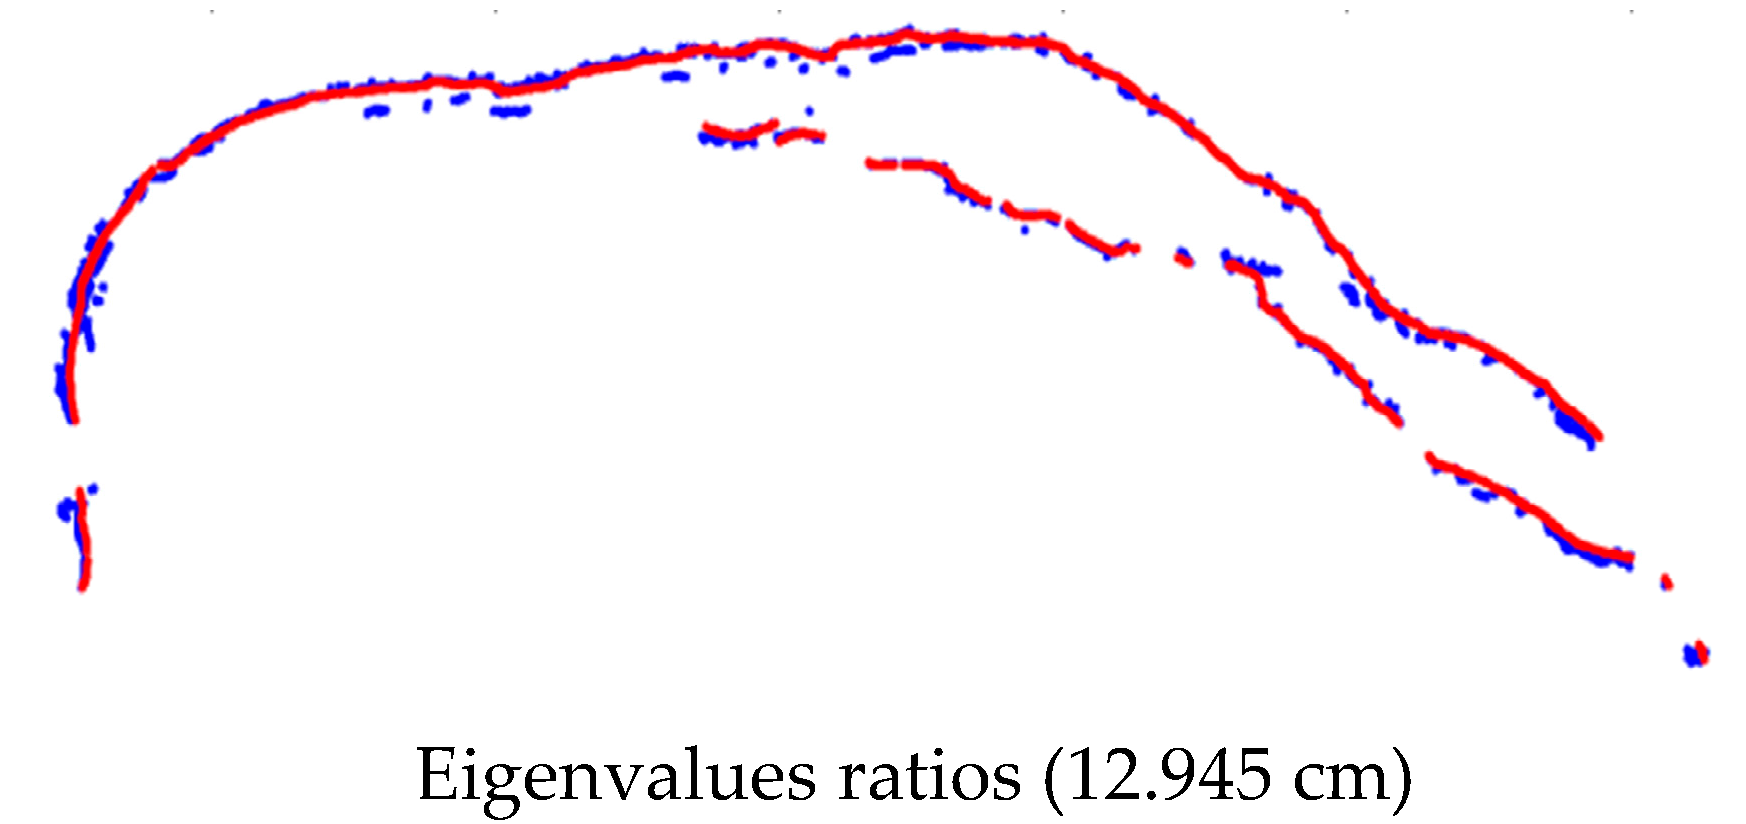
| Dataset | Algorithms Approaches | RMSE (cm) |
|---|---|---|
| May 2014 | Topographic surface Eigenvalue ratios | 9.404 |
| May 2015 | Topographic surface Eigenvalue ratios | 12.945 |
© 2017 by the authors. Licensee MDPI, Basel, Switzerland. This article is an open access article distributed under the terms and conditions of the Creative Commons Attribution (CC BY) license (http://creativecommons.org/licenses/by/4.0/).
Share and Cite
Al-Rawabdeh, A.; Moussa, A.; Foroutan, M.; El-Sheimy, N.; Habib, A. Time Series UAV Image-Based Point Clouds for Landslide Progression Evaluation Applications. Sensors 2017, 17, 2378. https://doi.org/10.3390/s17102378
Al-Rawabdeh A, Moussa A, Foroutan M, El-Sheimy N, Habib A. Time Series UAV Image-Based Point Clouds for Landslide Progression Evaluation Applications. Sensors. 2017; 17(10):2378. https://doi.org/10.3390/s17102378
Chicago/Turabian StyleAl-Rawabdeh, Abdulla, Adel Moussa, Marzieh Foroutan, Naser El-Sheimy, and Ayman Habib. 2017. "Time Series UAV Image-Based Point Clouds for Landslide Progression Evaluation Applications" Sensors 17, no. 10: 2378. https://doi.org/10.3390/s17102378
APA StyleAl-Rawabdeh, A., Moussa, A., Foroutan, M., El-Sheimy, N., & Habib, A. (2017). Time Series UAV Image-Based Point Clouds for Landslide Progression Evaluation Applications. Sensors, 17(10), 2378. https://doi.org/10.3390/s17102378