
Evaluation on Radiometric Capability of Chinese Optical Satellite Sensors


Abstract
:1. Introduction
2. Materials and Methods
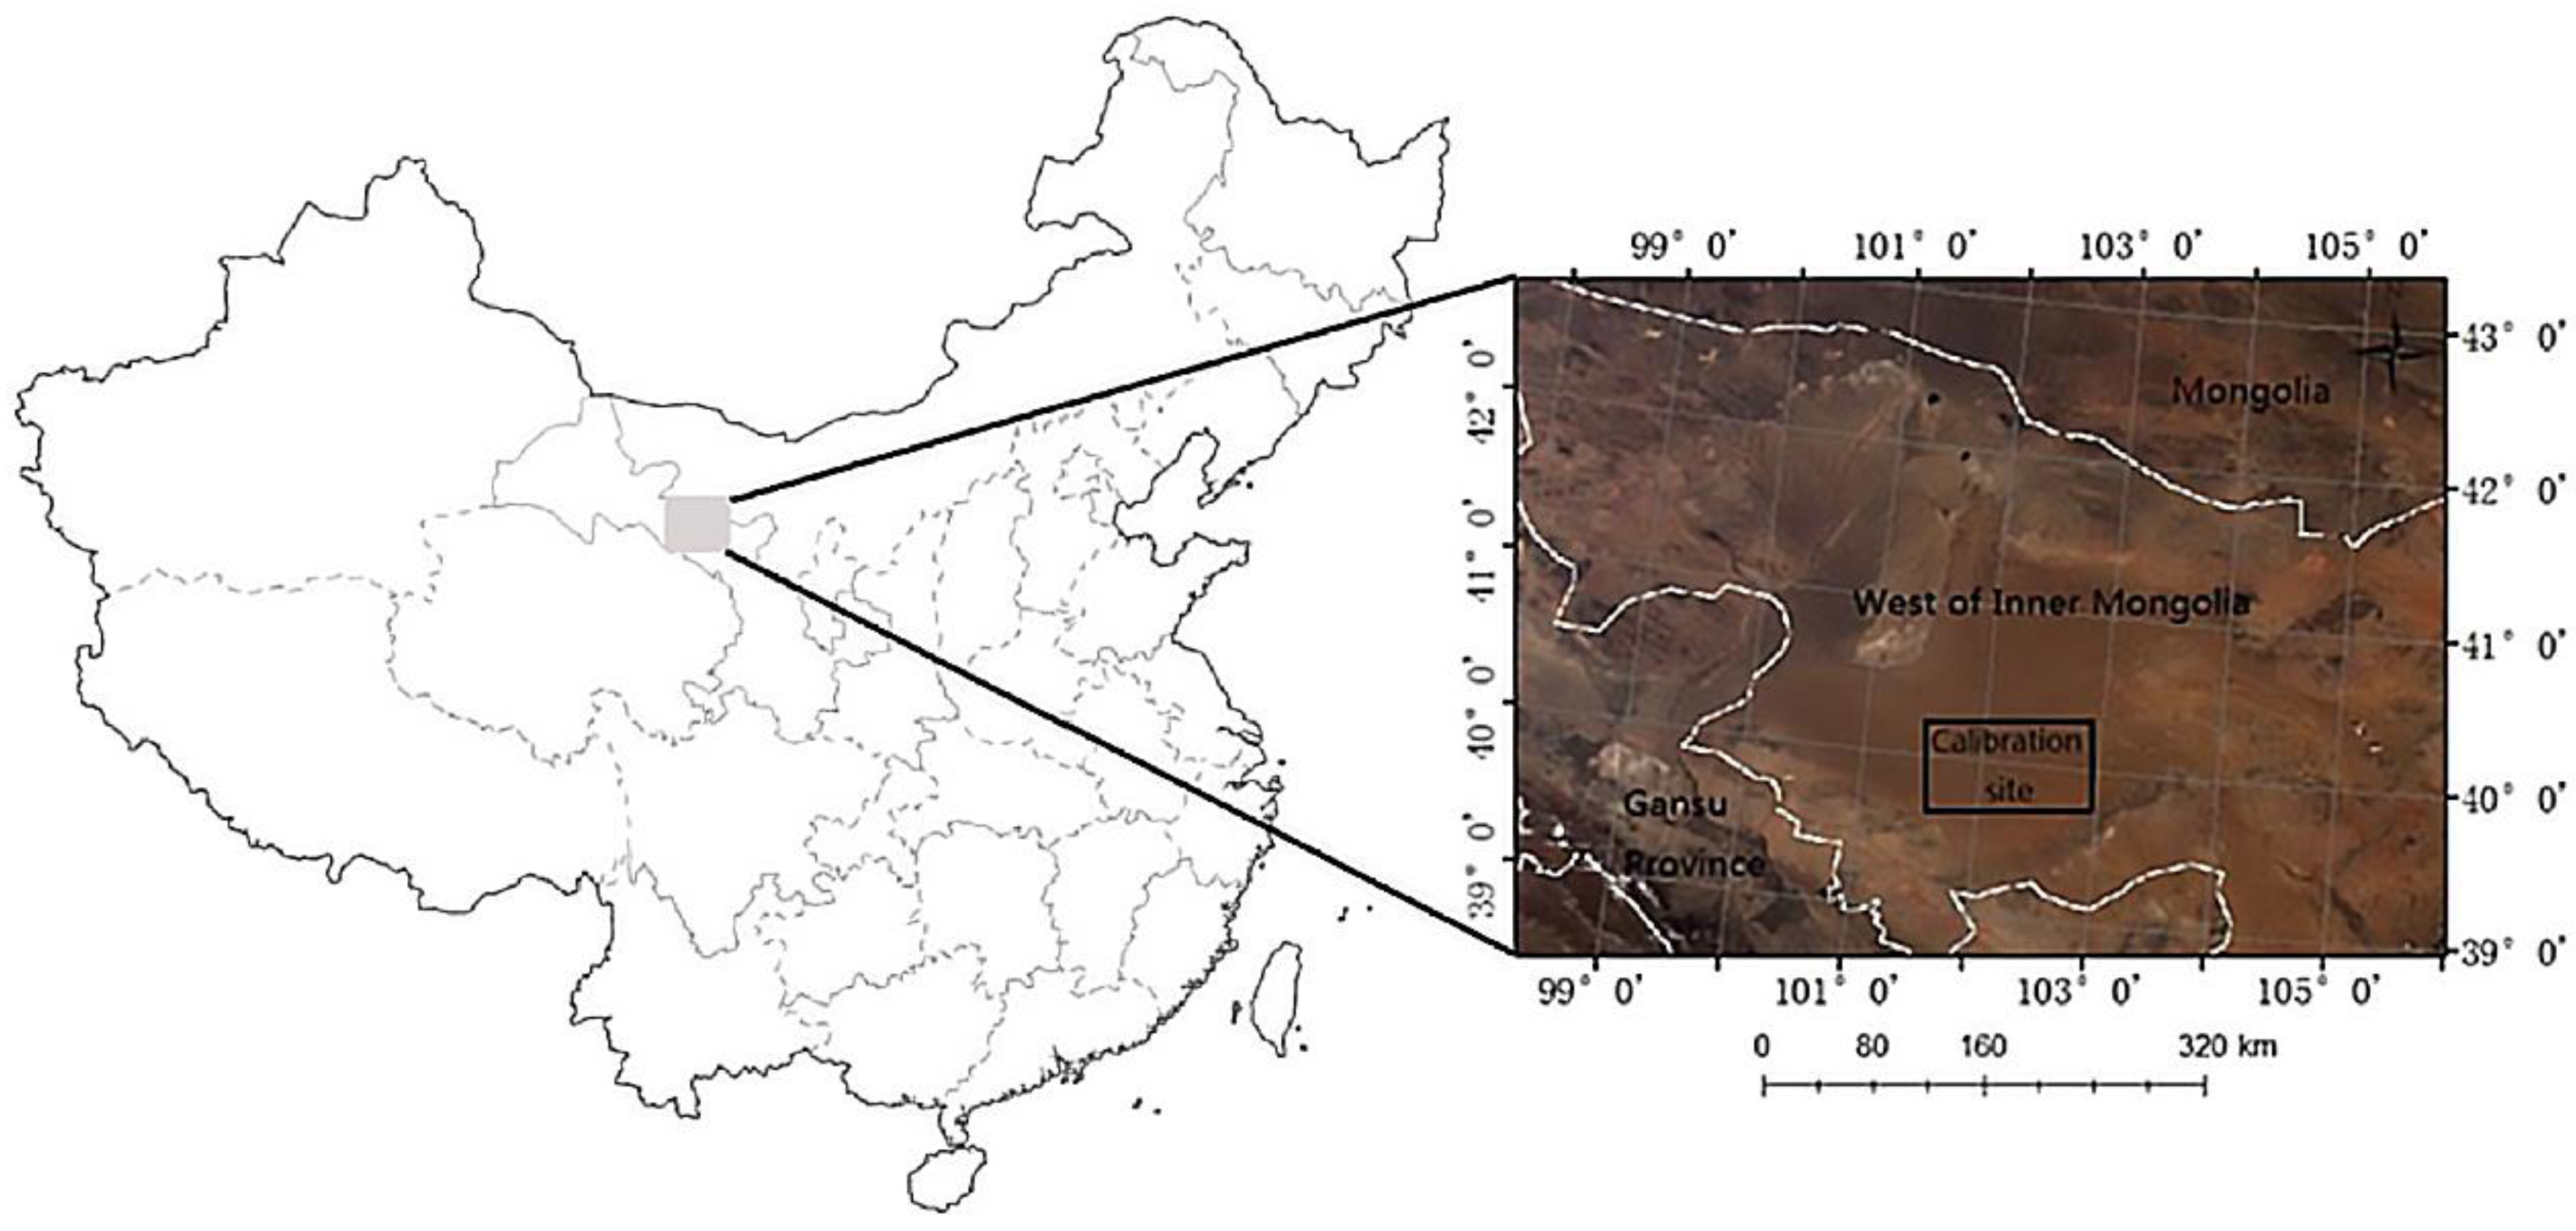
2.1. Test Site
2.2. Data
2.3. Methods
2.3.1. Top-of-Atmosphere (TOA) Reflectance Calculation
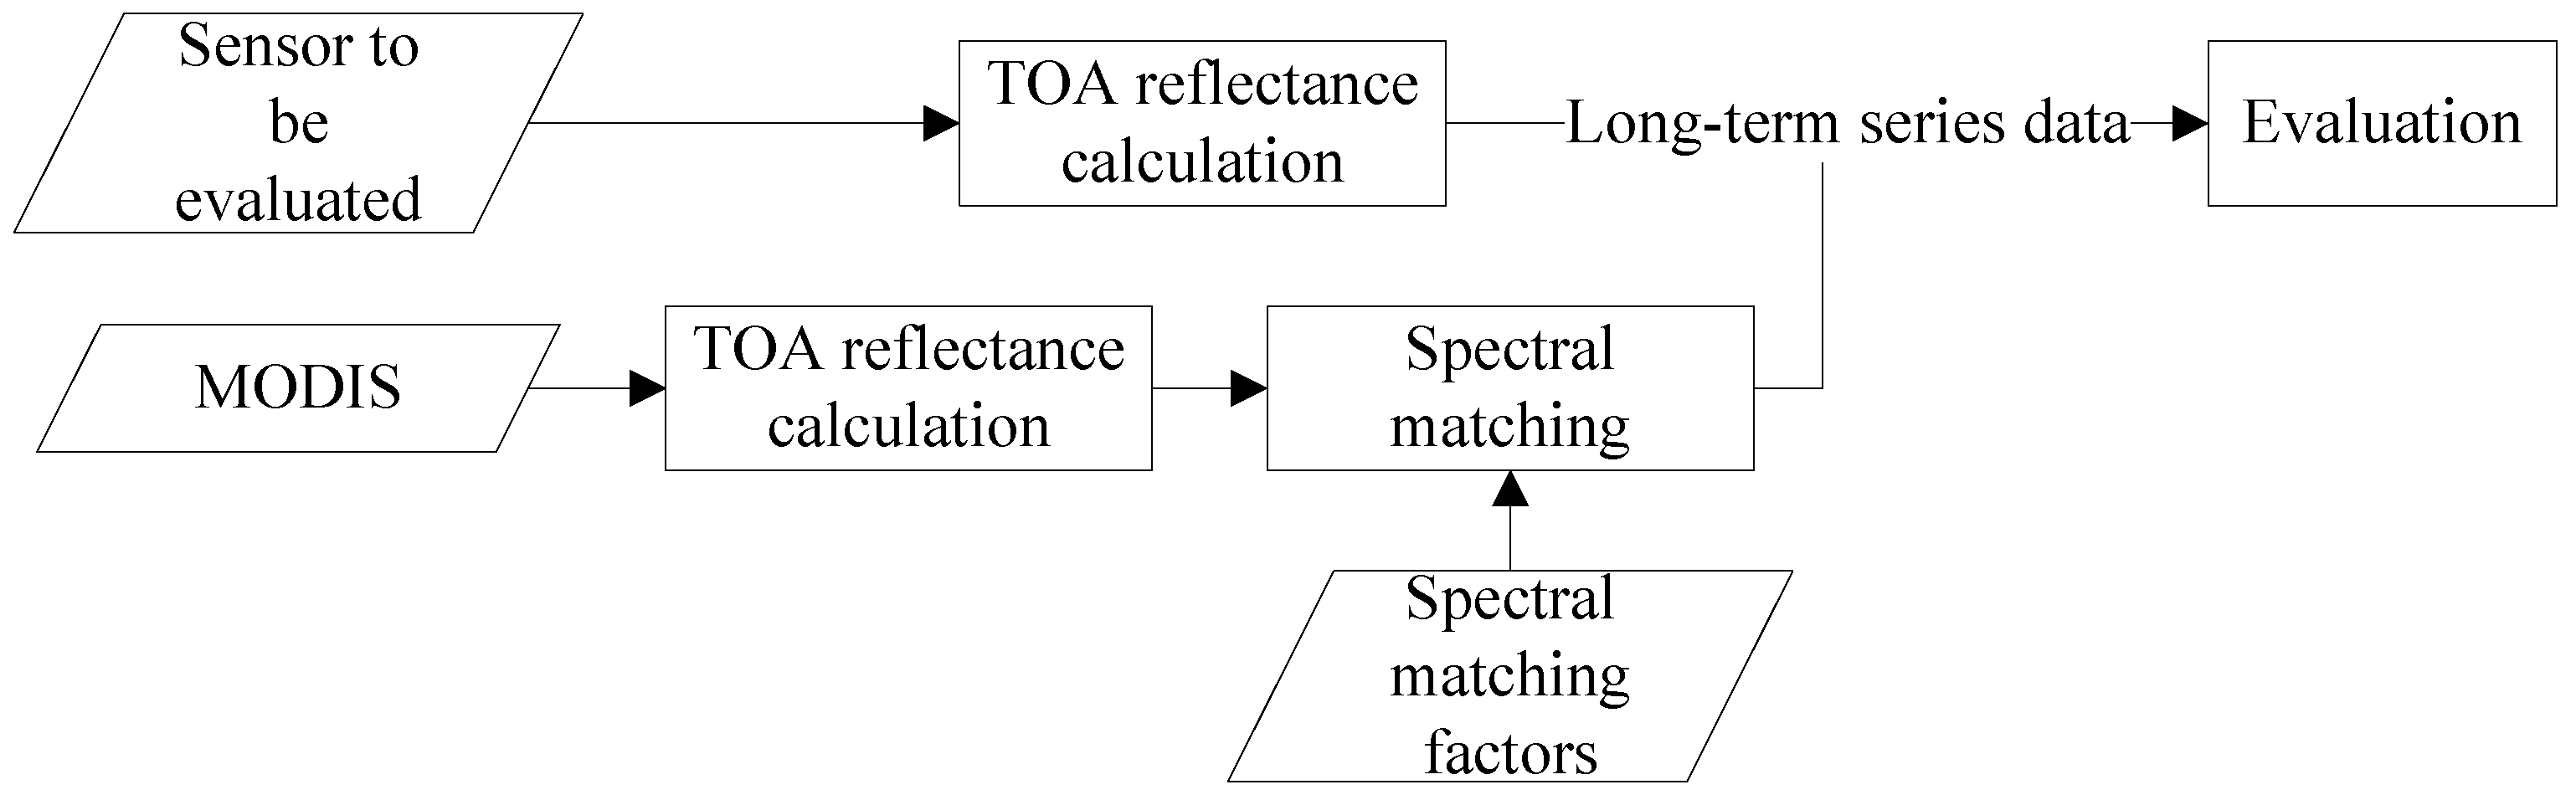
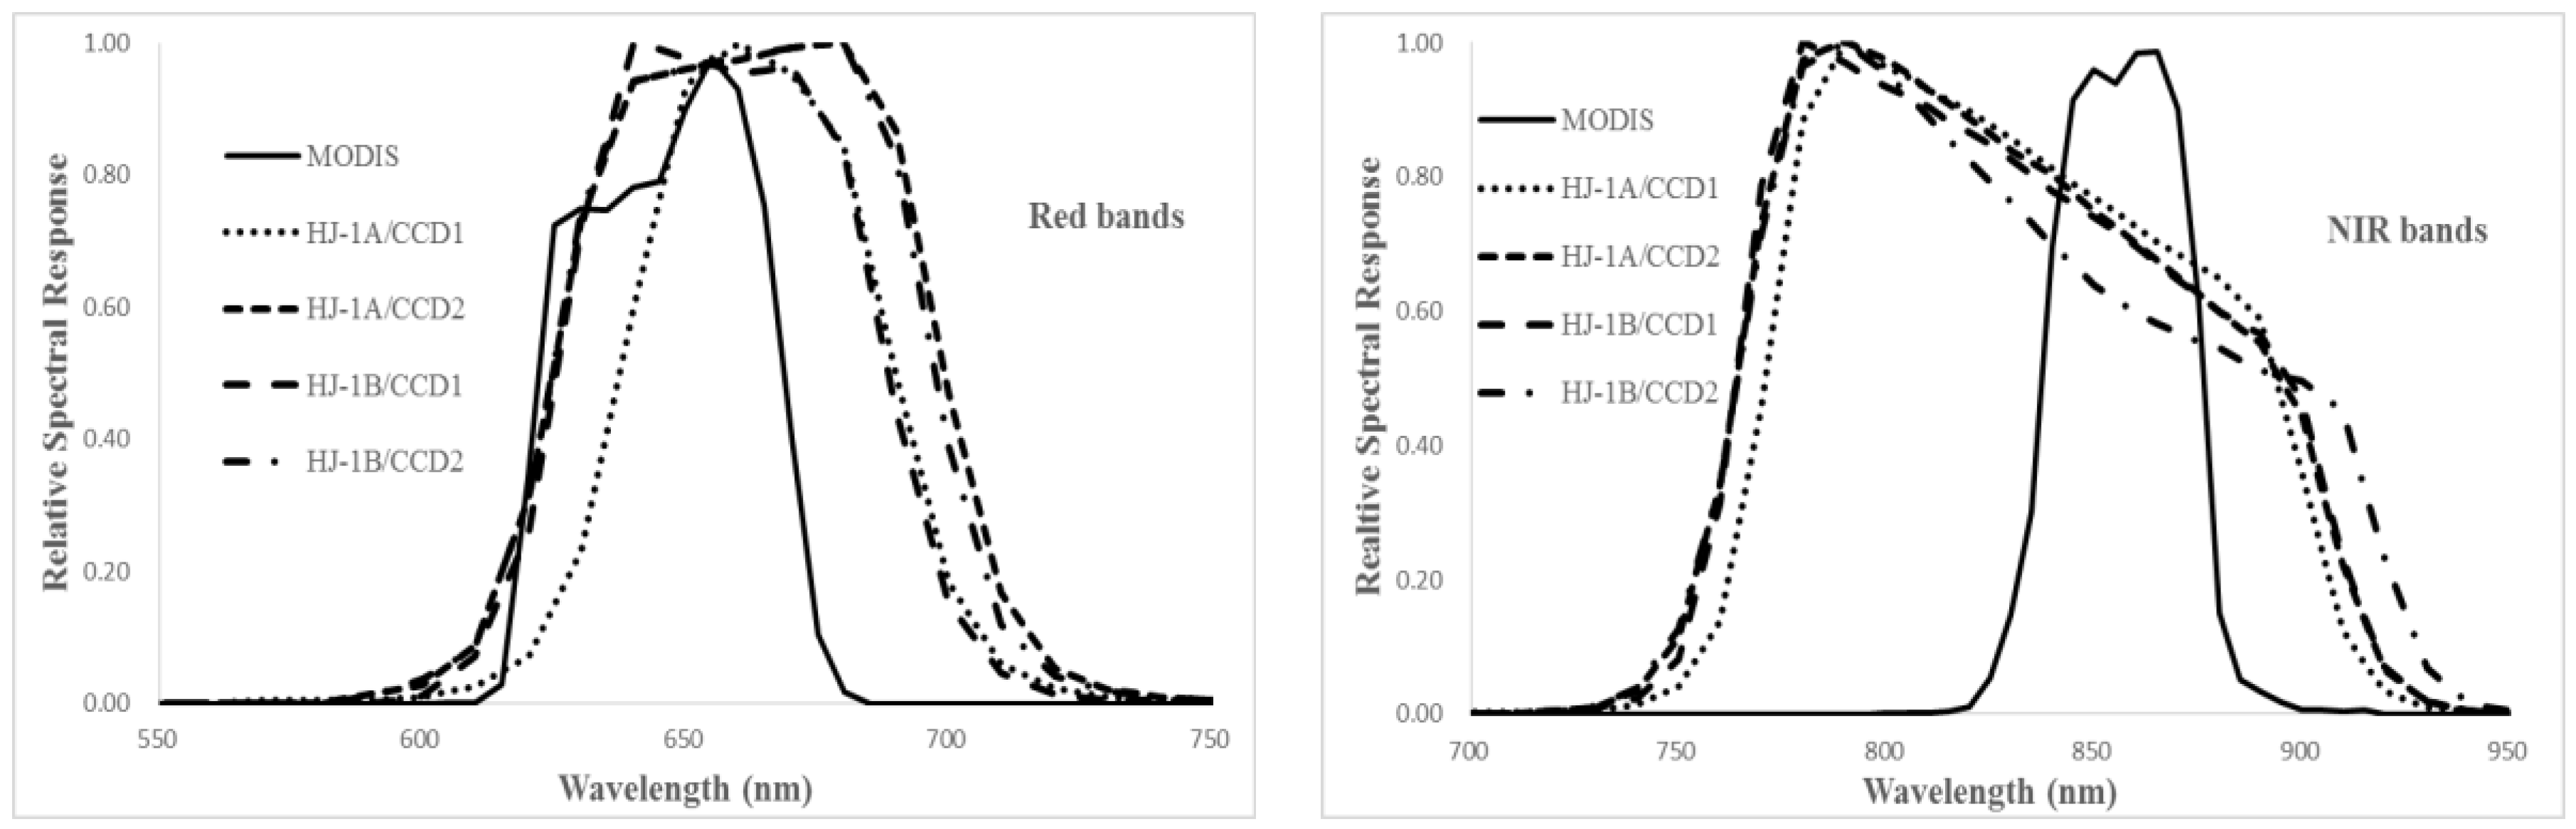
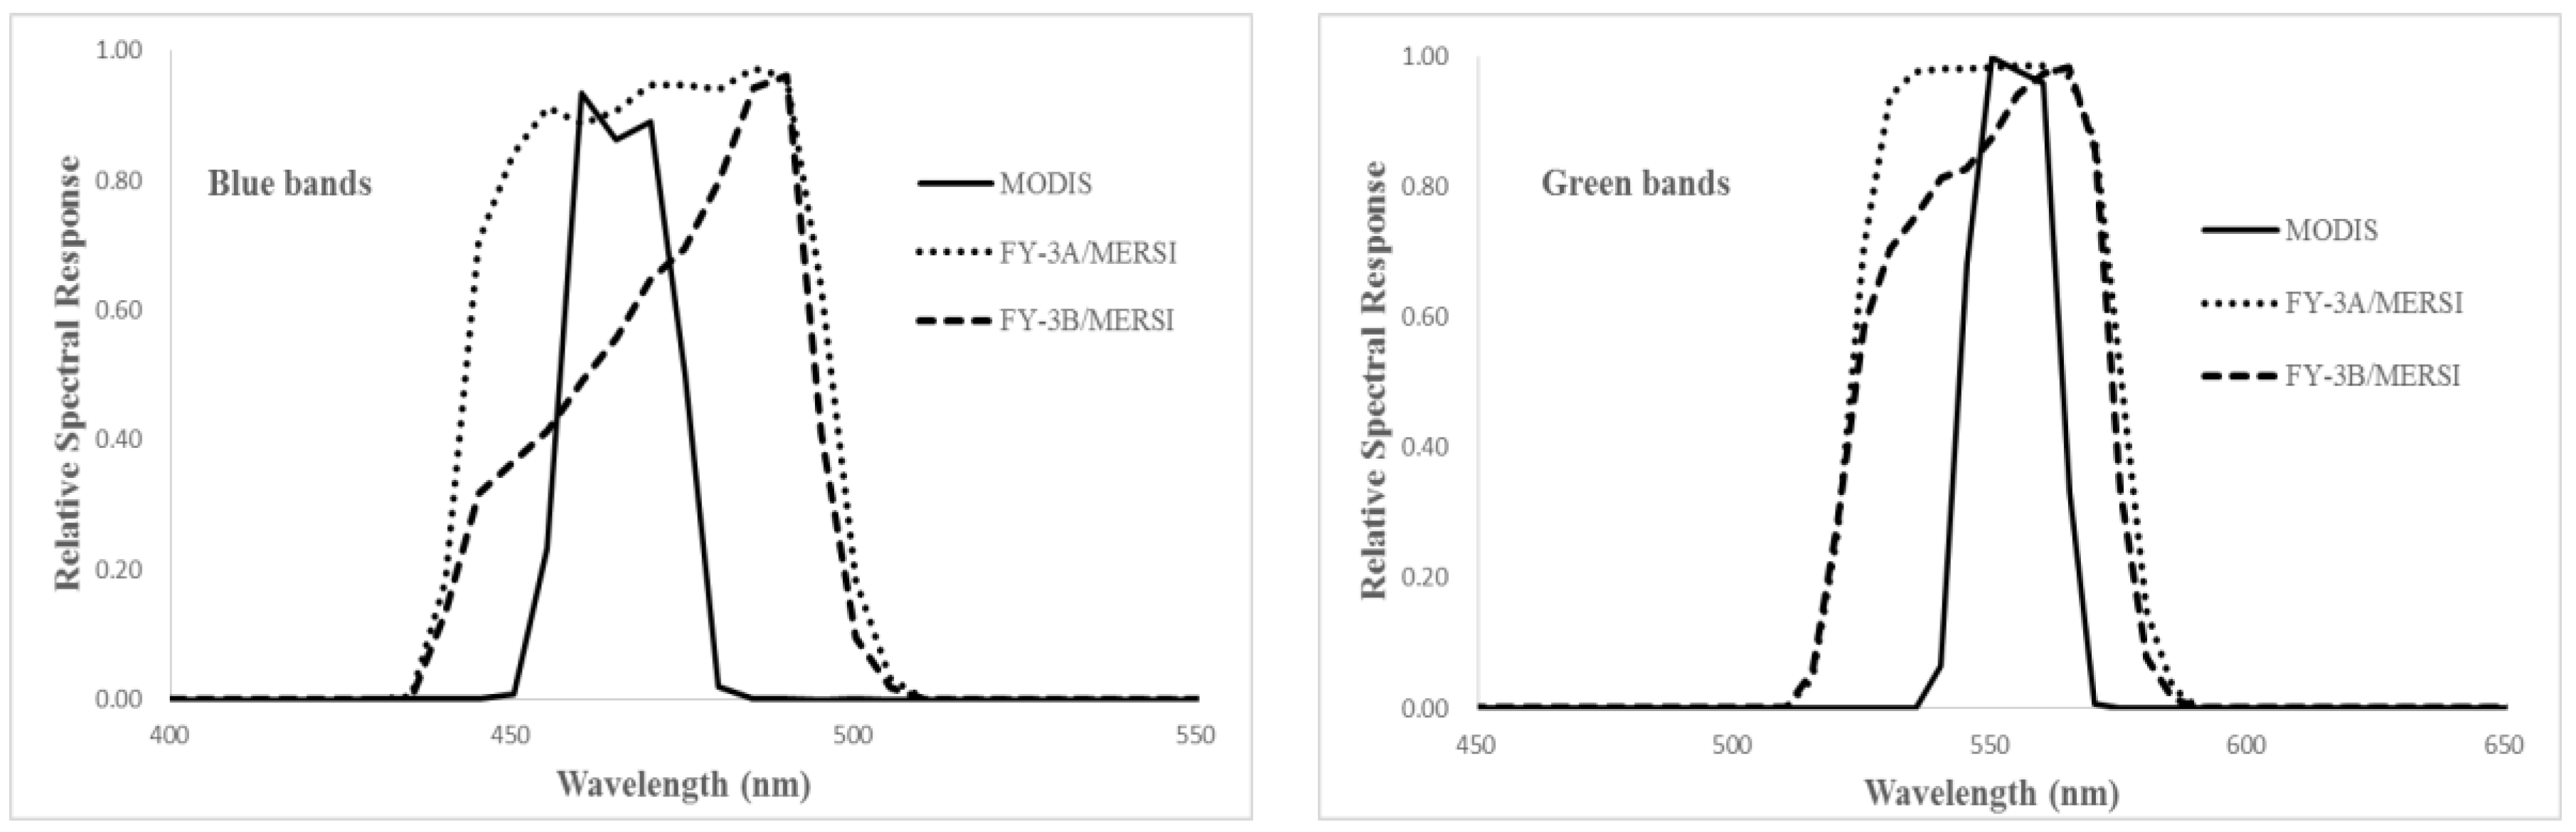
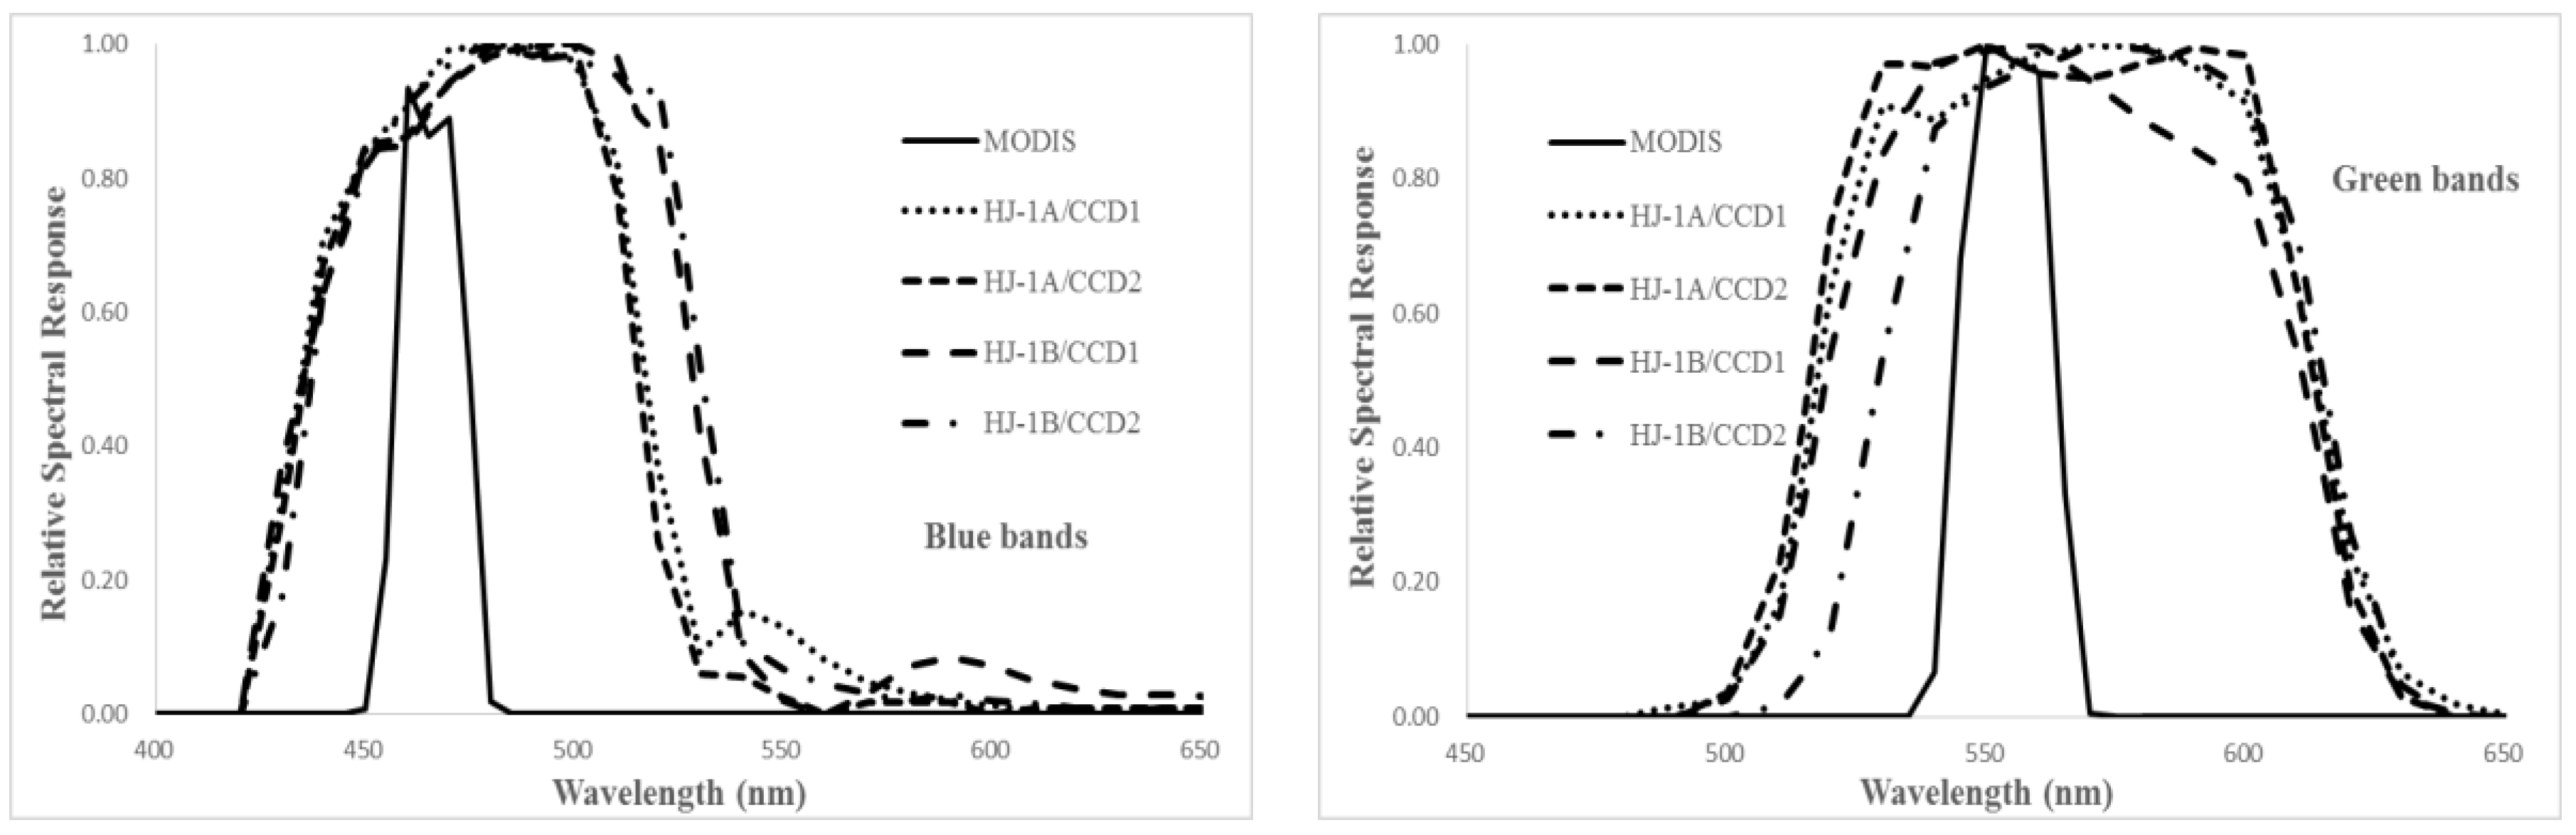
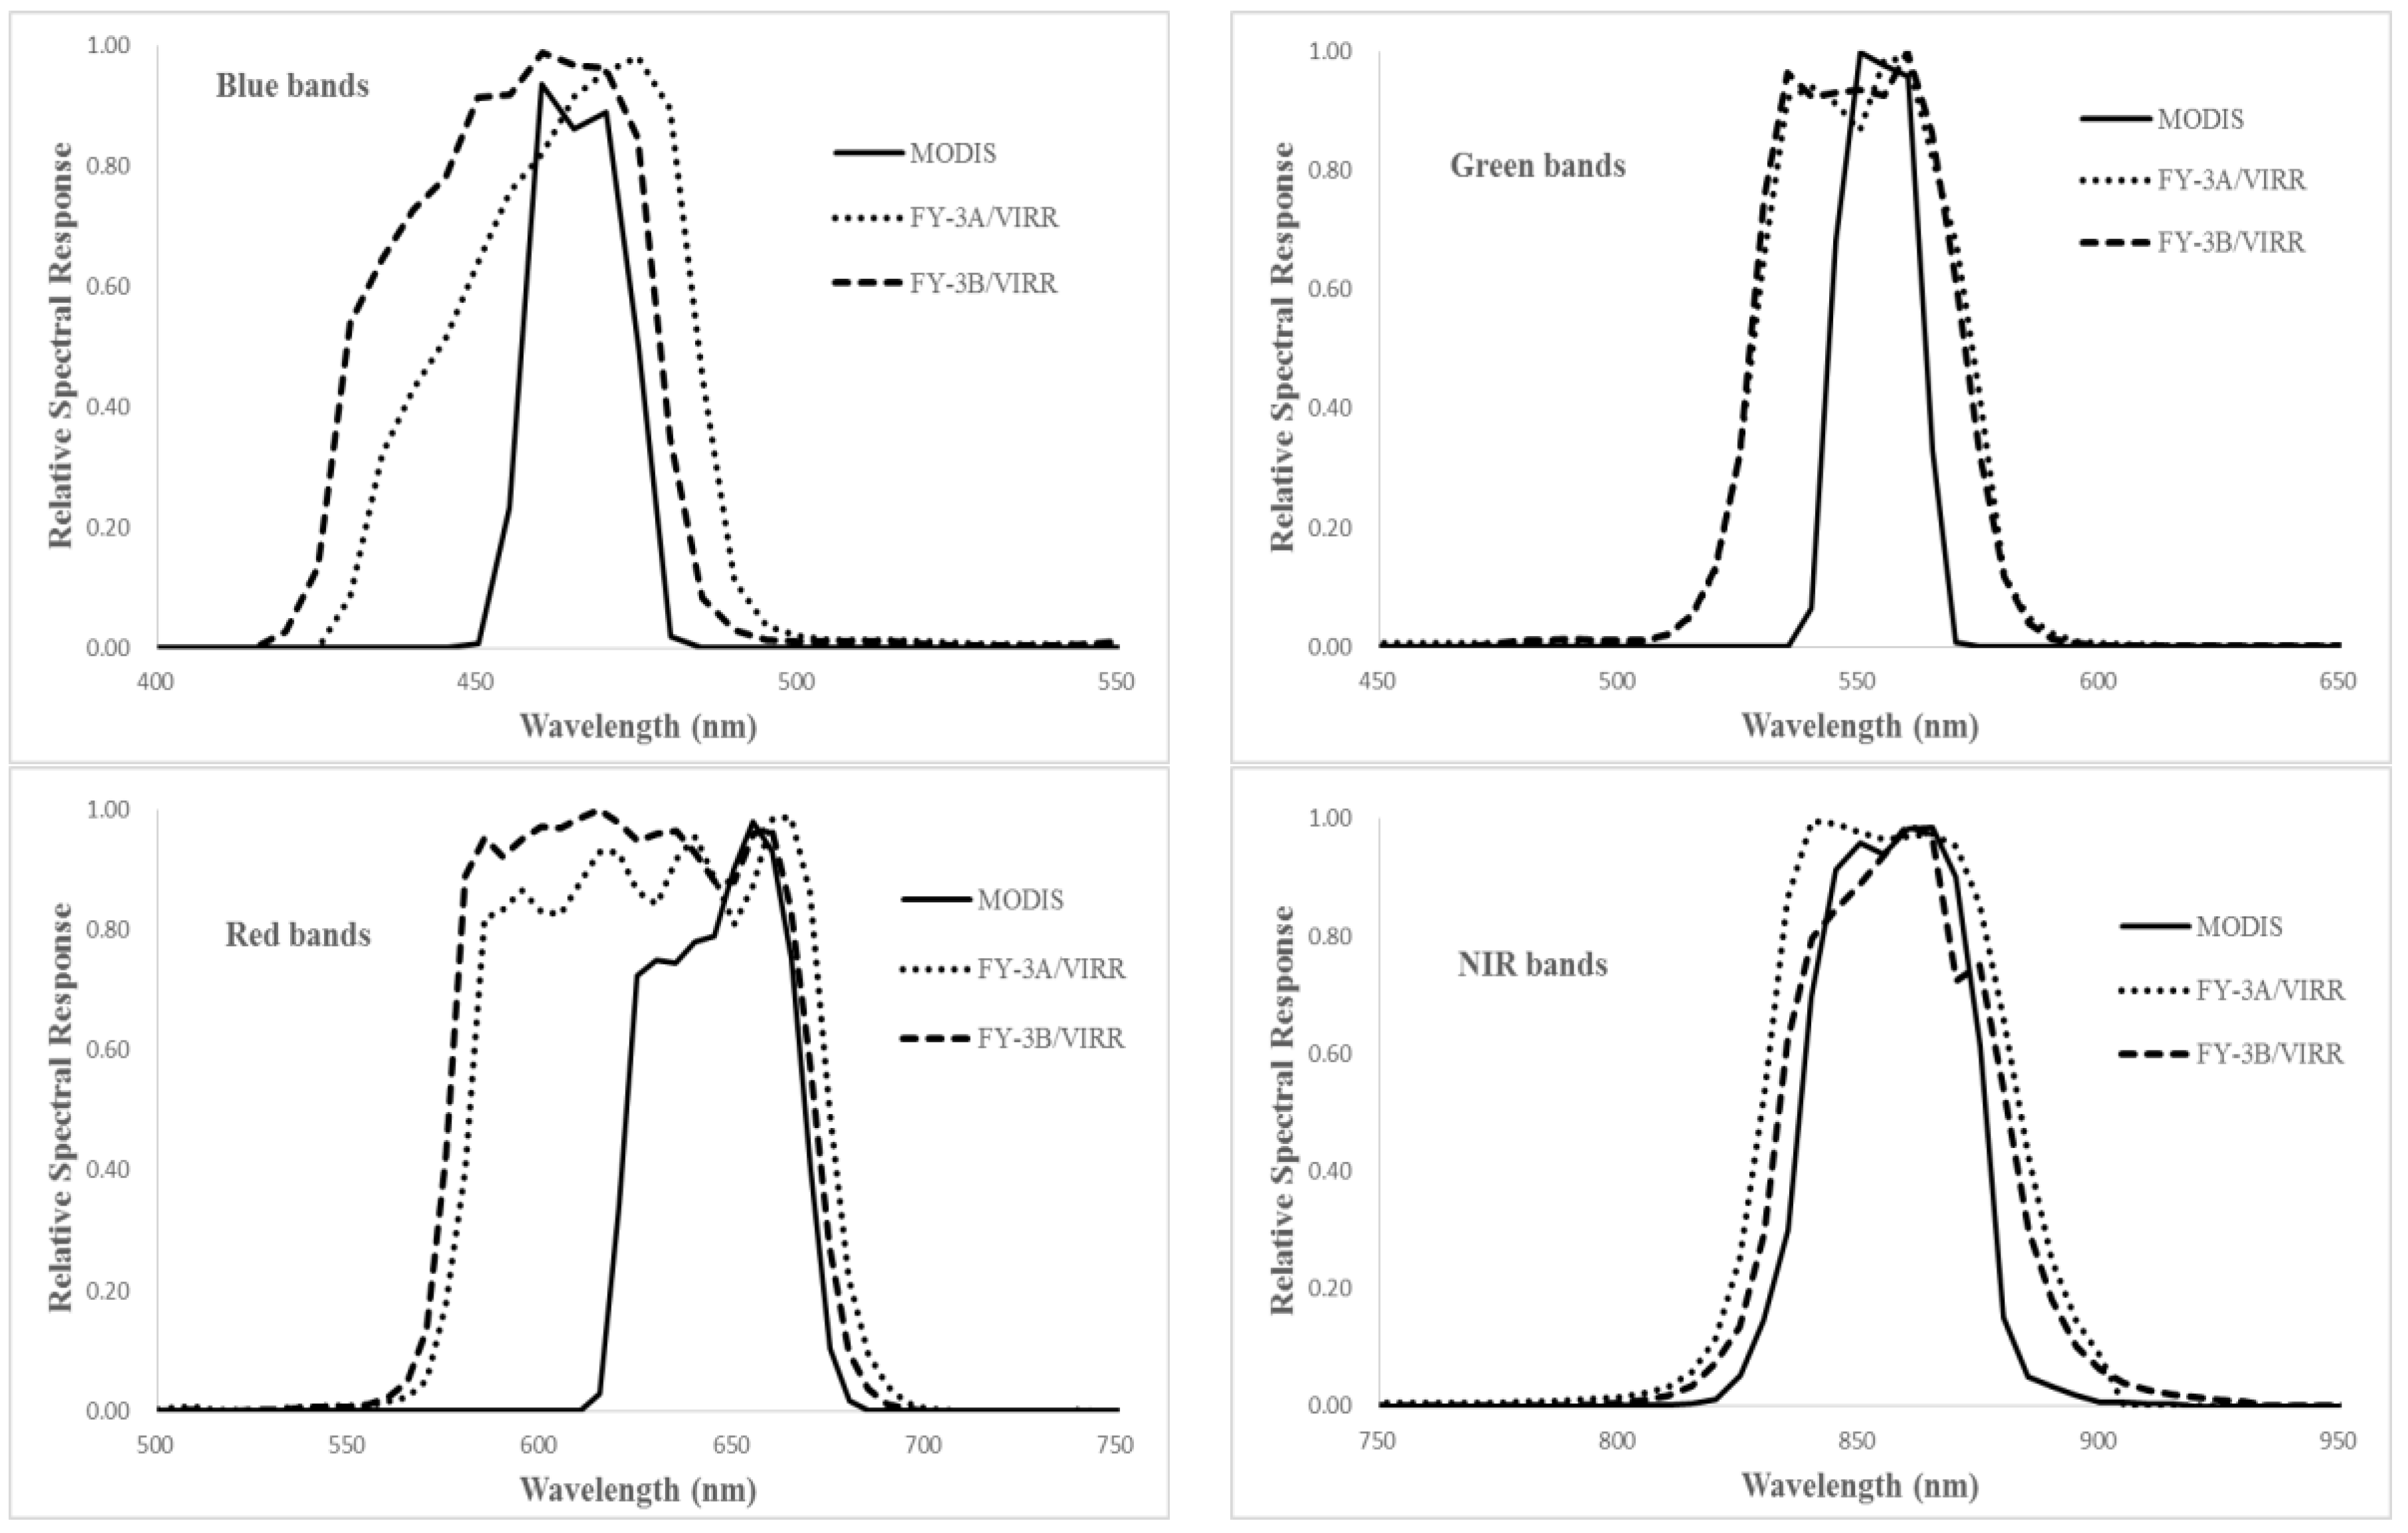
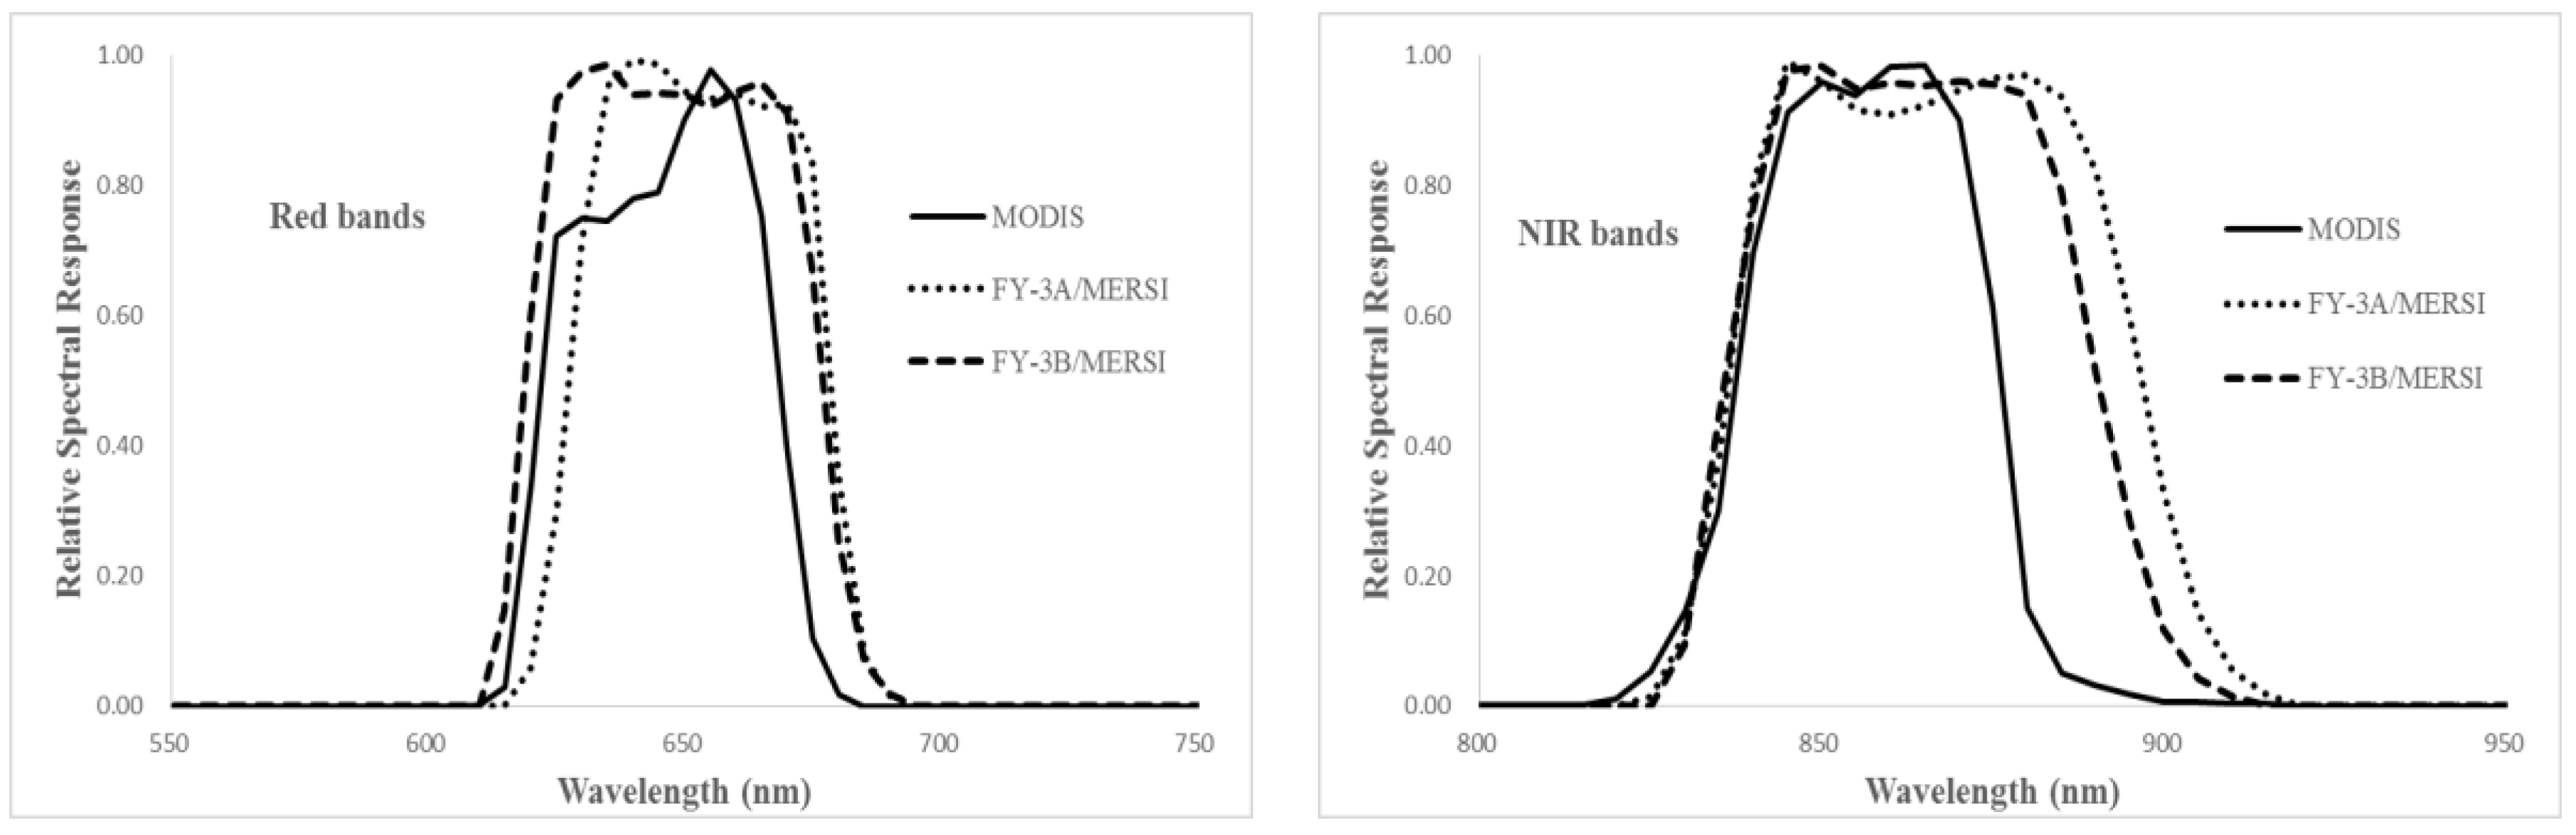
2.3.2. Spectral Matching
2.3.3. Evaluation Method
- (1)
- Slope: the slope of the fitted line for long-term tendency of the TOA reflectance at the calibration site indicates the radiometric stability of a sensor. When a slope value is close to 0, it means the TOA reflectance remains stable. A positive slope means an increasing tendency of TOA reflectance and a negative one means a decreasing tendency.
- (2)
- Maximum and minimum values: the maximum value and minimum value indicate the largest and smallest TOA reflectance within the long time TOA reflectance, respectively. If the maximum value is within the proper range, it is usually induced by some self-factors, such as intra-annual variation, observation angles, solar angles, aerosols, and so on; however, if the maximum value is out of the proper range, it indicates that some external factors are working.
- (3)
- Mean value: the mean value indicates the average of the TOA reflectance.
- (4)
- Standard deviation. The standard deviation is a measure that is used to quantify the amount of variation or dispersion of a set. A low standard deviation indicates that the elements tend to be close to the mean of the set, while a high standard deviation indicates that the elements are spread out over a wider range of values. The standard deviation can be calculated using the Equation (8):where represents serial number of the selected images, is the mean value of the TOA reflectance, and is the value of the TOA reflectance difference.
3. Results and Discussion
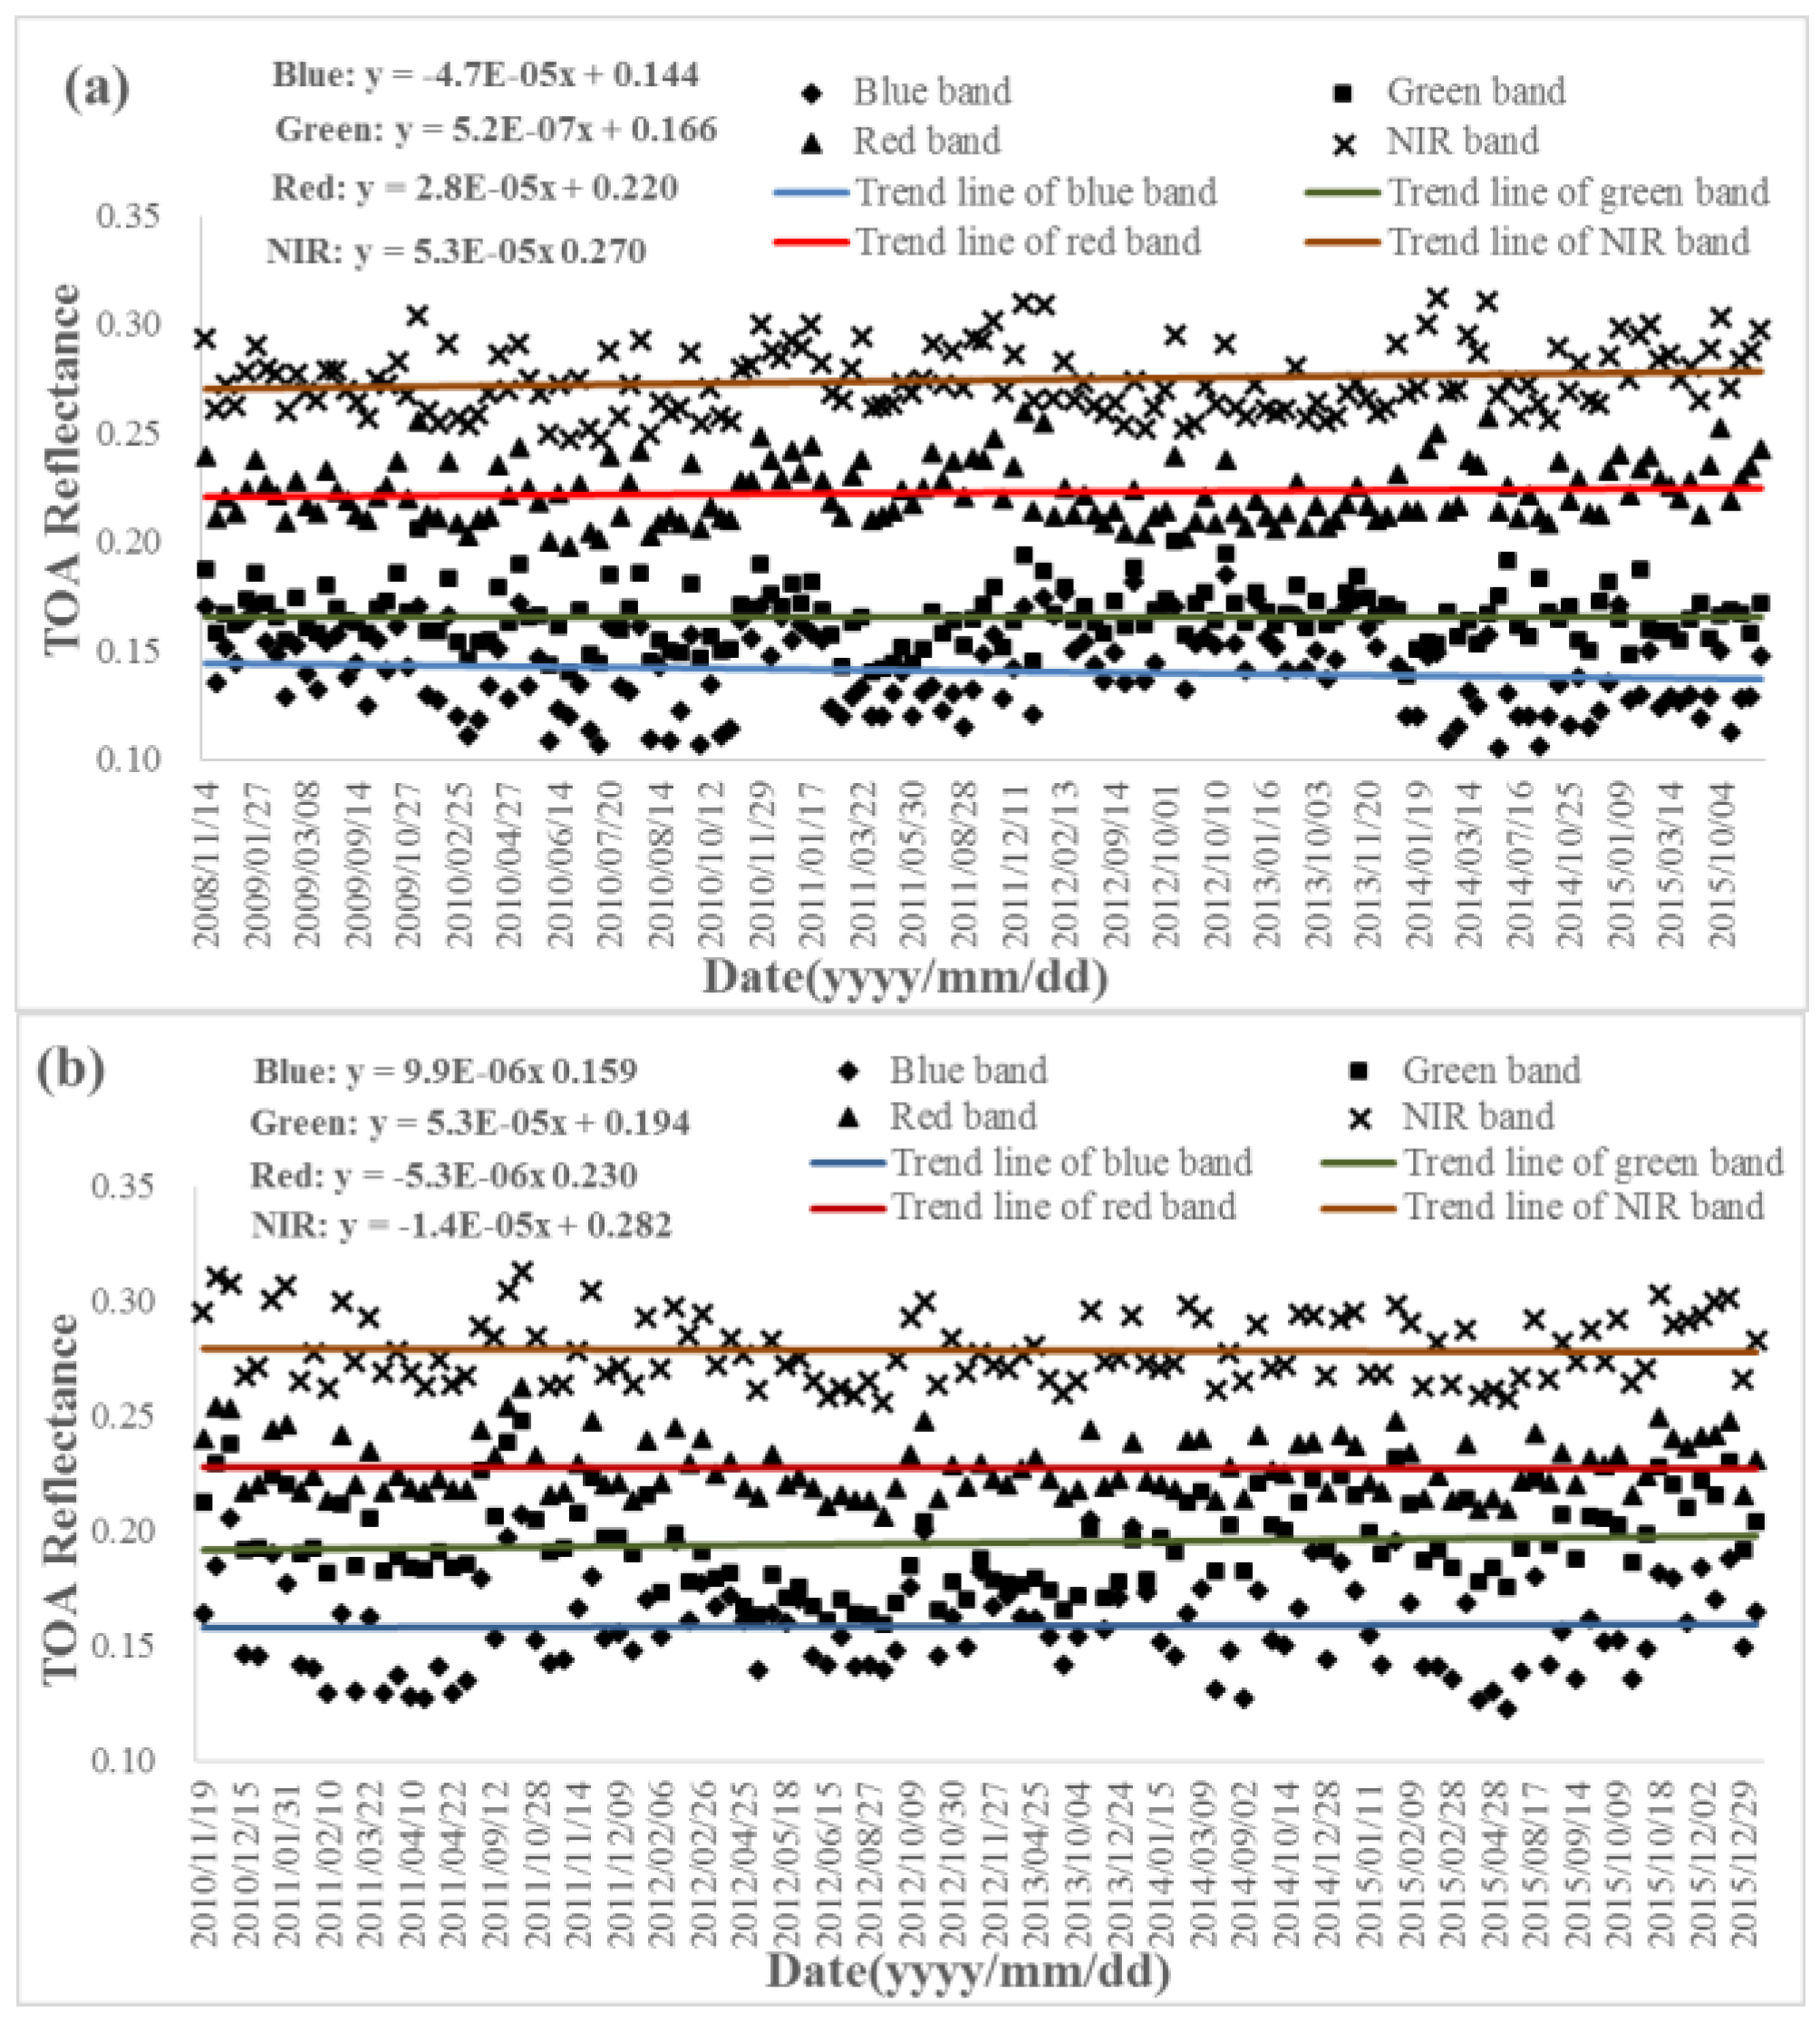
3.1. Radiometric Capability Evaluation of Moderate Resolution Imaging Spectroradiometer (MODIS)
- (1)
- The difference between maximum and minimum values indicates the range of TOA reflectance variation. The blue band usually has a larger variation than the other three bands and the variation becomes smaller and smaller with an increasing wavelength, because the TOA reflectance at a shorter wavelength incorporates more scattering radiation from the atmosphere, and the atmospheric effect becomes stronger with the increasing of aerosols. For example, the difference of TOA reflectance at the blue band for Terra is 0.185 − 0.106 = 0.079; compared to the mean TOA reflectance of 0.14, the variation reaches 0.079/0.14 = 56.43%. The variations of the other three bands are 40.96%, 27.80%, and 23.72% respectively. In addition, the minimum, maximum, and the values close to the minimum and the maximum appear for most of the years, which clarifies that the maximum and minimum are not abnormal values but rather the normal ones, and that the aerosol condition varies day by day, though the variation is very similar year by year.
- (2)
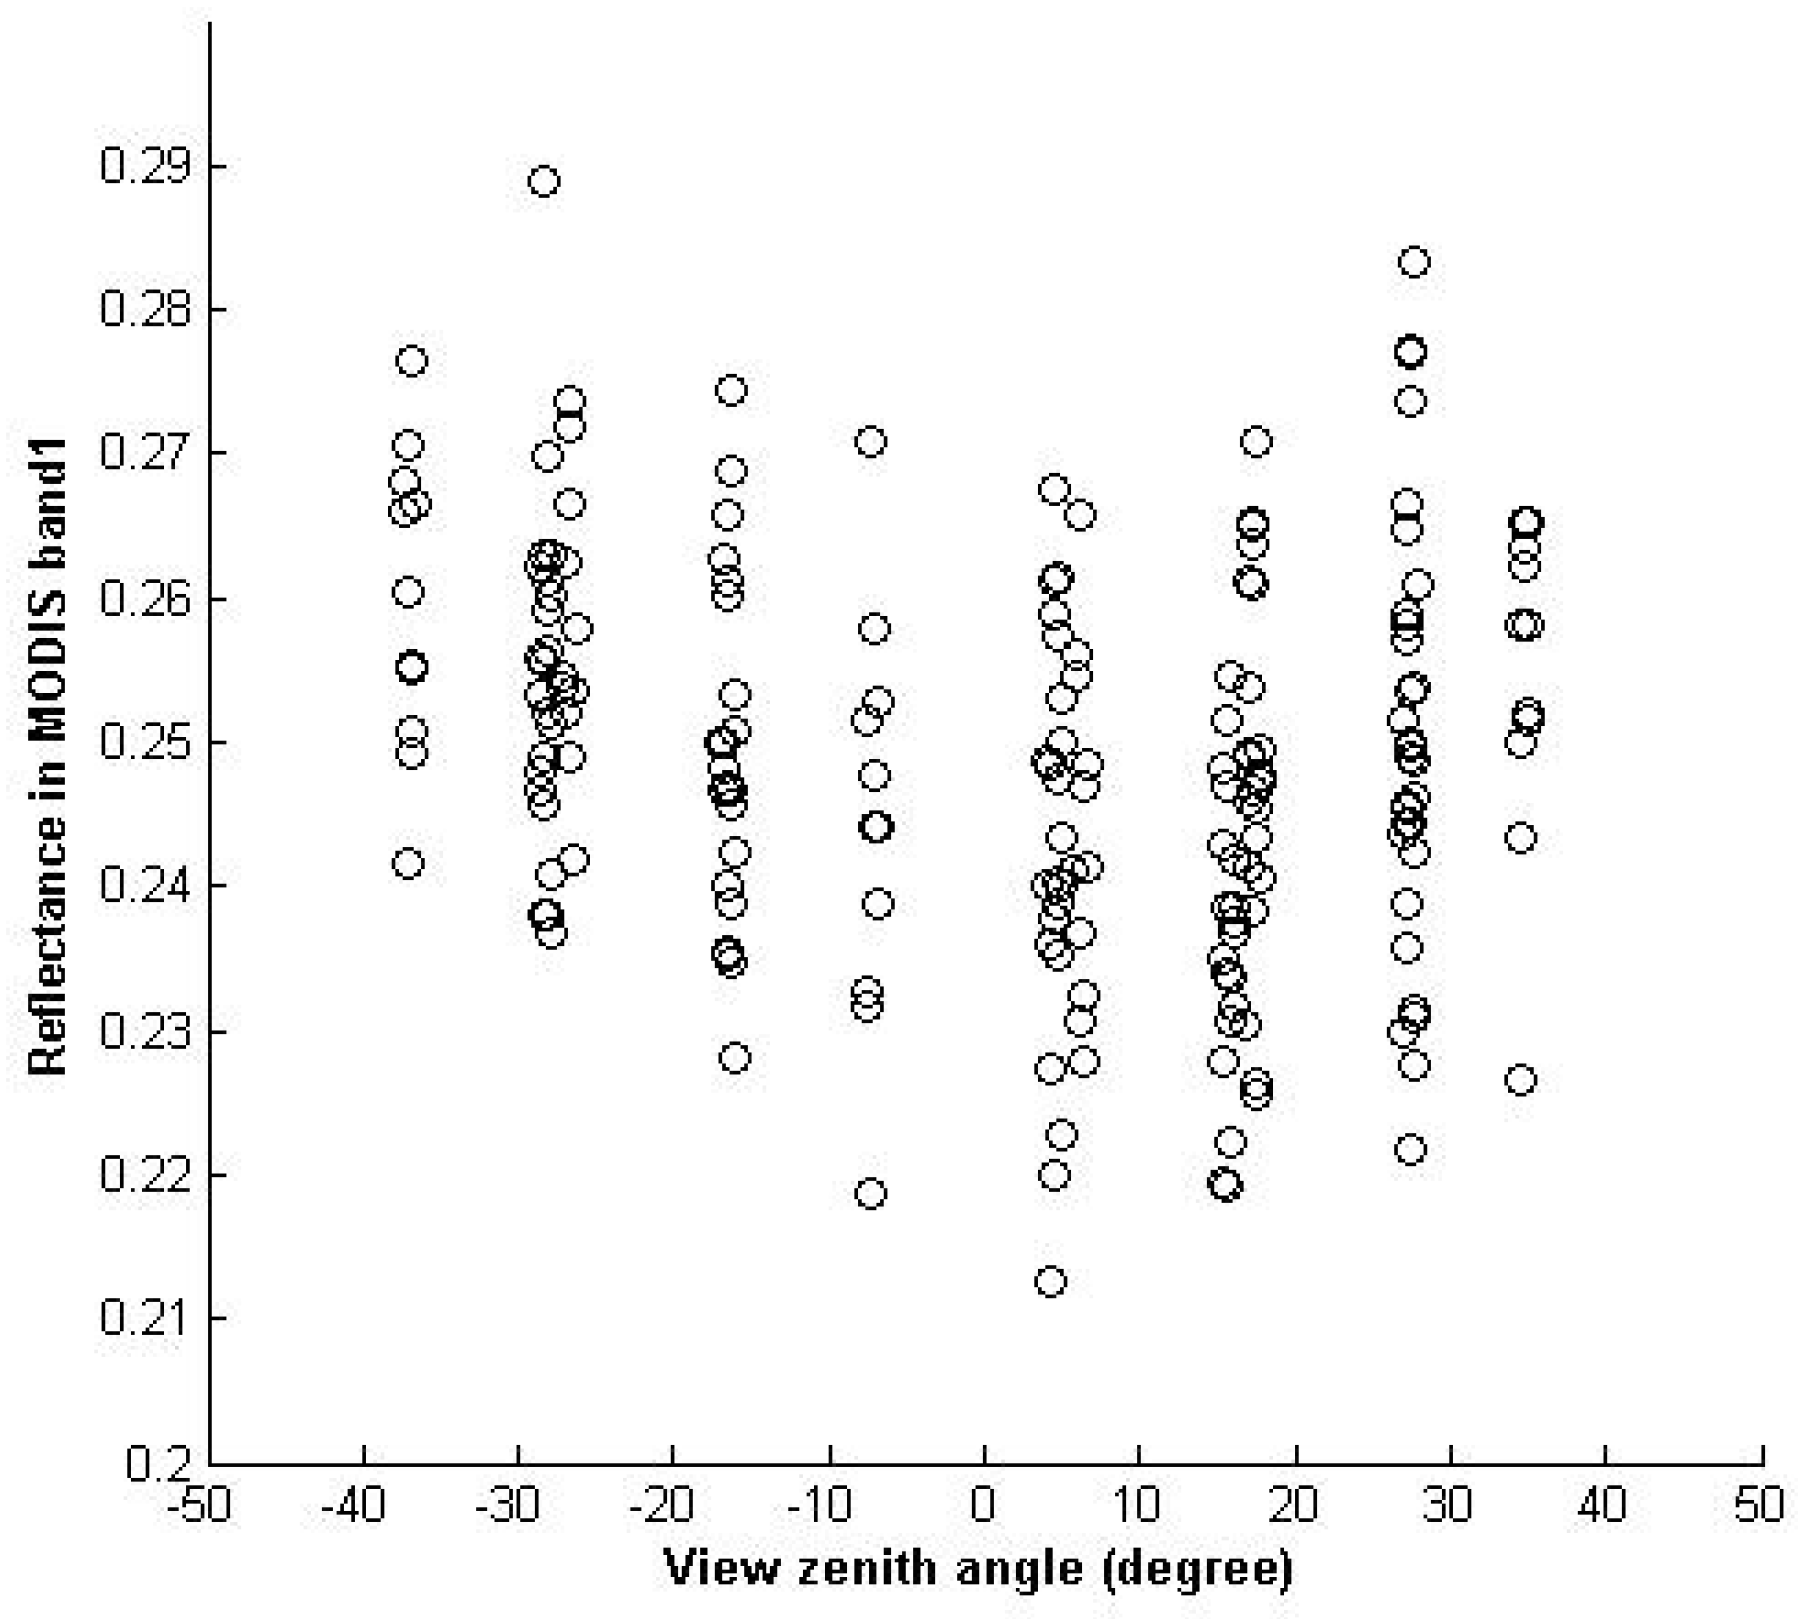
- Besides the atmospheric effect, the BRDF also contributes to the variation of the TOA reflectance. Figure 7 gives an example of the directional effect of the red band of Terra/MODIS. The reflectance varies with relative azimuth and solar zenith angle for each bin of view zenith angle, which shows systematic variation that is due to directional effects. The directional effect is about 15%.
- (3)
- The mean of TOA reflectance at the same band are usually a little bit different, especially at the blue and red bands. The radiometric accuracy of Aqua is slightly better than that of Terra [28].
3.2. Radiometric Capability Evaluation of Huan Jing 1/Charge-Coupled Device (HJ-1/CCD)
- (1)
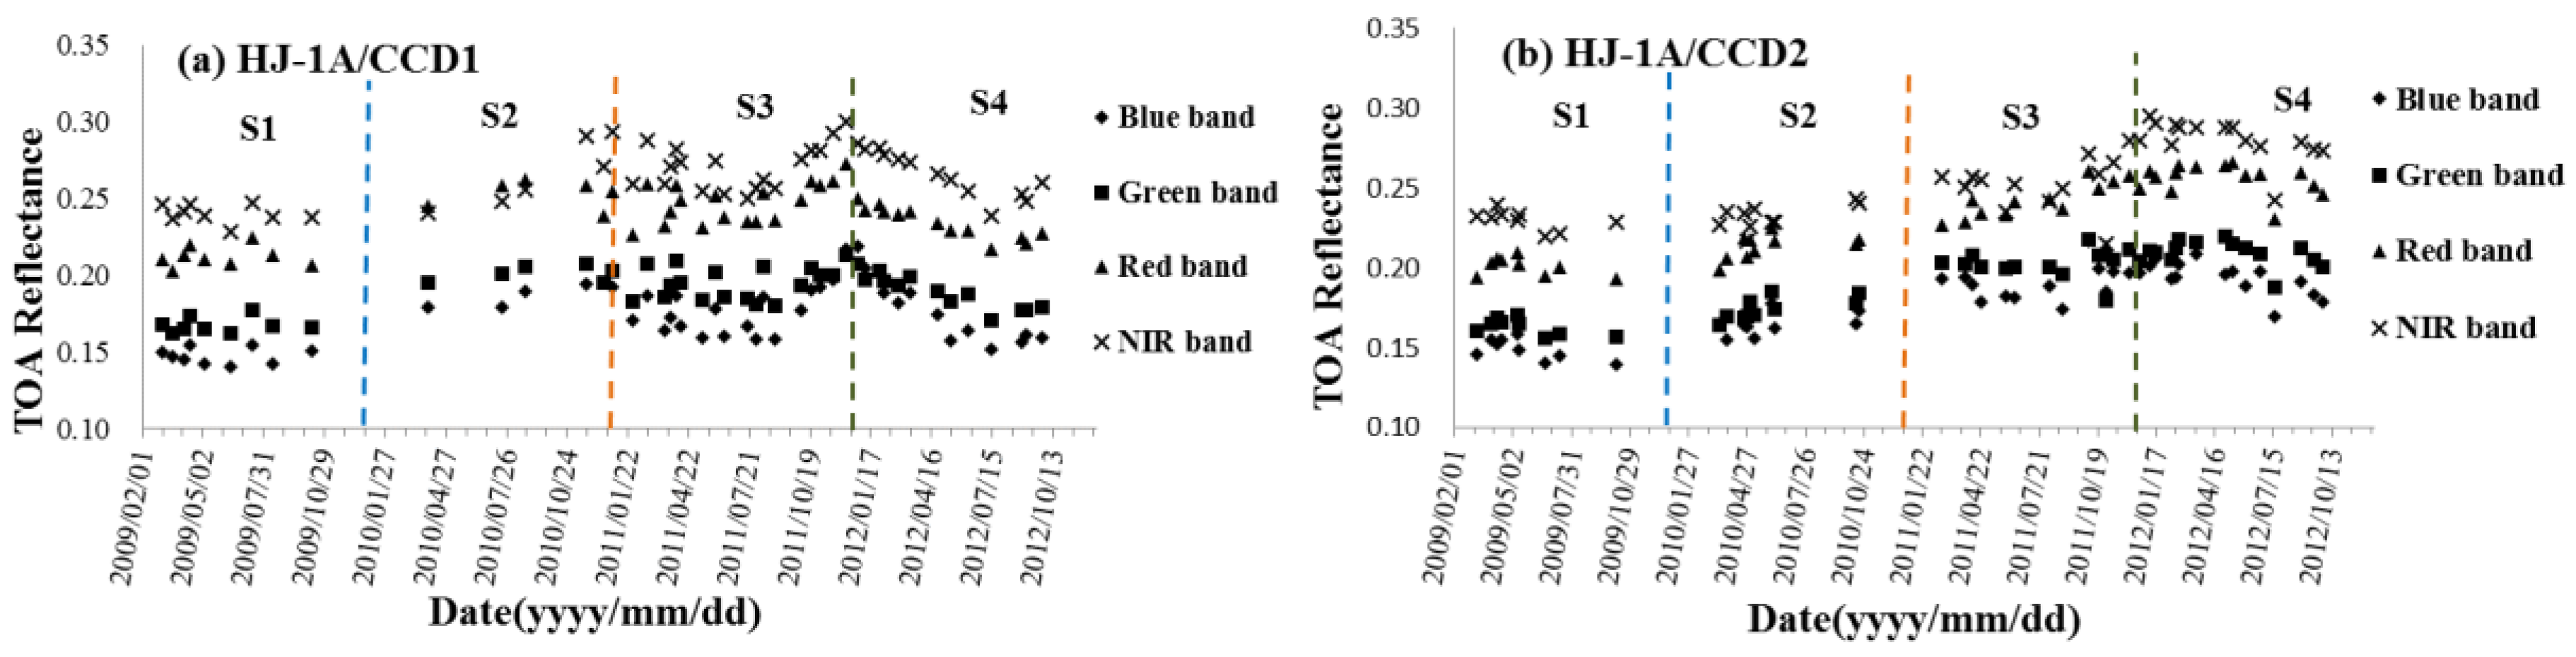
- For HJ-1A/CCD1 (Table 8), the TOA reflectance in 2009 is the most stable, especially the blue band with a slope at the 10−7 level. A gradual decreasing tendency is observed in 2012 for all bands (slopes all less than 0). The TOA reflectance tendency in 2011 in blue and NIR bands do not agree with the linear rule; consequently, their slopes are not calculated. The highest variation of TOA reflectance occurs in 2011 in blue band, up to (0.2193 − 0.1585)/0.1795 = 33.87%, while the lowest occurs in 2010 in the green band: 6.32%. The mean TOA reflectances of HJ-1A/CCD1 after spectral matching are all higher than that of MODIS in the blue and green bands from 2009–2012, while lower than that of MODIS in the NIR bands of the four years. All the standard deviations of the TOA reflectance are within 0.02, and the lowest standard deviations occur in 2009 (0.0054 for blue band, 0.0052 for green band, 0.0067 for red band, and 0.0062 for NIR band, respectively).
- (2)
- For HJ-1A/CCD2 (Table 9), the TOA reflectance in 2011 is the most stable, especially the blue band with a slope at the 10−6 level. A gradual decreasing tendency is observed in 2009 and 2012 for all bands, while the increasing tendency is observed in 2010 and 2011 for all bands. The highest variation of TOA reflectance occurs in 2011 in the NIR band, up to 25.30%, while the lowest occurs in 2009 in the red band: 7.91%. Blue bands of HJ-1A/CCD2 in 2009, 2010 and 2012 have the largest variation over the other three bands. The mean TOA reflectances of HJ-1A/CCD2 after spectral matching are higher than those of MODIS except the red and NIR bands in 2009 and 2010, and the NIR band in 2011. All the standard deviations of the TOA reflectances are within 0.02, and the lowest standard deviations occur in 2009 (0.0069 for blue band, 0.0052 for green band, 0.0057 for red band, and 0.0063 for NIR band, respectively).
- (3)
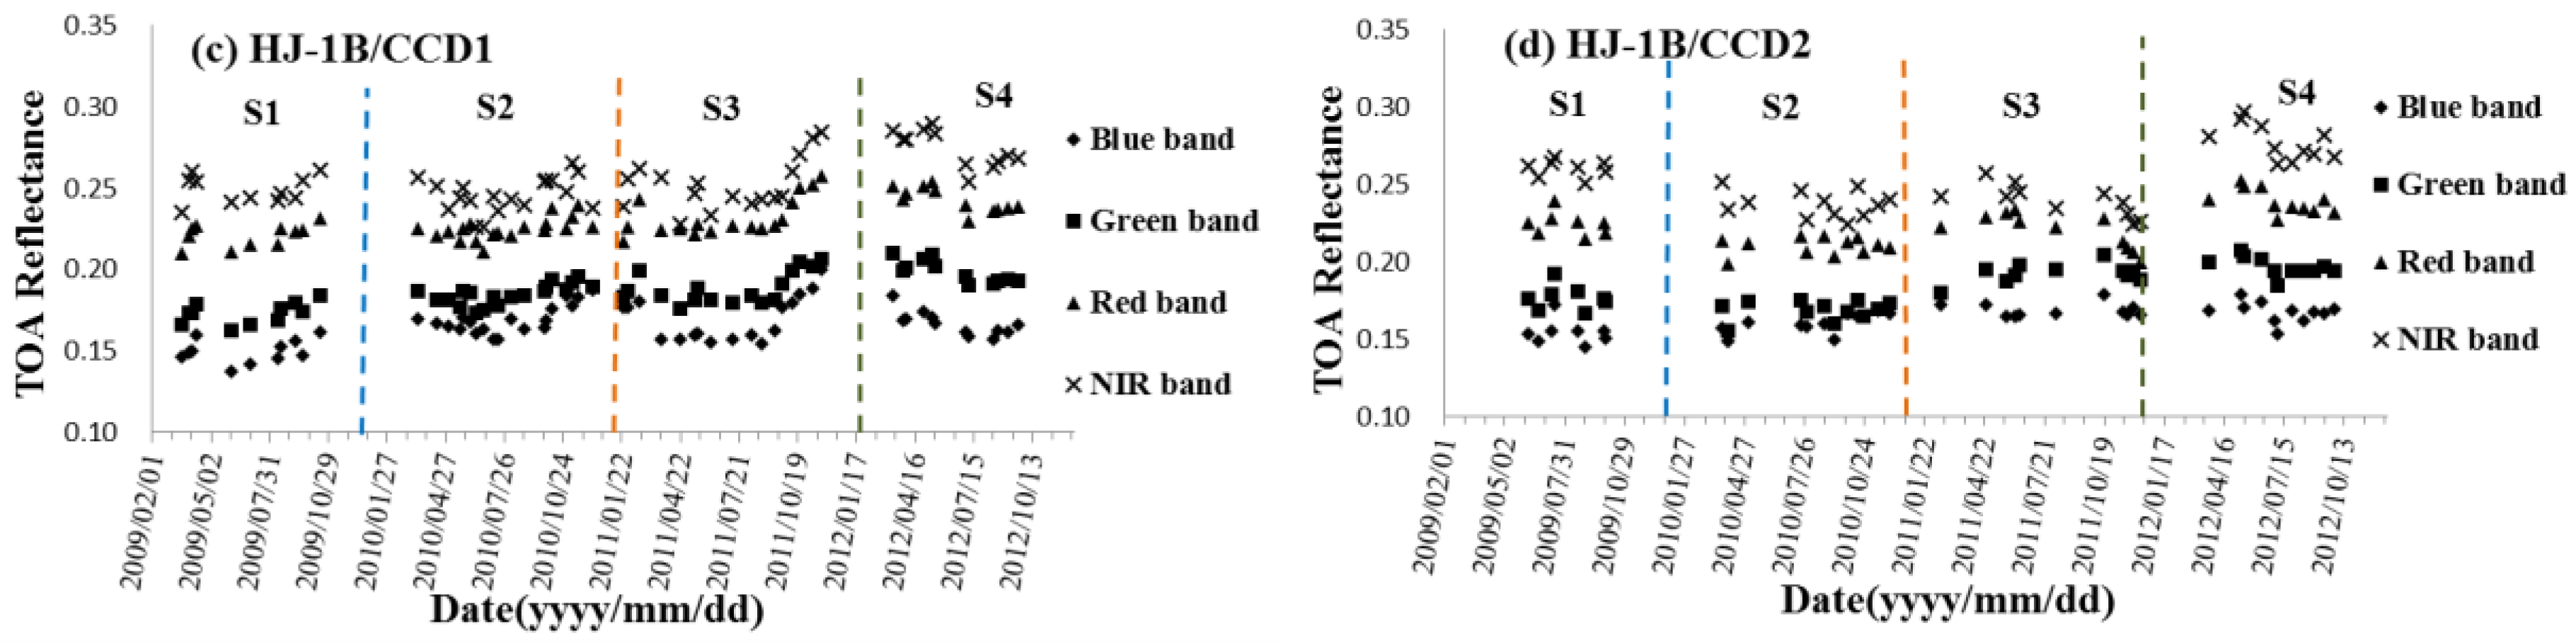
- For HJ-1B/CCD1 (Table 10), the TOA reflectance in 2009 is the most stable due to the slopes in the four bands being smaller than the other three years. A gradual decreasing tendency is observed in 2012 for all bands, while the increasing tendency is observed in 2009 for all bands. The TOA reflectance tendency in 2010 in the blue band and 2011 in all the four bands do not agree with linear rule; consequently, their slopes are not calculated. The highest variation of TOA reflectance occurs in 2011 in the blue band, up to 26.94%, while the lowest occurs in 2012 in the green band: 9.76%. Blue bands of HJ-1B/CCD1 have the largest variation over the other three bands. The mean TOA reflectances after spectral matching are higher than those of MODIS, except the NIR bands in 2009, 2010, and 2011. All the standard deviations of the TOA reflectance are within 0.02, and the lowest standard deviations occur in 2009 (0.0072 for blue band, 0.0066 for green band, 0.0070 for red band, and 0.0084 for NIR band, respectively).
- (4)
- For HJ-1B/CCD2 (Table 11), the TOA reflectance in 2009 is the most stable. A gradual decreasing tendency is observed in 2014 for all bands. The TOA reflectances’ tendency in 2011 in red and NIR bands do not agree with linear rule and their slopes are not calculated. The highest variation of TOA reflectance occurs in 2009 in the eblue band, up to 17.63%, while the lowest occurs in 2009 in the NIR band: 6.35%. Blue bands of HJ-1B/CCD1 have the largest variation of the four bands except in 2011. The mean TOA reflectances after spectral matching are higher than those of MODIS except the NIR bands in 2009, 2010, and 2011, and red band in 2010. All the standard deviations of the TOA reflectances are within 0.02, and the lowest standard deviations in blue, green, red and NIR bands occur in 2011 (0.0044), 2012 (0.0061), 2010 (0.0056) and 2009 (0.0055), respectively.
- (5)
- Both the TOA reflectances in blue and green bands of the four CCDs are higher than those of the MODIS, while the TOA reflectance in the red band is much closer to that of the MODIS. However, almost all the TOA reflectances in NIR bands are lower than those of the MODIS.
- (6)
- Compared to the HJ-1A/CCDs, the HJ-1B/CCDs are more stable because almost all the slopes of the TOA reflectance tendency of HJ-1B/CCDs are lower than those of the HJ-1A/CCDs in the corresponding year and band.
- (7)
- At the beginning of the operation of an instrument, the vicarious calibration once a year is maybe enough to ensure the radiometric capability; however, it cannot guarantee the radiometric capability after the beginning stage of the operation. Subsequently, some new and highly frequent calibration methods need to be proposed and executed by the instruments’ surveillance department.
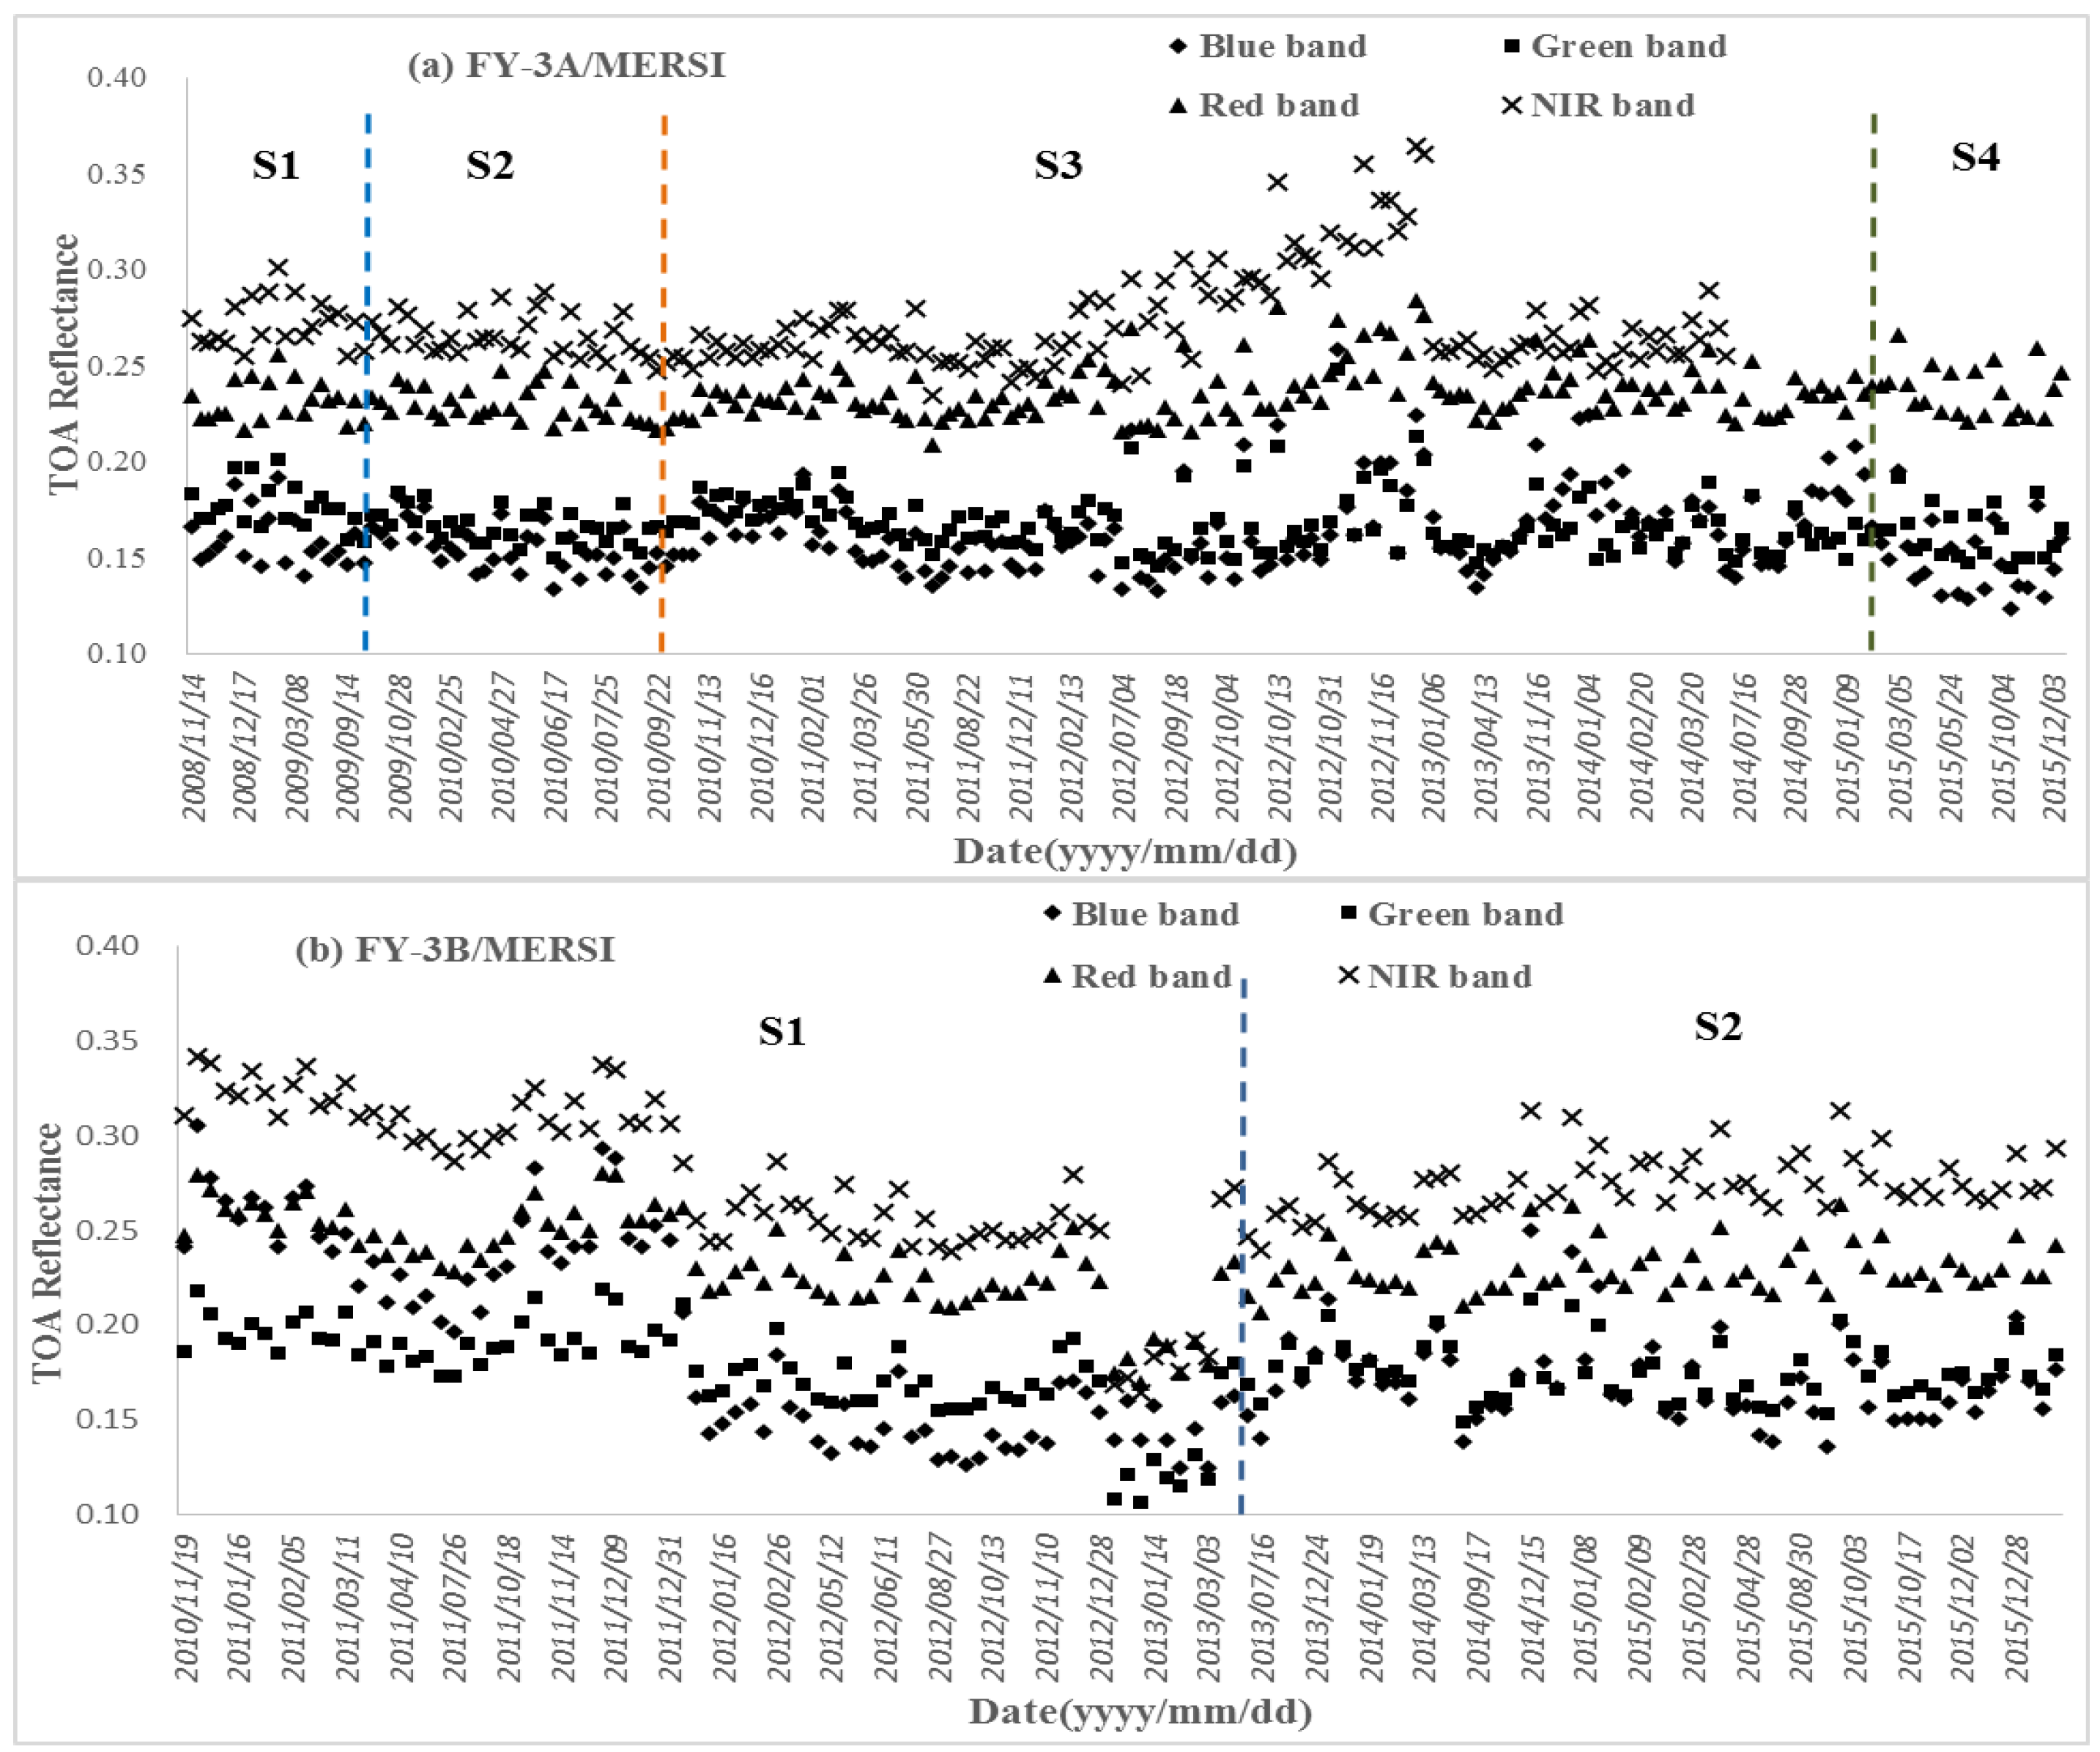
3.3. Radiometric Capability Evaluation of Feng Yun 3/Medium-Resolution Spectral Imager (FY-3/MERSI)
- (1)
- The stability of FY-3A/MERSI is very good at all times except the duration from February to December of 2012, when a strongly increasing trend occurred. Although calibration coefficients have been updated four times, the variation of the TOA reflectance remains consistent. The reasons inducing the abnormal increasing within stage 3 is unknown and we surmise that it may be caused by an instrument malfunction. After it was found by the surveillance department, a manual adjustment was made and the instrument suddenly became normal. The statistics for FY-3A/MERSI are calculated, excluding the instrument malfunction duration, and listed in Table 12. The slope values of the fitted lines for different bands are at the 10−5 level, which indicates a very small variation trending. The highest variation of TOA reflectance occurs in the blue band, up to 62.72%. The variations of the other three bands are 33.74%, 24.86%, and 25.52% respectively. The differences in four bands between the mean TOA reflectance after spectral matching and corresponding bands of MODIS are all less than 0.015. All the standard deviations of the TOA reflectance are within 0.02. After the malfunction duration is removed, the stability and accuracy are very close to that of MODIS.
- (2)
- The stability of FY-3B/MERSI has a two-stage mode. At the first stage, three sub-stages are very obvious. An obvious over-estimation of the TOA reflectance appears at the first sub-stage; the second sub-stage has a close estimation; the third sub-stage has an under-estimation. The three sub-stages changed suddenly, so manual adjustments of the instrument were executed by the surveillance department. However, the radiometric stability and accuracy have become better and very close to the MODIS’s. Only the statistics of the second stage are calculated and listed in Table 12. The TOA reflectance in green and red bands has a tendency towards lightly decreasing because all the slopes are at the 10−4 level and greater than 0. The highest variation of TOA reflectance occurs in the blue band, up to 41.75%. The variations of the other three bands are 28.52%, 20.75%, and 18.39% respectively. The differences in four bands between the mean TOA reflectance after spectral matching and corresponding bands of MODIS are less than 0.015 except the green band (0.023). All the standard deviations of the TOA reflectance are within 0.02. The stability and accuracy of FY-3B/MERSI in the second stage are very good.
- (3)
- Although both the two MERSIs have very low frequency of calibration, the stability remains very good; however, with the degradation of the instruments after a long operation, it is difficult to retain very good radiometric capability with very low frequent calibrations. Moreover, high frequent calibrations can find the instruments’ malfunction timely.
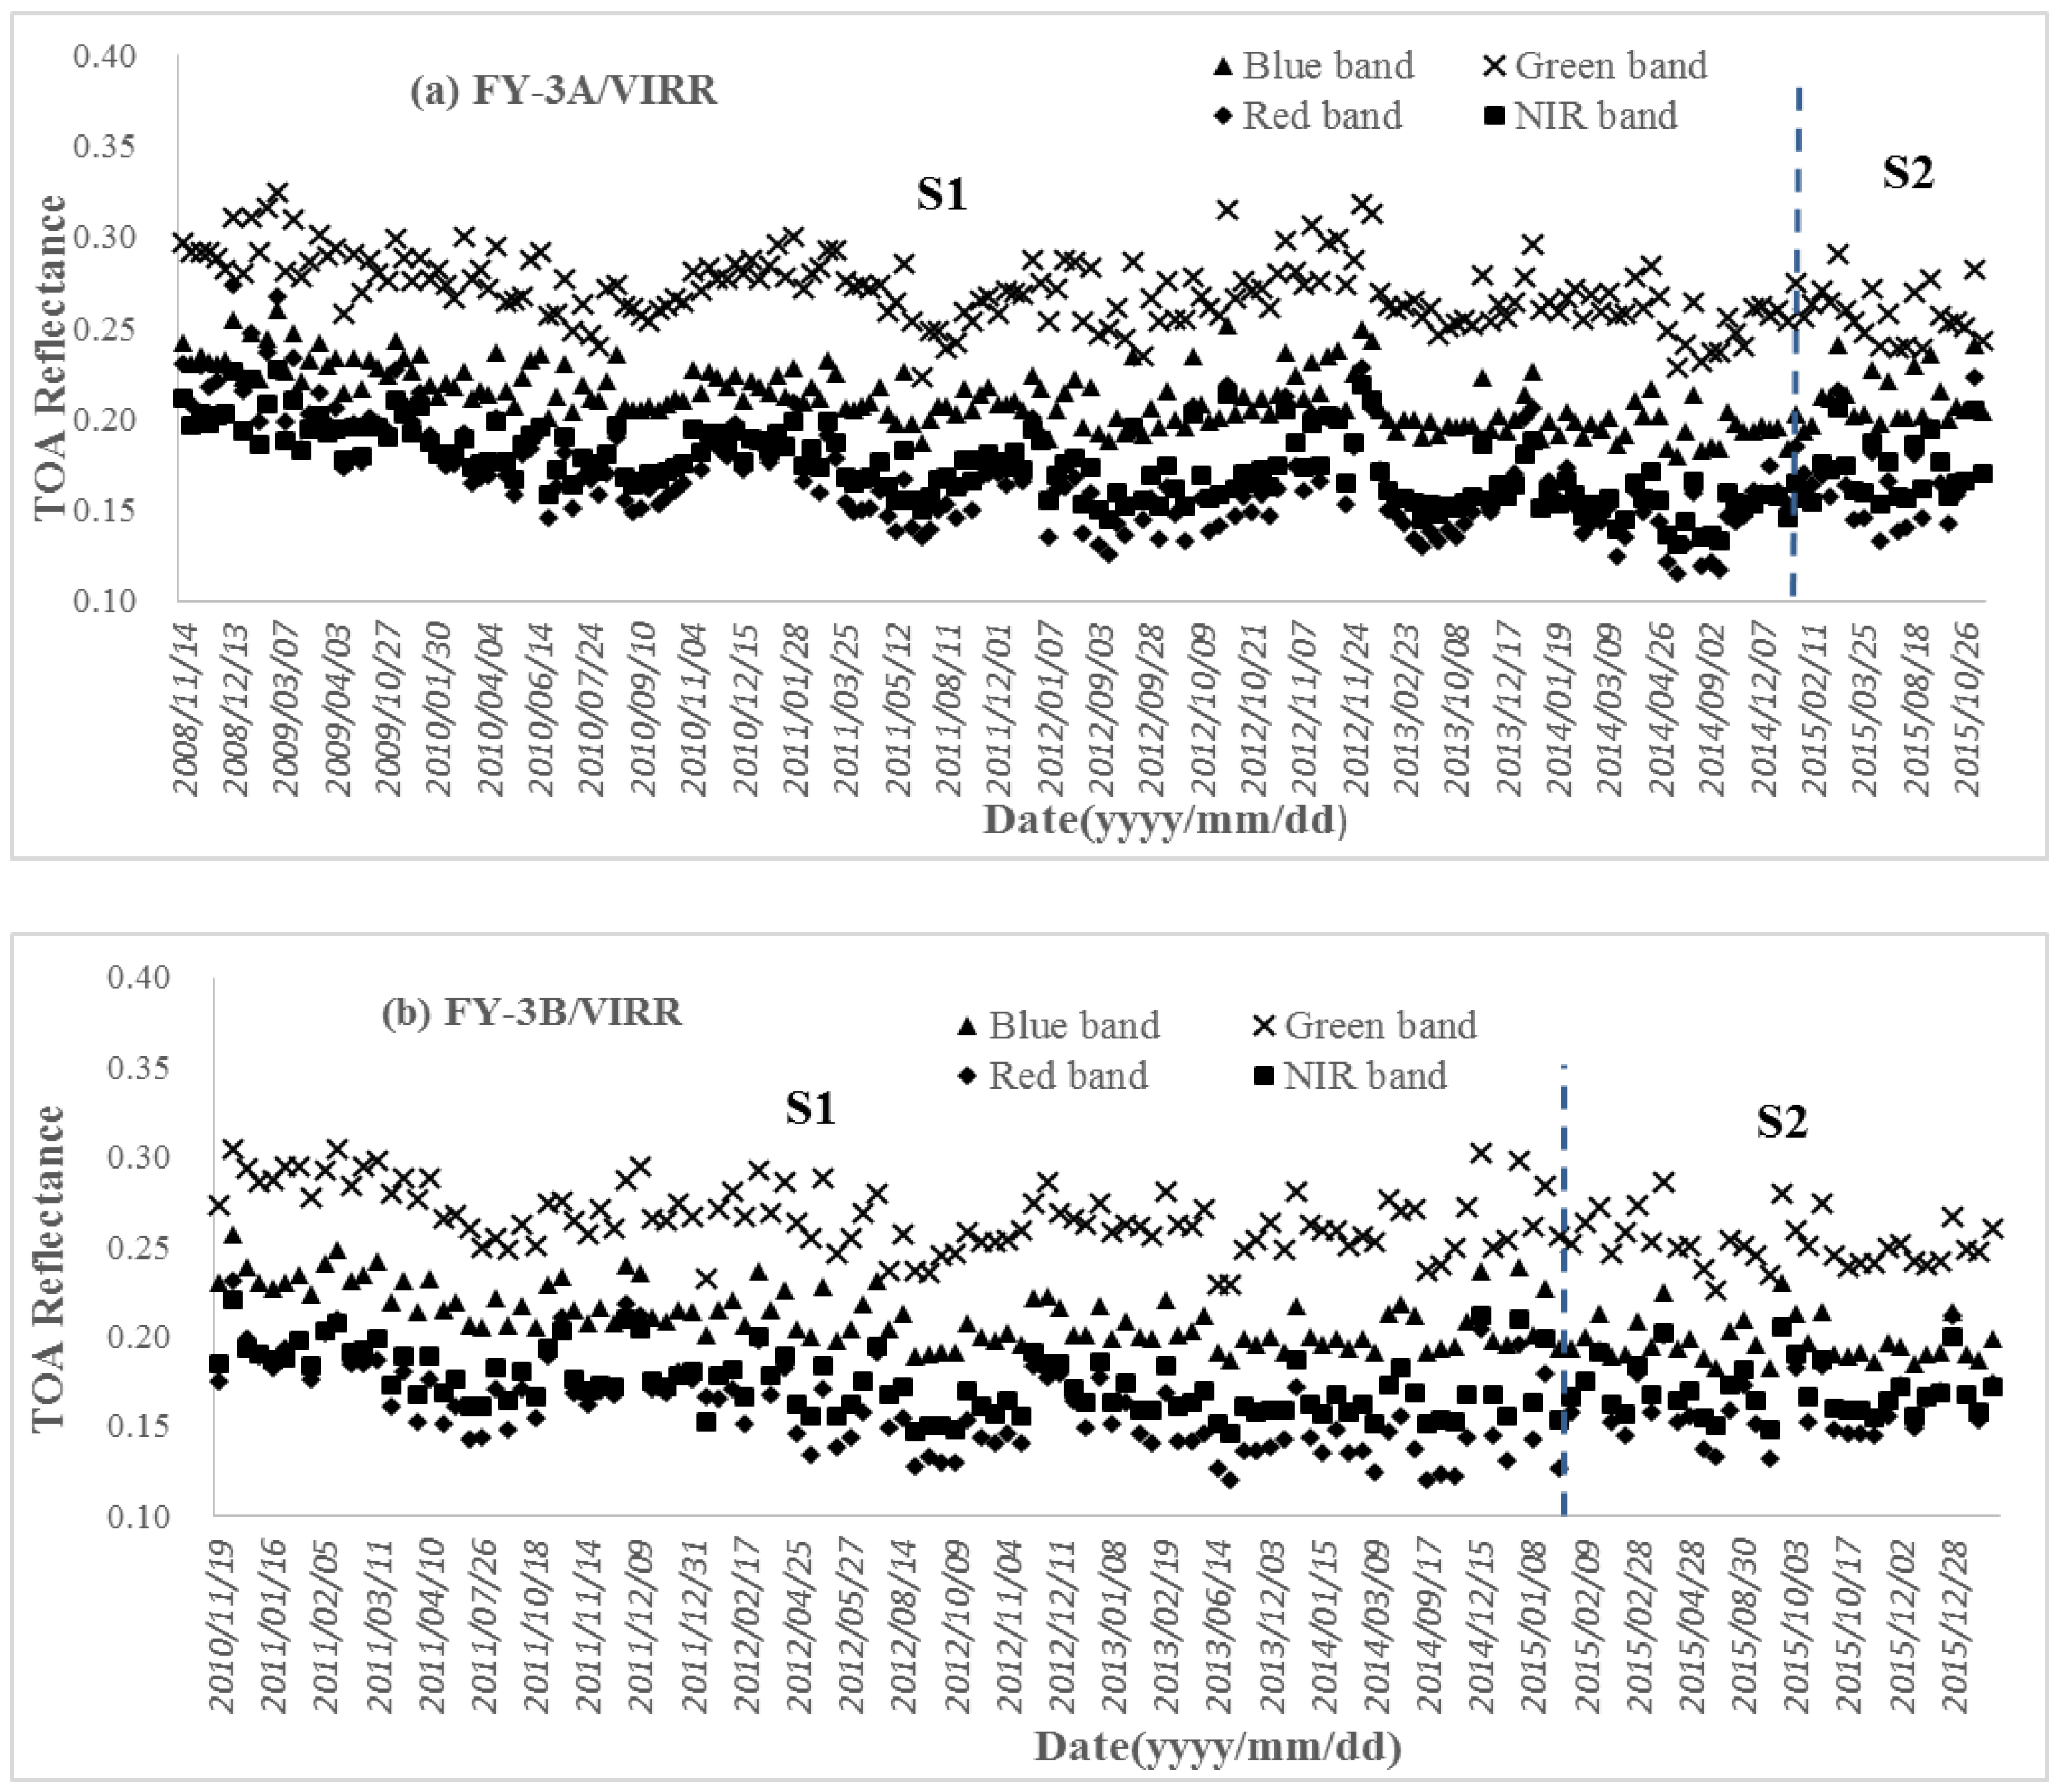
3.4. Radiometric Capability Evaluation of FY-3/Visible and Infrared Radiometer (VIRR)
- (1)
- Both VIRRs have a tendency toward obvious decreasing in their first calibration stages. The reason for the trend can probably be attributed to the degradation of the instruments. At the beginning of the operations of VIRRs, the TOA reflectance in the four bands are abnormally high, especially in the blue band and even higher in the green band. After further investigated and constant adjustment, the instruments became normal and stable in the second stage. The statistics are calculated and listed in Table 13.
- (2)
- For the FY-3A/VIRR, the variations of the four bands are 39.42%, 24.48%, 18.60%, and 15.01% respectively. The differences in four bands between the mean TOA reflectance after spectral matching and corresponding bands of MODIS are all less than 0.02. All the standard deviations of the TOA reflectance are within 0.02.
- (3)
- For the FY-3B/VIRR, the variations of the four bands are 43.27%, 31.65%, 21.68%, and 23.90% respectively. Only the difference in blue band between the mean TOA reflectance after spectral matching and MODIS is close to 0 (0.0004). The mean TOA reflectance of the FY-3B/VIRR after spectral matching in other three bands are less than that of MODIS and the differences are higher than 0.02 (0.023 for green band, 0.022 for red band and 0.028 for NIR band). All the standard deviations of the TOA reflectance are within 0.02.
- (4)
- Low frequency of calibrations is still a problem for VIRRS and a high frequent procedure for calibration could be a solution for the decreasing trend’s instability.
4. Conclusions
Acknowledgments
Author Contributions
Conflicts of Interest
References
- Li, J.; Chen, X.; Tian, L.; Yu, H.; Zhang, W. An evaluation of the temporal stability of HJ-1 CCD data using a desert calibration site and Landsat 7 ETM+. Int. J. Remote Sens. 2015, 36, 3733–3750. [Google Scholar] [CrossRef]
- Angal, A.; Xiong, X.; Choi, T.Y.; Chander, G.; Wu, A. Using the Sonoran and Libyan Desert test sites to monitor the temporal stability of reflective solar bands for Landsat 7 enhanced thematic mapper plus and Terra moderate resolution imaging spectroradiometer sensors. J. Appl. Remote Sens. 2010, 4, 043525. [Google Scholar]
- Sun, L.; Hu, X.; Guo, M.; Xu, N. Multisite calibration tracking for FY-3A MERSI solar bands. IEEE Trans. Geosci. Remote Sens. 2012, 50, 4929–4942. [Google Scholar] [CrossRef]
- Eplee, R.E., Jr.; Meister, G.; Patt, F.S.; Franz, B.A.; McClain, C.R. Uncertainty assessment of the SeaWiFS on-orbit calibration. Proc. SPIE 2011, 8153, 81530B. [Google Scholar]
- Wyatt, C. Radiometric Calibration: Theory and Methods; Academic Press: New York, NY, USA, 1978. [Google Scholar]
- Chen, G.W.; Chen, Z.C.; Ma, L.; Zhang, H. Monitoring and assessment on radiometric stability of HJ-1A CCD using MODIS data. In Proceedings of the Eighth International Symposium on Multispectral Image Processing and Pattern Recognition, Wuhan, China, 26–27 October 2013; pp. 89211I-1–89211I-8.
- NOAA Office of Satellite and Product Operations. Available online: http://www.ospo.noaa.gov/Products/ ppp/index.html (accessed on 26 July 2013).
- Jin, Y.Q.; Lu, N.; Lin, M. Advancement of Chinese meteorological Feng-Yun (FY) and oceanic Hai-Yang (HY) satellite remote sensing. Proc. IEEE 2010, 98, 844–861. [Google Scholar]
- Pan, D. Future-generation satellites of Chinese ocean remote sensing. Proc. SPIE 2004, 5570, 228–232. [Google Scholar]
- Zhang, Y.; Zheng, M.; Xiong, J.; Lu, Y.; Xiong, X. On-orbit geometric calibration of ZY-3 three-line array imagery with multistrip data sets. IEEE Trans. Geosci. Remote Sens. 2014, 52, 224–234. [Google Scholar] [CrossRef]
- Li, J.; Chen, X.; Tian, L.; Ding, J.; Song, Q.; Yu, Z. On the consistency of HJ-1A CCD1 and Terra/MODIS measurements for improved spatio-temporal monitoring of inland water: A case in Poyang Lake. Remote Sens. Lett. 2015, 6, 351–359. [Google Scholar] [CrossRef]
- Odongo, V.O.; Hamm, N.A.; Milton, E.J. Spatio-temporal assessment of Tuz Gölü, Turkey as a potential radiometric vicarious calibration site. Remote Sens. 2015, 6, 2494–2513. [Google Scholar] [CrossRef]
- Kaufman, Y.J.; Sendra, C. Algorithm for automatic atmospheric corrections to visible and near-IR satellite imagery. Int. J. Remote Sens. 1988, 9, 1357–1381. [Google Scholar] [CrossRef]
- Zhong, B.; Zhang, Y.; Du, T.; Yang, A.; Lv, W.; Liu, Q. Cross-calibration of HJ-1/CCD over a desert site using Landsat ETM imagery and ASTER GDEM product. IEEE Trans. Geosci. Remote Sens. 2014, 52, 7247–7263. [Google Scholar] [CrossRef]
- Sun, L.; Xu, N.; Hu, X.; Rong, Z.; Yang, Z.; Lu, N. The radiometric performance of FY-3A/B MERSI reflective solar bands. Proc. SPIE 2014, 9264, 92640U. [Google Scholar]
- Kim, W.; Cao, C.; Liang, S. Assessment of radiometric degradation of Fy-3A MERSI reflective solar bands using TOA reflectance of pseudoinvariant calibration sites. IEEE Geosci. Remote Sens. Lett. 2014, 11, 793–797. [Google Scholar]
- Xu, N.; Chen, L.; Hu, X.; Zhang, L.; Zhang, P. Assessment and correction of on-orbit radiometric calibration for FY-3 VIRR thermal infrared channels. Remote Sens. 2014, 6, 2884–2897. [Google Scholar] [CrossRef]
- Hu, X.; Liu, J.; Sun, L.; Rong, Z.; Li, Y.; Zhang, Y.; Gu, X. Characterization of CRCS Dunhuang test site and vicarious calibration utilization for Fengyun (FY) series sensors. Can. J. Remote Sens. 2010, 36, 566–582. [Google Scholar] [CrossRef]
- Chander, G.; Xiong, X.J.; Choi, T.J.; Angal, A. Monitoring on-orbit calibration stability of the Terra MODIS and Landsat 7 ETM+ sensors using pseudo-invariant test sites. Remote Sens. Environ. 2010, 114, 925–939. [Google Scholar] [CrossRef]
- Xiong, X.; Sun, J.; Xie, X.; Barnes, W.L.; Salomonson, V.V. On-orbit calibration and performance of Aqua MODIS reflective solar bands. IEEE Trans. Geosci. Remote Sens. 2010, 48, 535–546. [Google Scholar] [CrossRef]
- Angal, A.; Xiong, X.; Wu, A.; Chander, G.; Choi, T. Multitemporal cross-calibration of the Terra MODIS and Landsat 7 ETM+ reflective solar bands. IEEE Trans. Geosci. Remote Sens. 2013, 51, 1870–1882. [Google Scholar] [CrossRef]
- Xiong, X.; Sun, J.; Barnes, W.; Salomonson, V.; Esposito, J.; Erives, H.; Guenther, B. Multiyear on-orbit calibration and performance of Terra MODIS reflective solar bands. IEEE Trans. Geosci. Remote Sens. 2007, 45, 879–889. [Google Scholar] [CrossRef]
- Guenther, B.; Xiong, X.; Salomonson, V.V.; Barnes, W.L.; Young, J. On-orbit performance of the Earth Observing System Moderate Resolution Imaging Spectroradiometer; first year of data. Remote Sens. Environ. 2002, 83, 16–30. [Google Scholar] [CrossRef]
- Heidinger, A.K.; Cao, C.; Sullivan, J.T. Using Moderate Resolution Imaging Spectrometer (MODIS) to calibrate advanced very high resolution radiometer reflectance channels. J. Geophys. Res. Atmos. 2002, 107, AAC 11-1–AAC 11-10. [Google Scholar] [CrossRef]
- Vermote, E.F.; Saleous, N.Z. Calibration of NOAA16 AVHRR over a desert site using MODIS data. Remote Sens. Environ. 2006, 105, 214–220. [Google Scholar] [CrossRef]
- Teillet, P.M.; Fedosejevs, G.; Thome, K.J.; Barker, J.L. Impacts of spectral band difference effects on radiometric cross-calibration between satellite sensors in the solar-reflective spectral domain. Remote Sens. Environ. 2007, 110, 393–409. [Google Scholar] [CrossRef]
- Yang, A.; Zhong, B.; Lv, W.; Wu, S.; Liu, Q. Cross-Calibration of GF-1/WFV over a desert site using landsat-8/OLI imagery and ZY-3/TLC data. Remote Sens. 2015, 7, 10763–10787. [Google Scholar] [CrossRef]
- Wu, A.; Xiong, X.; Doelling, D.R.; Morstad, D.; Angal, A.; Bhatt, R. Characterization of Terra and Aqua MODIS VIS, NIR, and SWIR spectral bands’ calibration stability. IEEE Trans. Geosci. Remote Sens. 2013, 51, 4330–4338. [Google Scholar] [CrossRef]


| Satellite | Sensor | Band | Spectral Range (nm) | Spatial Resolution (m) | Revisit Period (Days) | Orbit Altitude (km) | Local Equator-Crossing Time | Field of View Angle (°) |
|---|---|---|---|---|---|---|---|---|
| HJ-1A/B | CCD1 and CCD2 | Blue | 430–520 | 30 | 4 days for one satellite; 2 days for A and B together | 649 | 10:30 a.m. in descending node | 31 |
| Green | 520–600 | 30 | ||||||
| Red | 630–690 | 30 | ||||||
| Near infrared | 700–900 | 30 | ||||||
| FY-3 | MERSI | Blue | 445–495 | 250 | 5.5 | 836 | FY-3A/MERSI: 10:30 a.m. in descending node FY-3B/MERSI: 1:30 a.m. in ascending node | 55.4 |
| Green | 525–575 | 250 | ||||||
| Red | 630–678 | 250 | ||||||
| Near infrared | 838–893 | 250 | ||||||
| FY-3 | VIRR | Blue | 431–490 | 1100 | 5.5 | 836 | FY-3A/VIRR: 10:30 a.m. in descending node FY-3B/VIRR: 1:30 a.m. in ascending node | 55.4 |
| Green | 518–581 | 1100 | ||||||
| Red | 573–684 | 1100 | ||||||
| Near infrared | 820–898 | 1100 | ||||||
| Terra/Aqua | MODIS | Blue | 459–479 | 500 | 5.5 | 705 | Terra/MODIS: 10:30 a.m. in descending node Aqua/MODIS: 1:30 a.m. in ascending node | 55.4 |
| Green | 545–565 | 500 | ||||||
| Red | 620–670 | 250 | ||||||
| Near infrared | 841–876 | 250 |
| HJ-1A/CCD1 | ||||||||
| Years | Blue Band | Green Band | Red Band | NIR Band | ||||
| Gain | Offset | Gain | Offset | Gain | Offset | Gain | Offset | |
| 2008 | 0.916 | 7.325 | 0.9228 | 6.0737 | 1.1277 | 3.6123 | 1.0753 | 1.903 |
| 2009 | 0.6925 | 7.325 | 0.7438 | 6.0737 | 0.9636 | 3.6123 | 1.0545 | 1.903 |
| 2010 | 0.7768 | 7.325 | 0.7796 | 6.0737 | 1.0312 | 3.6123 | 1.0049 | 1.903 |
| 2011 | 0.7696 | 7.325 | 0.7815 | 6.0737 | 1.0914 | 3.6123 | 1.0281 | 1.903 |
| 2012 | 0.7069 | 7.325 | 0.7497 | 6.0737 | 1.0673 | 3.6123 | 1.0429 | 1.903 |
| HJ-1A/CCD2 | ||||||||
| Years | Blue Band | Green Band | Red Band | NIR Band | ||||
| Gain | Offset | Gain | Offset | Gain | Offset | Gain | Offset | |
| 2008 | 0.9997 | 4.6344 | 1.0016 | 4.0982 | 1.3777 | 3.736 | 1.3043 | 0.739 |
| 2009 | 0.923 | 4.6344 | 0.9399 | 4.0982 | 1.3093 | 3.736 | 1.3178 | 0.739 |
| 2010 | 0.7892 | 4.6344 | 0.7831 | 4.0982 | 1.1635 | 3.736 | 1.1995 | 0.739 |
| 2011 | 0.7435 | 4.6344 | 0.7379 | 4.0982 | 1.0899 | 3.736 | 1.0852 | 0.739 |
| 2012 | 0.7257 | 4.6344 | 0.7291 | 4.0982 | 1.0464 | 3.736 | 1.0519 | 0.739 |
| HJ-1B/CCD1 | ||||||||
| Years | Blue Band | Green Band | Red Band | NIR Band | ||||
| Gain | Offset | Gain | Offset | Gain | Offset | Gain | Offset | |
| 2008 | 0.8685 | 3.0089 | 0.9367 | 4.4487 | 1.2433 | 3.2144 | 1.3002 | 2.561 |
| 2009 | 0.7726 | 3.0089 | 0.8092 | 4.4487 | 1.117 | 3.2144 | 1.1337 | 2.561 |
| 2010 | 0.761 | 3.0089 | 0.7727 | 4.4487 | 1.0827 | 3.2144 | 1.1181 | 2.561 |
| 2011 | 0.706 | 3.0089 | 0.696 | 4.4487 | 1.0082 | 3.2144 | 1.0068 | 2.561 |
| 2012 | 0.6697 | 3.0089 | 0.7118 | 4.4487 | 1.0555 | 3.2144 | 1.1042 | 2.561 |
| HJ-1B/CCD2 | ||||||||
| Years | Blue Band | Green Band | Red Band | NIR Band | ||||
| Gain | Offset | Gain | Offset | Gain | Offset | Gain | Offset | |
| 2008 | 0.9076 | 2.2219 | 0.8502 | 4.0683 | 1.1635 | 5.2537 | 0.98 | 6.35 |
| 2009 | 0.8394 | 2.2219 | 0.9006 | 4.0683 | 1.2461 | 5.2537 | 1.1261 | 6.35 |
| 2010 | 0.8352 | 2.2219 | 0.7925 | 4.0683 | 1.1316 | 5.2537 | 1.0578 | 6.35 |
| 2011 | 0.8042 | 2.2219 | 0.7822 | 4.0683 | 1.0556 | 5.2537 | 0.9237 | 6.35 |
| 2012 | 0.7587 | 2.2219 | 0.7629 | 4.0683 | 1.0245 | 5.2537 | 1.0146 | 6.35 |
| S1: 2008.11.11–2009.8.17 | S3: 2010.8.20–2015.2.5 | ||||||
| Band | k2 | k1 | k0 | Band | k2 | k1 | k0 |
| Blue | 0.0000 | 0.0312 | −7.5847 | Blue | 0.0000 | 0.0360 | −8.3640 |
| Green | 0.0000 | 0.0295 | −6.3543 | Green | 0.0000 | 0.0319 | −6.8851 |
| Red | 0.0000 | 0.0253 | −3.2586 | Red | 0.0000 | 0.0253 | −3.2586 |
| NIR | 0.0000 | 0.0299 | −3.6119 | NIR | 0.0000 | 0.0299 | −3.6119 |
| S2: 2009.8.17–2010.8.20 | S4: 2015.2.5–Current | ||||||
| Band | k2 | k1 | k0 | Band | k2 | k1 | k0 |
| Blue | 0.0000 | 0.0339 | −7.9511 | Blue | 0.0000 | 0.0406 | −11.2490 |
| Green | 0.0000 | 0.0295 | −6.3543 | Green | 0.0000 | 0.0319 | −6.8851 |
| Red | 0.0000 | 0.0253 | −3.2586 | Red | 0.0000 | 0.0253 | −3.2586 |
| NIR | 0.0000 | 0.0299 | −3.6119 | NIR | 0.0000 | 0.0299 | −3.6119 |
| S1: 2010.10.18–2013.3.6 | |||
|---|---|---|---|
| Band | k2 | k1 | k0 |
| Blue | 0.0000 | 0.0360 | −8.3640 |
| Green | 0.0000 | 0.0319 | −6.8851 |
| Red | 0.0000 | 0.0253 | −3.2586 |
| NIR | 0.0000 | 0.0299 | −3.6119 |
| Sensor | S1: 2008.11.11–2015.2.5 | Sensor | S1: 2010.10.18–2015.2.5 | ||||
| FY3A/VIRR | Band | S | I | FY3B/VIRR | Band | S | I |
| Blue | 0.0894 | −1.1622 | Blue | 0.0748 | −0.9098 | ||
| Green | 0.0687 | −0.8236 | Green | 0.0746 | −0.8953 | ||
| Red | 0.1457 | −1.7484 | Red | 0.1264 | −1.4320 | ||
| NIR | 0.1435 | −1.7348 | NIR | 0.1353 | −1.6236 | ||
| S2: 2015.2.5–Current | S2: 2015.2.5–Current | ||||||
| Band | S | I | Band | S | I | ||
| Blue | 0.102 | −1.3283 | Blue | 0.0938 | −1.1494 | ||
| Green | 0.08 | −0.9576 | Green | 0.0803 | −0.9636 | ||
| Red | 0.1586 | −1.892 | Red | 0.1264 | −1.432 | ||
| NIR | 0.1435 | −1.7348 | NIR | 0.1353 | −1.6236 | ||
| Sensor | a (Blue) | a (Green) | a (Red) | a (NIR) |
|---|---|---|---|---|
| HJ-1A/CCD1 | 0.8786 | 0.9065 | 0.9772 | 1.0002 |
| HJ-1A/CCD2 | 0.9220 | 0.9186 | 0.9792 | 0.9990 |
| HJ-1B/CCD1 | 0.8457 | 0.9193 | 0.9856 | 0.9988 |
| HJ-1B/CCD2 | 0.8778 | 0.8749 | 0.9806 | 0.9988 |
| FY3A/MERSI | 1.0331 | 1.0486 | 1.0085 | 1.0016 |
| FY3A/VIRR | 0.9648 | 1.0009 | 0.9779 | 0.9808 |
| FY3B/MERSI | 1.0224 | 0.9775 | 1.0020 | 1.0003 |
| FY3B/VIRR | 1.0062 | 0.9791 | 0.9529 | 1.0009 |
| Sensor | Band | Slope | Intercept | Maximum | Minimum | Mean | Standard Deviation |
|---|---|---|---|---|---|---|---|
| Terra/MODIS | Blue | 4.7010−5 | 0.144 | 0.185 | 0.106 | 0.140 | 0.019 |
| Green | 5.2210−7 | 0.166 | 0.206 | 0.138 | 0.166 | 0.013 | |
| Red | 2.8110−5 | 0.220 | 0.260 | 0.198 | 0.223 | 0.013 | |
| NIR | 5.3310−5 | 0.270 | 0.312 | 0.247 | 0.274 | 0.015 | |
| Aqua/MODIS | Blue | 9.8710−7 | 0.159 | 0.207 | 0.122 | 0.159 | 0.020 |
| Green | 5.3010−5 | 0.194 | 0.248 | 0.160 | 0.195 | 0.020 | |
| Red | −5.2910−6 | 0.230 | 0.263 | 0.207 | 0.228 | 0.012 | |
| NIR | −1.4110−5 | 0.282 | 0.313 | 0.256 | 0.279 | 0.014 |
| Year | Band | Slope | Maximum | Minimum | Mean | Mean_a * | Mean_a *-Mean_M # | Standard Deviation |
|---|---|---|---|---|---|---|---|---|
| 2009 | Blue | 2.6710−7 | 0.1548 | 0.1408 | 0.1475 | 0.1679 | 0.0279 | 0.0054 |
| Green | 8.8810−6 | 0.1777 | 0.1621 | 0.1674 | 0.1847 | 0.0187 | 0.0052 | |
| Red | 7.0410−6 | 0.2249 | 0.2032 | 0.2122 | 0.2171 | −0.0059 | 0.0067 | |
| NIR | 1.1610−5 | 0.2472 | 0.2280 | 0.2401 | 0.2400 | −0.0340 | 0.0062 | |
| 2010 | Blue | 5.7610−5 | 0.1950 | 0.1792 | 0.1884 | 0.2144 | 0.0744 | 0.0073 |
| Green | 1.7310−5 | 0.2076 | 0.1949 | 0.2011 | 0.2218 | 0.0558 | 0.0053 | |
| Red | −1.9610−6 | 0.2629 | 0.2388 | 0.2533 | 0.2592 | 0.0362 | 0.0091 | |
| NIR | 2.3410−4 | 0.2939 | 0.2407 | 0.2667 | 0.2666 | −0.0074 | 0.0222 | |
| 2011 | Blue | - | 0.2193 | 0.1585 | 0.1795 | 0.2043 | 0.0643 | 0.0184 |
| Green | 2.9810−5 | 0.2137 | 0.1805 | 0.1956 | 0.2158 | 0.0498 | 0.0109 | |
| Red | 5.5610−5 | 0.2731 | 0.2264 | 0.2475 | 0.2533 | 0.0303 | 0.0129 | |
| NIR | - | 0.3006 | 0.2500 | 0.2717 | 0.2716 | −0.0024 | 0.0149 | |
| 2012 | Blue | −2.0410−4 | 0.2051 | 0.1516 | 0.1743 | 0.1984 | 0.0584 | 0.0188 |
| Green | −1.1310−4 | 0.2024 | 0.1712 | 0.1879 | 0.2073 | 0.0413 | 0.0097 | |
| Red | −8.5610−5 | 0.2468 | 0.2167 | 0.2328 | 0.2382 | 0.0722 | 0.0097 | |
| NIR | −1.0610−4 | 0.2832 | 0.2386 | 0.2647 | 0.2646 | −0.0094 | 0.0143 |
| Sensor | Year | Band | Slope | Maximum | Minimum | Mean | Mean_a | Mean_a *-Mean_M # | Standard Deviation |
|---|---|---|---|---|---|---|---|---|---|
| HJ-1A/CCD2 | 2009 | Blue | −6.7310−5 | 0.1586 | 0.1392 | 0.1489 | 0.1695 | 0.0295 | 0.0069 |
| Green | −5.5910−5 | 0.1700 | 0.1559 | 0.1629 | 0.1797 | 0.0137 | 0.0052 | ||
| Red | −4.2610−5 | 0.2094 | 0.1935 | 0.2011 | 0.2058 | −0.0172 | 0.0057 | ||
| NIR | −4.9610−5 | 0.2399 | 0.2196 | 0.2300 | 0.2299 | −0.0441 | 0.0063 | ||
| 2010 | Blue | 3.5610−5 | 0.1775 | 0.1552 | 0.1651 | 0.1879 | 0.0479 | 0.0071 | |
| Green | 6.6710−5 | 0.1849 | 0.1637 | 0.1741 | 0.1920 | 0.0260 | 0.0071 | ||
| Red | 4.8910−5 | 0.2249 | 0.1984 | 0.2133 | 0.2183 | −0.0047 | 0.0078 | ||
| NIR | 6.7710−5 | 0.2436 | 0.2165 | 0.2316 | 0.2315 | −0.0425 | 0.0079 | ||
| 2011 | Blue | 4.5210−5 | 0.2171 | 0.1737 | 0.1909 | 0.2173 | 0.0773 | 0.0109 | |
| Green | 2.8010−5 | 0.2178 | 0.1791 | 0.2026 | 0.2235 | 0.0593 | 0.0087 | ||
| Red | 5.74 10−5 | 0.2606 | 0.2131 | 0.2409 | 0.2465 | 0.0235 | 0.0132 | ||
| NIR | 5.2310−5 | 0.2799 | 0.2154 | 0.2549 | 0.2548 | −0.0192 | 0.0173 | ||
| 2012 | Blue | −7.5610−5 | 0.2083 | 0.1694 | 0.1934 | 0.2201 | 0.0801 | 0.0107 | |
| Green | −4.7510−5 | 0.2195 | 0.1881 | 0.2095 | 0.2311 | 0.0651 | 0.0080 | ||
| Red | −3.5910−5 | 0.2661 | 0.2307 | 0.2563 | 0.2623 | 0.0393 | 0.0096 | ||
| NIR | −7.9010−5 | 0.2947 | 0.2422 | 0.2806 | 0.2805 | 0.0065 | 0.0130 |
| Sensor | Year | Band | Slope | Maximum | Minimum | Mean | Mean_a | Mean_a *-Mean_M # | Standard Deviation |
|---|---|---|---|---|---|---|---|---|---|
| HJ-1B/CCD1 | 2009 | Blue | 1.8010−5 | 0.1614 | 0.1378 | 0.1499 | 0.1773 | 0.0373 | 0.0072 |
| Green | 4.0610−5 | 0.1842 | 0.1625 | 0.1730 | 0.1883 | 0.0223 | 0.0066 | ||
| Red | 2.7410−5 | 0.2314 | 0.2096 | 0.2208 | 0.2240 | 0.0010 | 0.0070 | ||
| NIR | 1.1610−5 | 0.2608 | 0.2353 | 0.2489 | 0.2492 | −0.0248 | 0.0084 | ||
| 2010 | Blue | - | 0.1874 | 0.1572 | 0.1694 | 0.2003 | 0.0603 | 0.0087 | |
| Green | 4.8010−5 | 0.1954 | 0.1730 | 0.1848 | 0.2012 | 0.0352 | 0.0061 | ||
| Red | 5.3410−5 | 0.2400 | 0.2112 | 0.2248 | 0.2281 | 0.0051 | 0.0068 | ||
| NIR | 3.8810−5 | 0.2657 | 0.2258 | 0.2459 | 0.2462 | −0.0278 | 0.0108 | ||
| 2011 | Blue | - | 0.2004 | 0.1546 | 0.1700 | 0.2010 | 0.0610 | 0.0140 | |
| Green | - | 0.2069 | 0.1756 | 0.1889 | 0.2056 | 0.0396 | 0.0099 | ||
| Red | - | 0.2572 | 0.2174 | 0.2321 | 0.2355 | 0.0125 | 0.0120 | ||
| NIR | - | 0.2847 | 0.2281 | 0.2523 | 0.2526 | −0.0214 | 0.0158 | ||
| 2012 | Blue | −7.6510−5 | 0.2004 | 0.1576 | 0.1669 | 0.1974 | 0.0574 | 0.0075 | |
| Green | −8.1410−5 | 0.2097 | 0.1903 | 0.1988 | 0.2164 | 0.0504 | 0.0069 | ||
| Red | −8.4810−5 | 0.2572 | 0.2293 | 0.2428 | 0.2464 | 0.0234 | 0.0076 | ||
| NIR | −1.2510−5 | 0.2900 | 0.2537 | 0.2741 | 0.2744 | 0.0004 | 0.0113 |
| Sensor | Year | Band | Slope | Maximum | Minimum | Mean | Mean_a | Mean_a *-Mean_M # | Standard Deviation |
|---|---|---|---|---|---|---|---|---|---|
| HJ-1B/CCD2 | 2009 | Blue | −2.9110−5 | 0.1721 | 0.1449 | 0.1543 | 0.1758 | 0.0358 | 0.0081 |
| Green | −2.8010−5 | 0.1918 | 0.1666 | 0.1763 | 0.2015 | 0.0355 | 0.0078 | ||
| Red | −4.7510−5 | 0.2388 | 0.2144 | 0.2242 | 0.2286 | 0.0056 | 0.0075 | ||
| NIR | −1.7010−5 | 0.2671 | 0.2506 | 0.2600 | 0.2607 | −0.0133 | 0.0055 | ||
| 2010 | Blue | −4.6610−5 | 0.1681 | 0.1486 | 0.1603 | 0.1826 | 0.0426 | 0.0064 | |
| Green | −1.4510−5 | 0.1753 | 0.1557 | 0.1687 | 0.1928 | 0.0268 | 0.0062 | ||
| Red | 8.7910−6 | 0.2168 | 0.1990 | 0.2100 | 0.2142 | −0.0088 | 0.0056 | ||
| NIR | −1.9910−5 | 0.2509 | 0.2244 | 0.2371 | 0.2377 | −0.0363 | 0.0085 | ||
| 2011 | Blue | −2.2310−6 | 0.1785 | 0.1642 | 0.1684 | 0.1918 | 0.0518 | 0.0044 | |
| Green | 1.4410−5 | 0.2044 | 0.1801 | 0.1925 | 0.2200 | 0.0540 | 0.0062 | ||
| Red | - | 0.2334 | 0.1994 | 0.2199 | 0.2243 | 0.0013 | 0.0113 | ||
| NIR | - | 0.2569 | 0.2244 | 0.2393 | 0.2399 | −0.0341 | 0.0101 | ||
| 2012 | Blue | −2.6710−5 | 0.1789 | 0.1531 | 0.1647 | 0.1876 | 0.0476 | 0.0068 | |
| Green | −5.4310−5 | 0.2072 | 0.1844 | 0.1967 | 0.2248 | 0.0588 | 0.0061 | ||
| Red | −8.2410−5 | 0.2519 | 0.2271 | 0.2387 | 0.2434 | 0.0204 | 0.0079 | ||
| NIR | −1.4310−5 | 0.2964 | 0.2623 | 0.2768 | 0.2775 | 0.0035 | 0.0114 |
| Sensor | Band | Slope | Maximum | Minimum | Mean | Mean_a | Mean_a *-Mean_M # | Standard Deviation |
|---|---|---|---|---|---|---|---|---|
| FY-3A/MERSI | Blue | 2.0410−5 | 0.2238 | 0.1235 | 0.1598 | 0.1547 | 0.0147 | 0.0179 |
| Green | −8.7410−5 | 0.2012 | 0.1449 | 0.1670 | 0.1593 | −0.0067 | 0.0115 | |
| Red | 4.6210−5 | 0.2663 | 0.2084 | 0.2326 | 0.2306 | 0.0076 | 0.0103 | |
| NIR | −3.5810−5 | 0.3013 | 0.2342 | 0.2630 | 0.2626 | −0.0114 | 0.0113 | |
| FY-3B/MERSI | Blue | 8.8010−5 | 0.2042 | 0.1354 | 0.1648 | 0.1708 | 0.0118 | 0.0174 |
| Green | 2.7710−4 | 0.2024 | 0.1534 | 0.1718 | 0.1716 | −0.0234 | 0.0123 | |
| Red | 1.3910−4 | 0.2638 | 0.2159 | 0.2308 | 0.2360 | 0.0080 | 0.0114 | |
| NIR | −8.2710−5 | 0.3136 | 0.2624 | 0.2784 | 0.2838 | 0.0048 | 0.0125 |
| Sensor | Band | Slope | Maximum | Minimum | Mean | Mean_a | Mean_a *-Mean_M # | Standard Deviation |
|---|---|---|---|---|---|---|---|---|
| FY-3A/VIRR | Blue | −1.3310−6 | 0.1951 | 0.1331 | 0.1573 | 0.1569 | 0.0169 | 0.0164 |
| Green | 1.4410−4 | 0.1939 | 0.1530 | 0.1671 | 0.1709 | 0.0049 | 0.0118 | |
| Red | 1.8810−4 | 0.2353 | 0.1965 | 0.2086 | 0.2082 | −0.0148 | 0.0109 | |
| NIR | −7.0610−4 | 0.2767 | 0.2385 | 0.2545 | 0.2544 | −0.0196 | 0.0116 | |
| FY-3B/VIRR | Blue | −1.6710−4 | 0.2010 | 0.1316 | 0.1604 | 0.1594 | 0.0004 | 0.0168 |
| Green | −3.9310−4 | 0.2018 | 0.1486 | 0.1681 | 0.1717 | −0.0233 | 0.0127 | |
| Red | −4.3610−4 | 0.2247 | 0.1822 | 0.1960 | 0.2057 | −0.0223 | 0.0103 | |
| NIR | −5.0410−4 | 0.2862 | 0.2262 | 0.2510 | 0.2508 | −0.0282 | 0.0128 |
© 2017 by the authors; licensee MDPI, Basel, Switzerland. This article is an open access article distributed under the terms and conditions of the Creative Commons Attribution (CC BY) license (http://creativecommons.org/licenses/by/4.0/).
Share and Cite
Yang, A.; Zhong, B.; Wu, S.; Liu, Q. Evaluation on Radiometric Capability of Chinese Optical Satellite Sensors. Sensors 2017, 17, 204. https://doi.org/10.3390/s17010204
Yang A, Zhong B, Wu S, Liu Q. Evaluation on Radiometric Capability of Chinese Optical Satellite Sensors. Sensors. 2017; 17(1):204. https://doi.org/10.3390/s17010204
Chicago/Turabian StyleYang, Aixia, Bo Zhong, Shanlong Wu, and Qinhuo Liu. 2017. "Evaluation on Radiometric Capability of Chinese Optical Satellite Sensors" Sensors 17, no. 1: 204. https://doi.org/10.3390/s17010204
APA StyleYang, A., Zhong, B., Wu, S., & Liu, Q. (2017). Evaluation on Radiometric Capability of Chinese Optical Satellite Sensors. Sensors, 17(1), 204. https://doi.org/10.3390/s17010204