
Research on the Error Characteristics of a 110 kV Optical Voltage Transformer under Three Conditions: In the Laboratory, Off-Line in the Field and During On-Line Operation

Abstract
:1. Introduction
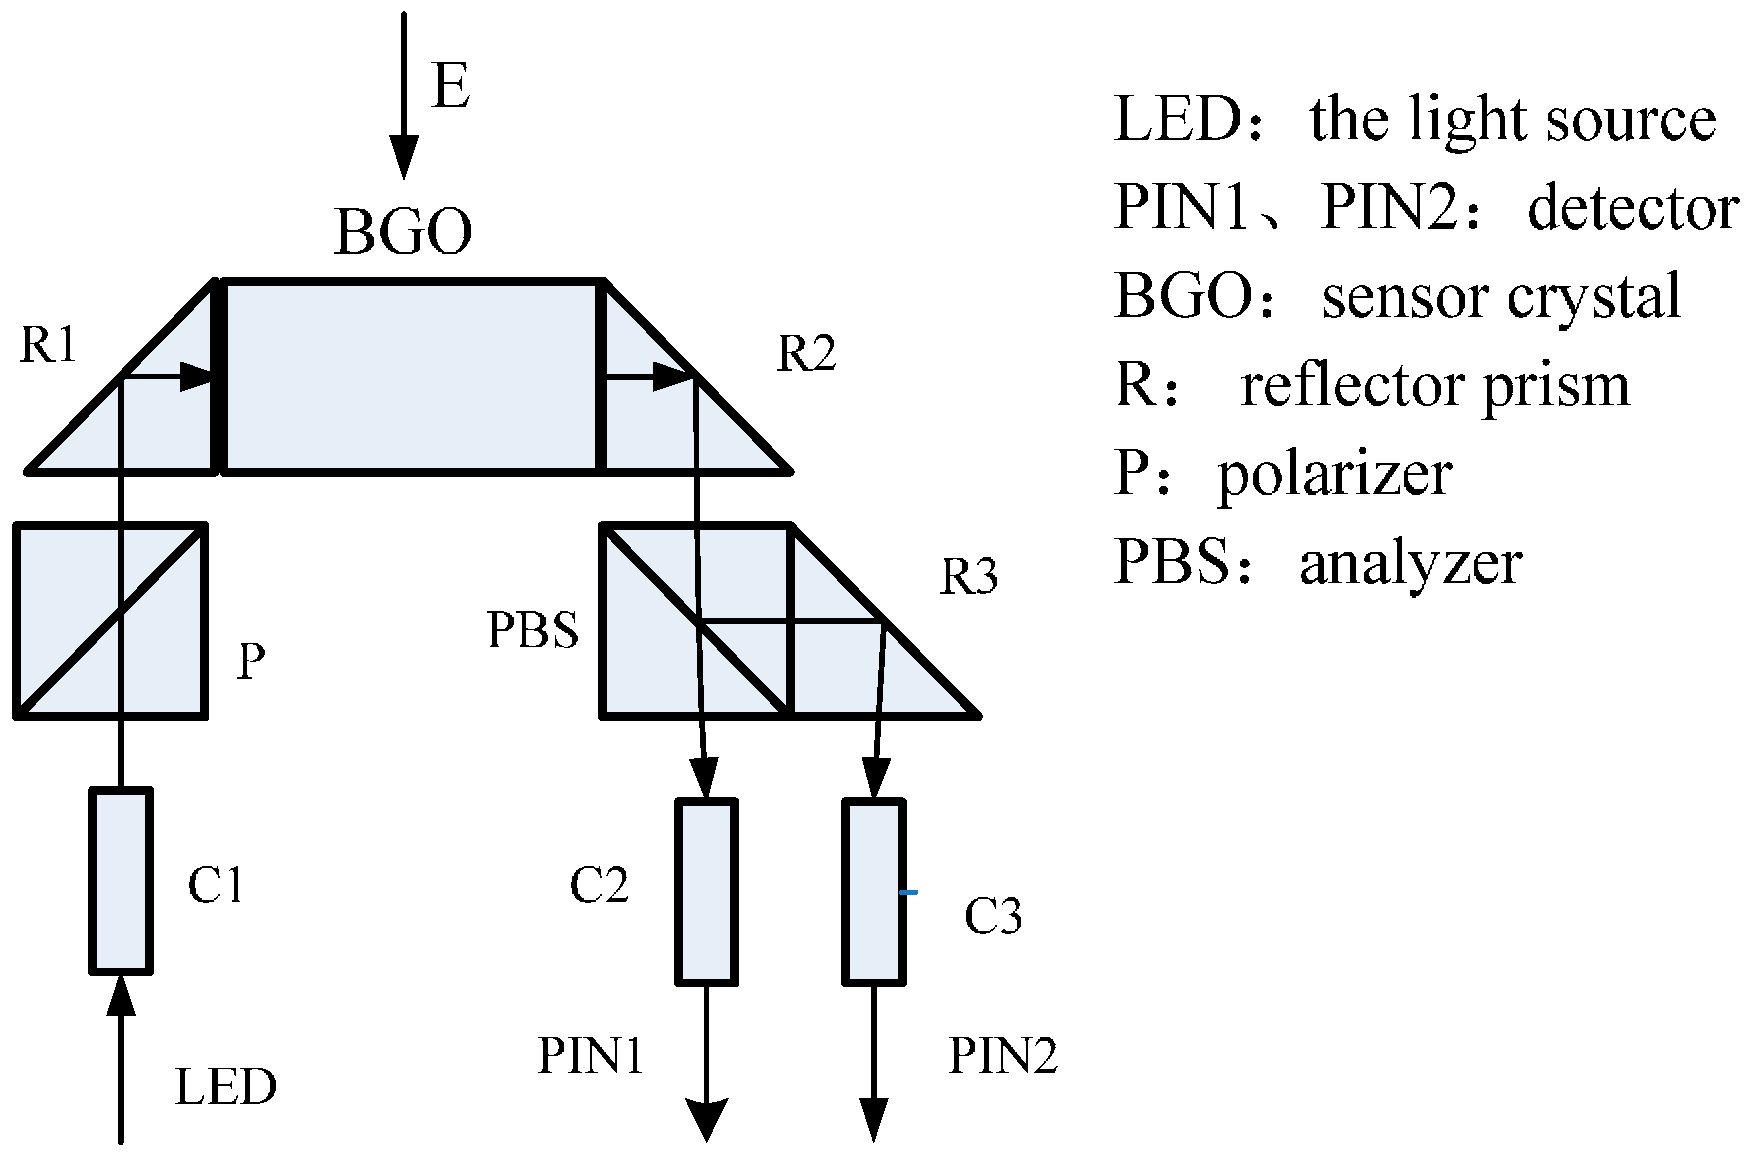
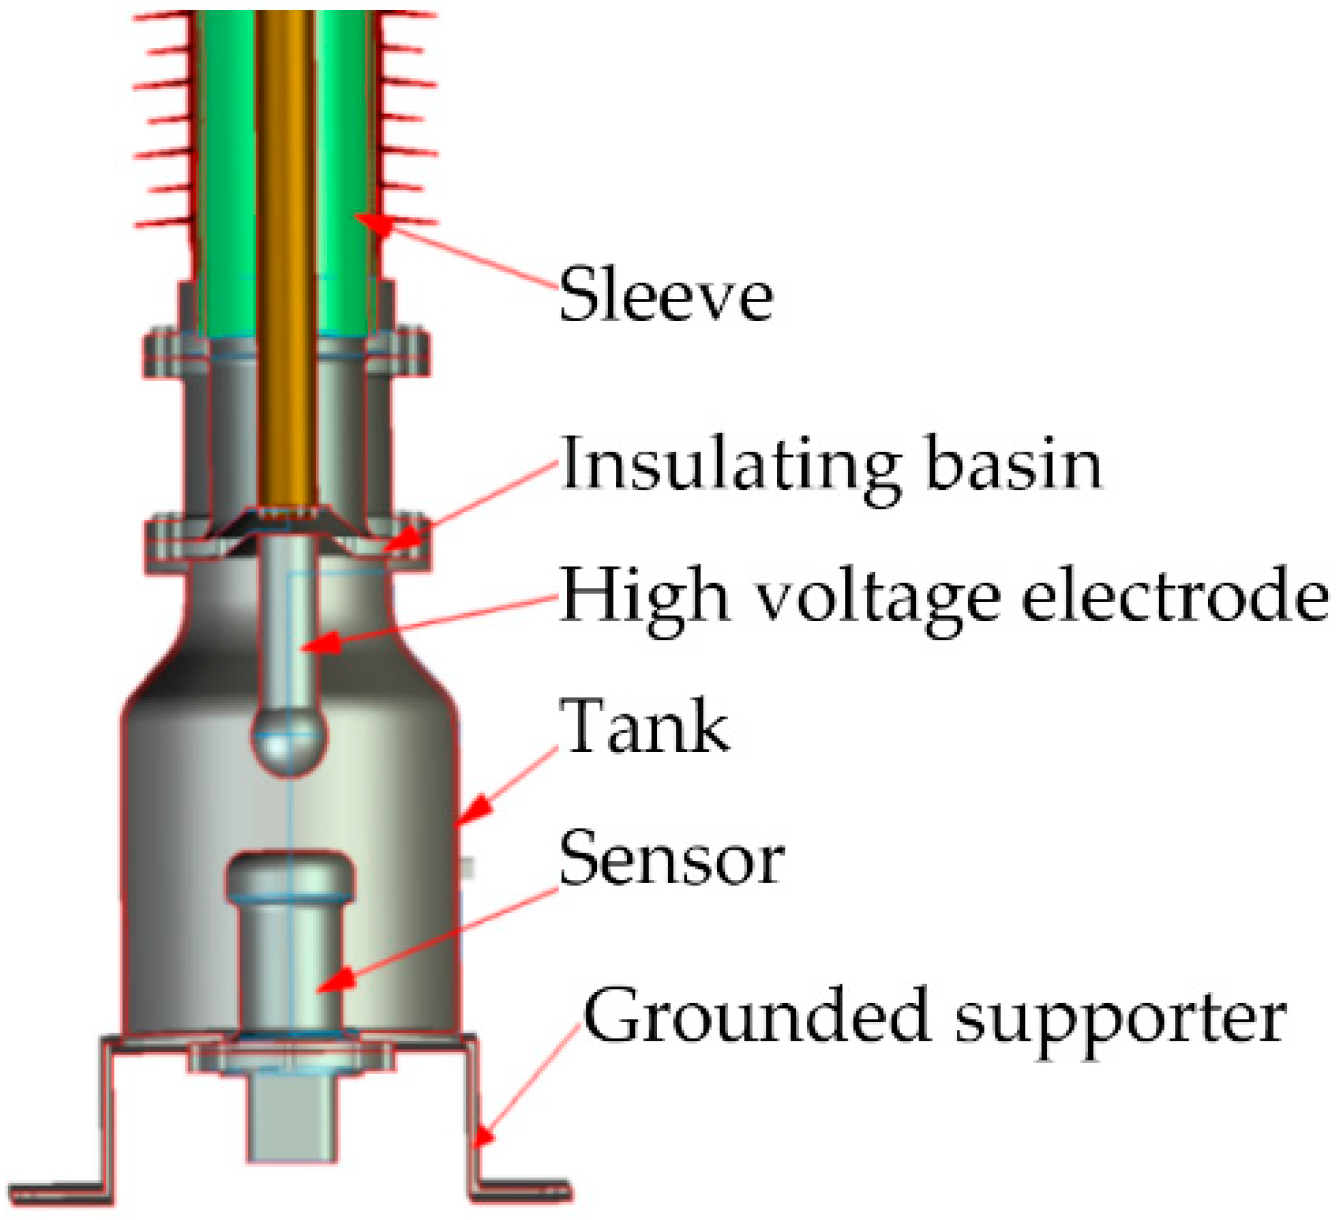
2. Principle and Structure of OVT
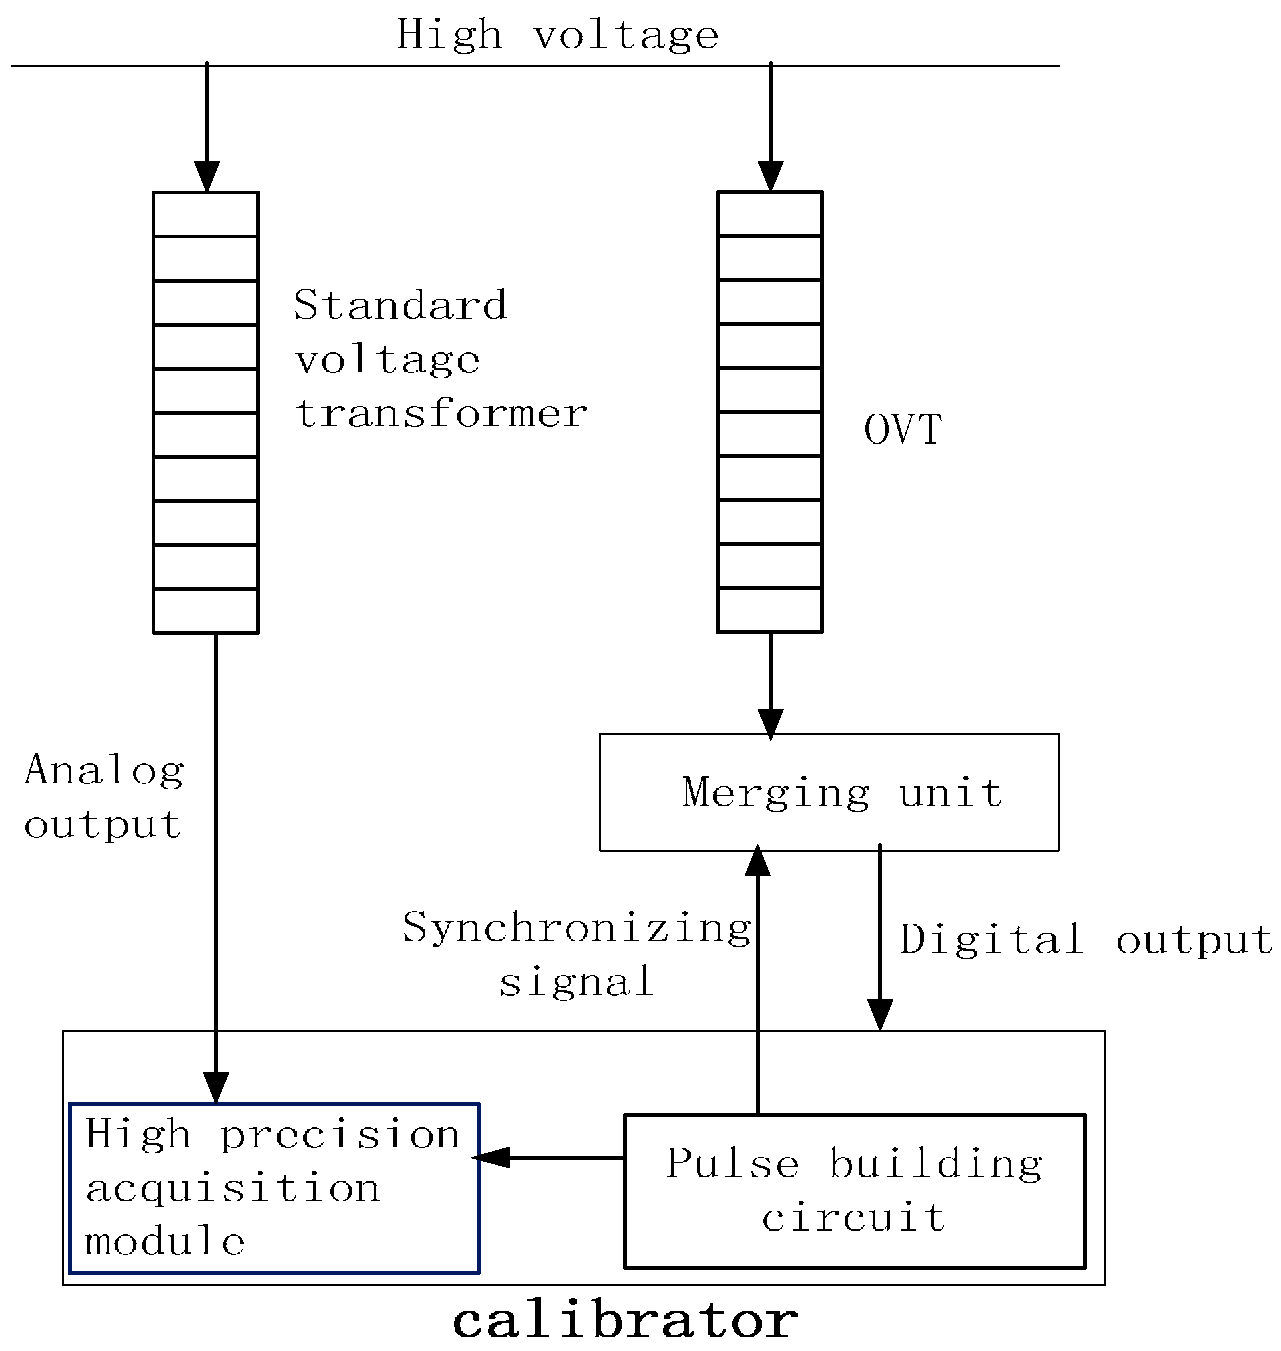
3. Testing Scheme
4. Comparison of the OVT Error Characteristics under Three Conditions
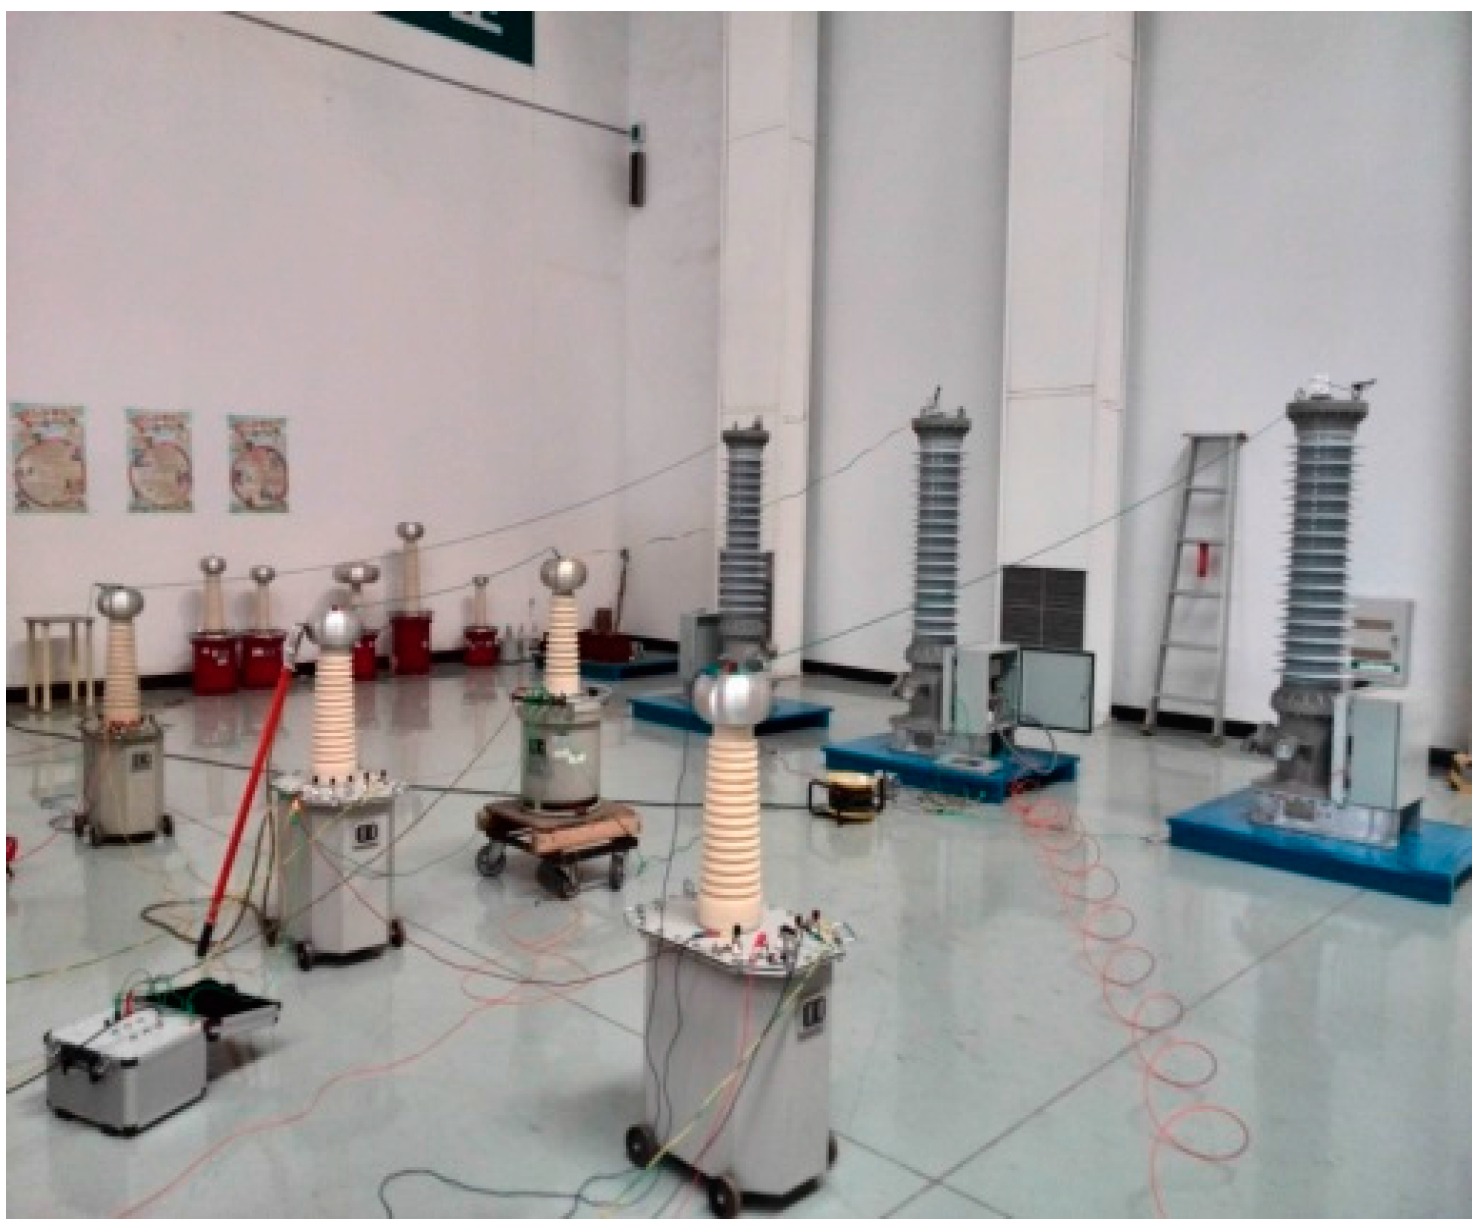
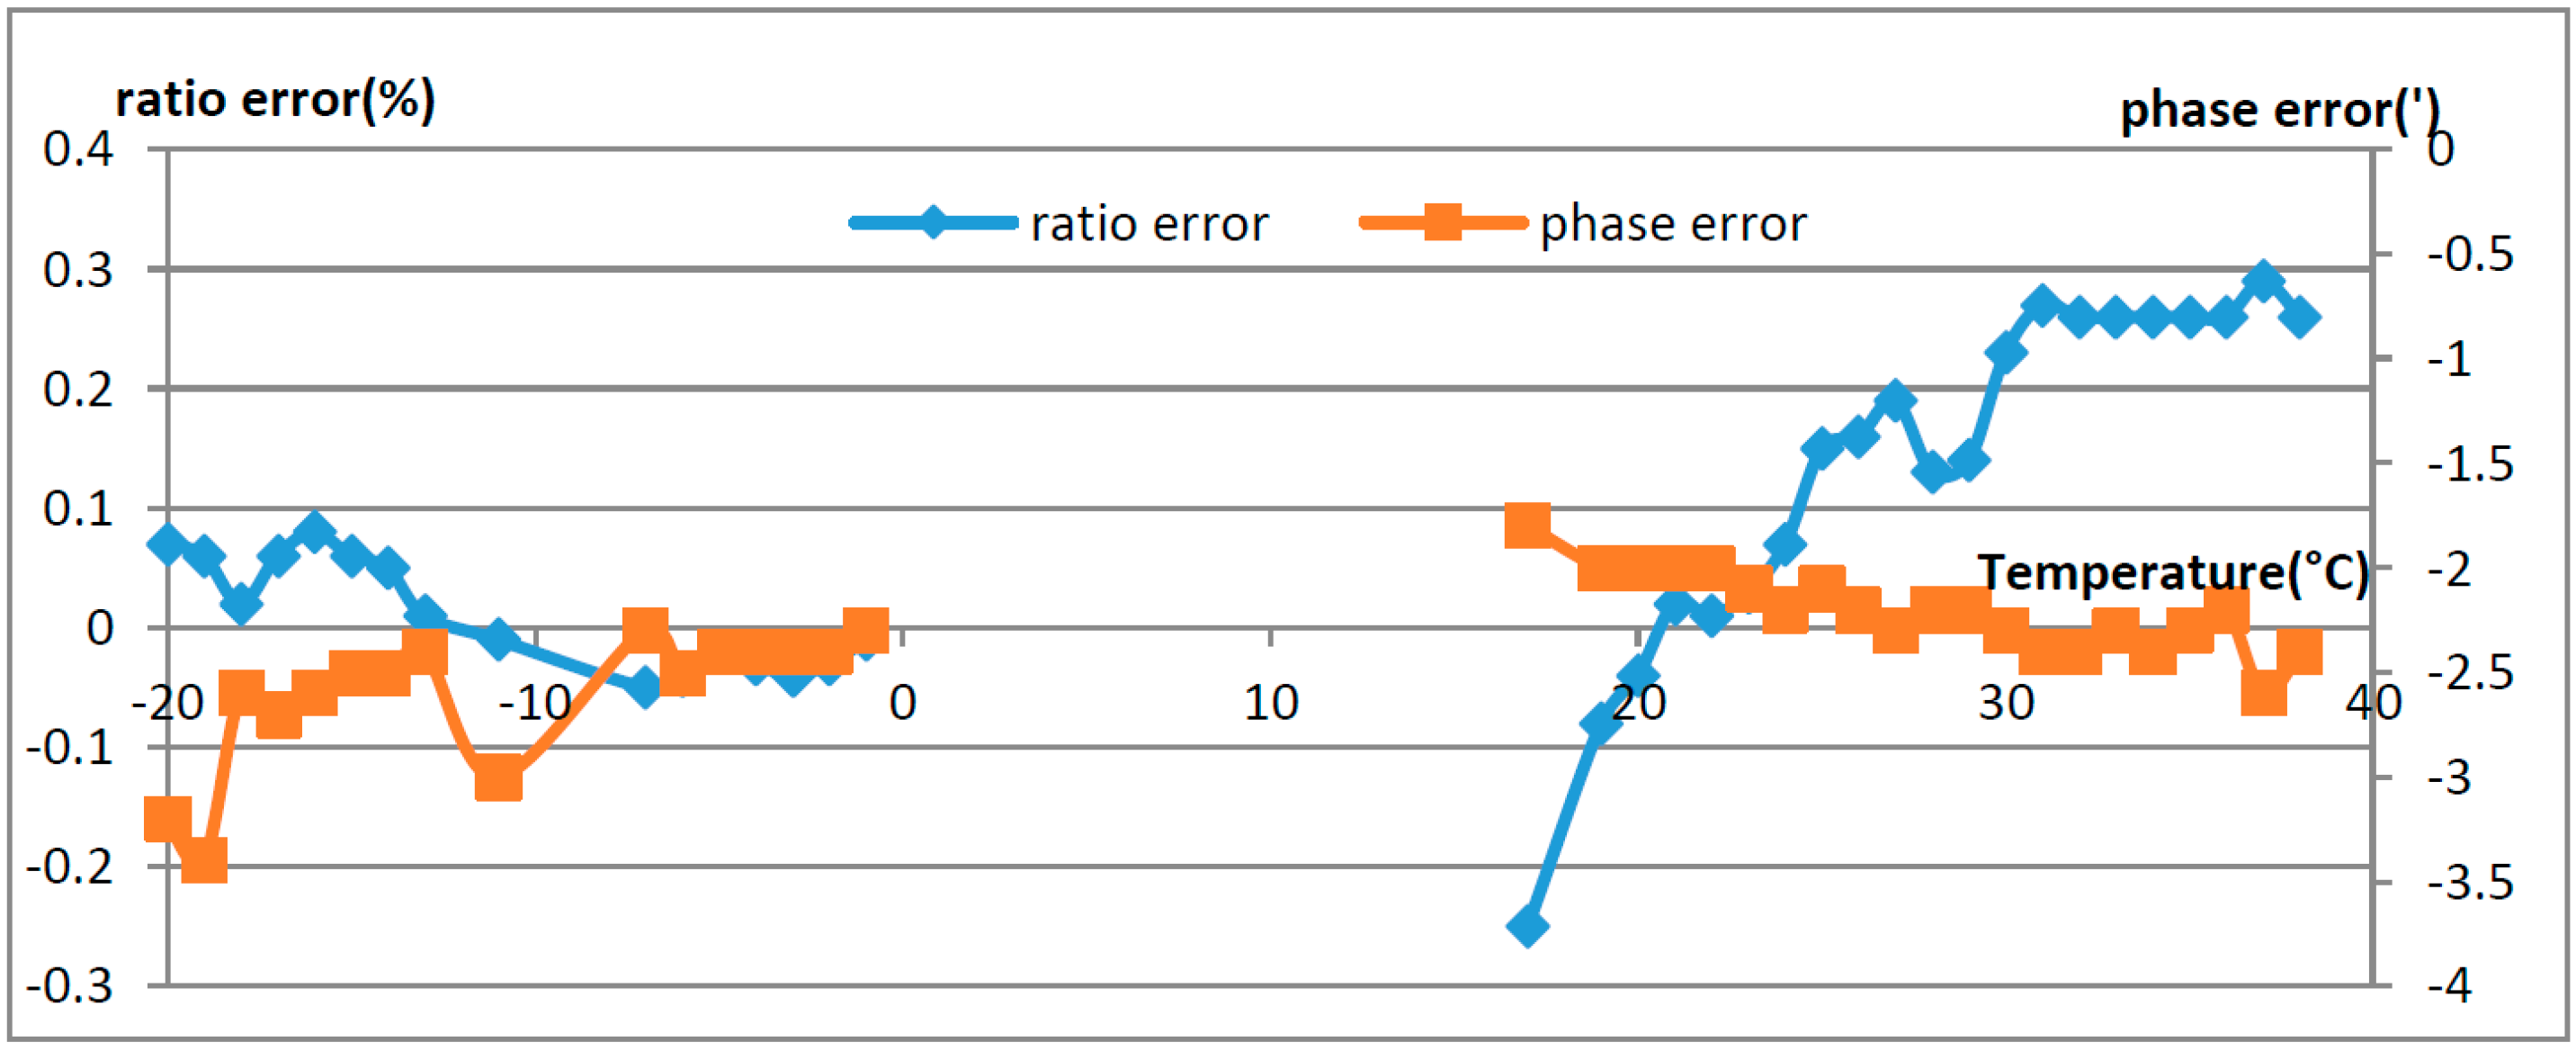
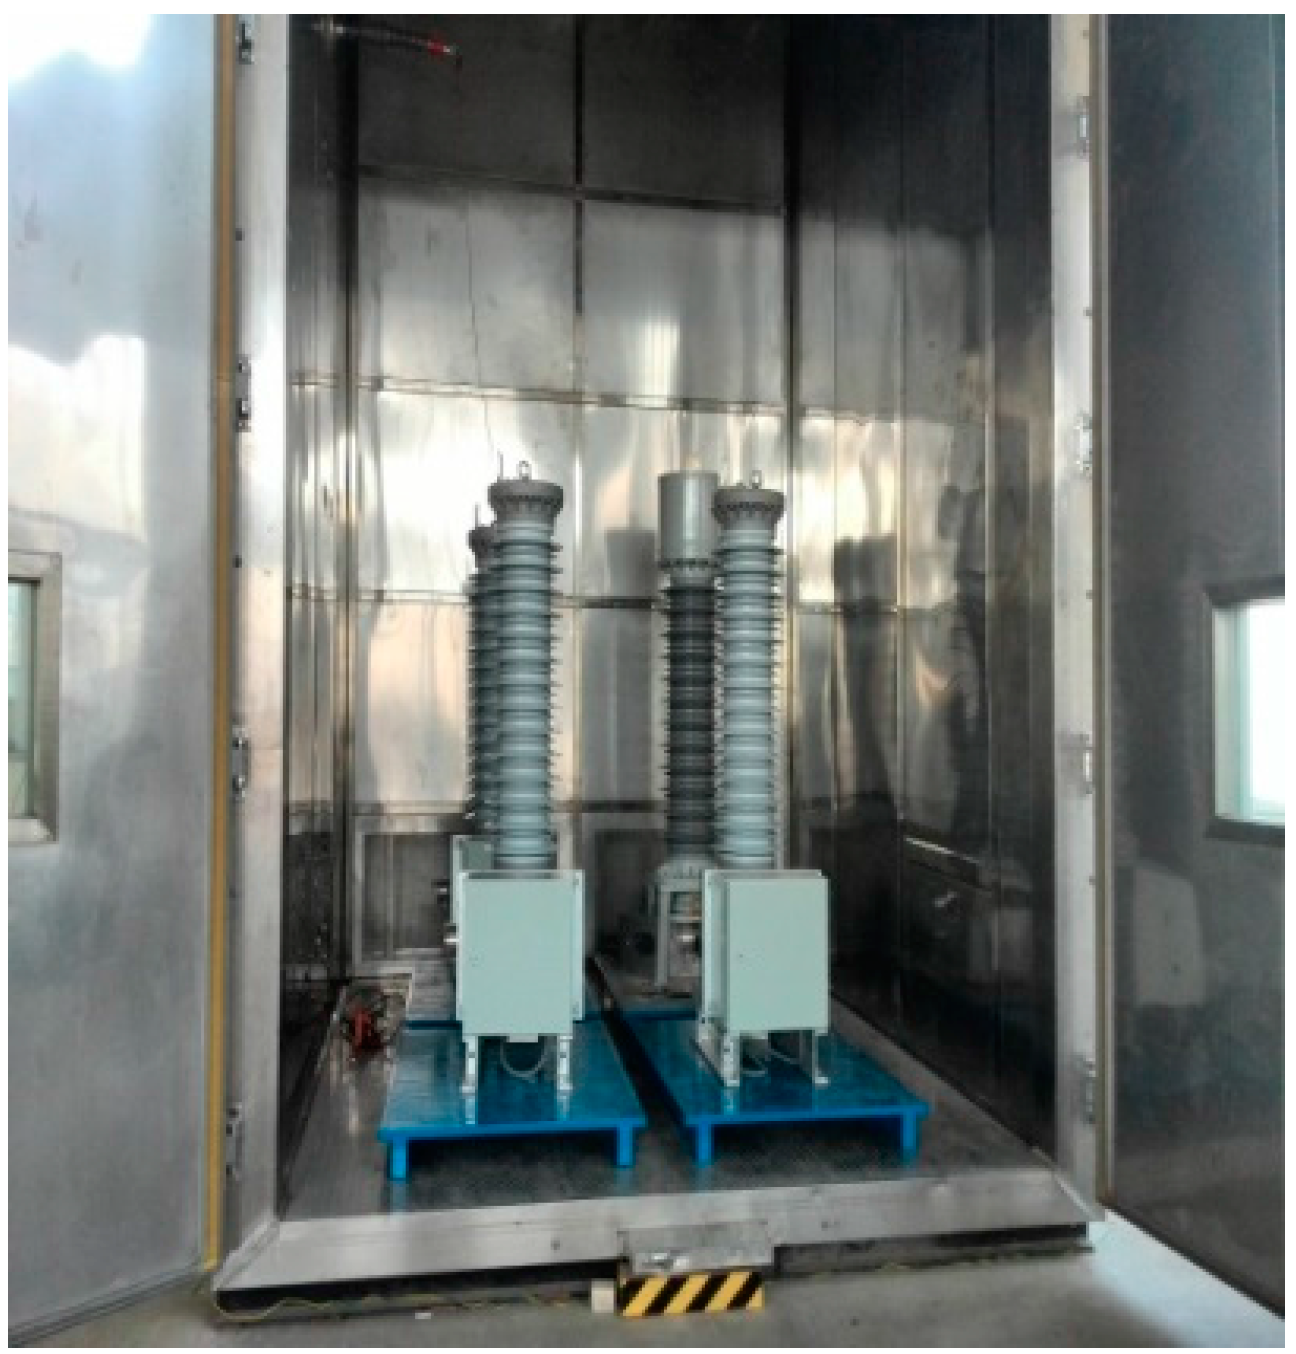
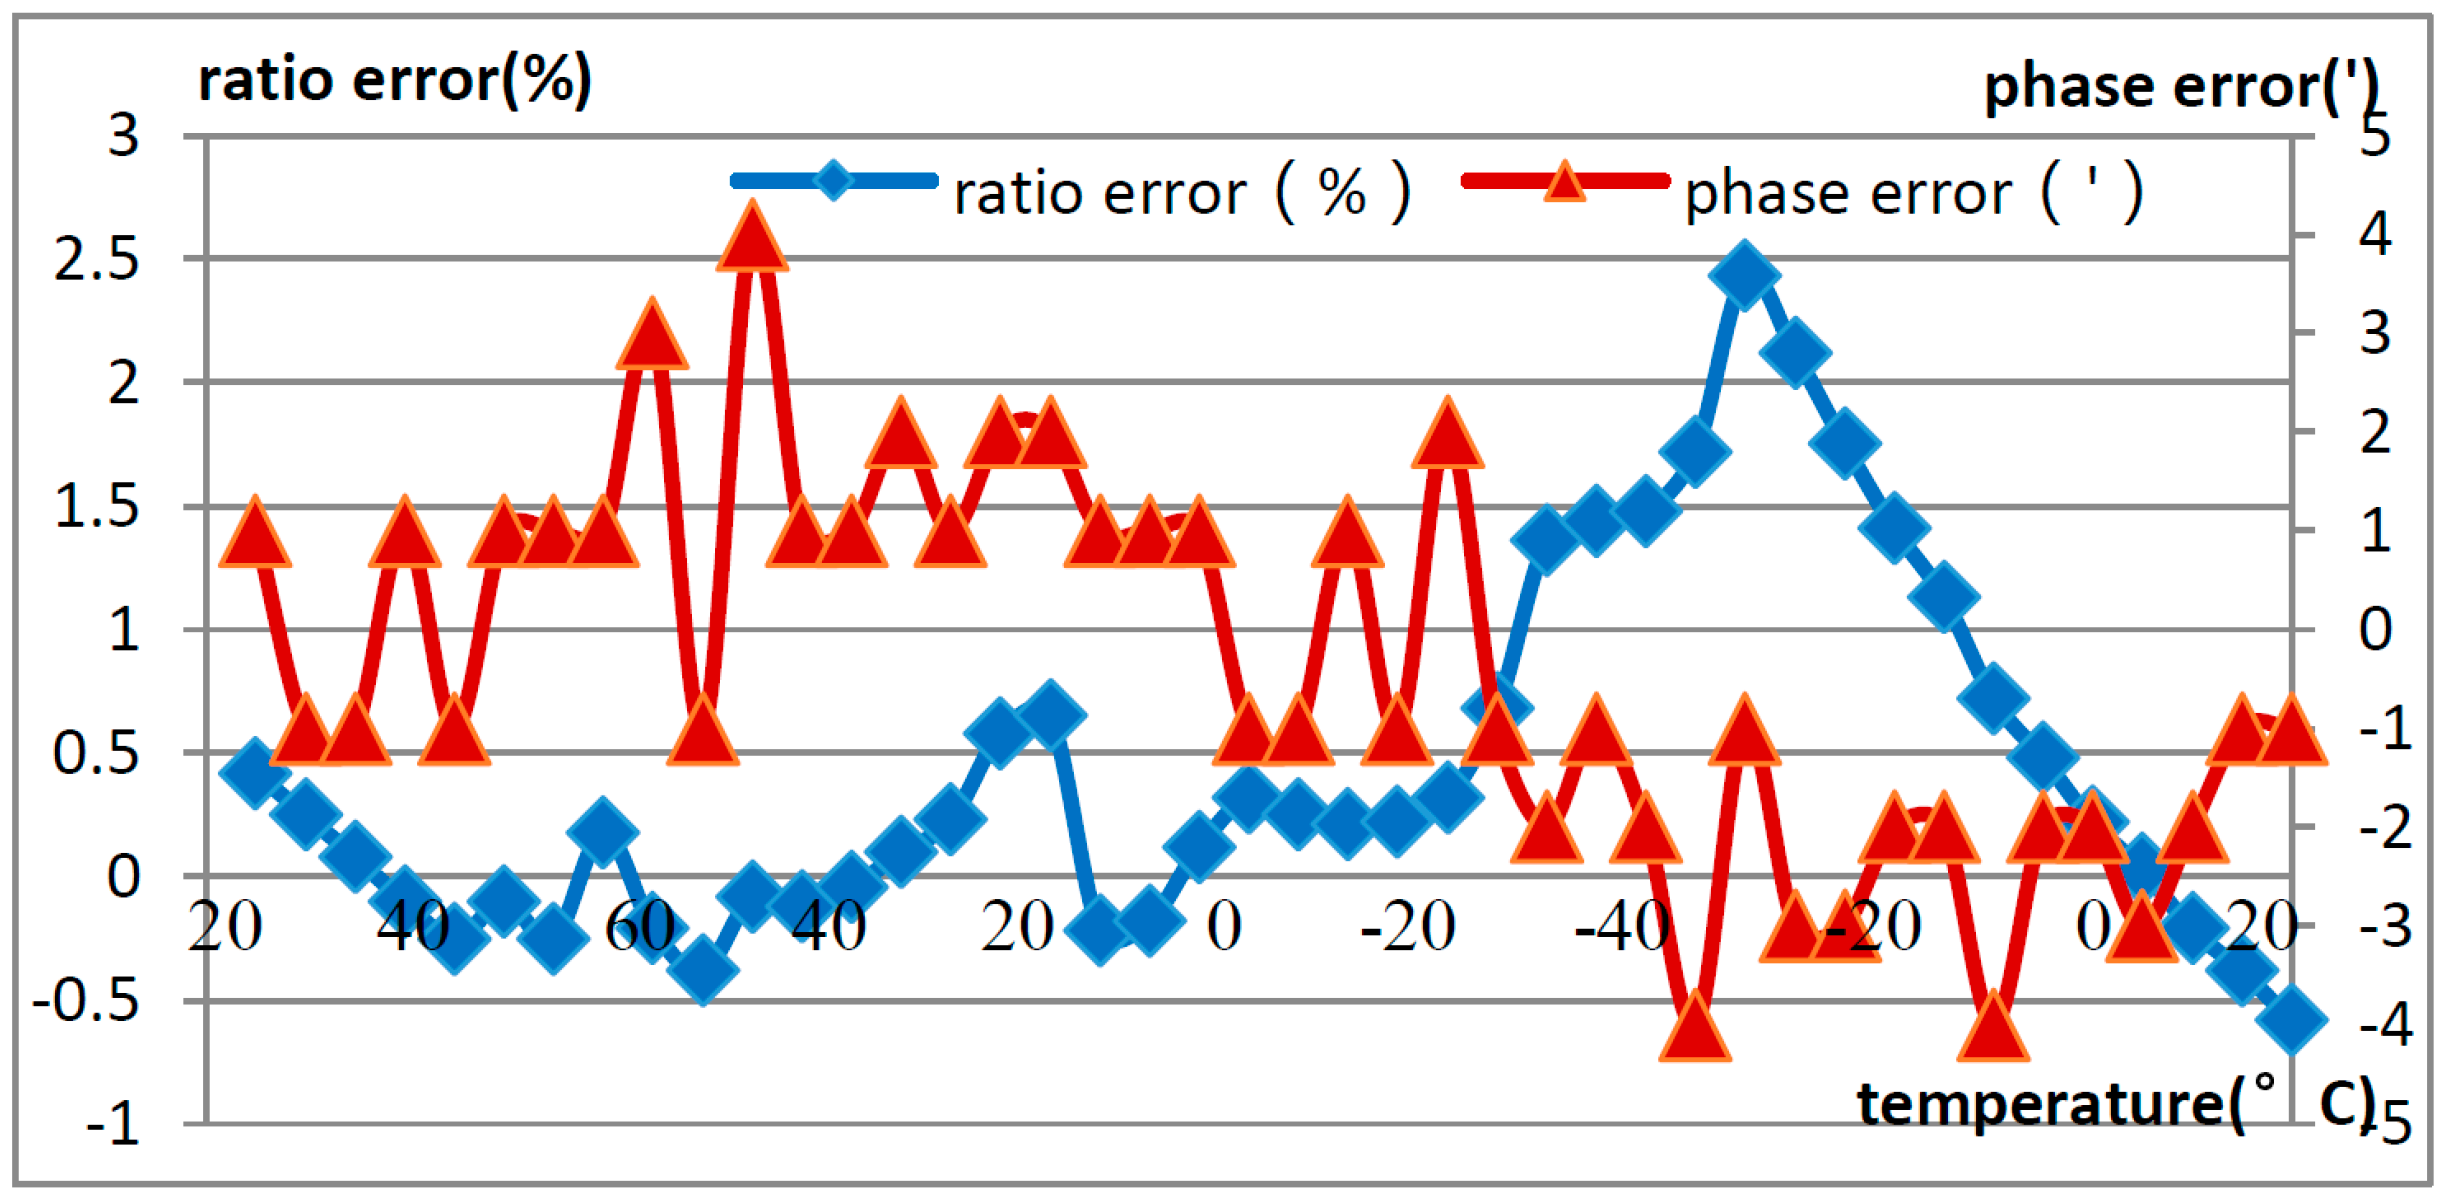
4.1. Comparison of Error Characteristics of OVT in the Laboratory
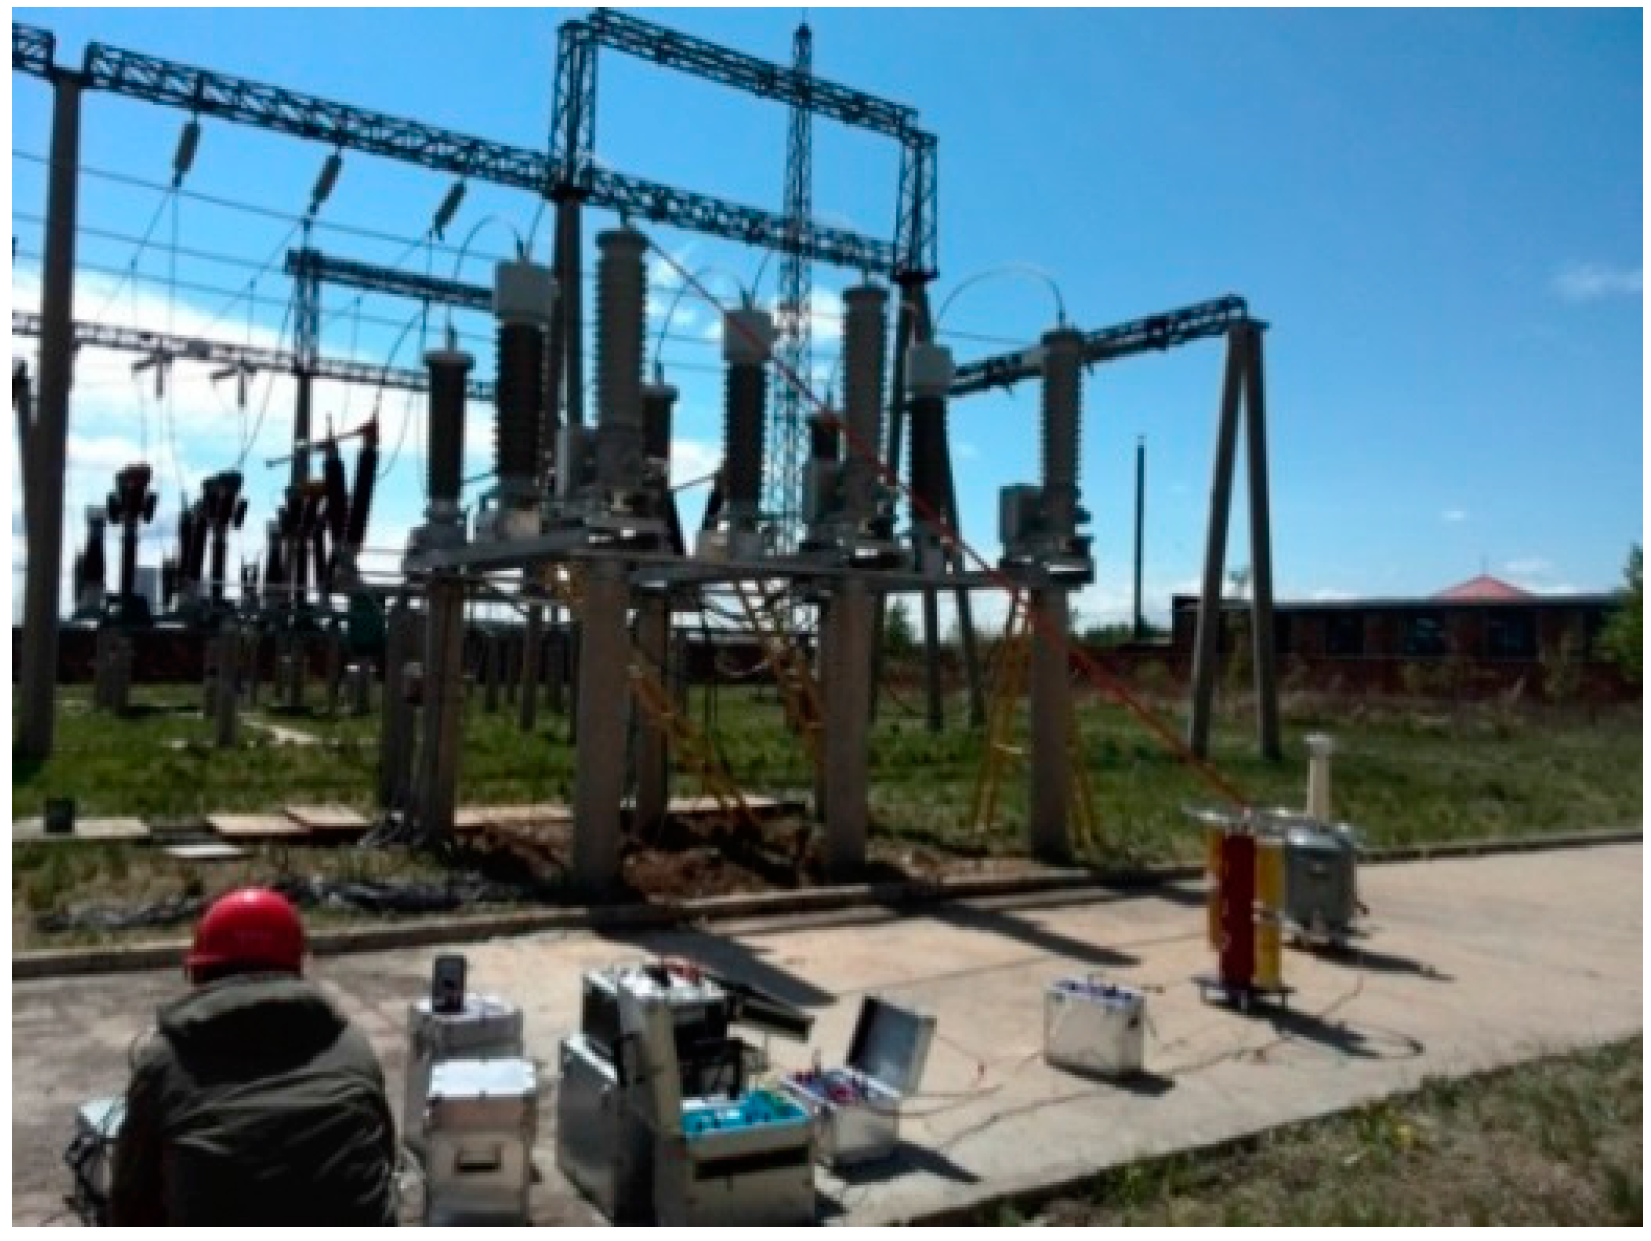
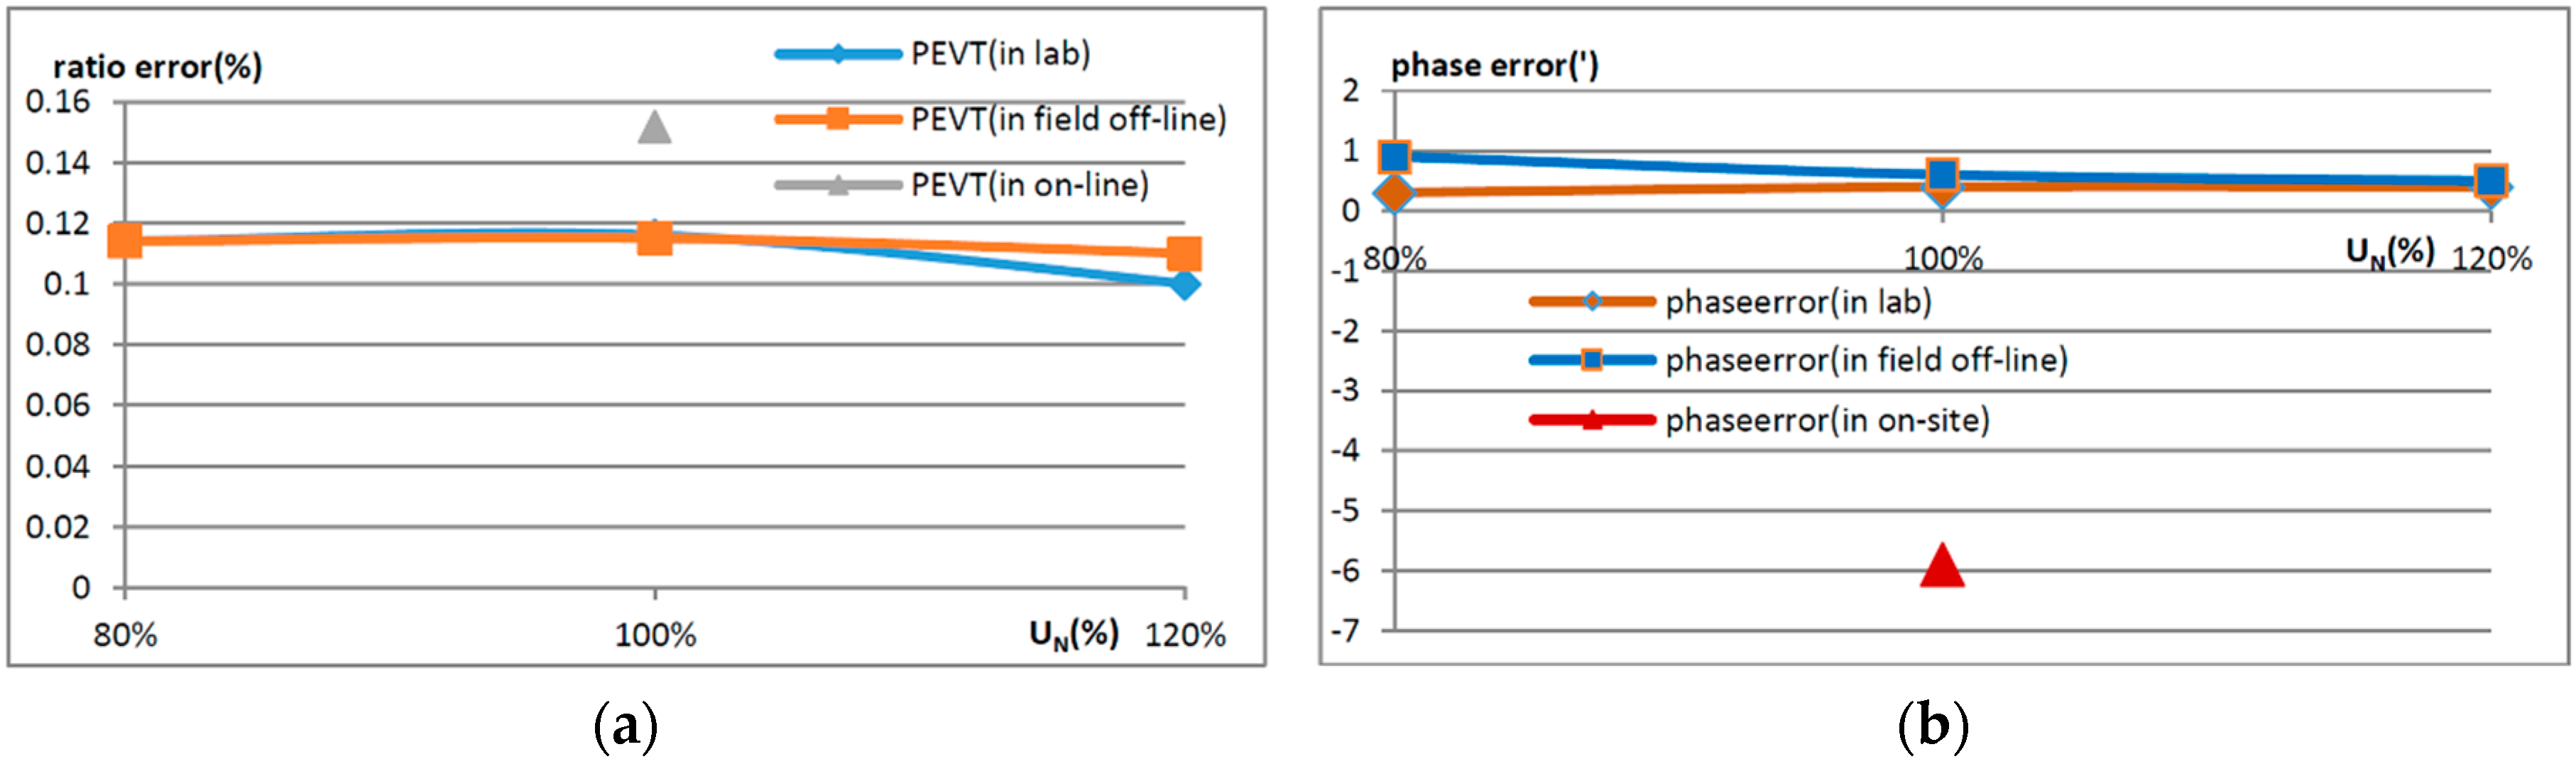
4.2. Comparison of Error Characteristics of OVT under the Three Conditions
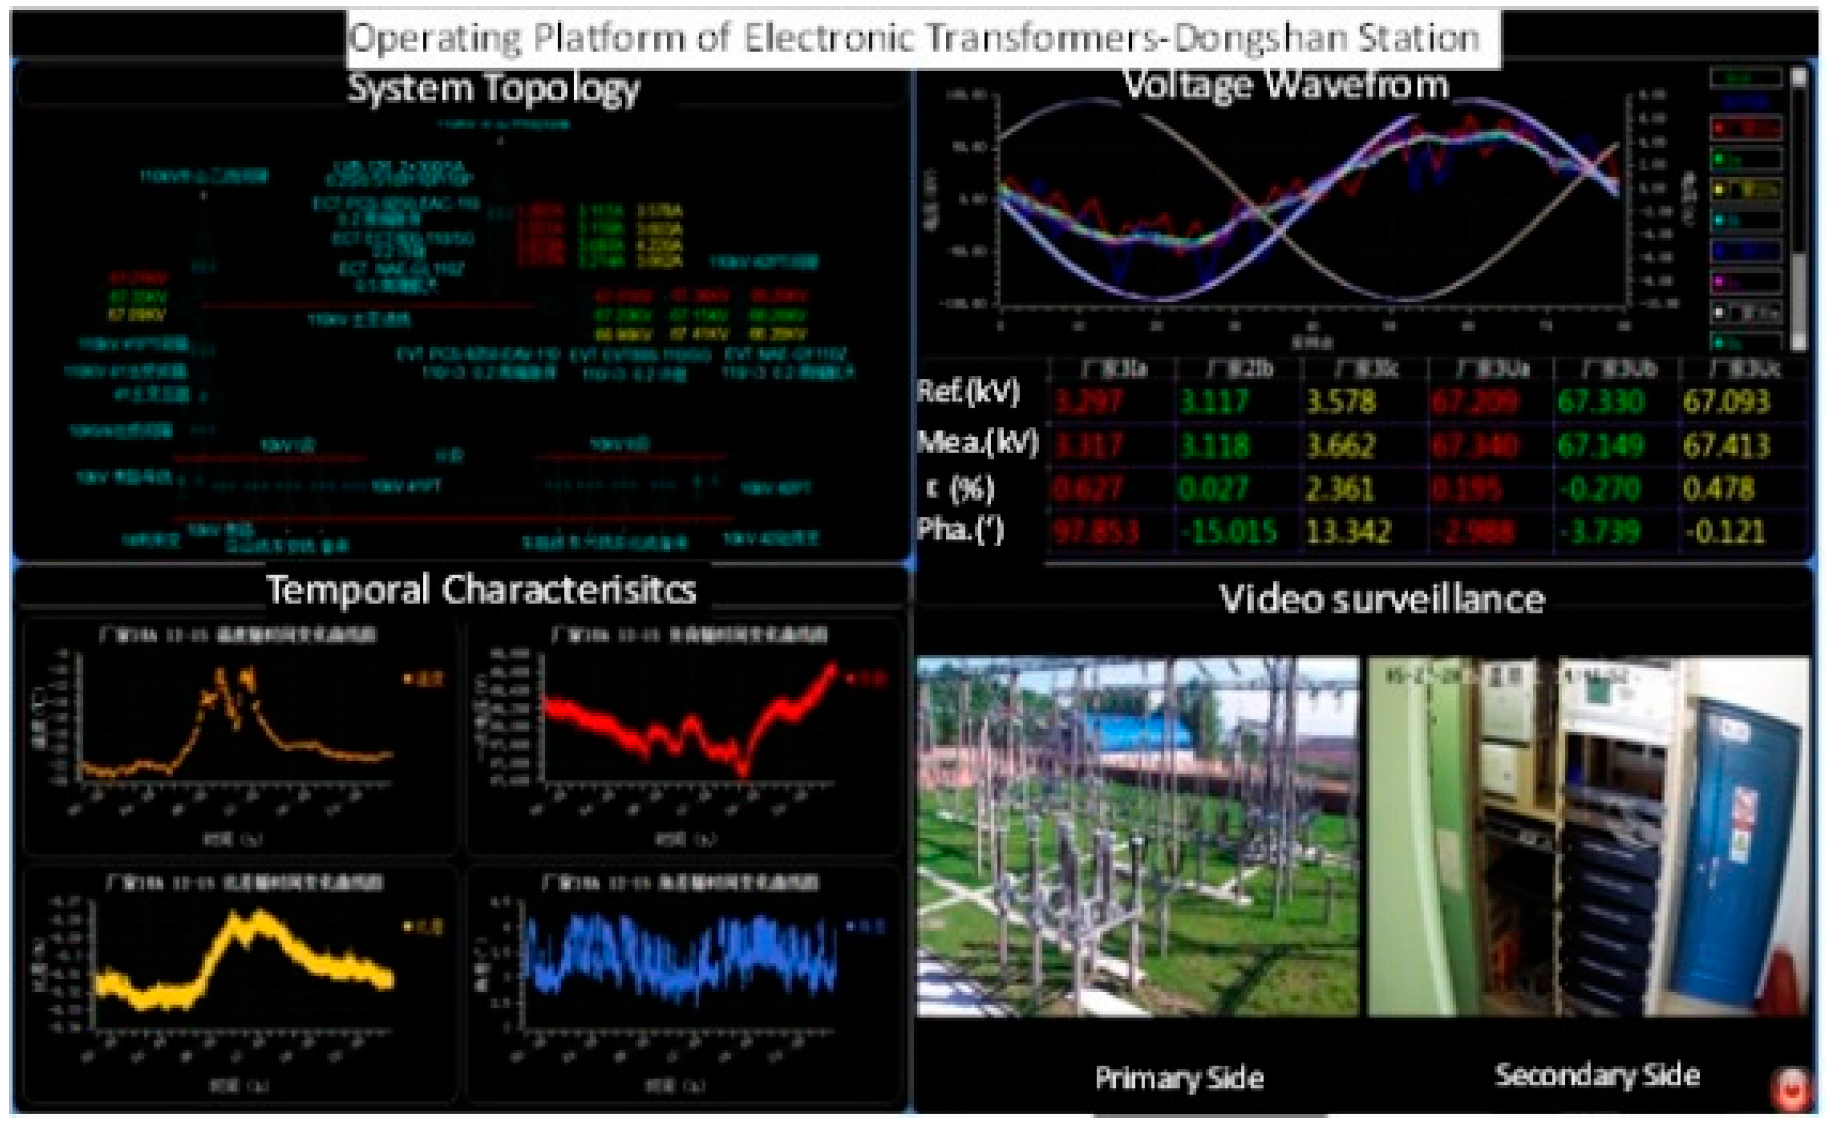
4.3. Error Characteristics of OVT in On-Site Operation
5. Discussion
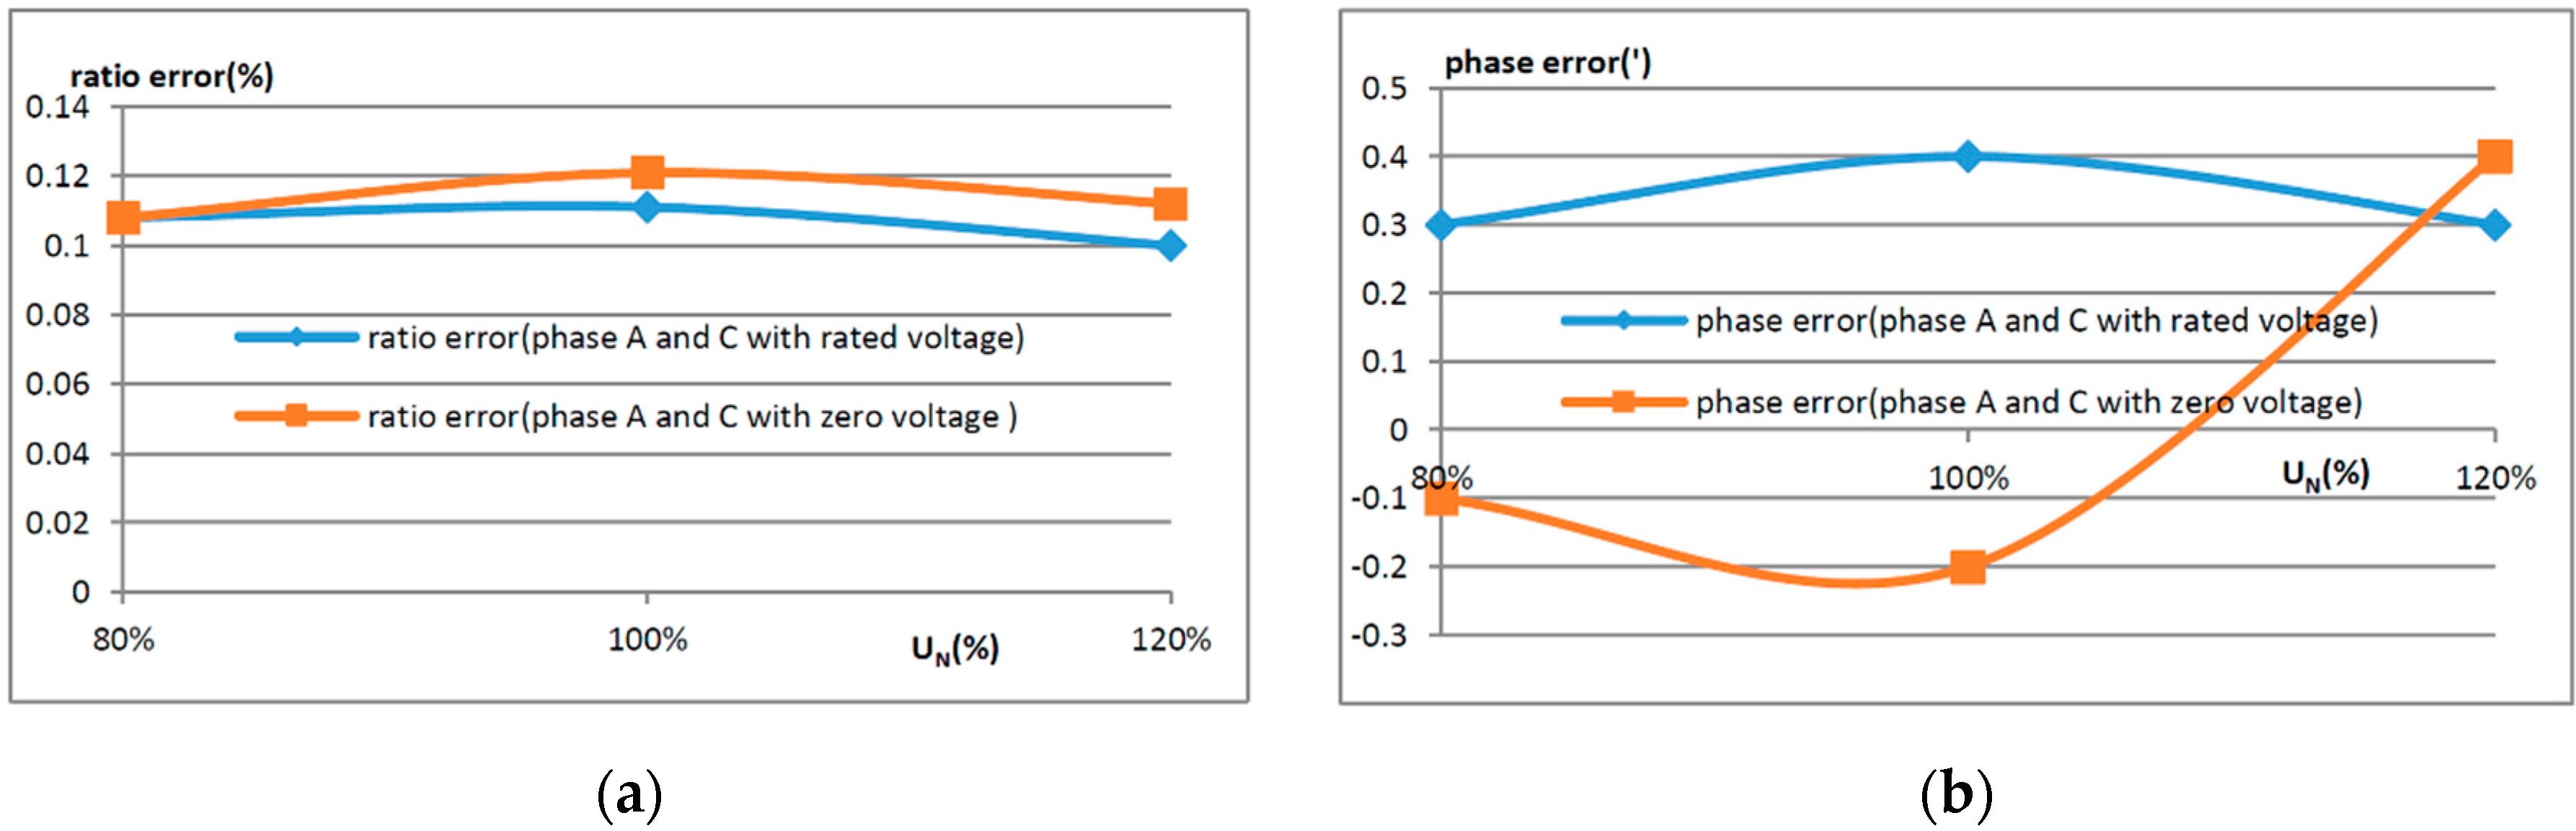
5.1. Effect of the Adjacent Phase
5.2. Differences of the Laboratory and On-Site Field Test Results
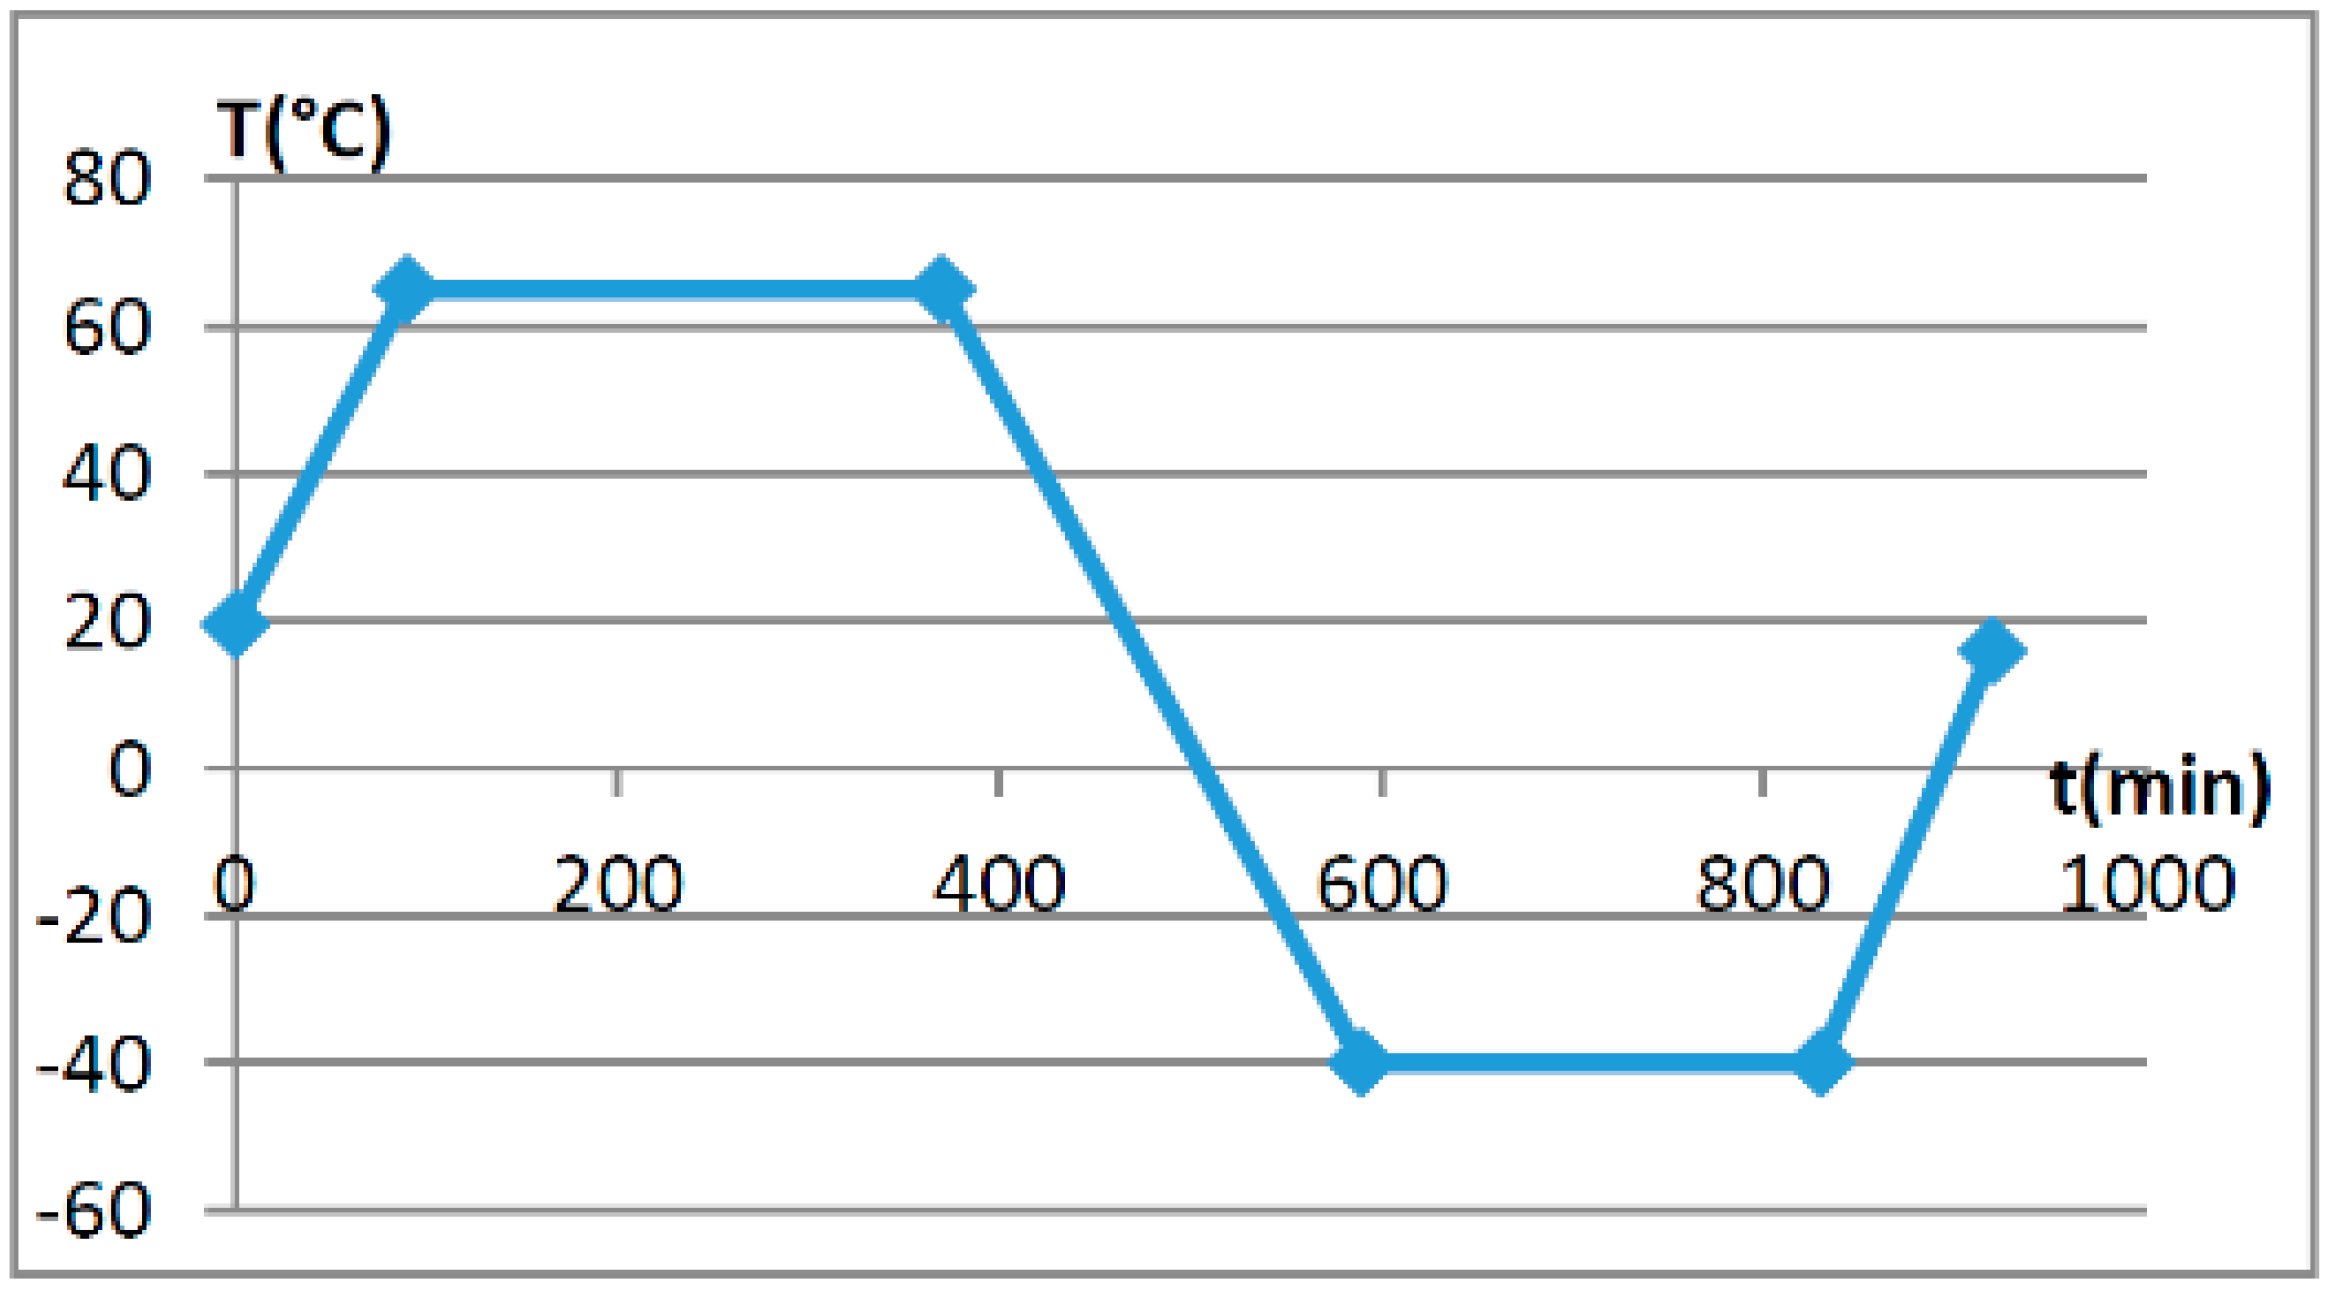
5.3. Differences of Temperature Characteristics
Acknowledgments
Author Contributions
Conflicts of Interest
Abbreviations
| OVT | Optical Voltage Transformer |
| MDPI | Multidisciplinary Digital Publishing Institute |
| DOAJ | Directory of Open Access Journals |
| TLA | Three letter acronym |
| LD | linear dichroism |
References
- Rahmatian, F.; Ortega, A. Applications of optical current and voltage sensors in high-voltage systems. In Proceedings of the 2006 IEEE/PES Transmission and Distribution Conference and Exposition: Latin America, Caracas, Venezuela, 15–18 August 2006; pp. 1–4.
- Marchese, S.V.; Bohnert, K.; Wildermuth, S.; van Mechelen, J.L.M.; Steiger, O.; Rodoni, L.C.; Eriksson, G.; Czyzewski, J. Electro-optic voltage sensor based on BGO for air-insulated high voltage substations. In Proceedings of the 2013 IEEE Photonics Conference, Bellevue, WA, USA, 8–12 September 2013; pp. 608–609.
- Li, H.; Cui, J.; Shi, M. Application of optical voltage transformer in digital substation. Chin. Electr. Power Technol. Ed. 2012, 11, 460–462. [Google Scholar]
- Sanders, G.A.; Blake, J.N.; Rose, A.H.; Rahmatian, F.; Herdman, C. Commercialization of fiber-optic current and voltage sensors at NxtPhase. In Proceedings of the 15th Optical Fiber Sensors Conference, Portland, OR, USA, 10 May 2002; pp. 31–34.
- Rahmatian, F.; Chavez, P.P.; Jaeger, N.A. 138 kV and 345 kV wide-band SF 6-free optical voltage transducers. In Proceedings of the Power Engineering Society Winter Meeting, New York, NY, USA, 27–31 January 2002; pp. 1472–1477.
- Li, J.; Zheng, Y.; Gu, S.; Xu, L. Application of Electronic Instrument Transformer in Digital Substation. Autom. Electr. Power Syst. 2007, 31, 94–98. [Google Scholar]
- Liu, B.; Ye, G.; Guo, K.; Tong, Y.; Hu, B.; Wan, G. Quality Test and Problem Analysis of Electronic Transformer. High Voltage Eng. 2012, 38, 2972–2980. [Google Scholar]
- Ding, T.; Xu, E.; Wu, H.; Wang, X.; Yang, N.; Liu, Z.; Jiao, J. Measurement and Problem’s Analysis of the On-Site Error for Electronic Transformer. Electr. Meas. Instrum. 2011, 48, 36–39. [Google Scholar]
- Lee, K.S. Electrooptic Voltage Sensor: Birefringence Effects and Compensation Methods. Appl. Opt. 1990, 29, 4453–4461. [Google Scholar] [CrossRef] [PubMed]
- Wang, H. Research of Capacitor Divider Optical Voltage Transducer. Ph.D. Thesis, Harbin Institute of Technology, Harbin, China, 2010. [Google Scholar]
- Arpaia, P.; Daponte, P.; Grimaldi, D.; Michaeli, L. ANN-based error reduction for experimentally modeled sensors. IEEE Trans. Instrum. Meas. 2002, 51, 23–30. [Google Scholar] [CrossRef]
- Filippov, V.N.; Starodumov, A.N.; Minkovich, V.P.; Lecona, F.G.P. Fiber sensor for simultaneous measurement of voltage and temperature. IEEE Photonics Technol. Lett. 2000, 12, 1543–1545. [Google Scholar] [CrossRef]
- International Electrotechnical Commission. Instrument Transformers—Part 7: Electronic Voltage Transformers; International Electrotechnical Commission: Geneva, Switzerland, 1999. [Google Scholar]
- Wu, W.; Xu, Y.; Xiao, X.; Hu, H. Research on Proximity Effect in Measuring Error of Active Electronic Voltage Transformers. IEEE Trans. Instrum. Meas. 2016, 65, 78–87. [Google Scholar] [CrossRef]
- Chen, G.; Liao, L.; Hao, W. Fundermentials of Crystal Physics, 2nd ed.; Science Press: Beijing, China, 2007. [Google Scholar]
- Xiao, X.; Xu, Y.; Dong, Z. Thermodynamic modeling and analysis of an optical electric-field sensor. Sensors 2015, 15, 7125–7135. [Google Scholar] [CrossRef] [PubMed]
- Xiao, X.; Xu, Y.; Xu, K.; Ye, M. Influence of temperature and stress field on optical voltage sensor. In Proceedings of the 2009 Symposium on Photonics and Optoelectronics, Wuhan, China, 14–16 August 2009; pp. 1–4.


| Three Cases | Test Time | Test Site | Remarks |
|---|---|---|---|
| Laboratory | 23 March 2014–3 April 2014 | Manufacturer | Temperature tests of OVT |
| 17 April 2014–18 April 2014 | State Grid Electric Power Research Institute, Wuhan | Adjacent phase effect tests on OVT | |
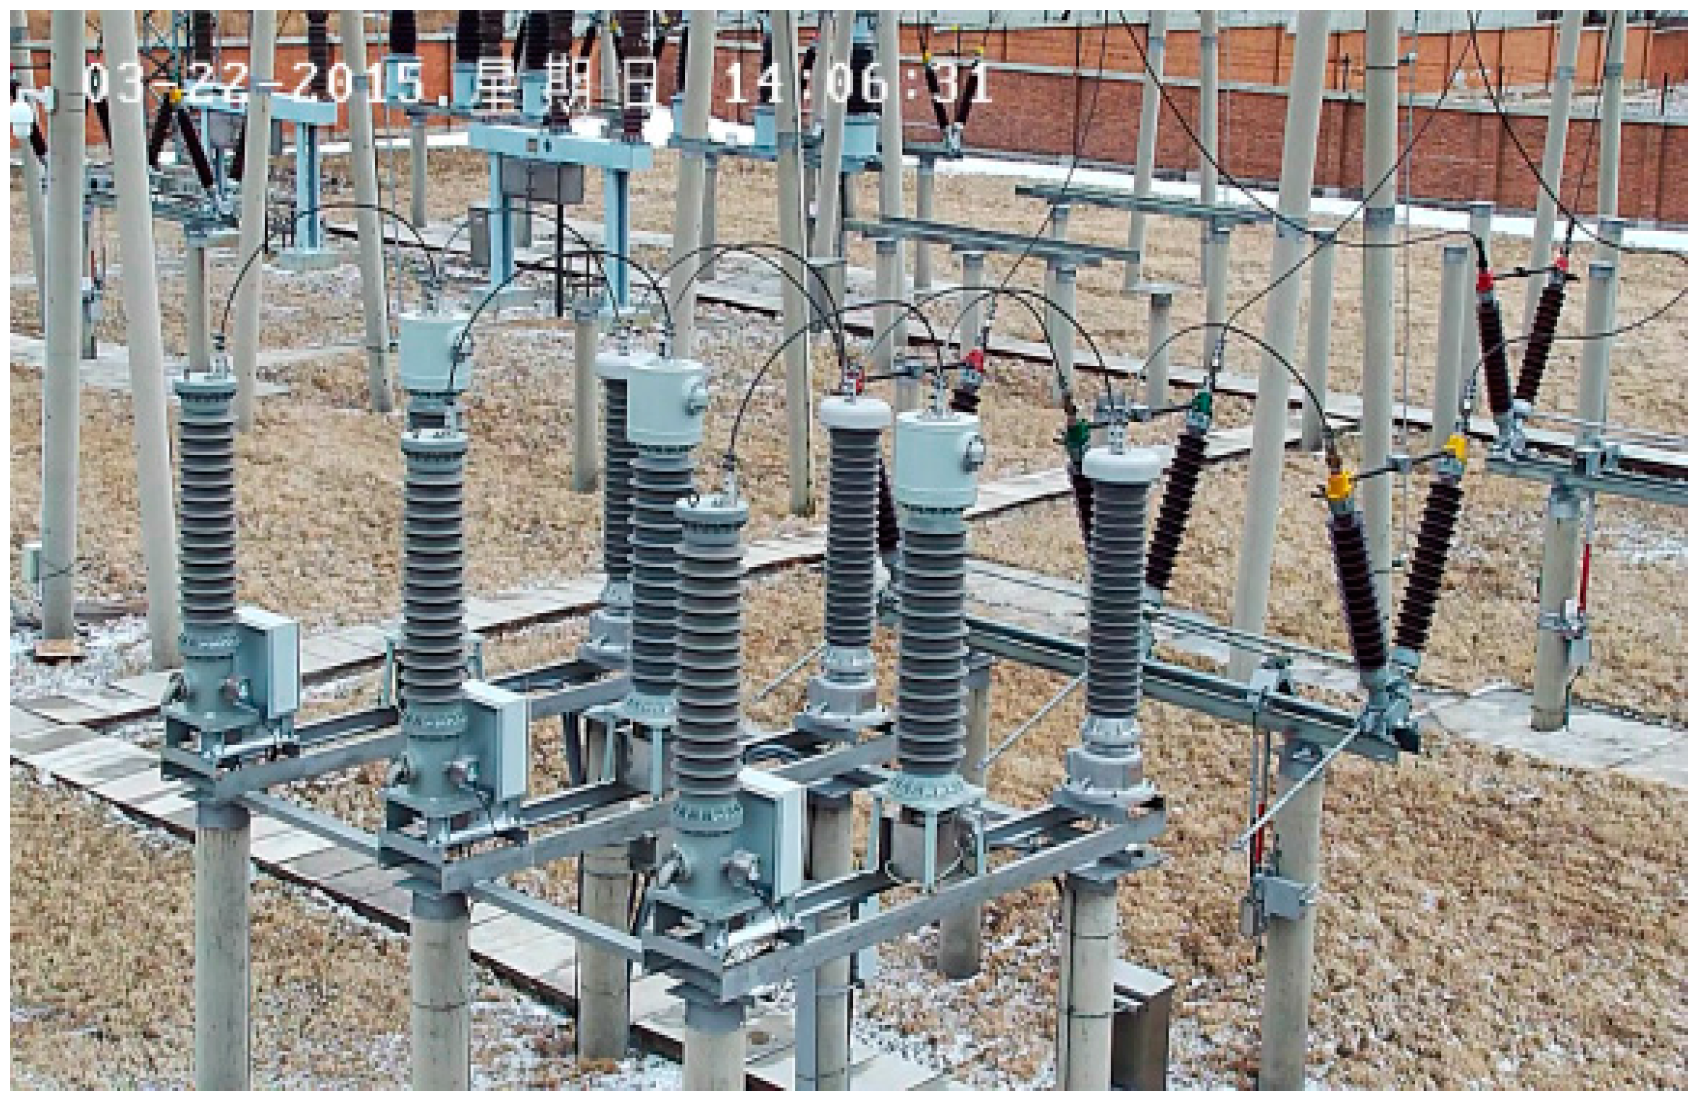
| Field off-line | 6 May 2014–9 May 2014 | Dongshan substation in Hegang City of Heilongjiang Province | The field off-line accuracy tests for OVT |
| On-line operation | 5 August 2014–2016 | Dongshan substation in Hegang City of Heilongjiang Province | The online operation of OVT |
© 2016 by the authors; licensee MDPI, Basel, Switzerland. This article is an open access article distributed under the terms and conditions of the Creative Commons Attribution (CC-BY) license (http://creativecommons.org/licenses/by/4.0/).
Share and Cite
Xiao, X.; Hu, H.; Xu, Y.; Lei, M.; Xiong, Q. Research on the Error Characteristics of a 110 kV Optical Voltage Transformer under Three Conditions: In the Laboratory, Off-Line in the Field and During On-Line Operation. Sensors 2016, 16, 1303. https://doi.org/10.3390/s16081303
Xiao X, Hu H, Xu Y, Lei M, Xiong Q. Research on the Error Characteristics of a 110 kV Optical Voltage Transformer under Three Conditions: In the Laboratory, Off-Line in the Field and During On-Line Operation. Sensors. 2016; 16(8):1303. https://doi.org/10.3390/s16081303
Chicago/Turabian StyleXiao, Xia, Haoliang Hu, Yan Xu, Min Lei, and Qianzhu Xiong. 2016. "Research on the Error Characteristics of a 110 kV Optical Voltage Transformer under Three Conditions: In the Laboratory, Off-Line in the Field and During On-Line Operation" Sensors 16, no. 8: 1303. https://doi.org/10.3390/s16081303
APA StyleXiao, X., Hu, H., Xu, Y., Lei, M., & Xiong, Q. (2016). Research on the Error Characteristics of a 110 kV Optical Voltage Transformer under Three Conditions: In the Laboratory, Off-Line in the Field and During On-Line Operation. Sensors, 16(8), 1303. https://doi.org/10.3390/s16081303