Article

Analytical Study on Multi-Tier 5G Heterogeneous Small Cell Networks: Coverage Performance and Energy Efficiency

1
College of Computer Science and Electronic Engineering, Hunan University, Changsha 410082, China
2
State Key Laboratory of Integrated Service Networks, Xidian University, Xi’an 710071, China
*
Author to whom correspondence should be addressed.
Sensors 2016, 16(11), 1854; https://doi.org/10.3390/s16111854
Submission received: 31 August 2016 / Revised: 29 October 2016 / Accepted: 1 November 2016 / Published: 4 November 2016
(This article belongs to the Section Sensor Networks)

Abstract

:
In this paper, we investigate the coverage performance and energy efficiency of multi-tier heterogeneous cellular networks (HetNets) which are composed of macrocells and different types of small cells, i.e., picocells and femtocells. By virtue of stochastic geometry tools, we model the multi-tier HetNets based on a Poisson point process (PPP) and analyze the Signal to Interference Ratio (SIR) via studying the cumulative interference from pico-tier and femto-tier. We then derive the analytical expressions of coverage probabilities in order to evaluate coverage performance in different tiers and investigate how it varies with the small cells’ deployment density. By taking the fairness and user experience into consideration, we propose a disjoint channel allocation scheme and derive the system channel throughput for various tiers. Further, we formulate the energy efficiency optimization problem for multi-tier HetNets in terms of throughput performance and resource allocation fairness. To solve this problem, we devise a linear programming based approach to obtain the available area of the feasible solutions. System-level simulations demonstrate that the small cells’ deployment density has a significant effect on the coverage performance and energy efficiency. Simulation results also reveal that there exits an optimal small cell base station (SBS) density ratio between pico-tier and femto-tier which can be applied to maximize the energy efficiency and at the same time enhance the system performance. Our findings provide guidance for the design of multi-tier HetNets for improving the coverage performance as well as the energy efficiency.

1. Introduction

Driven by the proliferation of fast developing wireless devices and the emergence of new services, the wireless and mobile data traffic has been approximately doubling every year and this growth is continuing unabatedly [1]. According to the prediction and statistical analysis from International Telecommunication Union (ITU) [2], a 1000-fold increase in wireless and mobile traffic is expected between 2010 and 2025, with a further 10–100 times growth in the period from 2020 to 2030. To address this exponential growth of mobile data traffic, various solutions are needed to meet the continuously increasing demand and offload traffic for the current cellular networks [3]. With the evolution to LTE and 5G, the cellular network has developed as a multi-tier network that comprises a conventional cellular network (i.e., macrocell network) with multiple low-power base stations (i.e., small cells) [4]. Massive use of small cells in such heterogeneous networks (HetNets), including picocells and femtocells overlaid on a macrocell network, is one of the promising techniques to cater for the ever increasing huge demand for future wireless data [5,6,7].
Nevertheless, the random deployment of a diverse set of small cells in HetNets makes resource management become increasingly complicated, because each tier of small cell base stations, e.g., the pico-tier and femto-tier, consisting of picocells and femtocells, respectively, is likely to have distinctly different characteristics [8,9]. The existing macrocell base stations (MBSs) are regularly deployed and with high transmission power such as to provide wide-range coverage and wireless access for the mobile users [9]. With a shorter communication range, picocells operate in the licensed spectrum with medium transmission power and offload traffic from the macrocell in hotspot areas [5,8]. Femtocells, which have very small coverage areas and much lower transmission power, are able to provide better quality of service (QoS) and higher data rates for their associated users [10]. In addition, the enormous number of running small cell base stations (SBSs) makes the energy consumption in the cellular network raise to a whopping value [11]. This in turn causes considerable increase in the cellular network operational burden and restricts the green development of heterogeneous small cell networks [12,13]. Therefore, the study of the performance enhancement and energy efficiency in HetNets is one of the key concerns, especially for the dense small cell scenarios.
Lots of research has focused on investigating the relationship between coverage performance and base stations’ density [14,15,16,17,18,19,20]. In [14], the system throughput for two-tier HetNets is verified by evaluating the areal capacity, and this is provided for co-channel scenario (CCS) as well as separate channel scenario (SCS) regarding the BS density. In [15], the authors investigate the aggregate interference statistics under several assumptions, such as always-on-BSs and uncorrelated interferers. The closed-form solutions of the average rate and optimal deployment density are derived for homogeneous interference-limited picocell networks. In [16], the authors study the relation between network capacity and the density of micro base stations in heterogeneous networks that consist of a macro base station and micro base stations. In [17], the authors investigate the capacity problem of heterogeneous two-tier wireless networks in four types of scenarios under a given delay constraint. The authors in [18] analyze the optimal BS density for both homogeneous and heterogeneous cellular networks with a service outage probability constraint. A small cell deployment scheme (SDS) is proposed in [19] to optimize the network throughput over time-varying distributions of users’ locations, in which the network throughput is improved by integrating the cooperation and resource allocation across small cells. One interesting finding in [14,15,16,17,18,19] is that the network capacity does not increase monotonously with the BSs’ density. According to the existing works [14,15,16,17,18,19], the interesting result is twofold: (i) the network capacity can be improved by deploying a large number of BSs in the traditional macrocell network; (ii) the network capacity would not keep increasing monotonously with the BSs’ density. Therefore, in our study, we investigate the internal links between coverage performance and small cell density and expand this problem to the scenario of multi-tier heterogeneous networks.
On the other hand, much research pays attention to energy efficiency in such dense small cell networks. A novel approach for joint power control and user scheduling is proposed in [20] for optimizing energy efficiency in terms of bits per unit energy consumption in the ultra-dense small cell networks (UDNs). In [21], the authors assume that all BSs in a small cell network form a homogeneous Poisson point process and propose all-on and on-off power control schemes (PCS) to obtain the average achievable cell rates for a given small cell density. The authors in [22] determined the associated tradeoffs of energy efficient cellular networks through the deployment of small cells. The success probability and energy efficiency in homogeneous macrocell (single-tier) and heterogeneous networks (two-tier) are both derived in [22], which confirms that the deployment of small cells leads to high energy efficiency, but this gain saturates as the density of small cells increases [23].
All those previous works on the system performance in a heterogeneous small cell network, in other words, how to characterize the coverage performance and energy efficiency and investigate the inherent relationship between them and the small cells deployment density, are still fairly minimal. In particular, all those previous works focus on addressing the small cell deployment problem for the two-tier HetNets which are formed of traditional macrocells overlaid by a single small cell tier such as picocells or femtocells. Moreover, there is a lack of consideration for the users’ load-heterogeneity that comes out of different small cell tiers.
In this paper, we lay emphasis on exploring the intrinsic links among coverage performance, energy efficiency and small cell density in the multi-tier heterogeneous networks. In this context, we propose an analytical framework for a multi-tier heterogeneous network with the purpose of obtaining the maximum energy efficiency and achievable throughput without substantially degrading the coverage performance in the meantime. Firstly, we use the baseline Poisson point process (PPP) for tractably modeling the multi-tier HetNets system [24] and we analyze the Signal to Interference Ratio (SIR) via studying the cumulative interference from each tier. By utilizing stochastic geometry tools, we then derive the analytical expressions of coverage probability and throughput for pico-tier as well as femto-tier. In order to evaluate the system performance, we devise the disjoint channel allocation scheme and study the system channel throughput for small cell tiers by taking user experience into consideration. Different from the existing works, we formulate the energy efficiency optimization problem under constraints of throughput and resource allocation fairness. To solve this problem, we devise a linear programming based method to generate the available area to obtain the feasible solutions. Through the system-level simulations, we present how the varying of system parameters affects coverage performance and energy efficiency. The comparative studies demonstrate that our proposed method is able to achieve better system performance when compared with existing methods. The optimal pico-femto density ratio for the dense small cells is verified, which can be used to guide the topological design for the multi-tier HetNets.
The remainder of the paper is organized as follows: Section 2 presents the modeling of the multi-tier HetNets and the SIR analysis. Section 3 derives the coverage probability to study the coverage performances for pico-tier and femto-tier respectively. Section 4 devises the channel allocation scheme and defines the system throughput for different tier. Section 5 formulates the energy minimization problem and proposes its solution based on linear programming. Section 6 provides numerical results based on the system-level simulations. Finally, Section 7 concludes the paper.

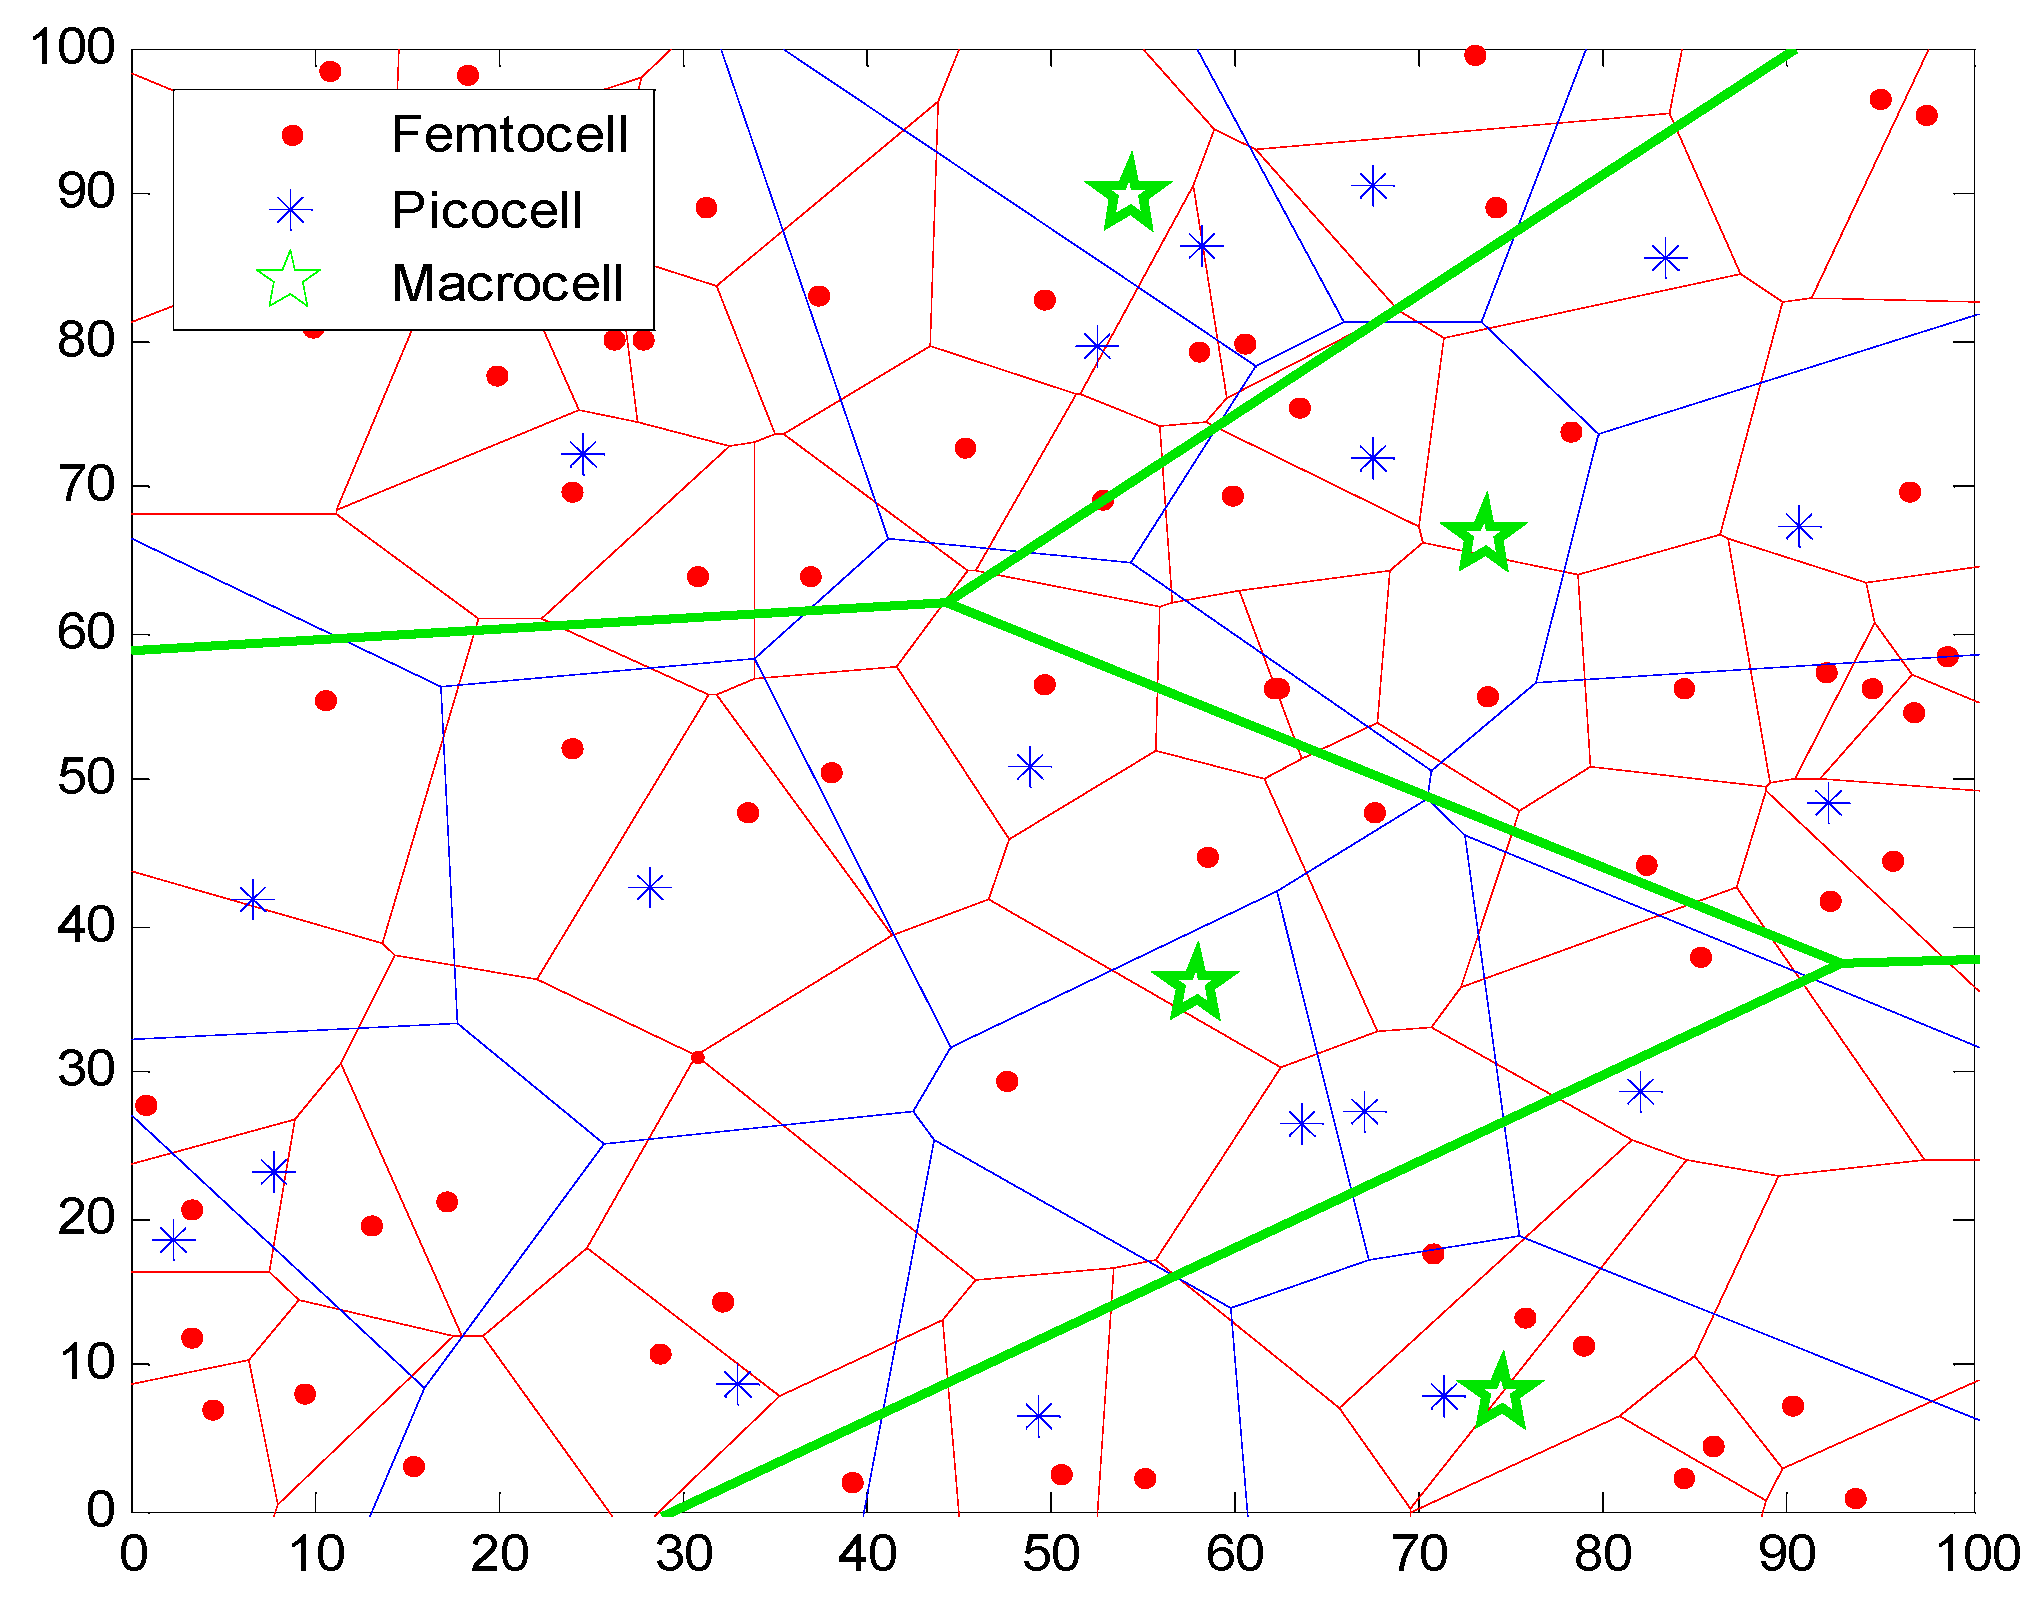
2. Modeling of Multi-Tier Heterogeneous Networks

According to [25], a concise and tractable model begins with a spatial point process to statistically model the base station locations in HetNets. The simplest and best known such point process, namely the Poisson point process (PPP) [26], assumes that base stations in each small cell tier are independently distributed with density λs. In this study, we consider a multi-tier heterogeneous network consisting of macrocells and two different types of small cells, picocell and femtocell, which constitutes pico-tier and femto-tier, respectively. As shown in Figure 1, the PPP distribution of macrocells and small cells are illustrated. Picocell base stations (PBSs) are deployed to enhance the coverage of a macrocell for a wide range whose coverage radius is Rp. Femtocell base stations (FBSs) are used for homes, offices and other personal area that have high speed traffic demands. Let Rf denote the coverage radius of FBS and we have Rp > Rf. Hence, in the pico-tier, we can assume the PBS deployment distribution follows PPP of density λp. The picocell users’ distribution follows PPP of density μp. In order to obtain the best link quality, each picocell user accesses the nearest PBS as the serving base station. The distance between them is expressed as rp. Thus, according to the properties of PPP, the probability density function (PDF) of rp can be given by:
f p i c o ( r p ) = 2 π λ p r p   exp ( λ p π r p 2 )
where r p ( 0 , R p ) .
In the femto-tier, the FBS deployment distribution follows PPP of density λf. It is noteworthy that femtocells have very small coverage areas and much lower transmission power while providing better quality of service (QoS) and higher data rates for their associated users. Moreover, picocell users and femtocell users have different wireless traffic load demands. Therefore, we use different users’ distributions in order to describe load-heterogeneity of multi-tier heterogeneous networks. To this end, we assume that the femtocell user distribution follows a uniform distribution. Each femtocell user accesses the nearest FBS as the serving base station to ensure the best service experience. The distance between them is represented as rf. Therefore, based on probability theory, the PDF of rf can be expressed as [27]:
f f e m t o ( r f ) = 2 r f / R f 2
where r f ( 0 , R f ) .
The standard power loss propagation model is applied in our system model and the path loss exponent is set to α > 2 [28]. We assume that Rayleigh fading channel [29,30] exists between the user and the service base station, i.e., h~exp(1). Therefore, the signal power that the user receives from its serving base station can be calculated as Phr−α, where r represents the distance from the serving base station to the user, P represents the transmit power of the serving base station. Consider that the user is served by the small cell base station (SBS), i.e., femtocell base station or picocell base station in this study, the Signal to Interference plus Noise Ratio (SINR) of the user can be given as:
S I N R = P S h r α I r + δ 2
where PS is the transmit power of the small cell base station and δ denotes the noise power. In Equation (3), Ir is used to represent the cumulative interference power, which denotes the sum of the power that the user receives from all interfering base stations [31]. Ir can be given by:
I r = i Φ P S g i S R i α + j Θ P M g j M R j α
where, Φ represents the set of all interfering SBSs located in the same tier and Θ stands for the set of the macrocells; PM is the transmit power of the macrocell base station. Ri and Rj are the distance from the user to the i-th SBS and j-th MBS respectively and Ri > r is assumed. g i S and g i M are the channel gain of the i-th SBS and j-th MBS, respectively.
In [21] the authors proved that inter-cell interference is the main factor affecting the network performance. The thermal noise does not have a significant impact on the network performance. In addition, compared to the signal power and the interference power separately, the thermal noise power is smaller enough to be neglected. Thus, the thermal noise is not considered in our system model. Hence, we use Signal to Interference Ratio (SIR) instead of SINR and Equation (3) can be rewritten as:
S I R = P S h r α I r

3. Coverage Performance

Without loss of generality, the SIR threshold T is set for each tier in order to guarantee different tiers’ service quality [32,33]. The user is associated with the service base station if SIR is higher than T, which means that the user can access the tier successfully; on the contrary, the user is not in the coverage of the service base station once his current SIR is lower than T. This is the fundamental concept with which one can conduct statistical analysis on the coverage performance for the cellular networks. On the basis of this principle, which is adopted in [16,26,32,33], we obtain the definition of coverage probability in this section. Besides, we derive Lemmas 1 and 2 such as to give analytical expressions of coverage performance for multi-tier HetNets, namely pico tier and femto tier in our study.
Definition 1 (Coverage probability).
The average coverage probability of the user is considered as the conditional probability that the user can access to the SBS, which is defined as:
q = E [ p ( S I R > T | r ) ]

3.1. Coverage Performance of Pico-Tier

Lemma 1.
The average coverage probability of the picocell user, which is denoted by qp, can be expressed as:
q p = 0 R p L I r ( T P r α / P P ) 2 π λ P r   exp ( λ P π r 2 ) d r
where, Tp is the SIR threshold of the pico-tier, Pp is the transmission power of the picocell base station (PBS), L I r ( ) denotes the Laplace transform.
Proof. 
According to Equation (6), in the pico-tier, the average coverage probability of a picocell user, which is denoted by qp, can be given by:
q p = E [ p ( S I R > T p | r p ) ]
Based on Equation (5), qp in Equation (8) can be rewritten as:
q p = E ( p [ ( h P p r p α / I r ) > T p | r p ] )
By making use of the statistical distribution of rp and the definition of mathematical expectation, Equation (7) can be further transformed into the following expression:
q P = 0 R p p ( P P h r p α I r + δ 2 > T P | r p ) · 2 π λ P r p   exp ( λ P π r p 2 ) d r = 0 R p p ( h > T P r p α I r / P P | r p ) · 2 π λ P r p   exp ( λ P π r p 2 ) d r
Due to h~exp(1) [30], p ( h ) > ( T P r p α I r ) / ( P P | r p ) in Equation (10) can be further deduced as:
p ( h > T P r p α I r / P P | r p ) = E r p ( exp [ T p r p α I r / P P | r p ] ) = L I r ( S ) | S = T P r p α / P P
This completes the proof. ☐
Here, I r ( S ) S = T P r α / P P represents the Laplace transform of the cumulative interference power Ir that the picocell user receives. The deduction for I r ( S ) S = T P r α / P P can be found in Appendix A.

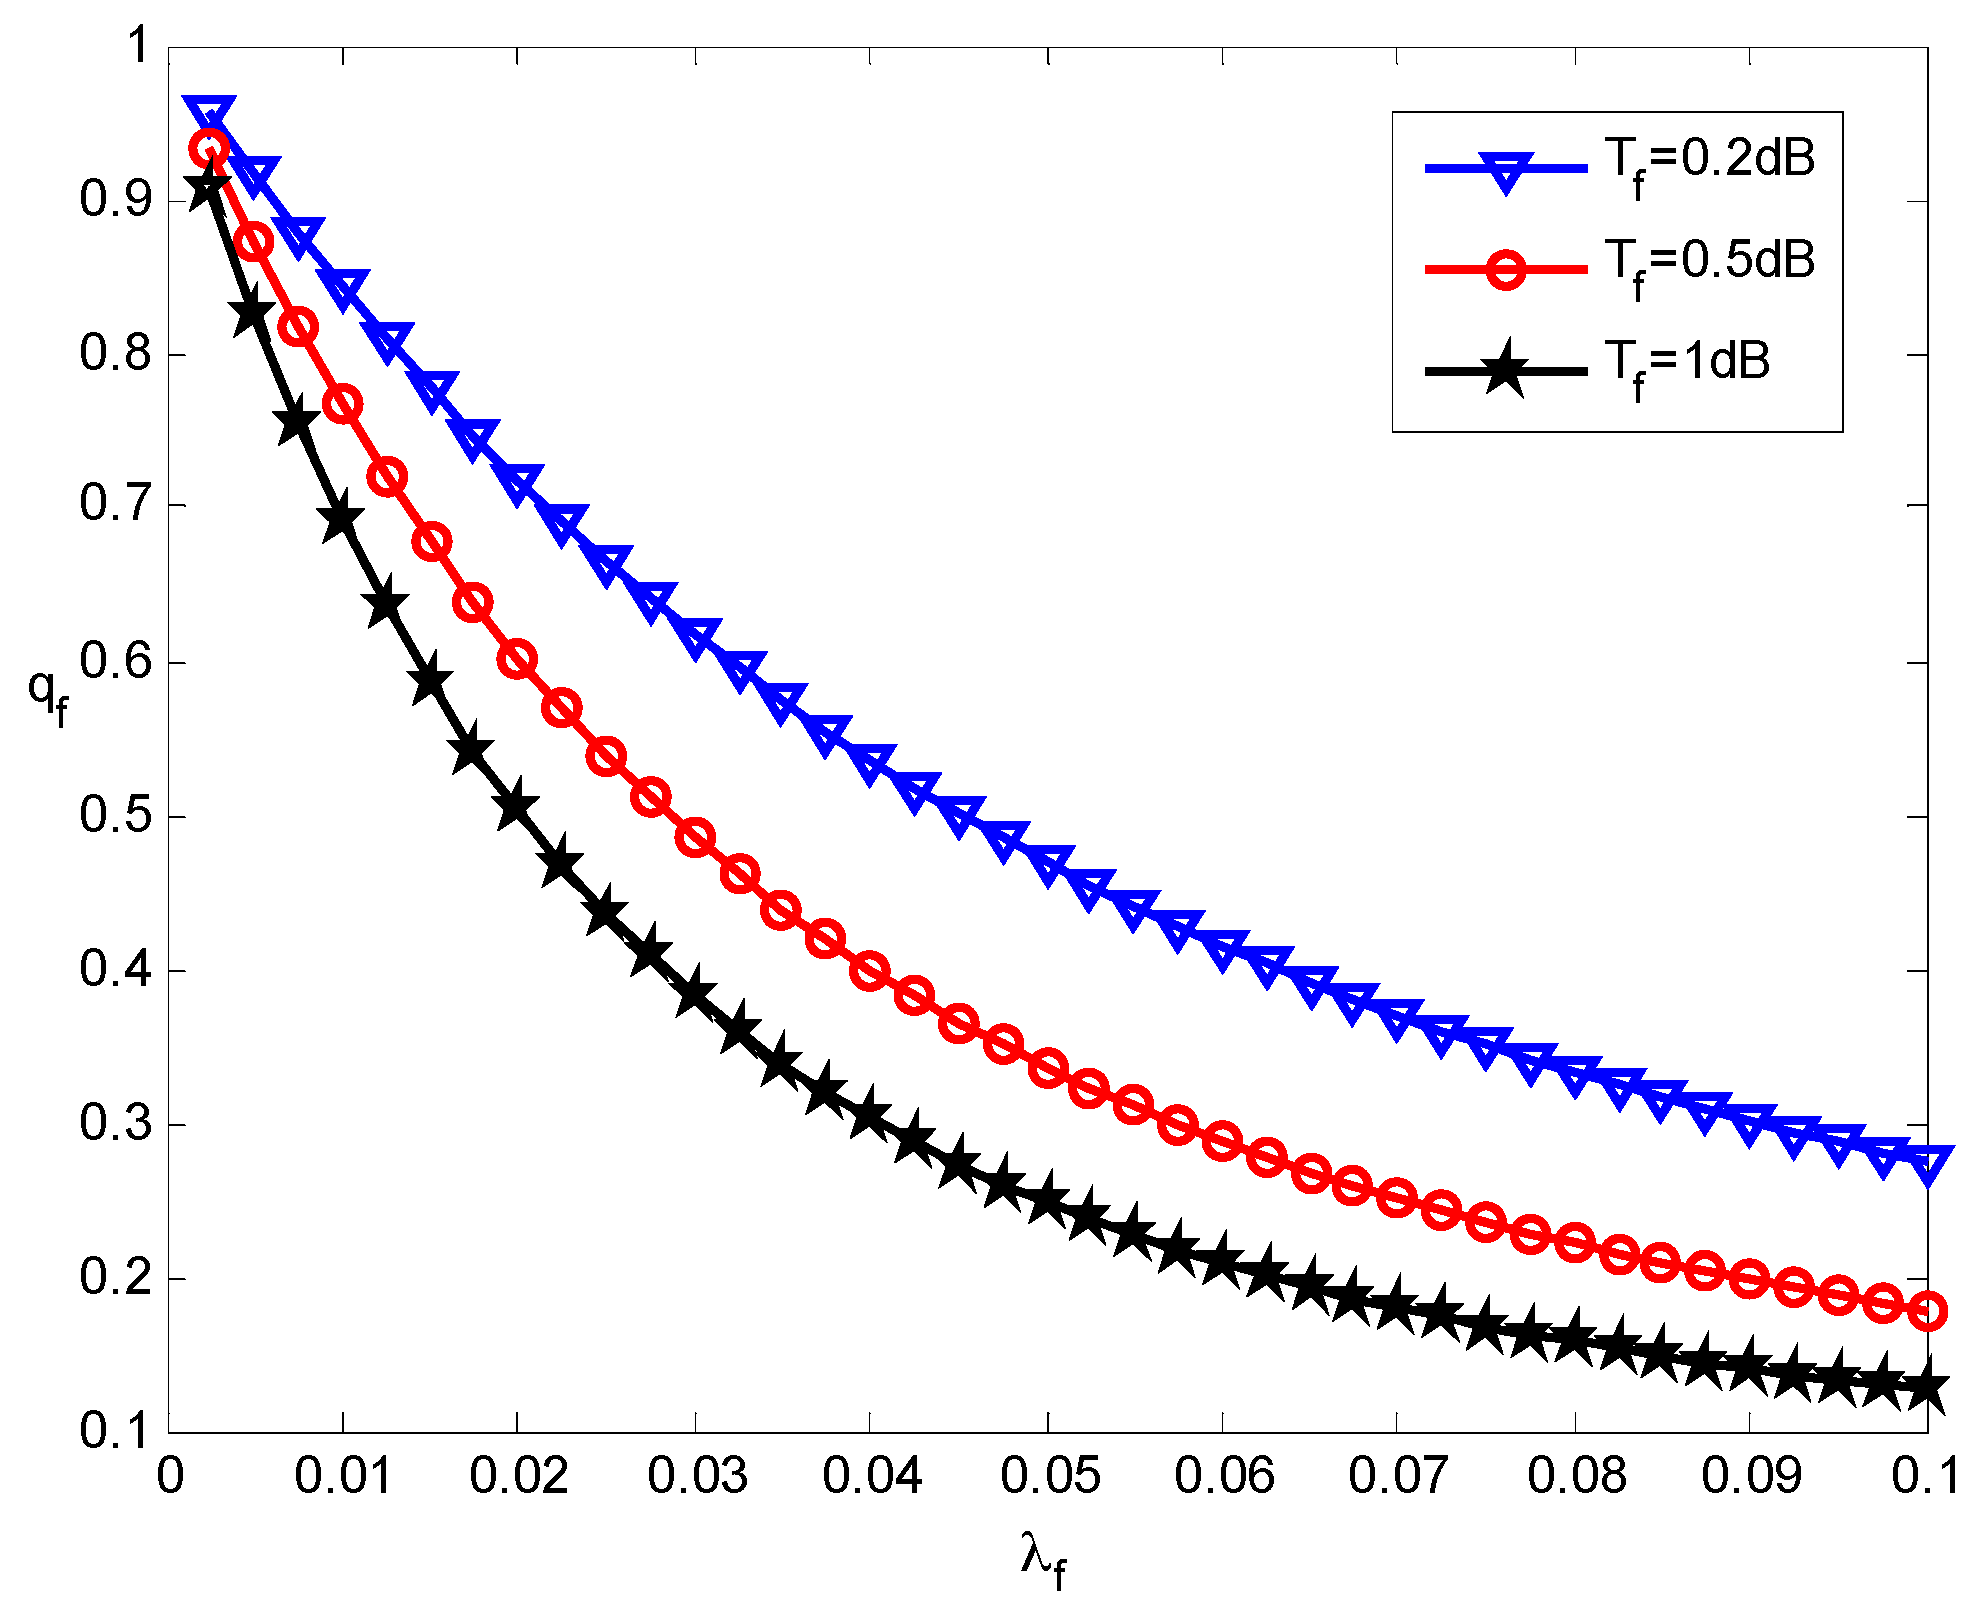
3.2. Coverage Performance of Femto-Tier

Lemma 2.
The average coverage probability of the femtocell user, which is denoted by qf and can be expressed by:
q f = 0 R f exp [ 2 π 2 λ f T f 2 / α r f 2 α sin ( 2 π / α ) ] 2 r f / R f 2 d r f
Proof. 
According to Equation (6), in the femto-tier, the average coverage probability of a femtocell user can be defined as:
q f = E [ p ( S I R > T f | r f ) ]
Based on Equation (2), taking advantage of the statistical distribution of rf and the definition of mathematical expectation, Equation (13) can be further expressed as the following expression:
0 R f p ( S I R > T f | r f ) f r f ( r f ) d r f = 0 R f p ( S I R > T f | r f ) 2 r f / R f 2 d r f
Recall the femto-tier follows a uniform distribution, we utilize the derived result for P(SIR>Tf|rf) from [18], which can be expressed by:
p ( S I R > T f | r f ) = exp [ 2 π 2 λ f T f 2 / α r f 2 α sin ( 2 π / α ) ]
Taking Equation (15) into Equation (14) gives the result Equation (12). This completes the proof. ☐

4. Channel Allocation and Throughput

This section defines the throughput for the pico-tier and the femto-tier, respectively, in order to facilitate the subsequent establishment of system energy efficiency optimization.

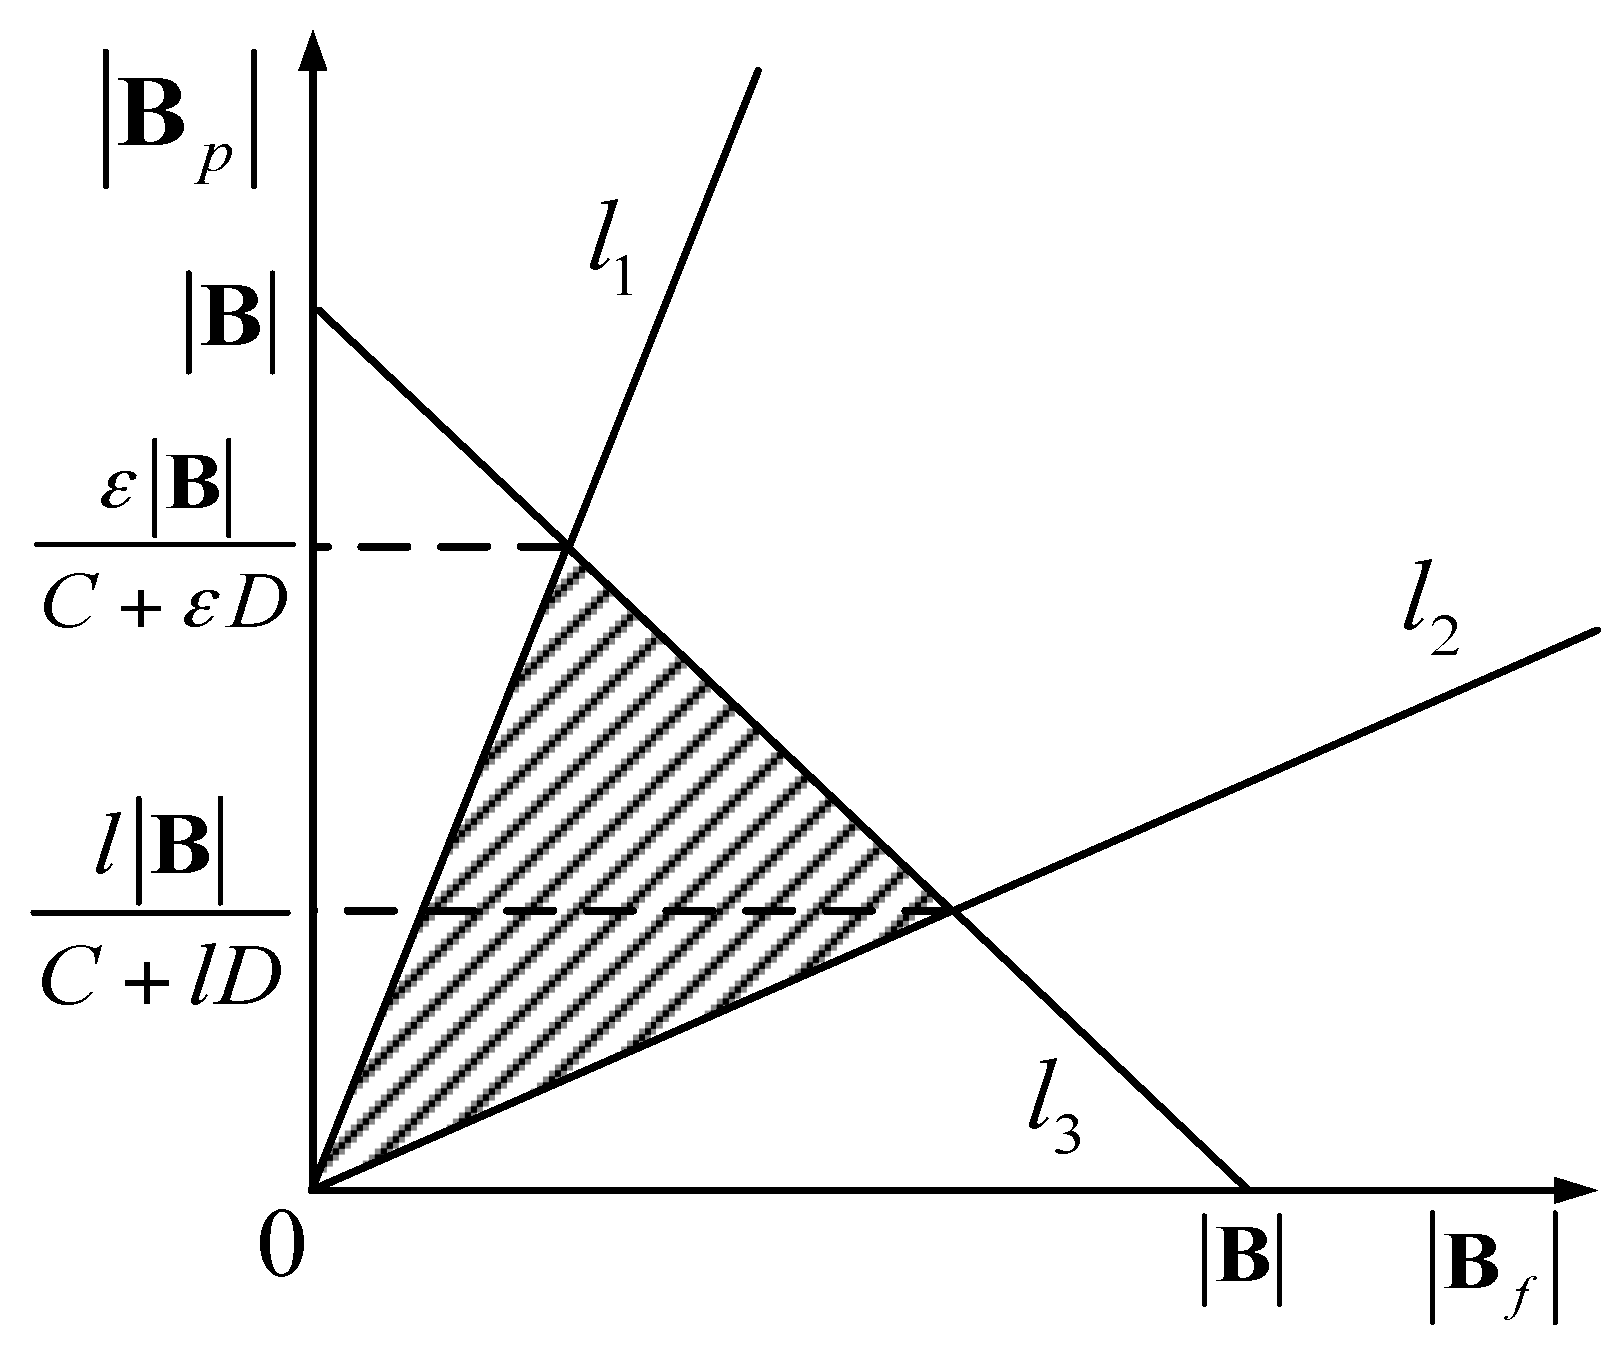
4.1. Channel Allocation

Without loss of generality, the total system bandwidth is set to be W. A fixed number of consecutive subcarriers compose a system channel whose bandwidth is w. Therefore, the total number of channels used in the multi-tier HetNets can be expressed as W/w. B = {w1, w2, w3,…, wn,…, wW/w} is a set which is composed of the total system channels. Let Bp and Bf denote the channels used by the pico-tier and femto-tier, respectively. We have Bp,BfB and BpBf = B. In order to eliminate the cross-tier interference between the pico-tier and the femto-tier, we assume BpBf = φ and Bp,Bfφ. Therefore, the coverage performance and the throughput performance of each tier rely only on the channels used by the corresponding tier, which is no longer affected by the channel used by other tiers in the multi-tier HetNets.

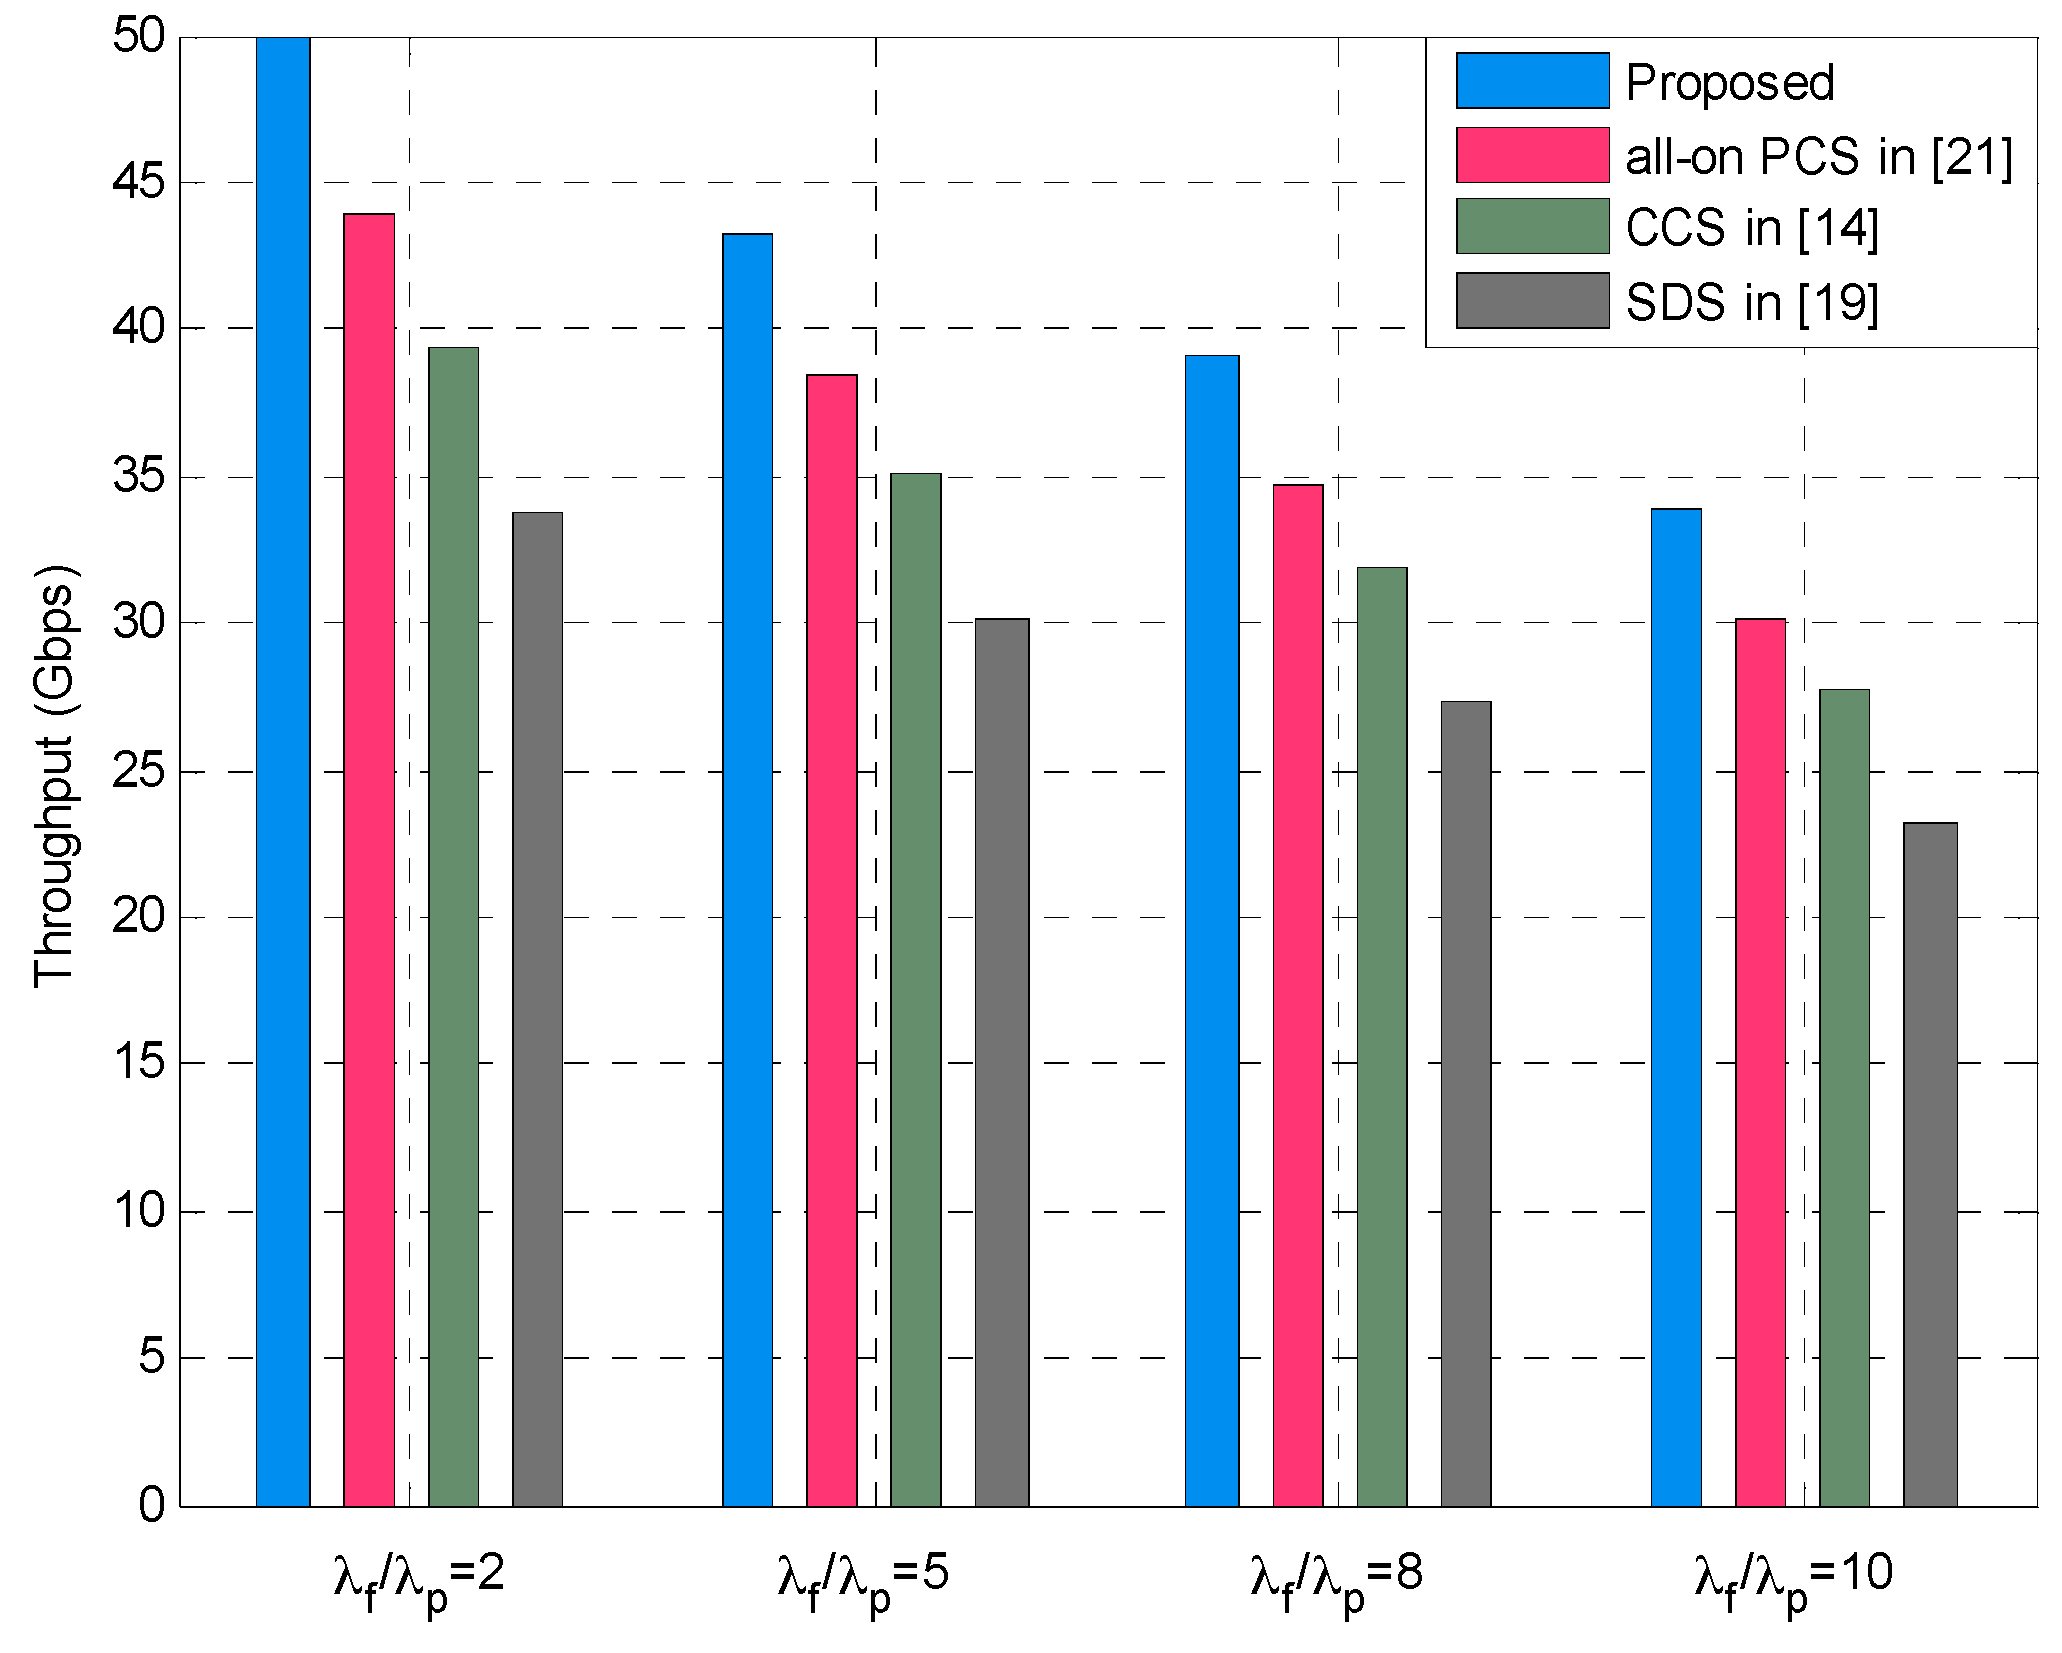
4.2. System Throughput

Definition 2 (System channel throughput).
The system channel throughput is defined as the throughput on any channel wn, n ∈ {1,2,3,…, W/w}, which can be given by:
Δ ( w n ) = q   log ( 1 + T )
The throughput of the pico-tier is defined as:
Δ p = λ p w p Β p Δ ( w p ) = λ p ( | Β p | q p   log ( 1 + T p ) )
where wp represents the channel used by the pico-tier.
Based on Definition 2, the throughput of the femto-tier is defined as:
Δ f = λ f w f Β f Δ ( w f ) = λ f ( | Β f | q f   log ( 1 + T f ) )
where wf represents the channel used by the femto-tier.
In conclusion, the throughput of the system model can be expressed as:
Δ s = Δ p + Δ f

5. Energy Efficiency Optimization

5.1. Fairness of Channel Allocation

We can see that according to Equations (17) and (18), no matter whether a pico-tier or femto-tier, the throughput of each tier increases linearly with the number of channels used by the tier. This shows that if the fairness of channel allocation is not taken into account when allocating channel resources for each tier, there could be large differences in the number of channels assigned to different tiers [34,35]. In addition, this will lead to situations where a certain tier has far more channels than other tiers. As a result, the user experience of this tier is much better than in other tiers, while the user experience of other tiers is relatively low. Therefore, in order to avoid the unfairness of channel allocation, we establish the following fairness of channel allocation from the perspective of the throughput performance of each tier:
ε | Β p | q p   log ( 1 + T p ) | Β f | q f   log ( 1 + T f )
where the upper and lower bounds ε are the pre-set variables.

5.2. Optimization of Energy Efficiency

Based on the channel allocation fairness, the optimization problem of system energy efficiency maximization is formulated to explore how the SBS deployment density affects the system energy efficiency.
Definition 3 (Energy efficiency).
The system energy efficiency is defined as the ratio of the system throughput to the power consumption per unit area within the system model, which can be given by:
η E E = Δ s λ p P p + λ f P f
Then, the energy efficiency maximization problem of the system model can be induced to the following optimization problem:
max | Β p | , | Β f | η E E
s . t .   | Β p | q p   log ( 1 + T p ) | Β f | q f   log ( 1 + T f )
| Β p | q p   log ( 1 + T p ) | Β f | q f   log ( 1 + T f ) ε
| Β p | + | Β f | | Β |
We propose a linear programming-based approach to derive an available area in order to solve the problem in Equation (22) with low computional complexity. The constraints of throughput performance and resource allocation fairness are shown in Figure 2, in which lines l1, l2 and l3 represent Equations (23)–(25), respectively. In Figure 2, for the sake of simplicity, we let C and D stand for qplog(1 + Tp) and qflog(1 + Tf), respectively. The area on the right of l1 and above l2 is where the minimum figure is satisfied.
Although we design a linear programming-based approach for the proposed optimization problem, channel allocation and throughput leading to solve the optimization problem in closed form is quite difficult due to the non-trivial relations between the small cells’ deployment. It is noteworthy that the macrocells and small cells are randomly distributed in the multi-tier HetNets. In addition, the small cells’ users are located within their serving SBS in a random manner. For instance, the location of femtocell users is random and follows a uniform distribution. Based on Figure 2, we mainly focus on the avalaible area where the optimal solution is more likely to appear. It implies we can find the optimal solution with numerical calculations. Therefore, in the next section, we implement numerical simulations to explore how the small cells coverage performance and system energy efficiency vary with the SBS deployment density ratio and other parameters.

6. Simulation Results and Analysis

6.1. Simulation Setup

In this section, we evaluate the performance of multi-tier heterogeneous networks and assess how the coverage performance and the energy efficiency change with the small cells’ deployment density. The distributions of macrocells, picocells and femtocells are independently distributed and follow the Poisson point process (see Figure 1). We do the simulations by Matlab2013a and numerical simulation results are computed after averaging 1000 independent runs. We use the generic WINNER II channel model [36] in the simulation to obtain reliable results. The key simulation parameters are set up according to [37] and are given in Table 1. The path loss models are based on [38]. The pre-set variables and lower bounds ε are set to 0.2 and 0.8, respectively.

6.2. Discussion and Analysis Results

We first look into the coverage performance of the pico-tier and femto-tier with various deployment densities. In the simulation, we obtain the numerical results of coverage probabilities by using Lemmas 1 and 2. Figure 3 shows the coverage probability of pico-tier varies with different picocell densities and various SIR threshold values. With the growth of the picocell density λp, the picocell users’ average coverage probability qp increases under different SIR thresholds Tp. The reason behind this is that the picocell users are closer to their associated picocells when there are more picocells deployed. Hence, it is more likely that the received SIR at the picocell users can exceed the pico-tier SIR threshold (namely Tp). As a result, the coverage performance is improved. We can also see that for each choice of Tp, qp converges to a stable value when λp keeps increasing. This is because the inter-picocell interference will be more severe asλp increases. In addition, it can be seen that qp drops when enlarging Tp under the same λp, in other words, the coverage performance of the pico-tier declines. This is because it is more difficult for users to access pico-tiers when the pico-tier SIR threshold becomes larger.
Figure 4 presents the relationship between the coverage performance of femto-tier and the femtocell deployment density under the various SIR thresholds. We see that the femtocell users’ average coverage probabilities qf decrease as the femtocell deployment density λf increases, which is contrary to the case of pico-tiers. That is because that increasing λf will cause more severe intra-femto-tier interference and hence this decreases coverage performance in the femto-tier. Moreover, for a given λf, qf decreases when the femto-tier SIR threshold Tf grows. These results from the fact that using a larger Tf would degrade the coverage performance of the femto-tier, which is consistent with the pico-tier results (see Figure 3). According to the results from Figure 3 and Figure 4, the interference-limited effect appears when the density of small cells increases. Therefore, by increasing λp (or λf) will cause more considerable inter-small cells interference and this in turns results in an overall decrease of the coverage performance.
We then assess how the small cells density affects the energy efficiency. Figure 5, Figure 6 and Figure 7 present the effects that the picocell and femtocell deployment density ratio has on the system energy efficiency under the various SIR thresholds. In these simulations, we set the picocell deployment density λp = 0.01/m2. It can be found out that the energy efficiency ηEE rises rapidly to a peak value and then decreases with the increasing deployment density ratio λf/λp. This proves that deploying the femtocells can improve the energy efficiency to some extent under varying picocell deployment density conditions. Nevertheless, the energy efficiency can be reduced when the femtocell deployment density exceeds a certain value. According to Definition 3 (see Section 5.2), this is because excessive femtocell deployment will cause serious inter-cell interference and result in a gradual decrease of the coverage performance, which thus determinates the throughput of femto-tier.
Moreover, we can observe the growth of ηEE with the increase of Tf under a given Tp. For example, we can look at the results from Figure 6 and Figure 7, in which Tp is set to 5.5 dB and 6.5 dB, respectively. The larger Tf will decrease the coverage performance because it will hinder more users from accessing femtocells, which is supported based on the results from Figure 4. However, it brings a benefit for the users that are able to access the femto-tier, in other words, these users, which can receive rather good SIR, will have more channel resources. Therefore, the throughput in the femto-tier is improved. In addition, by comparing the results in Figure 5, Figure 6 and Figure 7, we can see that ηEE increases with the increase of Tp. This is because with the increase of the pico-tier SIR threshold, the accessed picocell users can be assigned more channel resources. As a consequence, this improves the throughput of picocell users and enhances the energy efficiency.
Furthermore, we study how the system energy efficiency varies with the femtocell and picocell deployment density ratio with different picocell deployment densities. Figure 8, Figure 9 and Figure 10 present the impact of small cells’ density ratio on the energy efficiency under various SIR requirements. In Figure 8, three curves can be seen which indicate that the system energy efficiency ηEE increases first and then decreases with the increasing small cell density ratio λf/λp when the picocell deployment density λp is set to 0.01, 0.02 and 0.03, respectively. Consistent results can be found in Figure 9 and Figure 10. Hence, the number of femtocells should not be much larger than the number of picocells, otherwise, this will cause severe intra femto-tier interference and result in significant energy consumption, which thus decreases the system energy efficiency. When studying the simulation results under different values of Tp and Tf , it can be found that better energy efficiency is obtained with larger Tp and Tf. For example, ηEE in Figure 9 is better than that in Figure 10, since Tf is set to 1.0 dB in Figure 9 while Tf is 0.5 dB in Figure 10. This conclusion is also validated by the results in Figure 5, Figure 6 and Figure 7. In particular, we can see that there is always an optimal deployment density ratio λf/λp for each choice of λp when various values of Tp and Tf are used, for example Tp = 5.5 dB, Tf = 1.0 dB and Tp = 6.5 dB, Tf = 0.5 dB in Figure 8 and Figure 10, respectively. The system energy efficiency is able to reach the maximum value when the optimal deployment density ratio is satisfied. We have tried different values of λf andλp, for example, when λf and λ are multiplied by 2, as a reviewer suggested, we obtained similar curves. In these cases, we can also achieve the peak values of system energy efficiency while with different value of the maximum energy efficiency. Therefore, the existence of the optimal deployment density ratio implies that the system energy efficiency can be optimized by adjusting the small cells deployment density in different network tier.
Recall in Equation (22), we proposed the energy efficiency maximization problem, namely, to maximize ηEE , which is highly related with the parameters λp and λf. The constraints, for instance, in Equations (23) and (24), rely on the parameters λp, λf, and the SIR thresholds Tp, Tf. In this study, we investigate the effects the picocell and femtocell deployment density ratio has on the energy efficiency under the various SIR thresholds. For example, from Figure 5, Figure 6 and Figure 7, we find out the growth of ηEE will increase with the increasing of Tf under a given Tp. Moreover, by solving the optimization problem in Equation (22), we can obtain an optimal deployment density ratio λf/λp for each choice of λp with respect to various values of Tp and Tf, these results are validated in Figure 8, Figure 9 and Figure 10. Moreover, we find out that system energy efficiency can be significantly improved and the optimal deployment density ratio increases as the picocell deployment density λp decreases. For instance in Figure 9, the maximum ηEE exceeds 180 bps/m−2/W when λf/λp is between 3 to 4 and λp is set to 0.01, while in the case of λp = 0.02, the maximum is 140 bps/m−2/W and λf/λp is less than 2. In a word, these simulations indicate that appropriately reducing the number of picocells to a low level e.g., λp is less than 0.02, and in the meantime applying modest increase of femtocells is capable of offering an effective approach to improve the energy efficiency of the heterogeneous small cell networks.
In addition, to evaluate the system performance of our proposed method, we conduct simulations and comparative analysis with other methods. The SCS in [14], small cell deployment scheme (SDS) in [19] and all-on power control scheme (PCS) in [21] are applied to multi-tier HetNets and compared with the proposed approach in terms of the overall throughput in small cell tier. In Figure 11, the simulation results are obtained under various small cells density ratios, namely, λf/λp = 1, λf/λp = 3, λf/λp = 6, and λf/λp = 9, respectively. It can be seen that the proposed method outperforms the other methods and achieves best throughput of small cells under different values of λf/λp. When comparing the results in the cases λf/λp = 1 and λf/λp = 3, it should be noted that throughput increases because the number of femtocells increases as the SBS density ratio grows. We also observe that the overall throughput in the case of λf/λp = 3 outperforms the other three cases, which is due to the optimal SBS density ratio in such a case, which is also supported by the results in Figure 5 and Figure 6. In the cases of larger SBS density ratios, for instance, λf/λp = 6 and λf/λp = 9, we can observe the decrease of the overall throughput. The reason behind this is that increasing λf/λp means more femtocells are deployed in the multi-tier HetNets, and this consequently generates more severe intra-femto-tier interference. In other words, the interference-limited effect becomes significant, which degrades the coverage performance as well as the throughput (also see Figure 4). Similar results can be found from Figure 12 which depicts the throughput of small cells under four SBS density ratio cases, i.e., λf/λp = 2, λf/λp = 5, λf/λp = 8, and λf/λp = 10, respectively. It can be also seen that our proposed method is superior to the compared methods, and the throughput of small cells decreases gradually with the increasing λf/λp. The best throughput is obtained when λf/λp = 2, which is the optimal SBS density ratio in such a case and verified from the result in Figure 10.

7. Conclusions

In this paper, we propose a novel framework for multi-tier heterogeneous networks in order to characterize the coverage performance and energy efficiency and investigate the inherent relationship between them and the small cells deployment density. Based on PPP and statistical geometry theory, we derive the analytical expressions of the success probabilities for pico- and femto-tier after studying the cumulative interference from each tier. We design a disjoint sub-channel allocation scheme and investigate how to evaluate the throughput performance of various tiers. Then the energy efficiency optimization problem is formulated in terms of the throughput performance and the resource allocation fairness. To solve this optimization problem, we devise a linear programming based method to generate the available area for obtaining the feasible solutions. System-level simulation results show that SBS deployment density has a significant effect on the coverage performance and energy efficiency in different tiers. An optimal pico-femto density ratio is identified numerically that can be used to maximize the energy efficiency of the multi-tier HetNets and at the same time guarantee the coverage performance and system throughput.
We conclude that, to deliberately deploy the number of picocells i.e., λp < 0.02, and in the meantime applying modest increase of femtocells, e.g., the density ratio λf/λp is 3 to 4, is proved to be an effective way to enhance the energy efficiency of the heterogeneous small cell networks. Therefore, this study should be quite helpful for designing the future dense small cells networks and provide guidance on improving the performance of HetNets by adjusting the small cells’ deployment density. Our future work involves the design of a multi-tier HetNets suitable for mobile scenarios, such as cross-tier handover, access admission, as well as mobility management.

Acknowledgments

This work was partly supported by National Natural Science Foundations of China (No. 61272061 and No. 61301148), Hunan Provincial Natural Science Foundation of China (No. 2016JJ3041), and Open Foundation of State Key Lab of Integrated Services Networks of Xidian University (ISN17-14).

Author Contributions

Zhu Xiao conceived and designed the main idea of the paper, wrote the manuscript. Hongjing Liu and Vincent Havyarimana designed system model and the analytical framework. Zhu Xiao and Tong Li carried out the simulations and numerical investigations. Dong Wang supervised the entire project and helped with the analysis of experimental results.

Conflicts of Interest

The authors declare no conflict of interest.

Appendix A

We present the deduction for I r ( S ) S = T P r α / P P . In Equation (11), I r ( S ) S = T P r α / P P is written as:
L I r ( S ) = E I r ( e S I r )
According to Equation (4), I r ( S ) S = T P r α / P P can be expressed as:
L I r ( S ) = E I r { exp [ S ( i Φ P S g i S R i α + j Θ P M g j M R j α ) ] }
Then we have:
L I r ( S ) = E Φ , g i [ exp ( S i Φ P S g i S R i α ) ] E Θ , p j [ exp ( S j Θ P M g j M R j α ) ]
Based on the probability generating functional (PGFL) [39] of the PPP, we can obtain:
L I r ( S ) = exp [ 2 π λ P r ( 1 E g ( e S g S v α ) v d v ) ] · exp [ 2 π λ M r ( 1 E p ( e S g M v α ) v d v ) ]
Since gS~exp(1) and gM~exp(1), then
L I r ( S ) = exp { [ 2 π λ M 0 ( r ( 1 e S g v α ) v d v ) f ( g ) d g ] [ 2 π λ S 0 ( r ( 1 e S q v α ) v d v ) f ( q ) d q ] }
As a result, we have:
L I r ( S ) | S = T P r α / P P = exp ( 2 π ( λ P + λ M ) r > 0 S v α μ + S v α v d v )

References

  1. Global Mobile Data Traffic Forecast Update 2011–2016; White Paper; Cisco: San Jose, CA, USA, 2012; pp. 1–29.
  2. International Telecommunication Union. IMT Traffic Estimates for the Years 2020 to 2030; Report ITU-R M.2370-0 (07/2015); ITU Publications: Geneva, Switzerland, 2015. [Google Scholar]
  3. Li, Y.; Qian, M.; Jin, D.; Hui, P.; Wang, Z.; Chen, S. Multiple mobile data offloading through disruption tolerant networks. IEEE Trans. Mob. Commun. 2013, 13, 1579–1596. [Google Scholar]
  4. Wang, L.; Wang, Y.; Ding, Z.; Wang, X. Cell Selection Game for Densely-Deployed Sensor and Mobile Devices in 5G Networks Integrating Heterogeneous Cells and the Internet of Things. Sensors 2015, 15, 24230–24256. [Google Scholar] [CrossRef] [PubMed]
  5. Cheng, W.; Zhang, X.; Zhang, H. Heterogeneous statistical QoS provisioning over 5G wireless full-duplex networks. In Proceedings of the IEEE Conference on Computer Communications (INFOCOM), Hong Kong, China, 26 April–1 May 2015; pp. 55–63.
  6. Liu, F.; Bala, E.; Erkip, E.; Beluri, M.C.; Yang, R. Small-cell traffic balancing over licensed and unlicensed bands. IEEE Trans. Veh. Technol. 2015, 64, 5850–5865. [Google Scholar] [CrossRef]
  7. Zhang, X.; Zhang, J.; Wang, W.; Zhang, Y.; Chih-Lin, I.; Pan, Z.; Li, G.; Chen, Y. Macro-assisted data-only carrier for 5G green cellular systems. IEEE Commun. Mag. 2015, 53, 223–231. [Google Scholar] [CrossRef]
  8. Peng, M.; Wang, C.; Li, J.; Xiang, H.; Lau, V. Advances in underlay heterogeneous networks: Interference control, resource allocation, and self-organization. IEEE Commun. Surv. Tutor. 2015, 17, 700–729. [Google Scholar] [CrossRef]
  9. Zhang, X.; Cheng, W.; Zhang, H. Heterogeneous statistical QoS provisioning over 5G mobile wireless networks. IEEE Netw. Mag. 2014, 28, 46–53. [Google Scholar] [CrossRef]
  10. Xiao, Z.; Li, T.; Ding, W.; Wang, D.; Zhang, J. Dynamic PCI allocation on avoiding handover confusion via cell status prediction in LTE heterogeneous small cell networks. Wirel. Commun. Mob. Comput. 2016, 14, 1972–1986. [Google Scholar] [CrossRef]
  11. Cai, S.; Che, Y.; Duan, L.; Wang, J.; Zhou, S.; Zhang, R. Green 5G heterogeneous networks through dynamic small-cell operation. IEEE J. Sel. Areas Commun. 2016, 34, 1103–1115. [Google Scholar] [CrossRef]
  12. Liu, Y.; Zhang, Y.; Yu, R.; Xie, S. Integrated energy and spectrum harvesting for 5G wireless communications. IEEE Netw. Mag. 2015, 29, 75–81. [Google Scholar] [CrossRef]
  13. Klessig, H.; Öhmann, D.; Reppas, A.I.; Hatzikirou, H.; Abedi, M.; Simsek, M.; Fettweis, G.P. From immune cells to self-organizing ultra-dense small cell networks. IEEE J. Sel. Areas Commun. 2016, 34, 800–811. [Google Scholar] [CrossRef]
  14. Kim, J.; Jeong, C.; Yu, H.; Park, J. Areal capacity limit on the growth of small cell density in heterogeneous networks. In Proceedings of the IEEE Global Communications Conference (GLOBECOM), Austin, TX, USA, 8–12 December 2014; pp. 4263–4268.
  15. Amiri, K.; Johnson, D.B. Protocol evaluation in multihop wireless networks with controllable node sparsity or density (extended abstract). In Proceedings of the IEEE International Conference on Mobile Ad Hoc and Sensor Systems (MASS), Dallas, TX, USA, 19–22 October 2015; pp. 447–448.
  16. Feng, J.; Feng, Z.; Wei, Z.; Li, W.; Roy, S. Optimal base station density in ultra-densification heterogeneous network. In Proceedings of the IEEE Wireless Communications and Networking Conference (WCNC), New Orleans City, LA, USA, 9–12 March 2015; pp. 1452–1457.
  17. Wu, F.; Zhu, J.; Xi, Z.; Gao, K. Capacity of heterogeneous mobile wireless networks with D-delay transmission strategy. Sensors 2016, 16, 425. [Google Scholar] [CrossRef] [PubMed]
  18. Cao, D.; Zhou, S.; Niu, Z. Optimal base station density for energy-efficient heterogeneous cellular networks. In Proceedings of the 2012 IEEE International Conference on Communications (ICC), Ottawa, ON, Canada, 10–15 June 2012; pp. 4379–4383.
  19. Dong, A.; Luo, X.; Du, Q. A small cell deployment strategy towards amorphous coverage in the cellular network. In Proceedings of the 2015 International Wireless Communications and Mobile Computing Conference (IWCMC), Dubrovnik, Croatia, 24–28 August 2015; pp. 745–750.
  20. Samarakoon, S.; Bennis, M.; Saad, W.; Debbah, M.; Latva-aho, M. Ultra dense small cell networks: Turning density into energy efficiency. IEEE J. Sel. Areas Commun. 2016, 34, 1267–1280. [Google Scholar] [CrossRef]
  21. Peng, C.T.; Wang, L.C.; Liu, C.H. Optimal base station deployment for small cell networks with energy-efficient power control. In Proceedings of the 2015 IEEE International Conference on Communications (ICC), London, UK, 8–12 June 2015; pp. 1863–1868.
  22. Soh, Y.S.; Quek, T.Q.; Kountouris, M.; Shin, H. Energy efficient heterogeneous cellular networks. IEEE J. Sel. Areas Commun. 2013, 842–847. [Google Scholar] [CrossRef]
  23. Xiao, Z.; Li, H.; Li, Z.; Wang, D. Load-awareness energy saving strategy via success probability constraint for heterogeneous small cell networks. In Proceedings of the IEEE Annual International Symposium on Personal, Indoor, and Mobile Radio Communications (PIMRC), Hong Kong, China, 30 August–2 September 2015; pp. 743–747.
  24. Baccelli, F.; Blaszczyszyn, B. Stochastic Geometry and Wireless Networks, 1st ed.; Now Publishers: Boston, MA, USA, 2010; pp. 1–312. [Google Scholar]
  25. Ghosh, A.; Mangalvedhe, N.; Ratasuk, R.; Mondal, B.; Cudak, M.; Visotsky, E.; Thomas, T.A.; Andrews, J.G.; Ping, X.; Han, S.J.; et al. Heterogeneous cellular networks: From theory to practice. IEEE Commun. Mag. 2012, 50, 54–64. [Google Scholar] [CrossRef]
  26. Andrews, J.G.; Baccelli, F.; Ganti, R.K. A tractable approach to coverage and rate in cellular networks. IEEE Trans. Commun. 2011, 59, 3122–3134. [Google Scholar] [CrossRef]
  27. Cheng, W.; Zhang, X.; Zhang, H. Optimal power allocation with statistical QoS provisioning for D2D and cellular communications over underlaying wireless networks. IEEE J. Sel. Areas Commun. 2016, 34, 151–162. [Google Scholar] [CrossRef]
  28. Rappaport, T.S. Wireless Communications: Principles and Practice; Prentice Hall PTR: Upper Saddle River, NJ, USA, 2001; Volume 15, pp. 70–88. [Google Scholar]
  29. Cheng, W.; Zhang, X.; Zhang, H. Full-duplex spectrum-sensing and mac-protocol for multichannel non-time-slotted cognitive radio networks. IEEE J. Sel. Areas Commun. 2015, 33, 820–831. [Google Scholar] [CrossRef]
  30. Tan, C.W. Optimal power control in Rayleigh-fading heterogeneous wireless networks. IEEE/ACM Trans. Netw. 2015, 24, 940–953. [Google Scholar] [CrossRef]
  31. Yang, X.; Petropulu, A.P. Co-channel interference modelling and analysis in a Poisson field of interferers in wireless communications. IEEE Trans. Signal Process. 2003, 51, 64–76. [Google Scholar] [CrossRef]
  32. Jo, H.S.; Sang, Y.J.; Xia, P.; Andrews, J.G. Heterogeneous cellular networks with flexible cell association: A comprehensive downlink SINR analysis. IEEE Trans. Wirel. Commun. 2012, 11, 3484–3495. [Google Scholar] [CrossRef]
  33. Kuang, Q.; Utschick, W.; Dotzler, A. Optimal joint user association and multi-pattern resource allocation in heterogeneous networks. IEEE Trans. Signal Process. 2016, 64, 3388–3401. [Google Scholar] [CrossRef]
  34. Zhang, H.; Jiang, C.; Beaulieu, N.C.; Chu, X.; Wang, X.; Quek, T.Q. Resource allocation for cognitive small cell networks: A cooperative bargaining game theoretic approach. IEEE Trans. Wirel. Commun. 2015, 14, 3481–3493. [Google Scholar] [CrossRef]
  35. Jia, Y.; Zhao, M.; Zhou, W. Joint User Association and eICIC for Max–Min Fairness in HetNets. IEEE Commun. Lett. 2016, 20, 546–549. [Google Scholar] [CrossRef]
  36. WINNER II D1.1.2 V1.2 WINNER II Channel Models. Available online: http://www.cept.org/files/1050/documents/winner2%20-%20final%20report.pdf (accessed on 10 July 2016).
  37. Small Cell Enhancements for E-UTRA and E-UTRAN Physical Layer Aspects (Release 12). Available online: https://portal.3gpp.org/desktopmodules/Specifications/SpecificationDetails.aspx?specificationId=2573 (accessed on 15 June 2016).
  38. Goldsmith, A. Wireless Communications; Cambridge University Press: Cambridge, UK, 2013. [Google Scholar]
  39. Chiu, S.N.; Stoyan, D.; Kendall, W.S.; Mecke, J. Stochastic Geometry and Its Applications, 2nd ed.; John Wiley and Sons: Exeter, UK, 1996; pp. 1–436. [Google Scholar]
Figure 1. Base stations in multi-tier HetNets drawn from a PPP distribution include macrocells and different types of small cells, namely in this study, picocells and femtocells.
Sensors 16 01854 g001
Figure 2. Available area for Equations (22)–(25).
Sensors 16 01854 g002
Figure 3. Effect of picocell density on the pico-tier coverage performance.
Sensors 16 01854 g003
Figure 4. Effect of femtocell density on the femto-tier coverage performance.
Sensors 16 01854 g004
Figure 5. Energy efficiency vs. SBS density ratio when Tp = 3.5 dB.
Sensors 16 01854 g005
Figure 6. Energy efficiency vs. SBS density ratio when Tp = 5.5 dB.
Sensors 16 01854 g006
Figure 7. Energy efficiency vs. SBS density ratio when Tp = 6.5 dB.
Sensors 16 01854 g007
Figure 8. Energy efficiency under different picocell deployment density when Tp = 5.5 dB and Tf = 1.0 dB.
Sensors 16 01854 g008
Figure 9. Energy efficiency under different picocell deployment density when Tp = 6.5 dB, Tf = 1.0 dB.
Sensors 16 01854 g009
Figure 10. Energy efficiency under different picocell deployment density when Tp = 6.5 dB and Tf = 0.5 dB.
Sensors 16 01854 g010
Figure 11. Overall throughput of small cells under different SBS density ratios when Tp = 5.5 dB, Tf = 1.0 dB.
Sensors 16 01854 g011
Figure 12. Overall throughput of small cells under different SBS density ratios when Tp = 6.5 dB and Tf = 0.5 dB.
Sensors 16 01854 g012
Table 1. Simulation parameters.
ParameterValue
BSs distributionPPP [24,26]
PM46 dBm
Pp38 dBm
Pf24.8 dBm
α4
System carrier2 GHz
System bandwidth40 MHz
Path loss for macrocell cellular link26 log10(d[m]) + 39 + 20 log10(fc[GHz]/5.0)
Path loss for Picocell cellular link22.7 log10(d[m]) + 41 + 20 log10(fc[GHz]/5.0)
Path loss for Femtocell cellular link18.7 log10(d[m]) + 46.8 + 20 log10(fc[GHz]/5.0)

