
Hierarchical Activity Recognition Using Smart Watches and RGB-Depth Cameras

Abstract
:1. Introduction
2. Materials and Methods
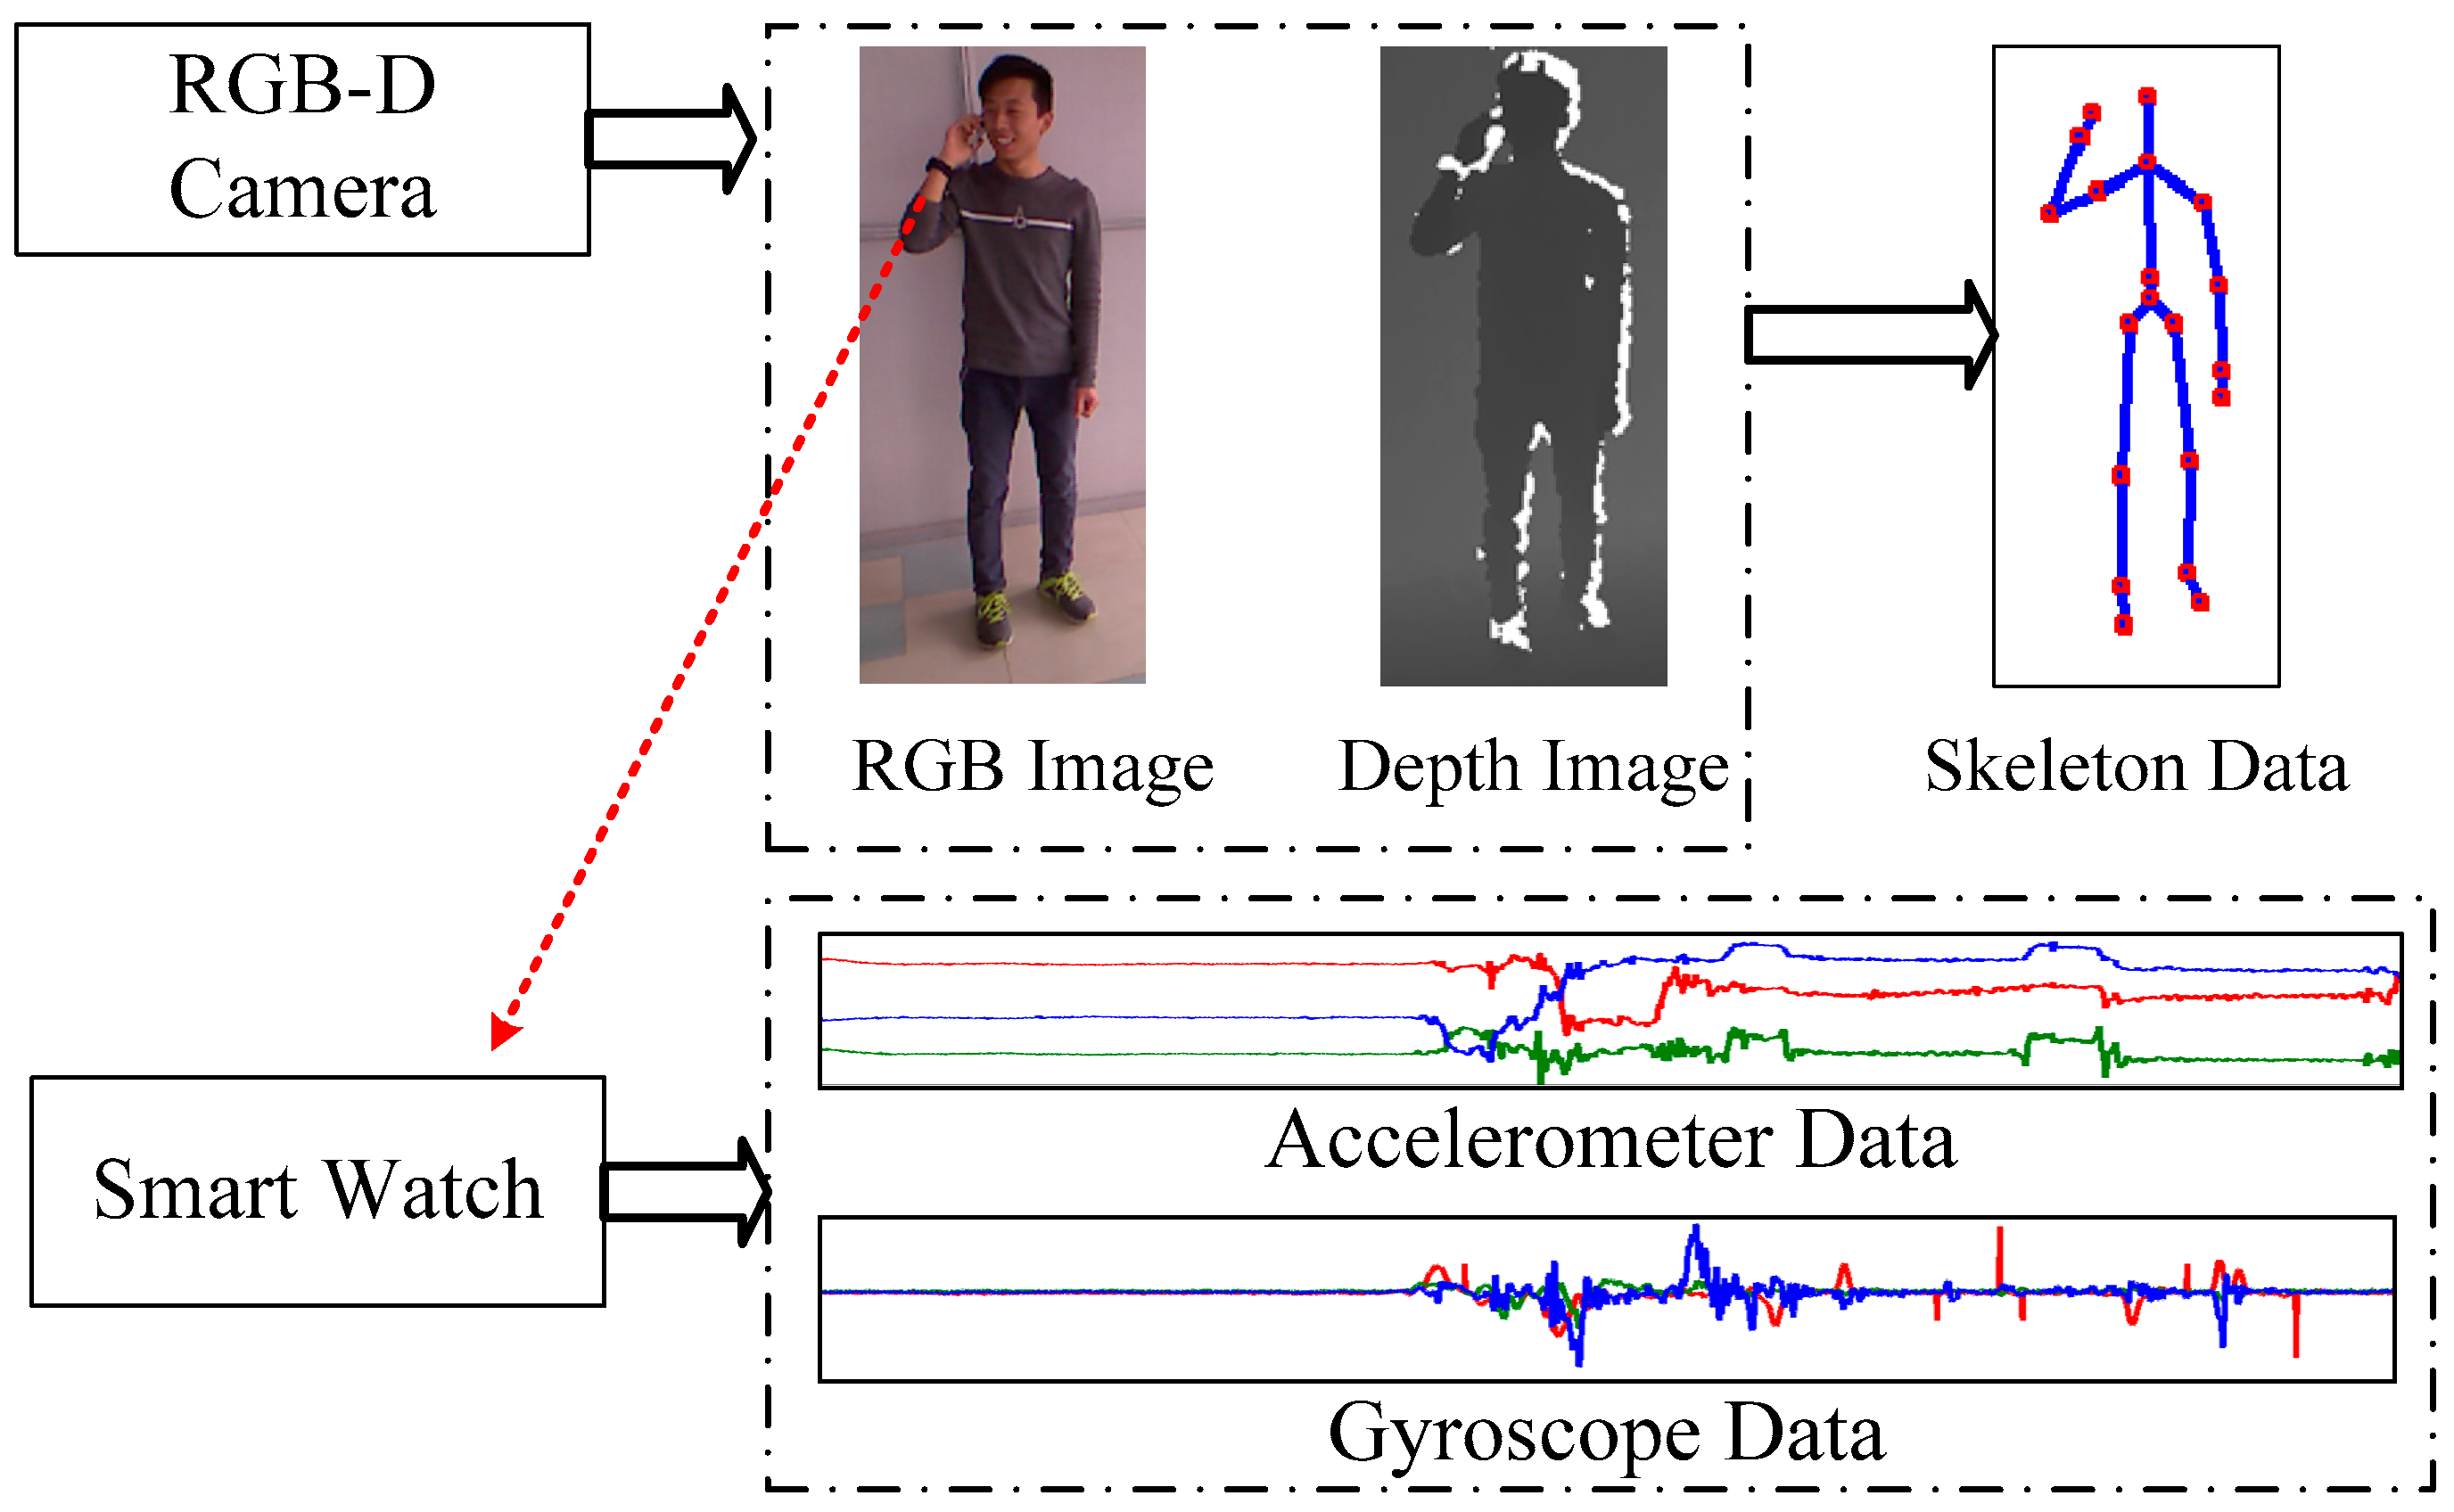
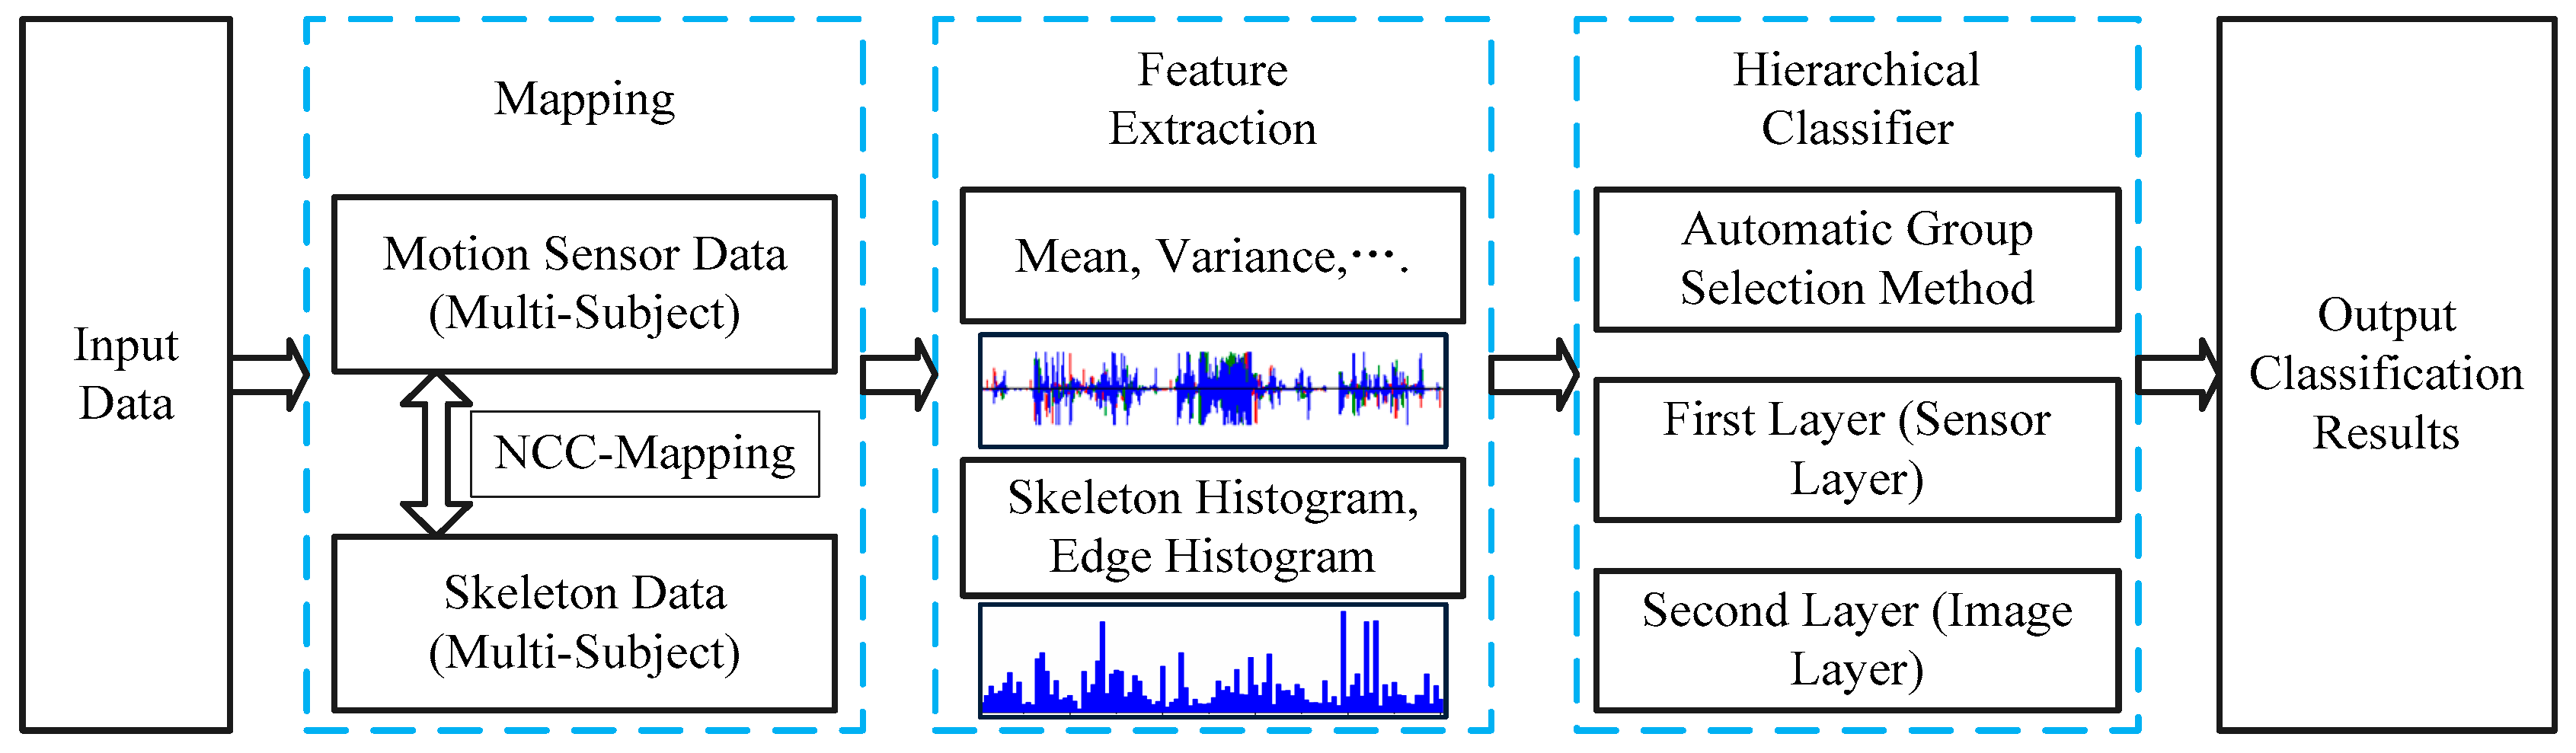
2.1. Overview
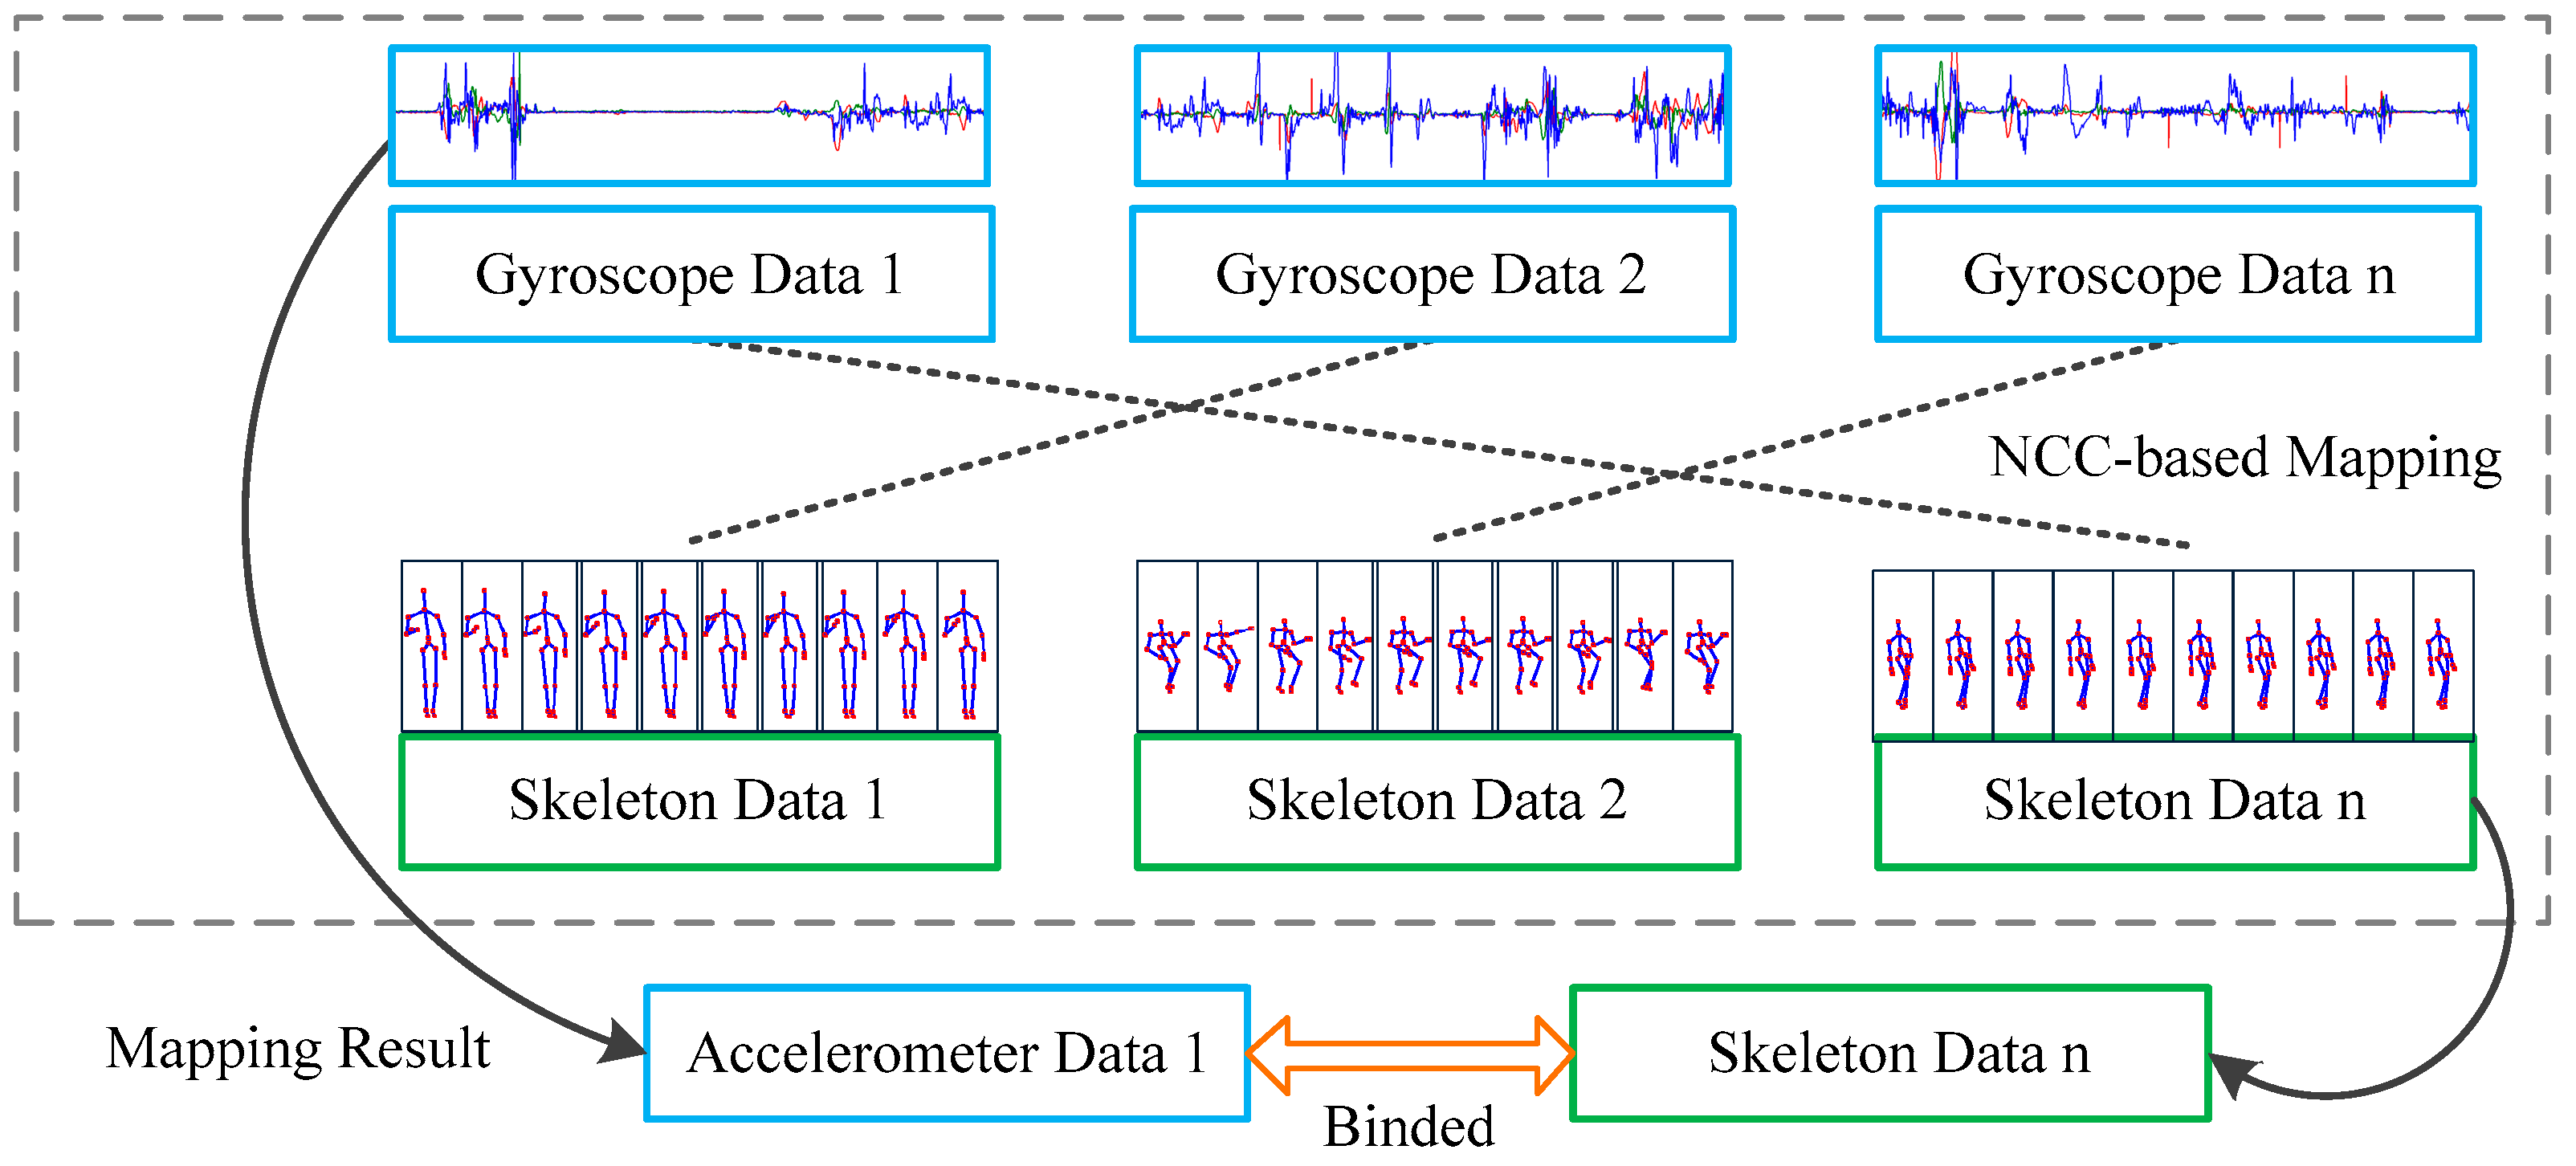
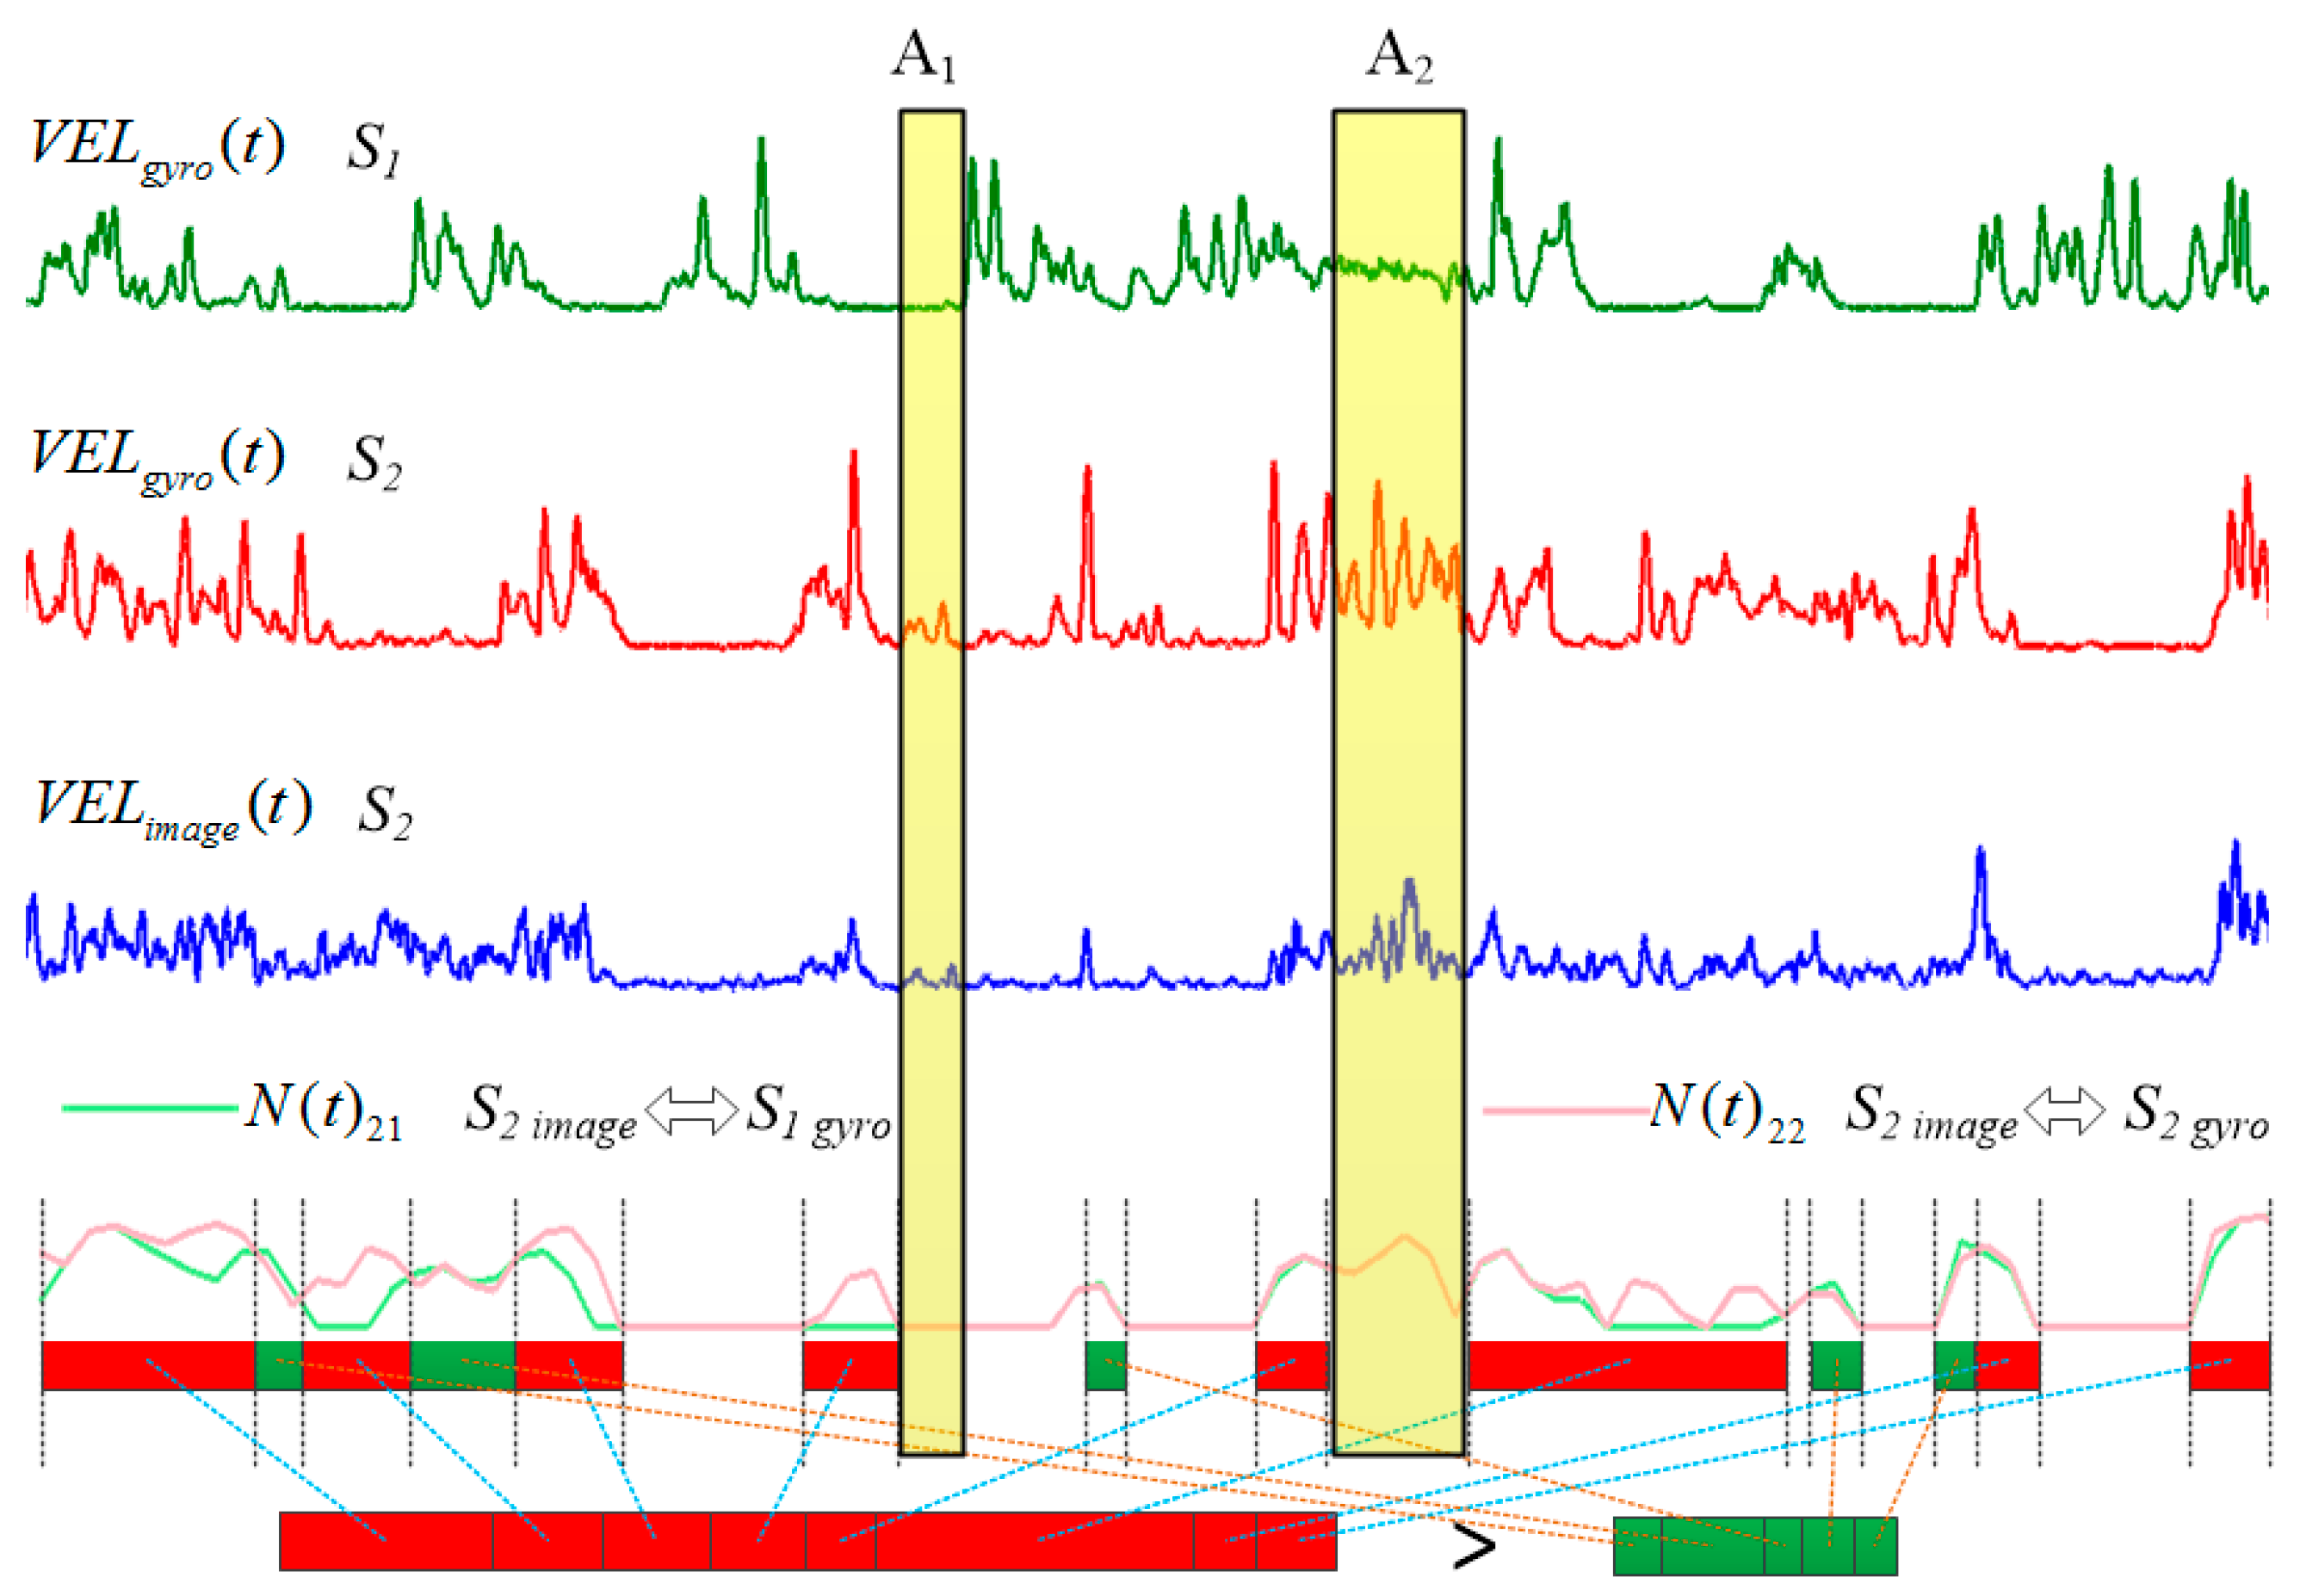
2.2. Normalized Cross Correlation Mapping Method
2.3. Feature Extraction
2.3.1. Feature of Accelerometer and Gyroscope
2.3.2. Feature of RGB-D Data
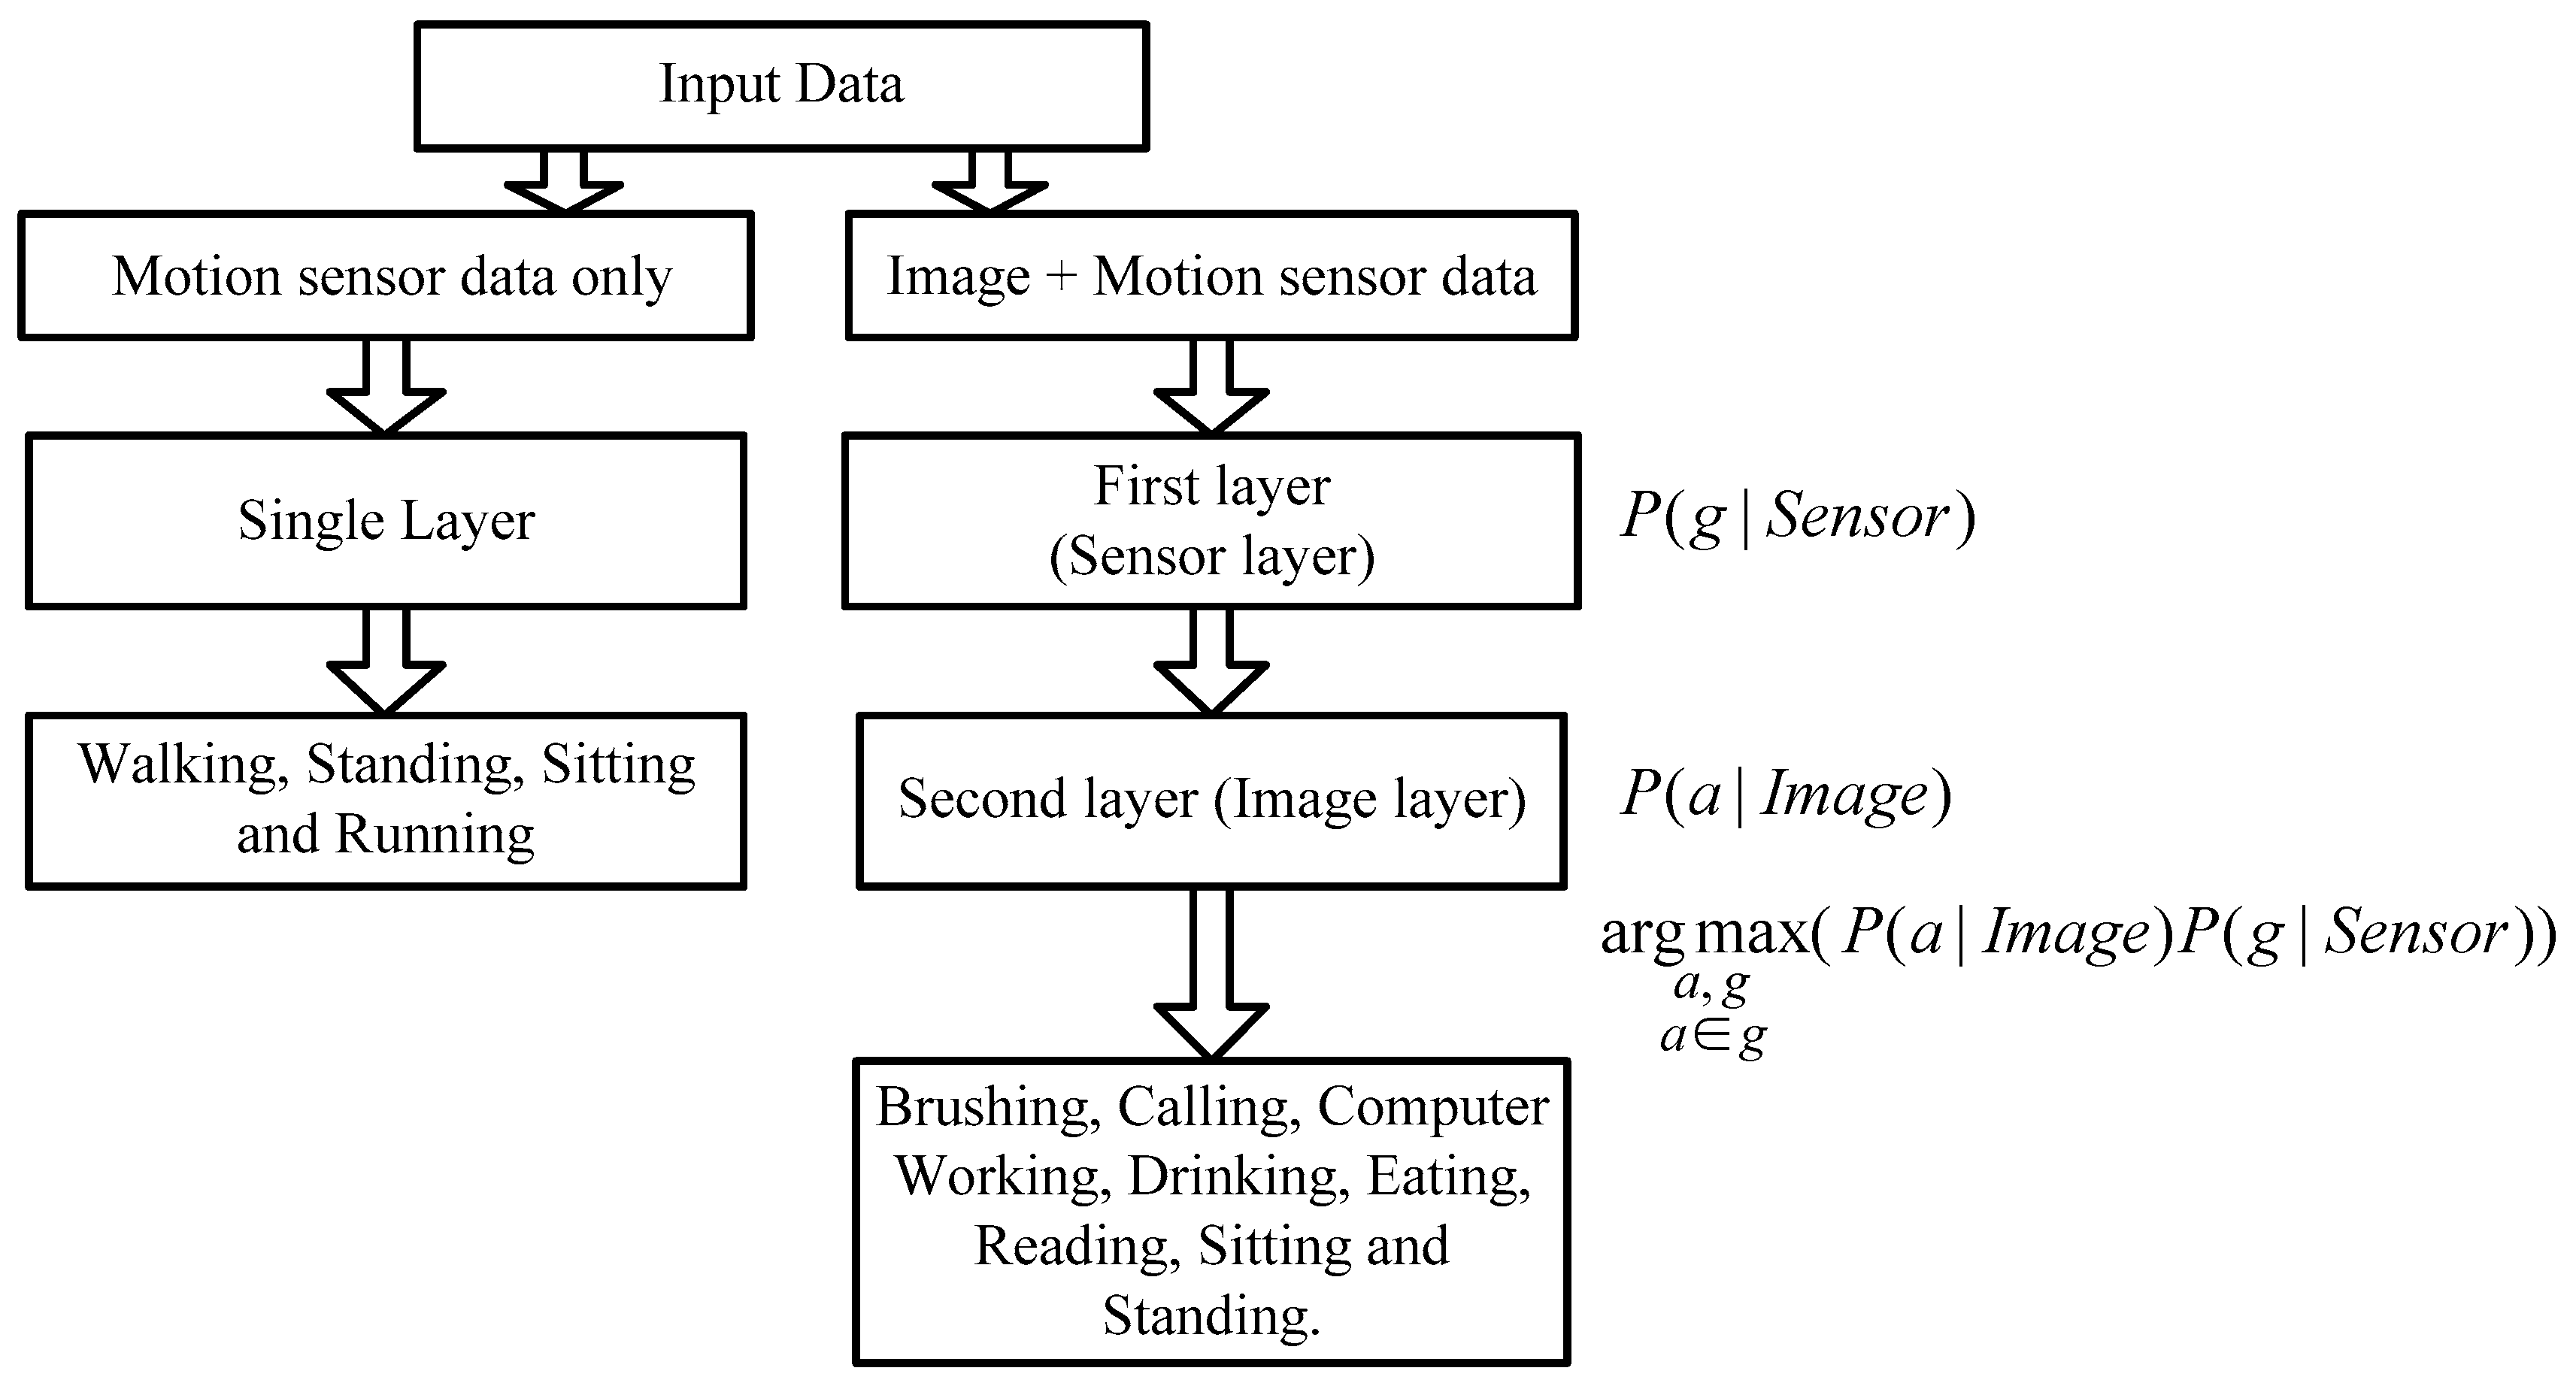
2.4. Hierarchical Recognition Scheme
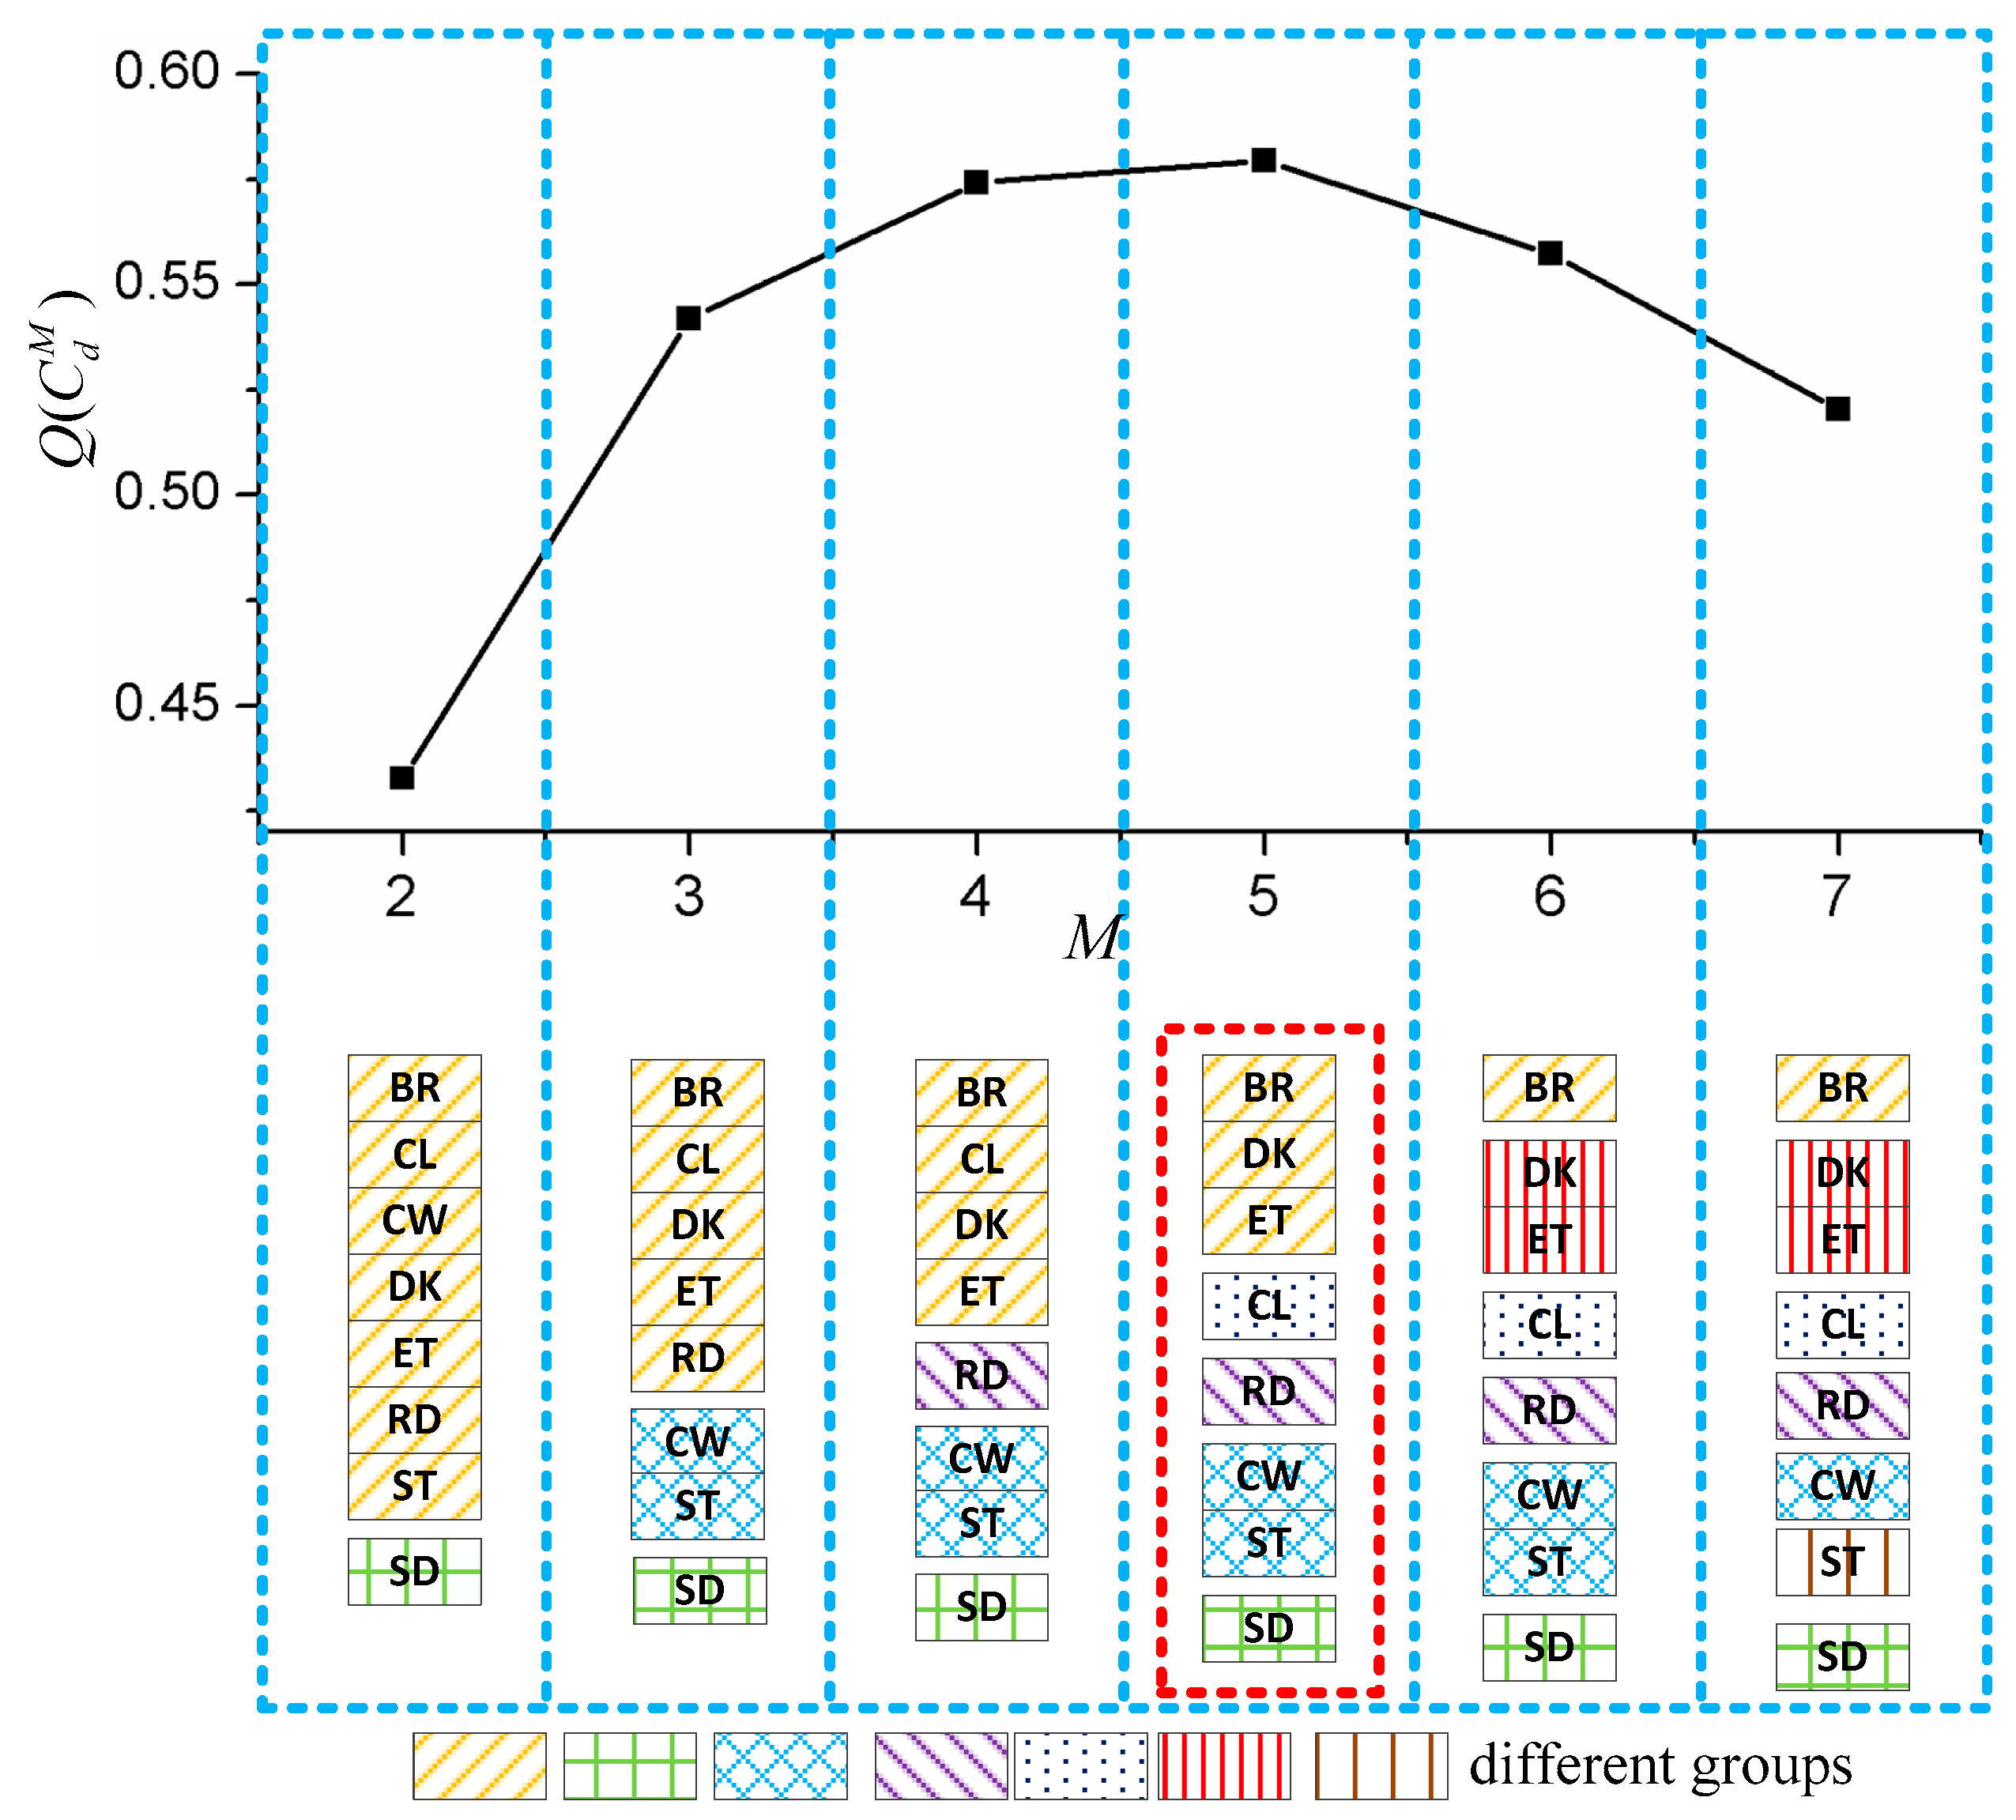
2.4.1. Automatic Group Selection Method
| Algorithm 1. Algorithm of Group Selection | |
| Step 1 | N: Number of types of activities M = 2 |
| Step 2 | The recognition accuracy rates of all group combinations from to is evaluated. For each , it contains M classes and a SVM classifier is trained for performance evaluation. |
| Step 3 | |
2.4.2. The Recognition Hierarchical Structure
3. Results
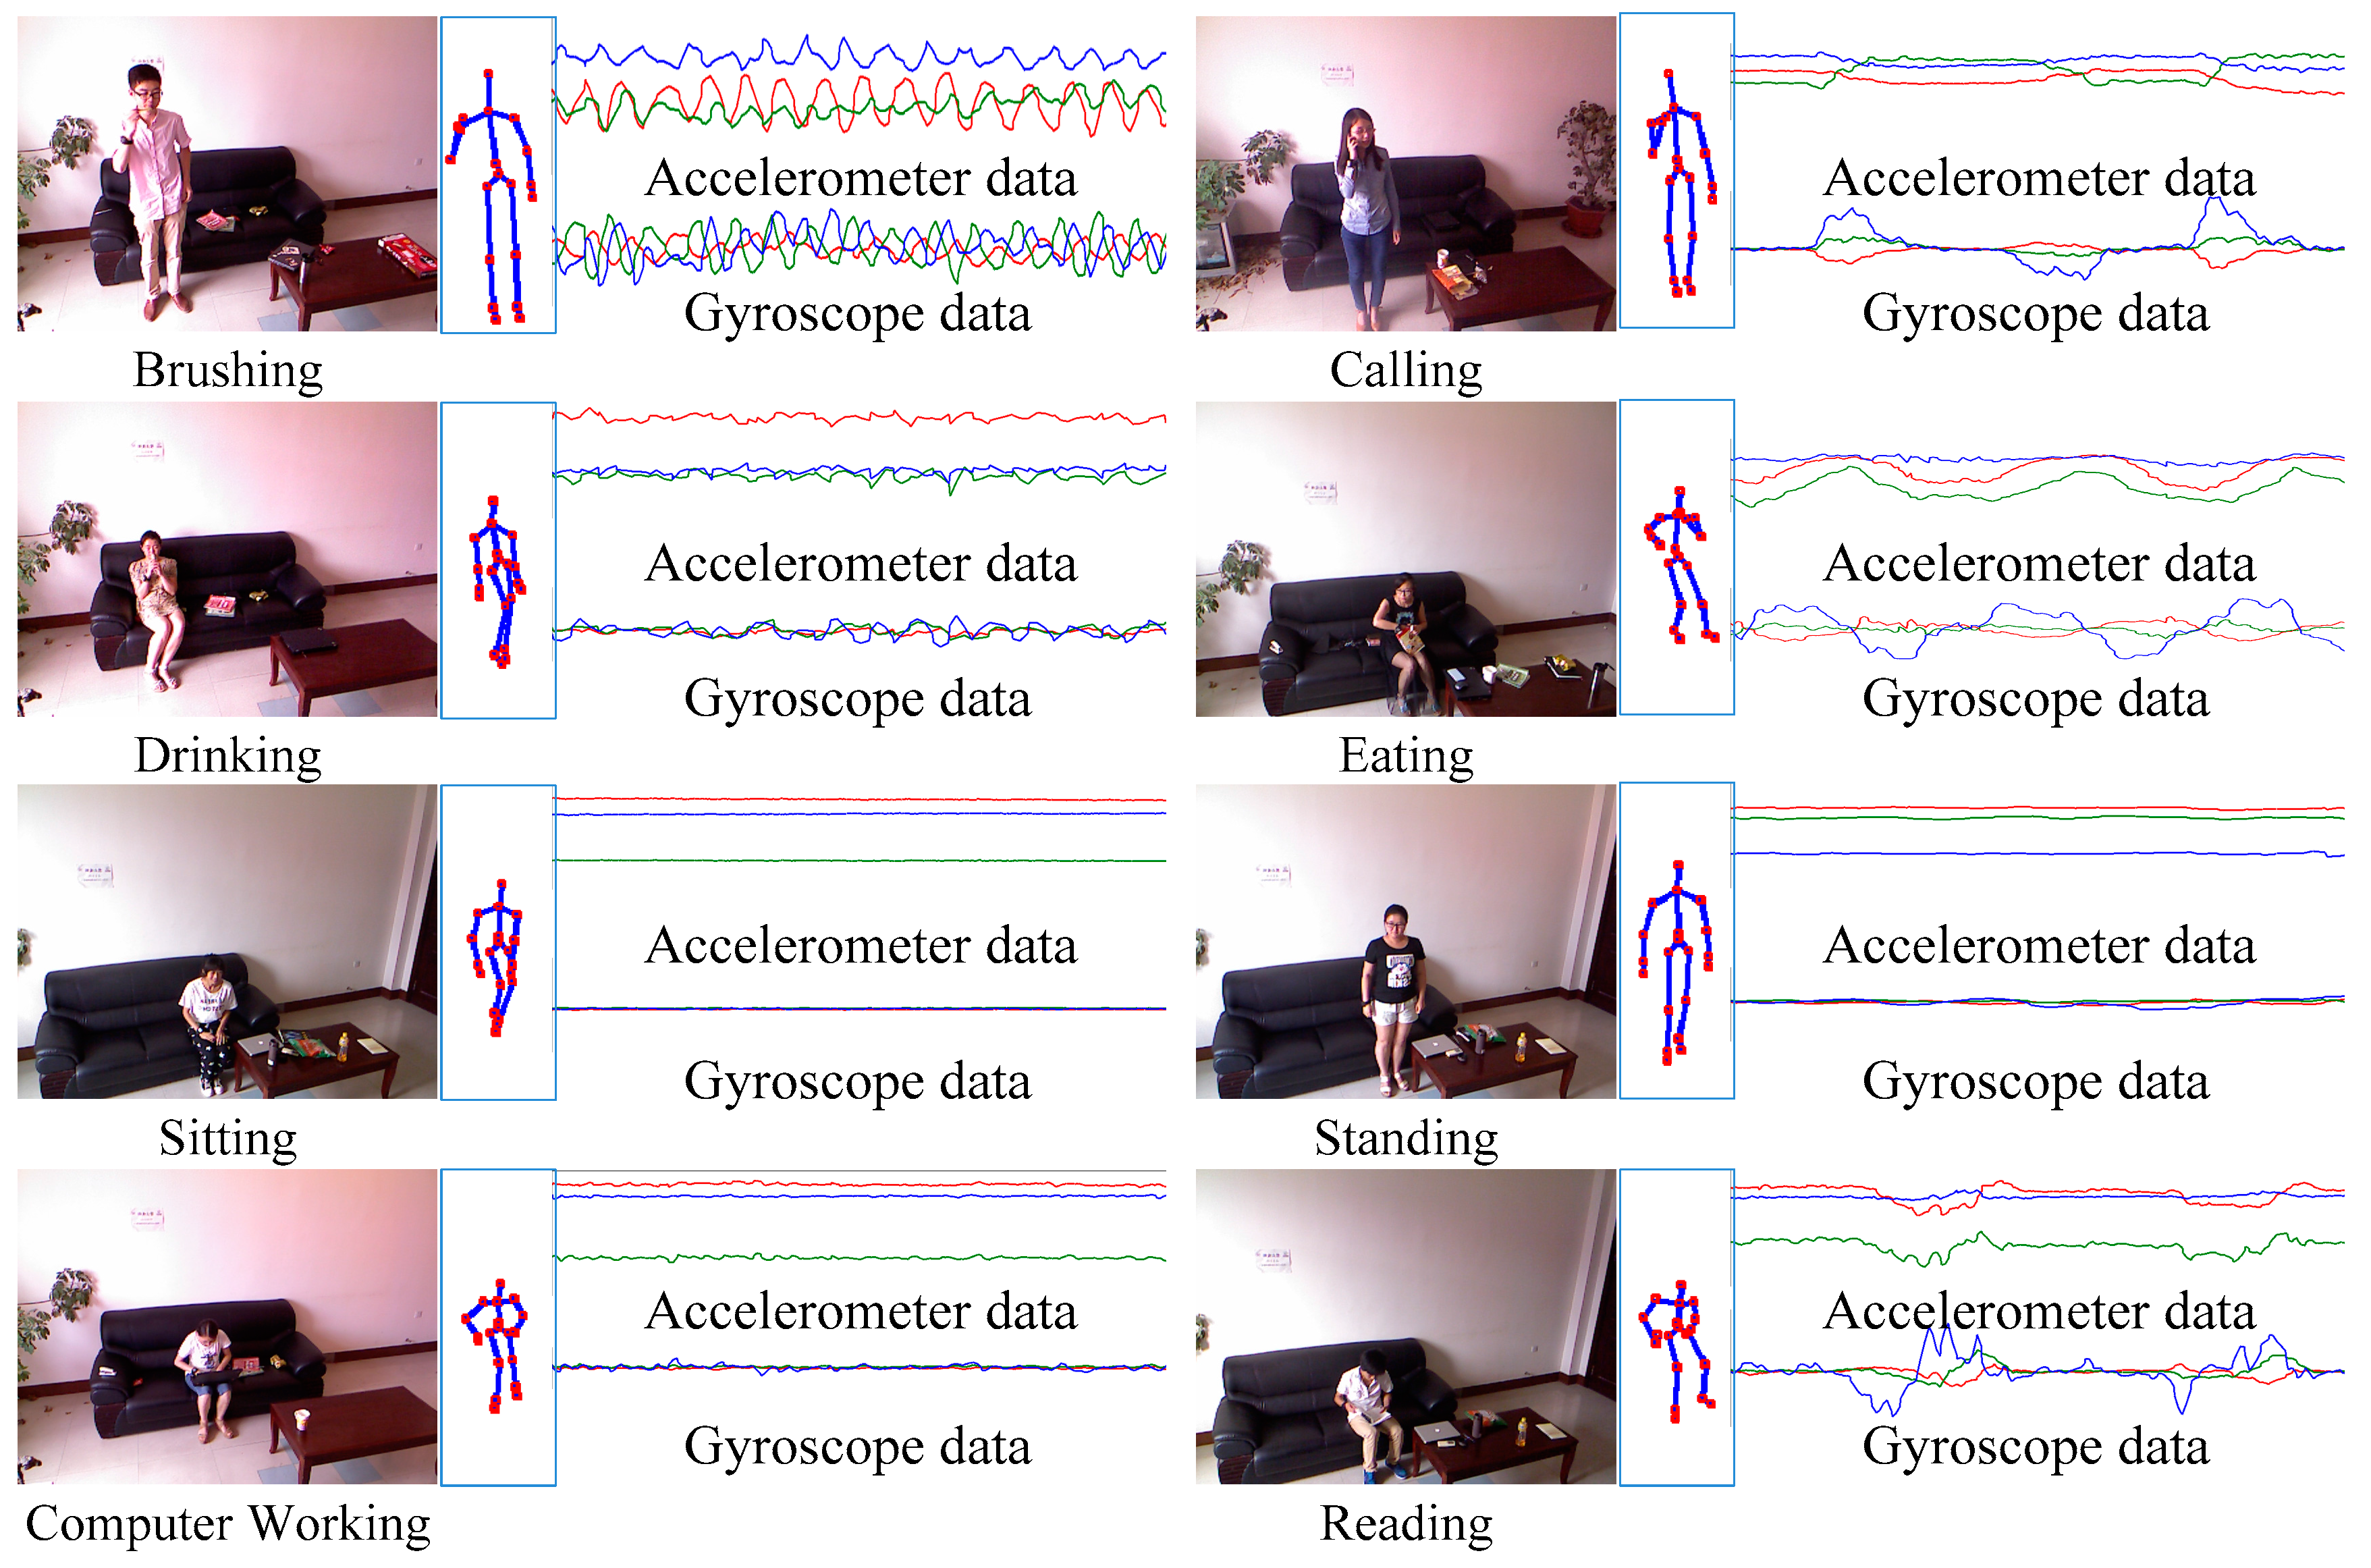
3.1. Dataset
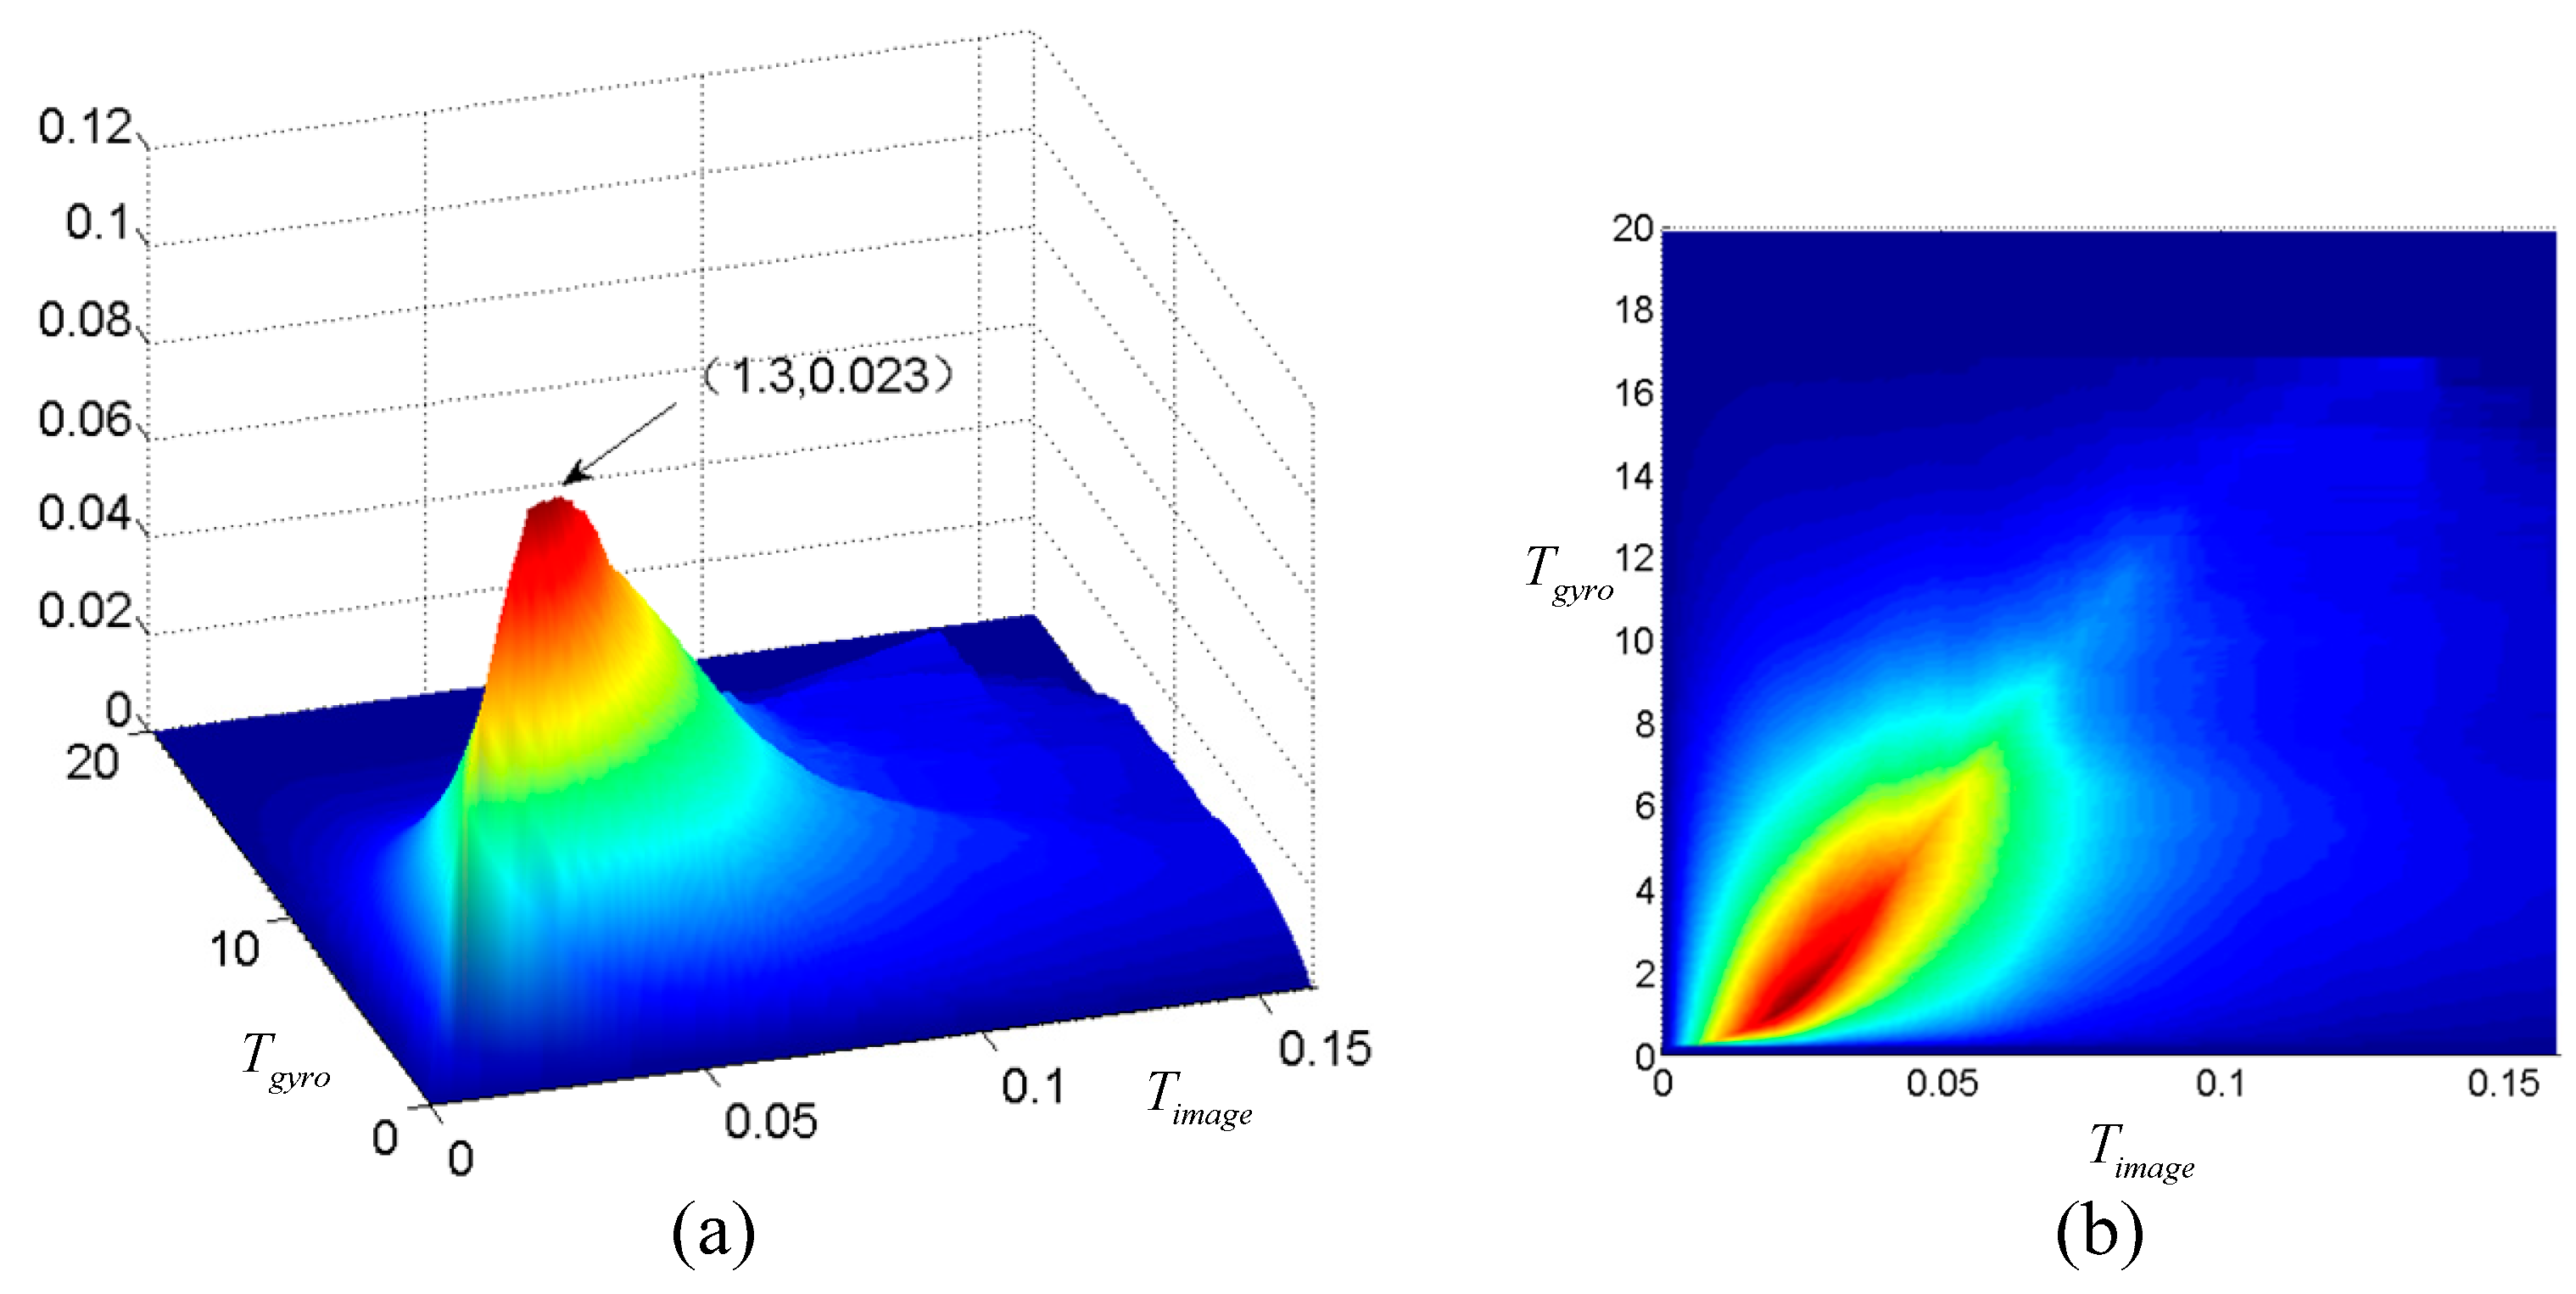
3.2. Thresholds Determination
3.3. Evaluation on Matching Result
3.4. Results of Group Selection Method
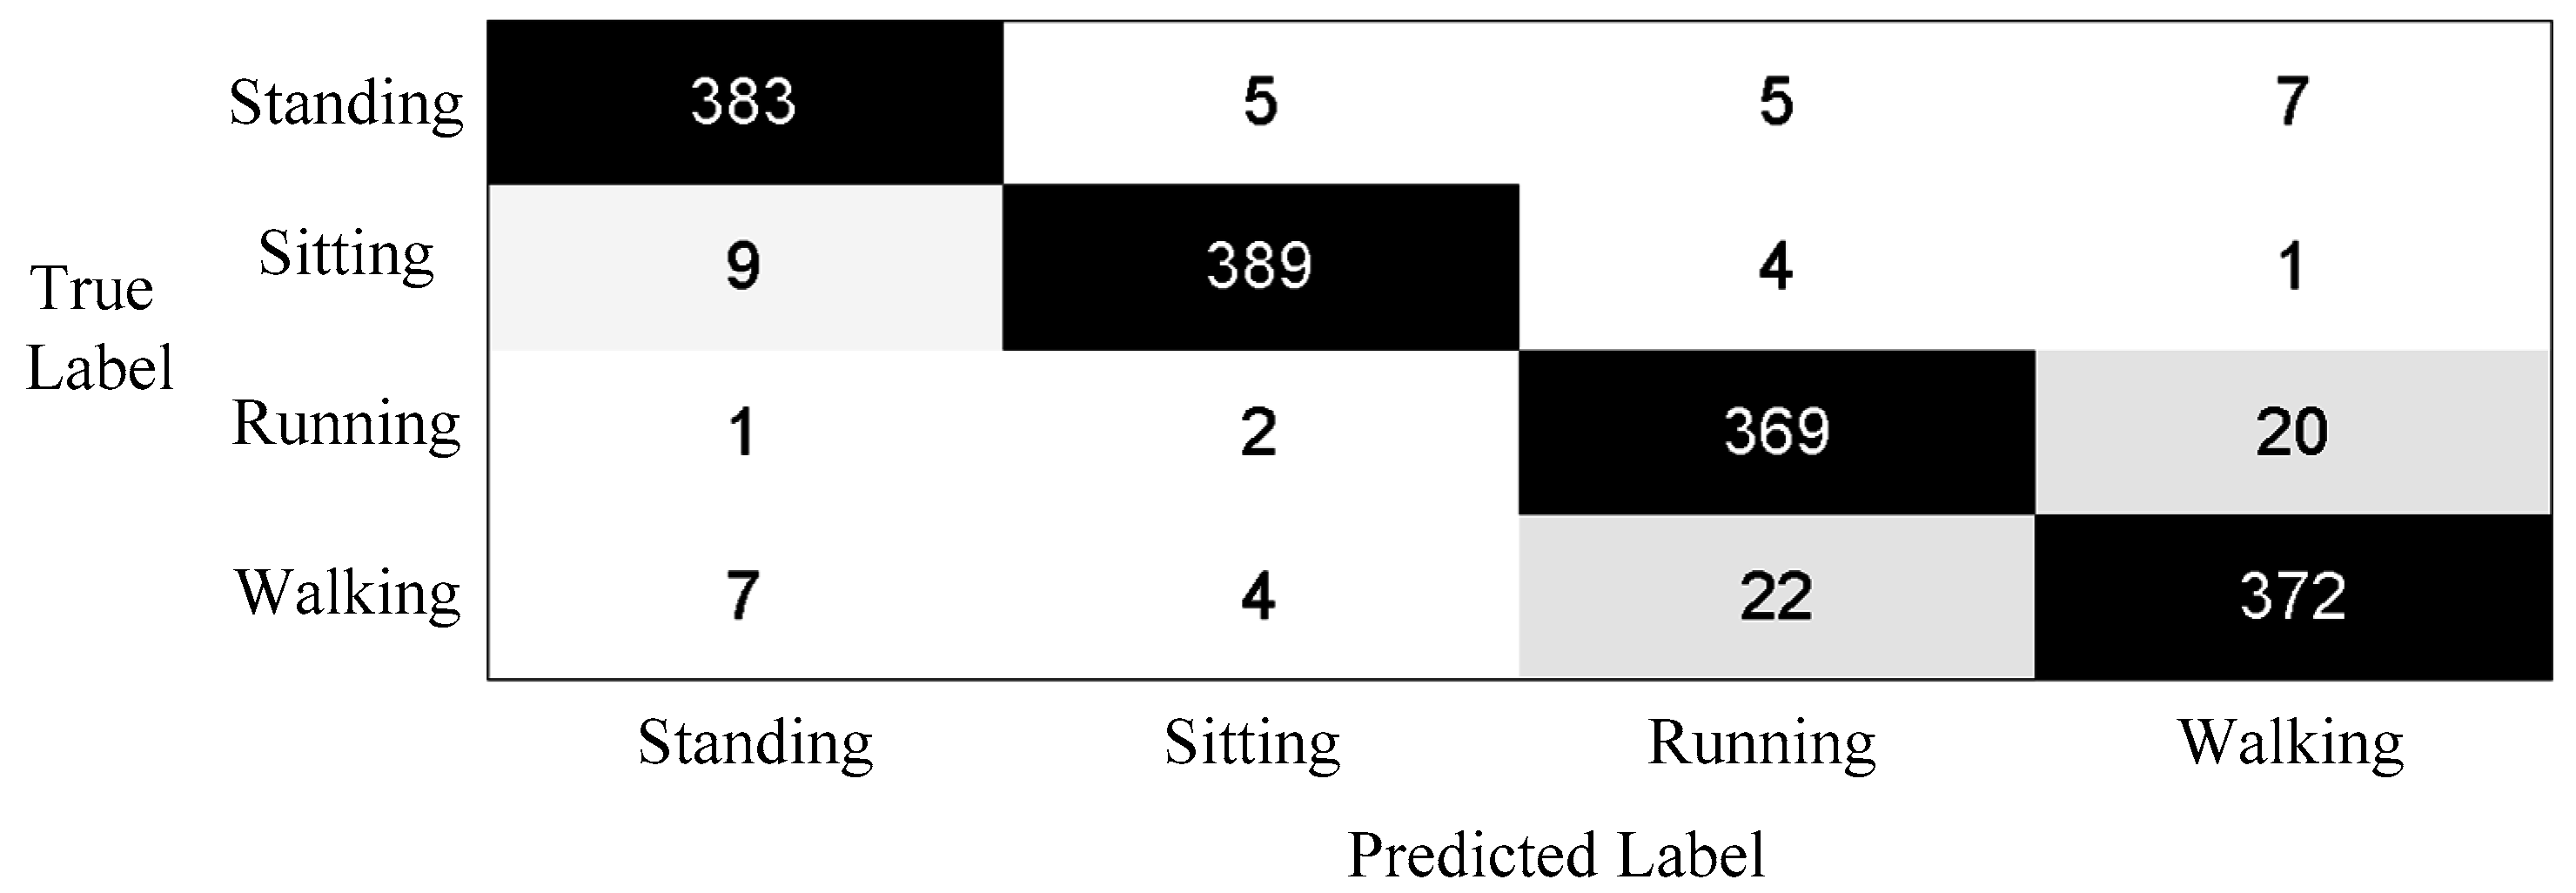
3.5. Performance on the Proposed Method
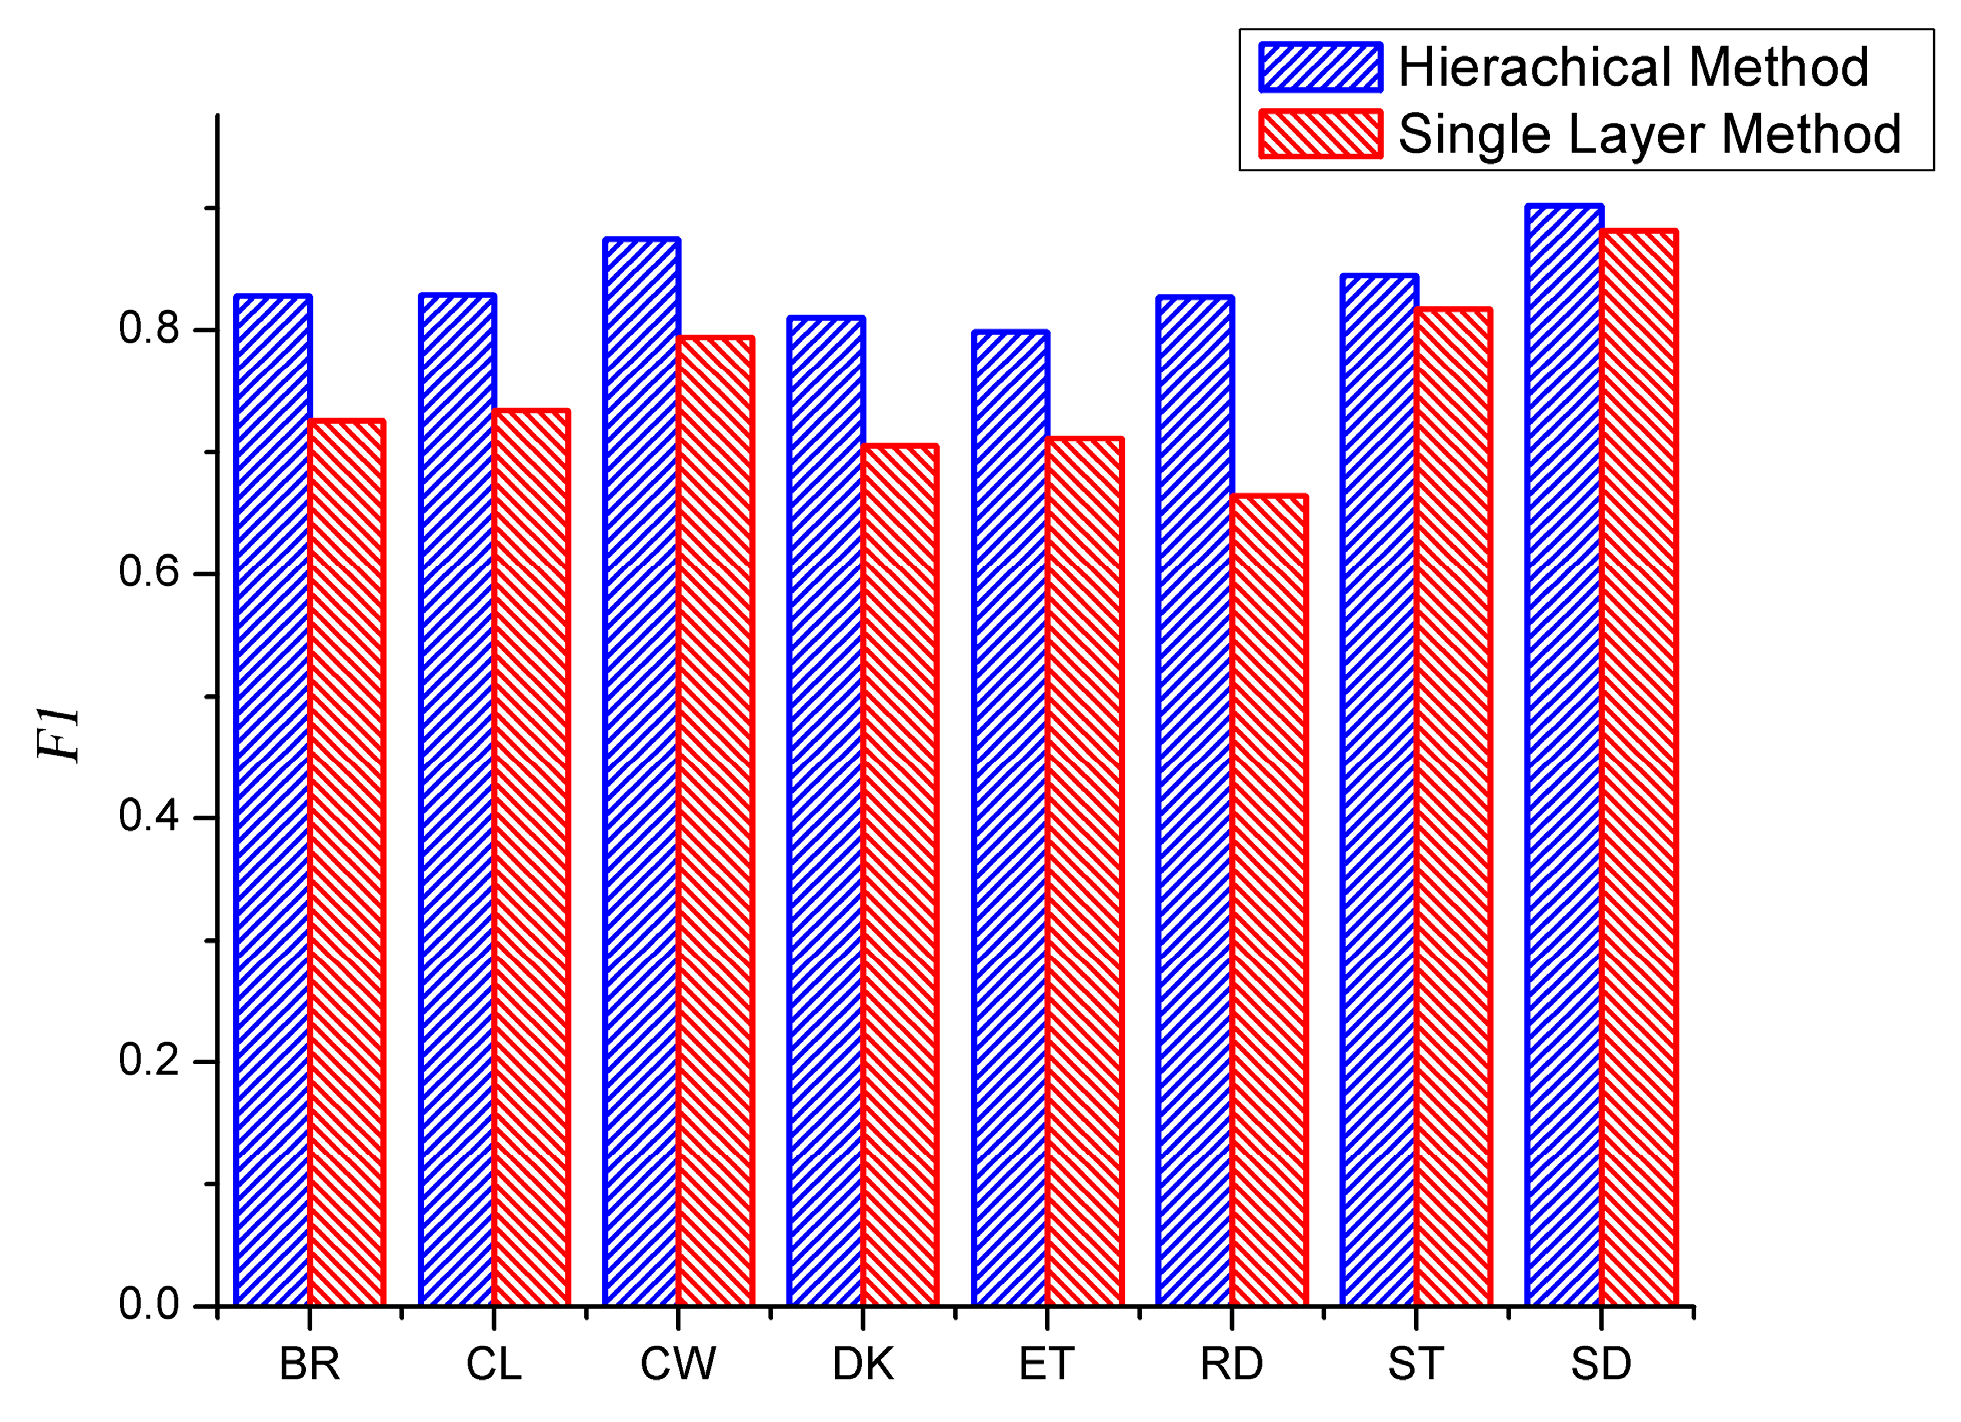
3.6. Comparison between the Proposed Method and Single Layer Method
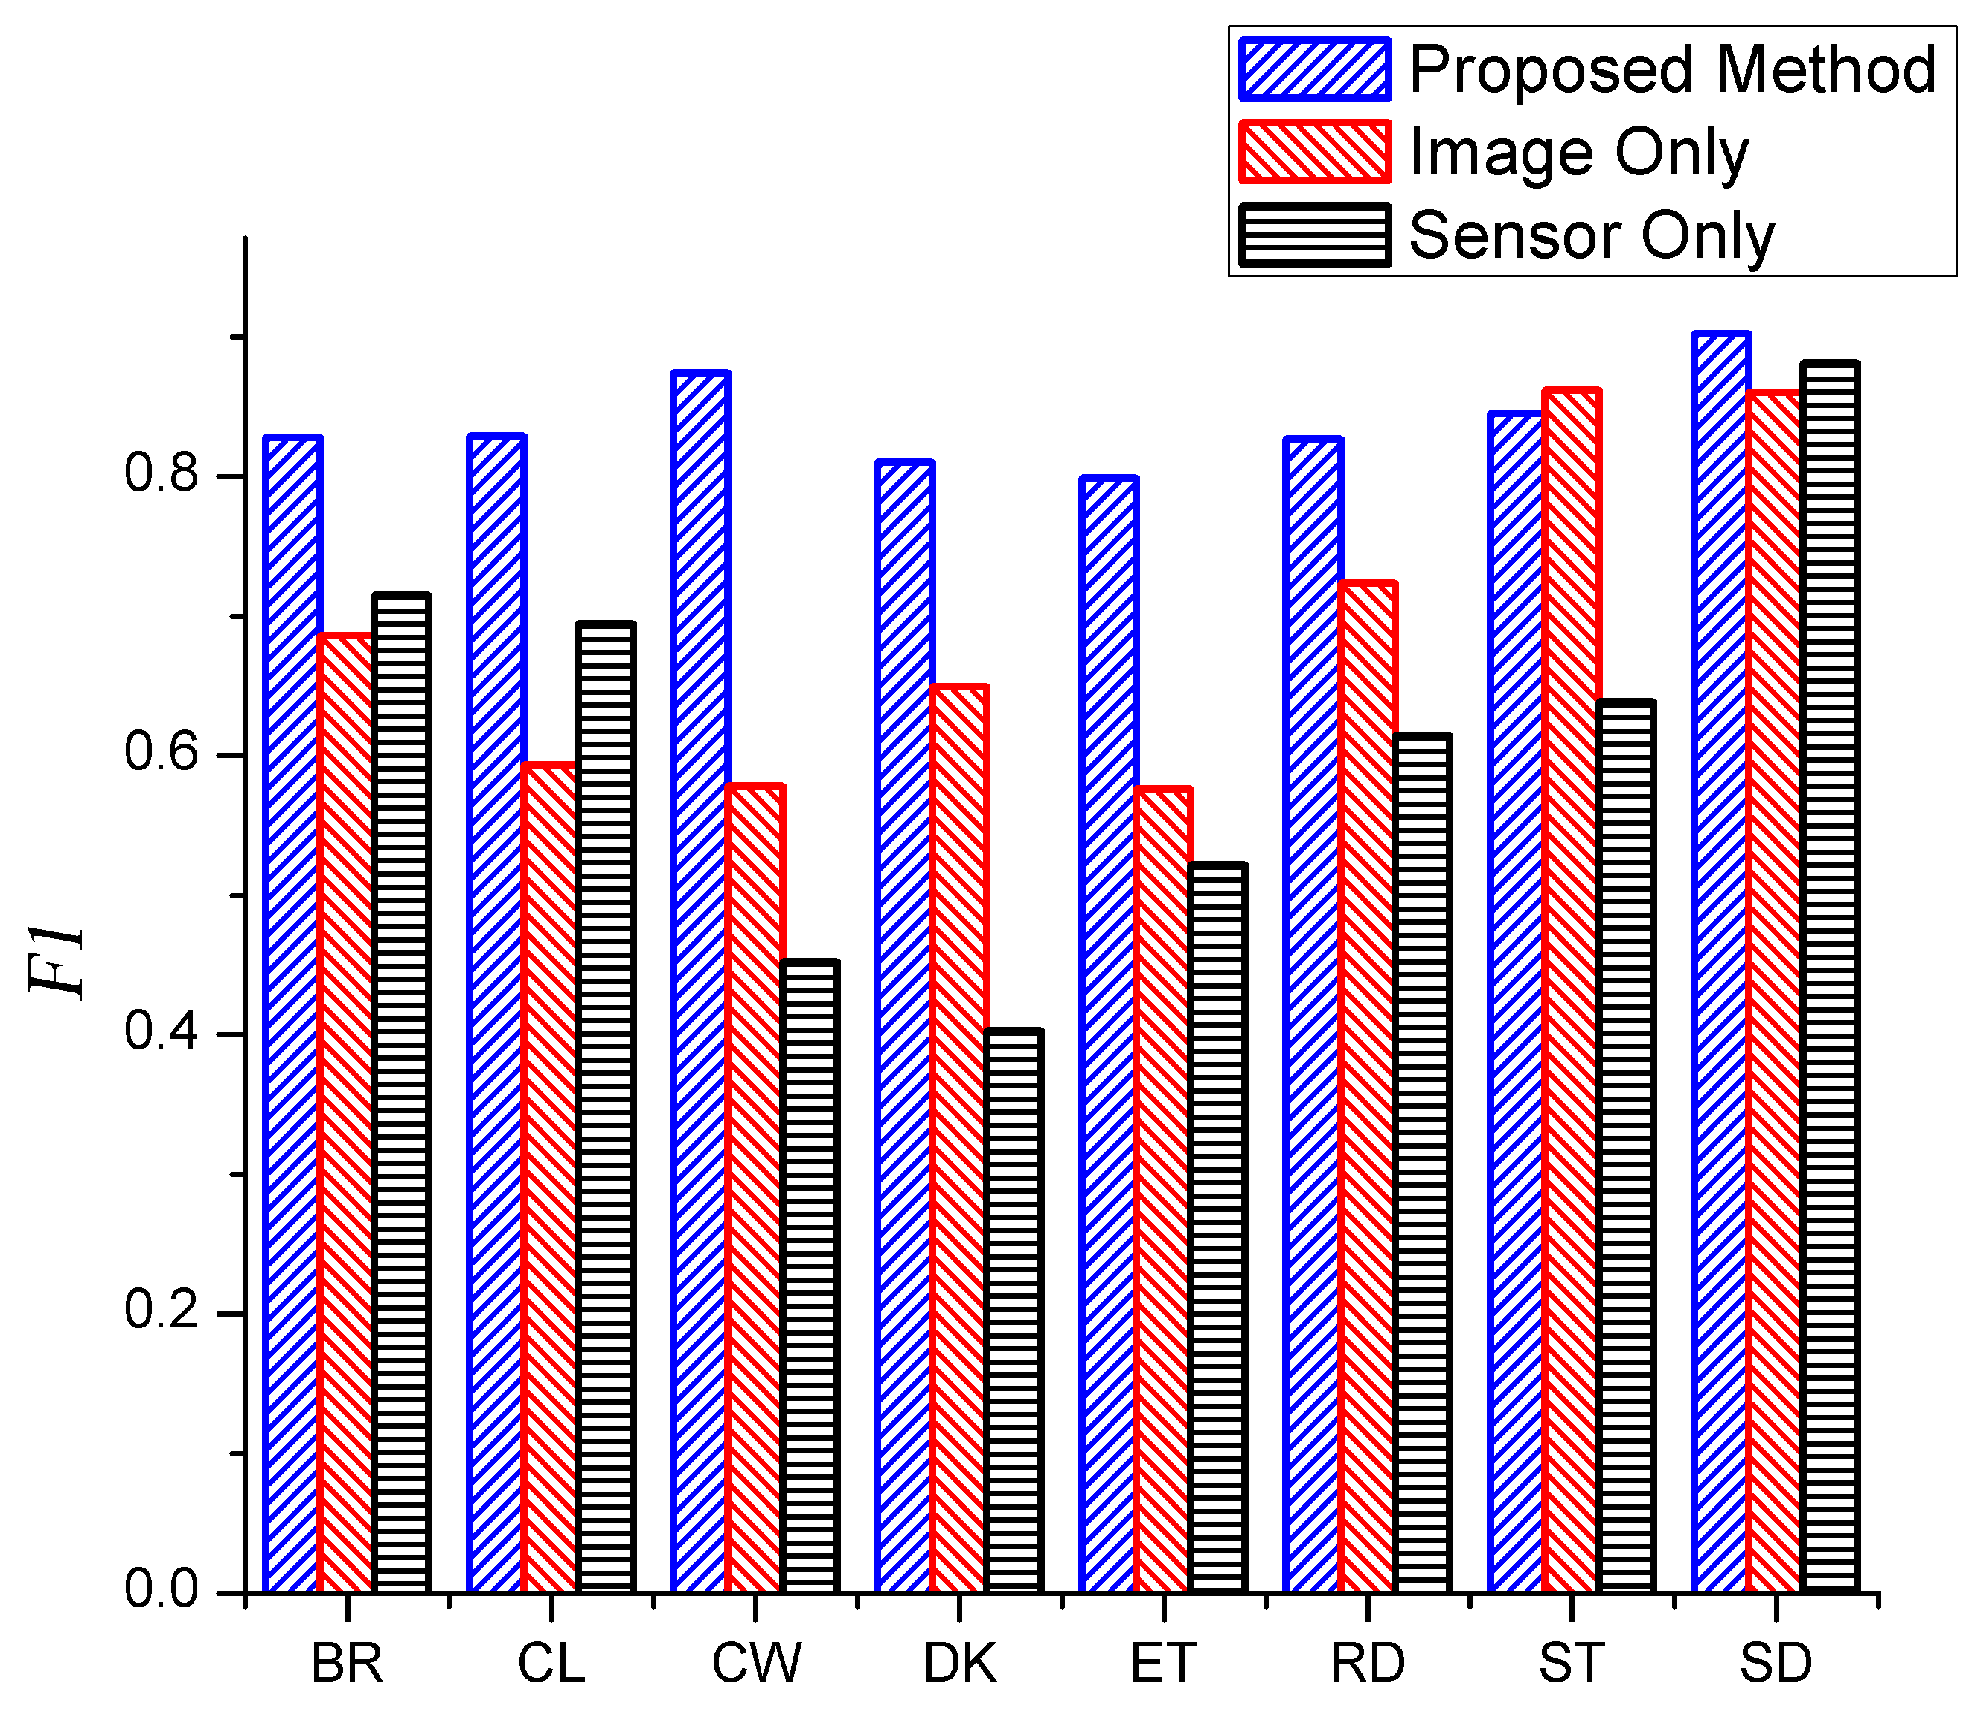
3.7. Comparison between the Data Fusion and Single Source Data
4. Conclusions
Acknowledgments
Author Contributions
Conflicts of Interest
References
- Robertson, N.; Reid, I. A general method for human activity recognition in video. Comput. Vis. Image Underst. 2006, 104, 232–248. [Google Scholar] [CrossRef]
- Bi, S.; Ahmed, K.T.; Cristian, S.; Chong, D.; Farrell, J.A. Roy-Chowdhury Amit K Tracking and Activity Recognition through Consensus in Distributed Camera Networks. IEEE Trans. Image Process. 2010, 19, 2564–2579. [Google Scholar]
- Mosabbeb, E.A.; Raahemifar, K.; Fathy, M. Multi-view human activity recognition in distributed camera sensor networks. Sensors 2013, 13, 8750–8770. [Google Scholar] [CrossRef] [PubMed]
- Zhang, C.; Tian, Y. Rgb-d camera-based daily living activity recognition. J. Comput. Vis. Image Process. 2012, 2, 1–7. [Google Scholar]
- Ni, B.; Wang, G.; Moulin, P. GBD-HuDaAct: A color-depth video database for human daily activity recognition. Adv. Comput. Vis. Pattern Recognit. 2013, 47, 1147–1153. [Google Scholar]
- Fotiadou, E.; Nikolaidis, N. A correspondence based method for activity recognition in human skeleton motion sequences. In Proceedings of the 2014 IEEE International Conference on Image Processing (ICIP), Paris, Fracne, 27–30 October 2014; pp. 1500–1504.
- Zhu, G.; Zhang, L.; Shen, P.; Song, J. An Online Continuous Human Action Recognition Algorithm Based on the Kinect Sensor. Sensors 2016, 16, 161. [Google Scholar] [CrossRef] [PubMed]
- Huang, W.; Li, M.; Hu, W.; Song, G. Cost sensitive GPS-based activity recognition. In Proceedings of the International Conference on Fuzzy Systems and Knowledge Discovery, Shenyang, China, 23–25 July 2013; pp. 962–966.
- Sun, M.; Burke, L.E.; Baranowski, T.; Fernstrom, J.D.; Zhang, H.; Chen, H.C.; Bai, Y.; Li, Y.; Li, C.; Yue, Y. An exploratory study on a chest-worn computer for evaluation of diet, physical activity and lifestyle. J. Healthc. Eng. 2015, 6, 1–22. [Google Scholar] [CrossRef] [PubMed]
- Chernbumroong, S.; Atkins, A.S.; Yu, H. Activity classification using a single wrist-worn accelerometer. In Proceedings of the 2011 5th International Conference on Software, Knowledge Information, Industrial Management and Applications (SKIMA), Benevento, Italy, 8–11 September 2011; pp. 1–6.
- Garcia-Ceja, E.; Brena, R.F.; Carrasco-Jimenez, J.C.; Garrido, L. Long-Term Activity Recognition from Wristwatch Accelerometer Data. Sensors 2014, 14, 22500–22524. [Google Scholar] [CrossRef] [PubMed]
- Rosenberger, M.E.; Haskell, W.L.; Albinali, F.; Mota, S.; Nawyn, J.; Intille, S. Estimating activity and sedentary behavior from an accelerometer on the hip or wrist. Med. Sci. Sports Exerc. 2013, 45, 964–975. [Google Scholar] [CrossRef] [PubMed]
- Khan, A.M.; Lee, Y.-K.; Lee, S.Y.; Kim, T.-S. A triaxial accelerometer-based physical-activity recognition via augmented-signal features and a hierarchical recognizer. IEEE Trans. Inf. Technol. Biomed. 2010, 14, 1166–1172. [Google Scholar] [CrossRef] [PubMed]
- Mannini, A.; Intille, S.S.; Rosenberger, M.; Sabatini, A.M.; Haskell, W. Activity recognition using a single accelerometer placed at the wrist or ankle. Med. Sci. Sports Exerc. 2013, 45, 2193–2203. [Google Scholar] [CrossRef] [PubMed]
- Gao, L.; Bourke, A.K.; Nelson, J. A comparison of classifiers for activity recognition using multiple accelerometer-based sensors. In Proceedings of the IEEE 11th International Conference on Cybernetic Intelligent Systems, Limerick, Ireland, 23–24 August 2012; pp. 149–153.
- Zhu, C.; Sheng, W. Human daily activity recognition in robot-assisted living using multi-sensor fusion. In Proceedings of the IEEE International Conference on Robotics and Automation, Kebe, Japan, 12–17 May 2009; pp. 2154–2159.
- Bao, L.; Intille, S.S. Activity recognition from user-annotated acceleration data. In Proceedings of the Second International Conference on Pervasive Computing, Vienna, Austria, 18–23 April 2004; pp. 1–17.
- Morillo, L.M.S.; Gonzalez-Abril, L.; Ramirez, J.A.O.; de la Concepcion, M.A.A. Low Energy Physical Activity Recognition System on Smartphones. Sensors 2015, 15, 5163–5196. [Google Scholar] [CrossRef] [PubMed]
- Inoue, S.; Hattori, Y. Toward high-level activity recognition from accelerometers on mobile phones. In Proceedings of the 4th International Conference on Cyber, Physical and Social Computing, Dalian, China, 19–22 October 2011; pp. 225–231.
- Silva, L.C.D.; Morikawa, C.; Petra, I.M. State of the art of smart homes. Eng. Appl. Artif. Intell. 2012, 25, 1313–1321. [Google Scholar] [CrossRef]
- Shotton, J.; Fitzgibbon, A.; Cook, M.; Sharp, T.; Finocchio, M.; Moore, R.; Kipman, A.; Blake, A. Real-time human pose recognition in parts from single depth images. In Proceedings of the 2011 IEEE Conference on Computer Vision and Pattern Recognition (CVPR), Colorado Springs, CO, USA, 20–25 June 2011; pp. 1297–1304.
- Liang, Y.; Zhou, X.; Yu, Z.; Guo, B. Energy-efficient motion related activity recognition on mobile devices for pervasive healthcare. Mob. Networks Appl. 2014, 19, 303–317. [Google Scholar] [CrossRef]
- Klaser, A.; Marszalek, M.; Schmid, C. A spatio-temporal descriptor based on 3d-gradients. In Proceedings of the British MachineVision Conference, Leeds, UK, 1–4 September 2008; pp. 995–1004.
- Holte, M.B.; Chakraborty, B.; Gonzalez, J.; Moeslund, T.B. A Local 3-D Motion Descriptor for Multi-View Human Action Recognition from 4-D Spatio-Temporal Interest Points. IEEE J. Sel. Top. Signal Process. 2012, 6, 553–565. [Google Scholar] [CrossRef]
- Kantorov, V.; Laptev, I. Efficient Feature Extraction, Encoding, and Classification for Action Recognition. In Proceedings of the 2014 IEEE Conference on Computer Vision and Pattern Recognition (CVPR), Columbus, MT, USA, 24–27 June 2014; pp. 2593–2600.
- Liu, A.-A.; Su, Y.-T.; Jia, P.-P.; Gao, Z.; Hao, T.; Yang, Z.-X. Multipe/Single-View Human Action Recognition via Part-Induced Multitask Structural Learning. IEEE Trans. Cybern. 2015, 45, 1194–1208. [Google Scholar] [CrossRef] [PubMed]
- Ni, B.; Yong, P.; Moulin, P.; Yan, S. Multilevel depth and image fusion for human activity detection. IEEE Trans. Cybern. 2013, 43, 1383–1394. [Google Scholar] [PubMed]
- Wang, J.; Liu, Z.; Wu, Y.; Yuan, J. Mining actionlet ensemble for action recognition with depth cameras. In Proceedings of the 2012 IEEE Conference on Computer Vision and Pattern Recognition (CVPR), Providence, RI, USA, 16–21 June 2012; pp. 1290–1297.
- Mannini, A.; Sabatini, A.M. Accelerometry-based classification of human activities using Markov modeling. Comput. Intell. Neurosci. 2011, 2011, 252–257. [Google Scholar] [CrossRef] [PubMed]
- Boutell, M.; Brown, C. Pictures are not taken in a vacuum—An overview of exploiting context for semantic scene content understanding. IEEE Signal Process. Mag. 2006, 23, 101–114. [Google Scholar]
- Oliver, N.; Garg, A.; Horvitz, E. Layered representations for learning and inferring office activity from multiple sensory channels. Comput. Vis. Image Underst. 2004, 96, 163–180. [Google Scholar] [CrossRef]
- Yin, J.; Yang, Q.; Pan, J.J. Sensor-based abnormal human-activity detection. IEEE Trans. Knowl. Data Eng. 2008, 20, 1082–1090. [Google Scholar] [CrossRef]
- Shimosaka, M.; Mori, T.; Sato, T. Robust indoor activity recognition via boosting. In Proceedings of the 2008 19th International Conference on Pattern Recognition, Tampa, FL, USA, 8–11 December 2008; pp. 1–4.
- Zeng, M.; Nguyen, L.T.; Yu, B.; Mengshoel, O.J.; Zhu, J.; Wu, P.; Zhang, J. Convolutional Neural Networks for Human Activity Recognition Using Mobile Sensors. In Proceedings of the 2014 6th International Conference on Mobile Computing, Applications and Services (MobiCASE), Austin, TX, USA, 6–7 November 2014; pp. 197–205.
- Cao, L.; Luo, J.; Kautz, H.; Huang, T.S. Image Annotation Within the Context of Personal Photo Collections Using Hierarchical Event and Scene Models. IEEE Trans. Multimed. 2009, 11, 208–219. [Google Scholar] [CrossRef]
- Yin, J.; Meng, Y. Human activity recognition in video using a hierarchical probabilistic latent model. In Proceedings of the 2010 IEEE Computer Society Conference on Computer Vision and Pattern Recognition Workshops, San Francisco, CA, USA, 13–18 June 2010; pp. 15–20.
- Xia, L.; Chen, C.C.; Aggarwal, J.K. View invariant human action recognition using histograms of 3D joints. In Proceedings of the 2012 IEEE Computer Society Conference on Computer Vision and Pattern Recognition Workshops, Providence, RI, USA, 16–21 June 2012; pp. 20–27.
- Yang, M.Y.M.; Serrano, J.C.; Grecos, C. MPEG-7 Descriptors Based Shot Detection and Adaptive Initial Quantization Parameter Estimation for the H.264/AVC. IEEE Trans. Broadcast. 2009, 55, 165–177. [Google Scholar] [CrossRef]
- Li, Z.; Wei, Z.; Yue, Y.; Wang, H.; Jia, W.; Burke, L.E.; Baranowski, T.; Sun, M. An Adaptive Hidden Markov Model for Activity Recognition Based on a Wearable Multi-Sensor Device. J. Med. Syst. 2015, 39, 1–10. [Google Scholar] [CrossRef] [PubMed]


| Predicted Label | |||||||||
|---|---|---|---|---|---|---|---|---|---|
| BR | CL | CW | DK | ET | RD | ST | SD | ||
| True Label | BR | 301 | 66 | 0 | 10 | 0 | 0 | 1 | 22 |
| CL | 16 | 348 | 0 | 0 | 2 | 3 | 0 | 31 | |
| CW | 0 | 9 | 355 | 0 | 12 | 8 | 16 | 0 | |
| DK | 1 | 1 | 18 | 321 | 37 | 12 | 7 | 3 | |
| ET | 0 | 1 | 15 | 29 | 327 | 17 | 11 | 0 | |
| RD | 0 | 1 | 10 | 20 | 30 | 318 | 21 | 0 | |
| ST | 2 | 5 | 14 | 13 | 11 | 11 | 335 | 9 | |
| SD | 7 | 9 | 0 | 0 | 0 | 0 | 2 | 382 | |
| F1 | 0.828 | 0.829 | 0.874 | 0.810 | 0.799 | 0.827 | 0.845 | 0.902 | |
© 2016 by the authors; licensee MDPI, Basel, Switzerland. This article is an open access article distributed under the terms and conditions of the Creative Commons Attribution (CC-BY) license (http://creativecommons.org/licenses/by/4.0/).
Share and Cite
Li, Z.; Wei, Z.; Huang, L.; Zhang, S.; Nie, J. Hierarchical Activity Recognition Using Smart Watches and RGB-Depth Cameras. Sensors 2016, 16, 1713. https://doi.org/10.3390/s16101713
Li Z, Wei Z, Huang L, Zhang S, Nie J. Hierarchical Activity Recognition Using Smart Watches and RGB-Depth Cameras. Sensors. 2016; 16(10):1713. https://doi.org/10.3390/s16101713
Chicago/Turabian StyleLi, Zhen, Zhiqiang Wei, Lei Huang, Shugang Zhang, and Jie Nie. 2016. "Hierarchical Activity Recognition Using Smart Watches and RGB-Depth Cameras" Sensors 16, no. 10: 1713. https://doi.org/10.3390/s16101713
APA StyleLi, Z., Wei, Z., Huang, L., Zhang, S., & Nie, J. (2016). Hierarchical Activity Recognition Using Smart Watches and RGB-Depth Cameras. Sensors, 16(10), 1713. https://doi.org/10.3390/s16101713