
Strain Modal Analysis of Small and Light Pipes Using Distributed Fibre Bragg Grating Sensors


Abstract
:1. Introduction
2. Theoretical Background
2.1. Strain Modal Analysis
2.2. Strain Modal Parameter Identification
3. Experiment and Comparison with Finite Element Analysis (FEA) Simulation
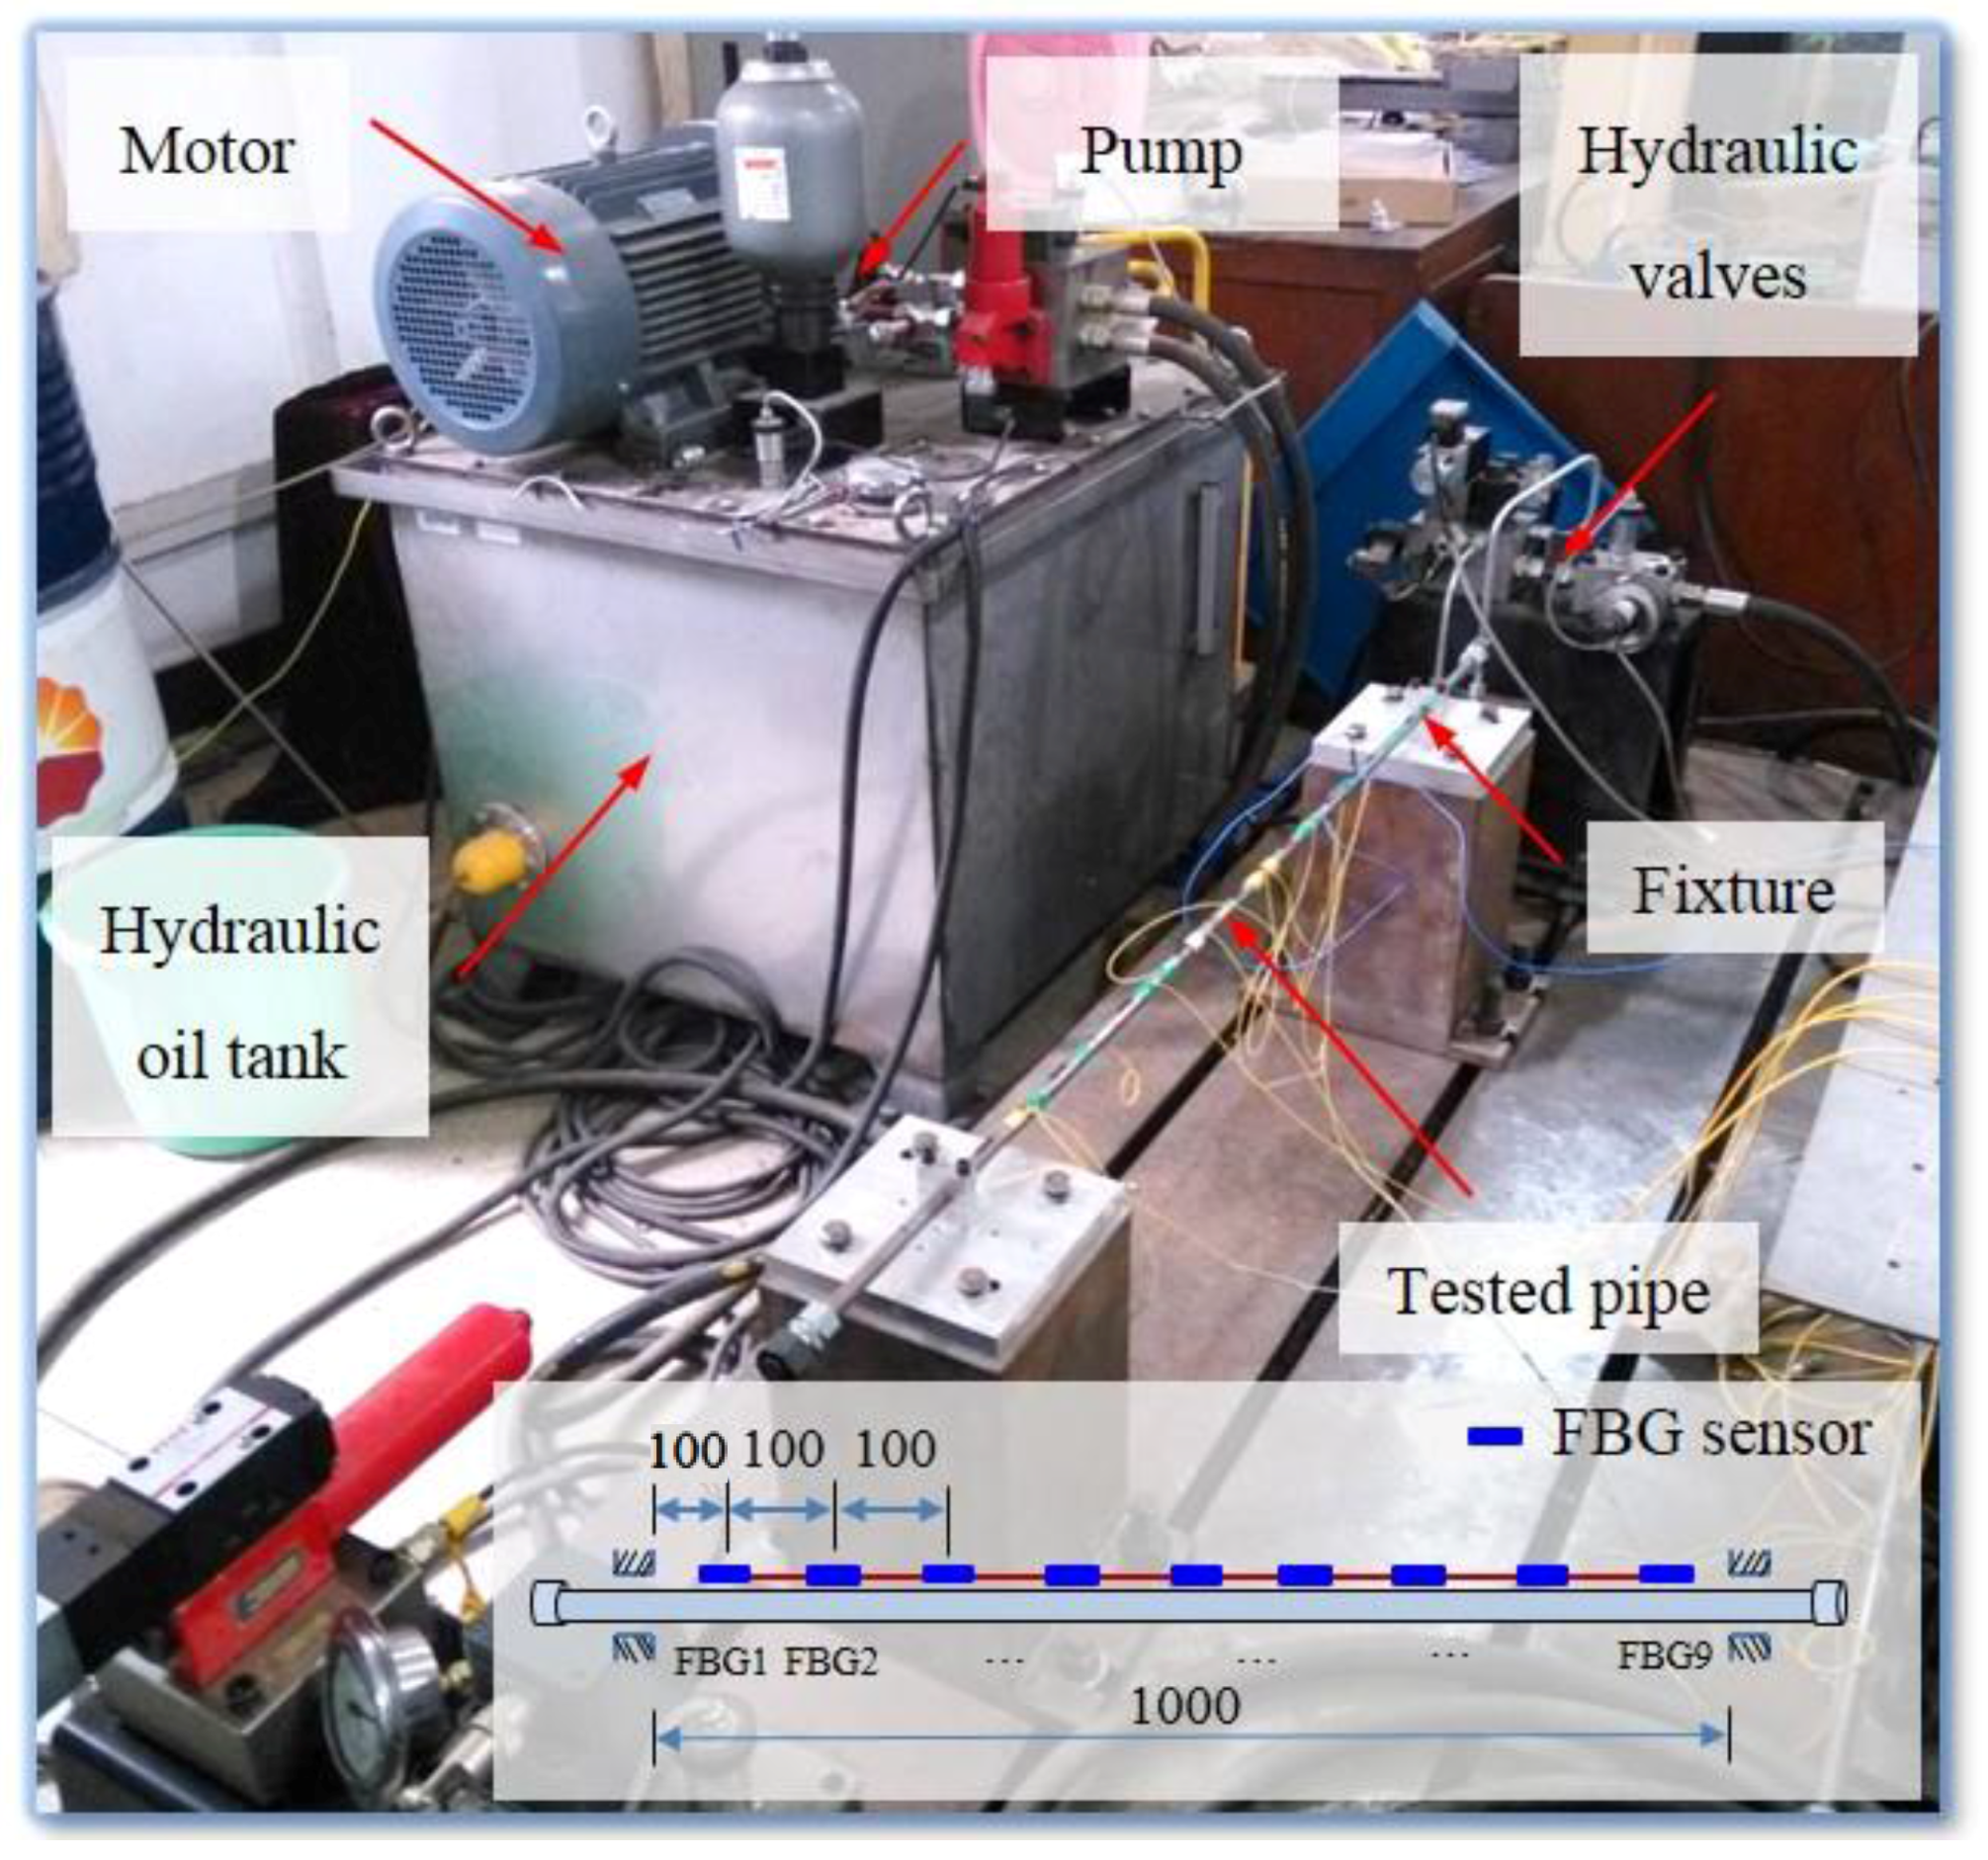
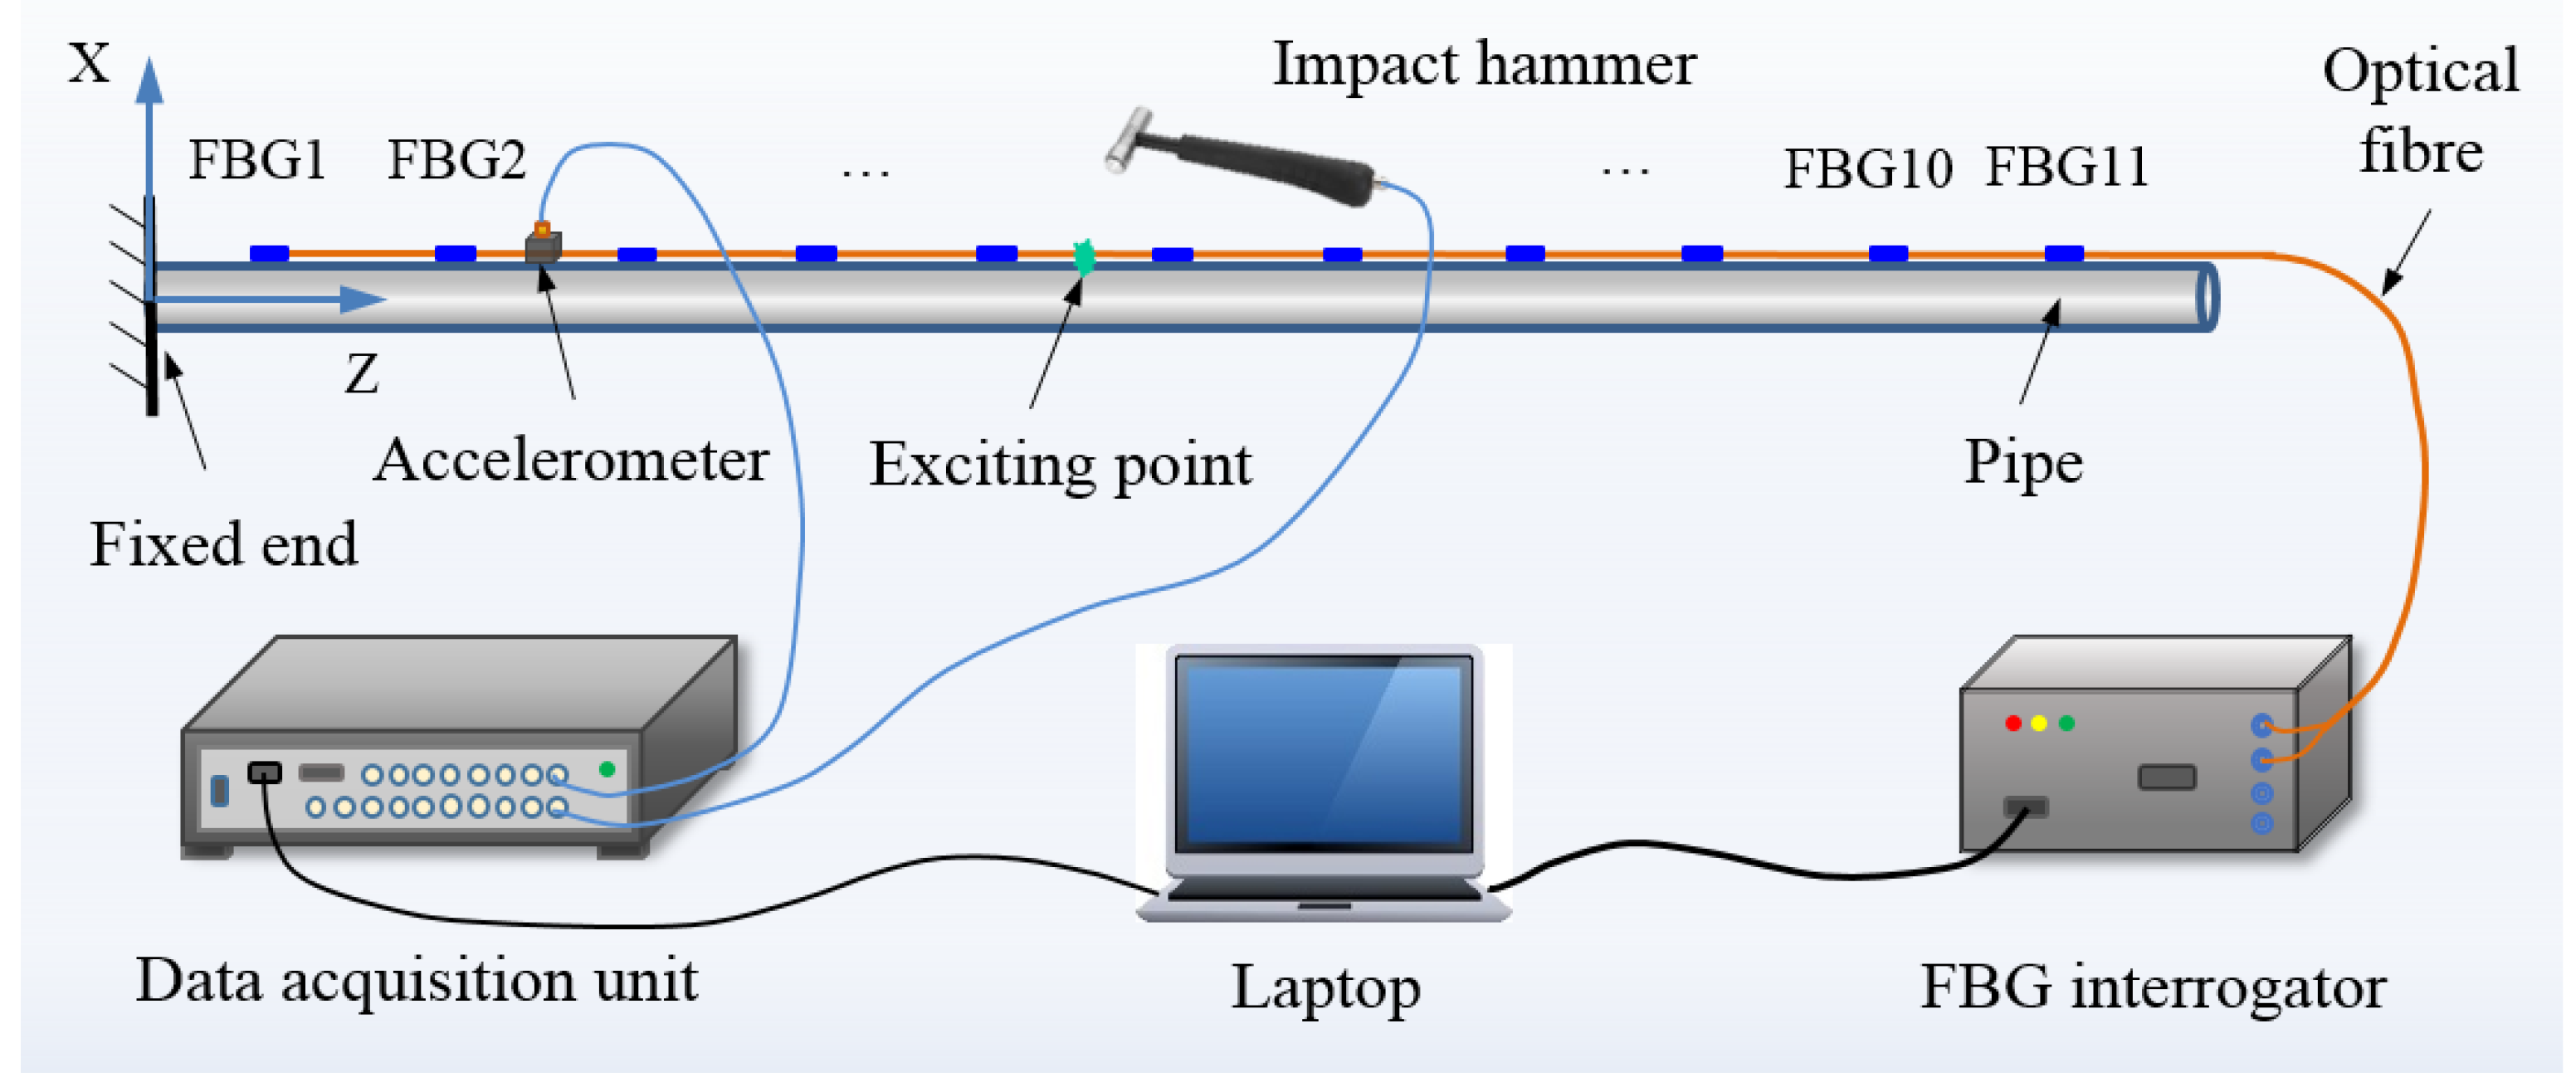
3.1. Experimental Setup
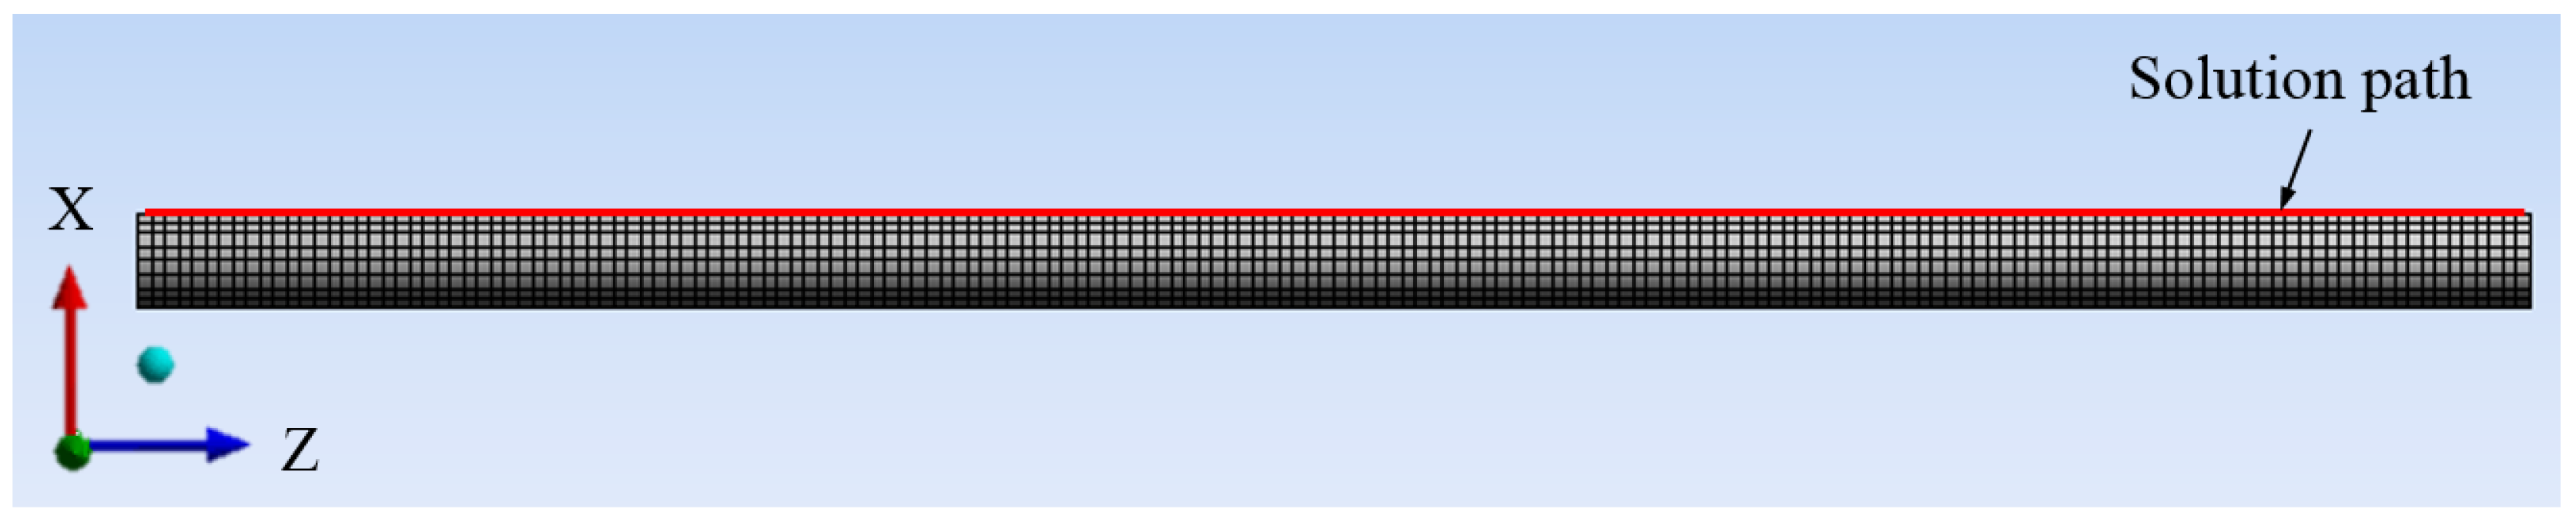
3.2. Finite Element Analysis
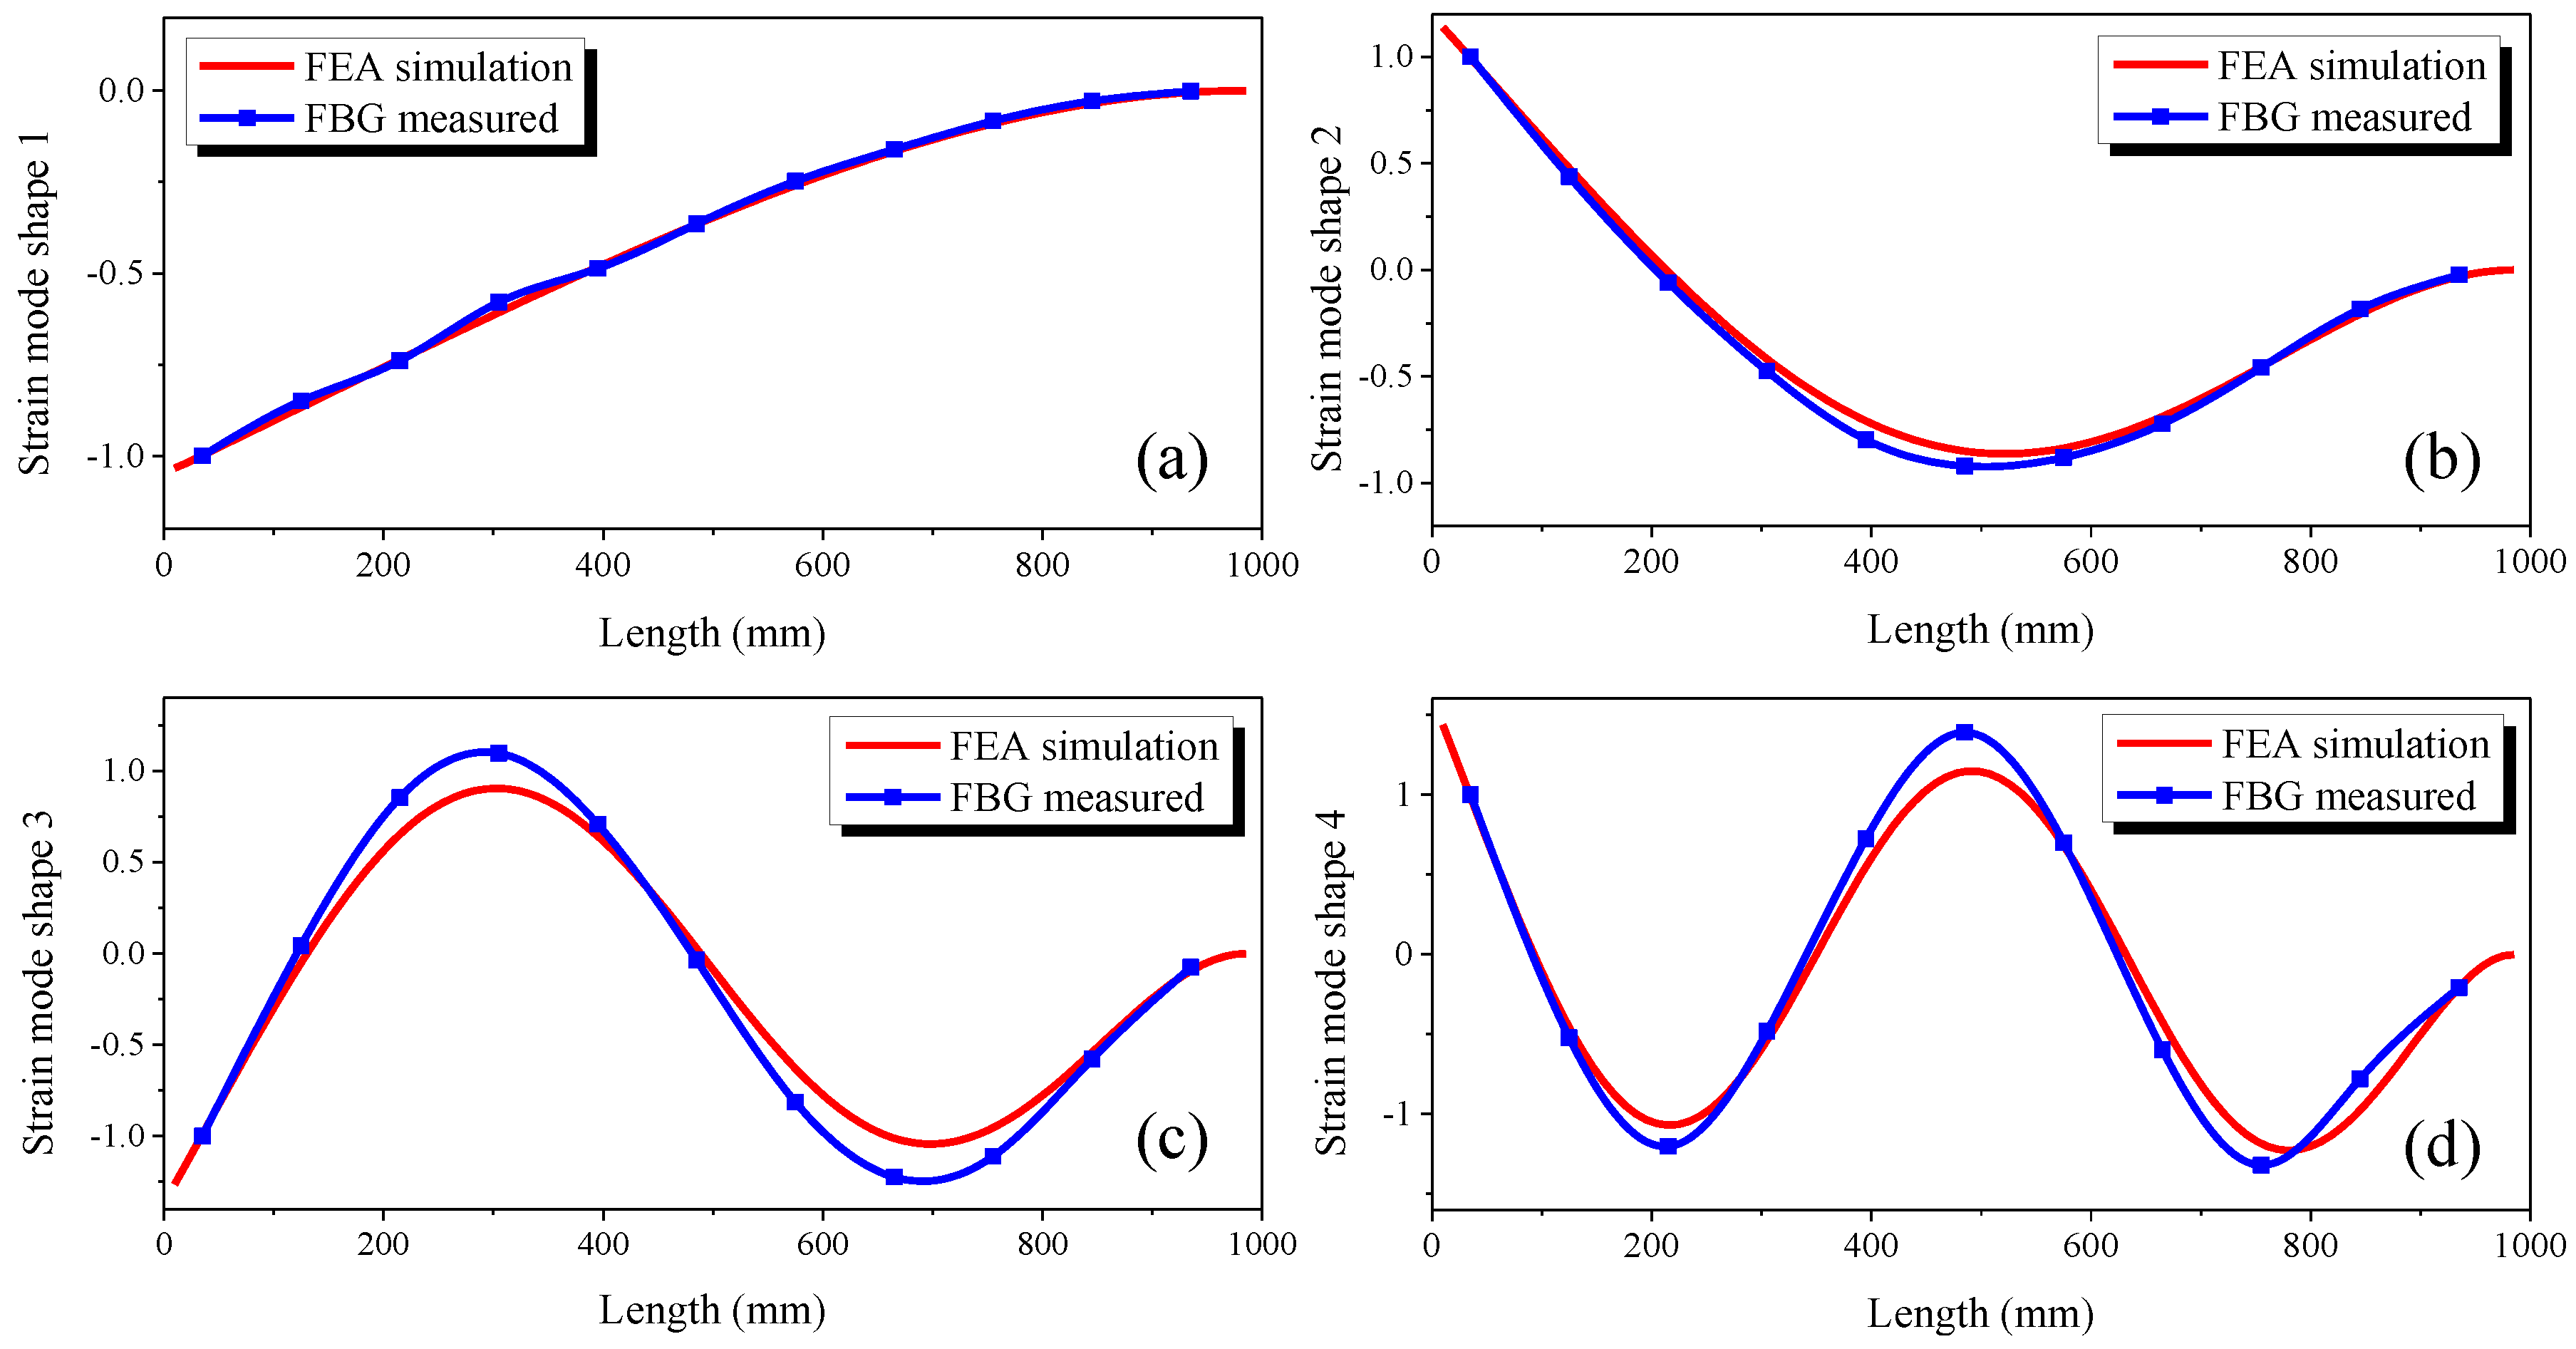
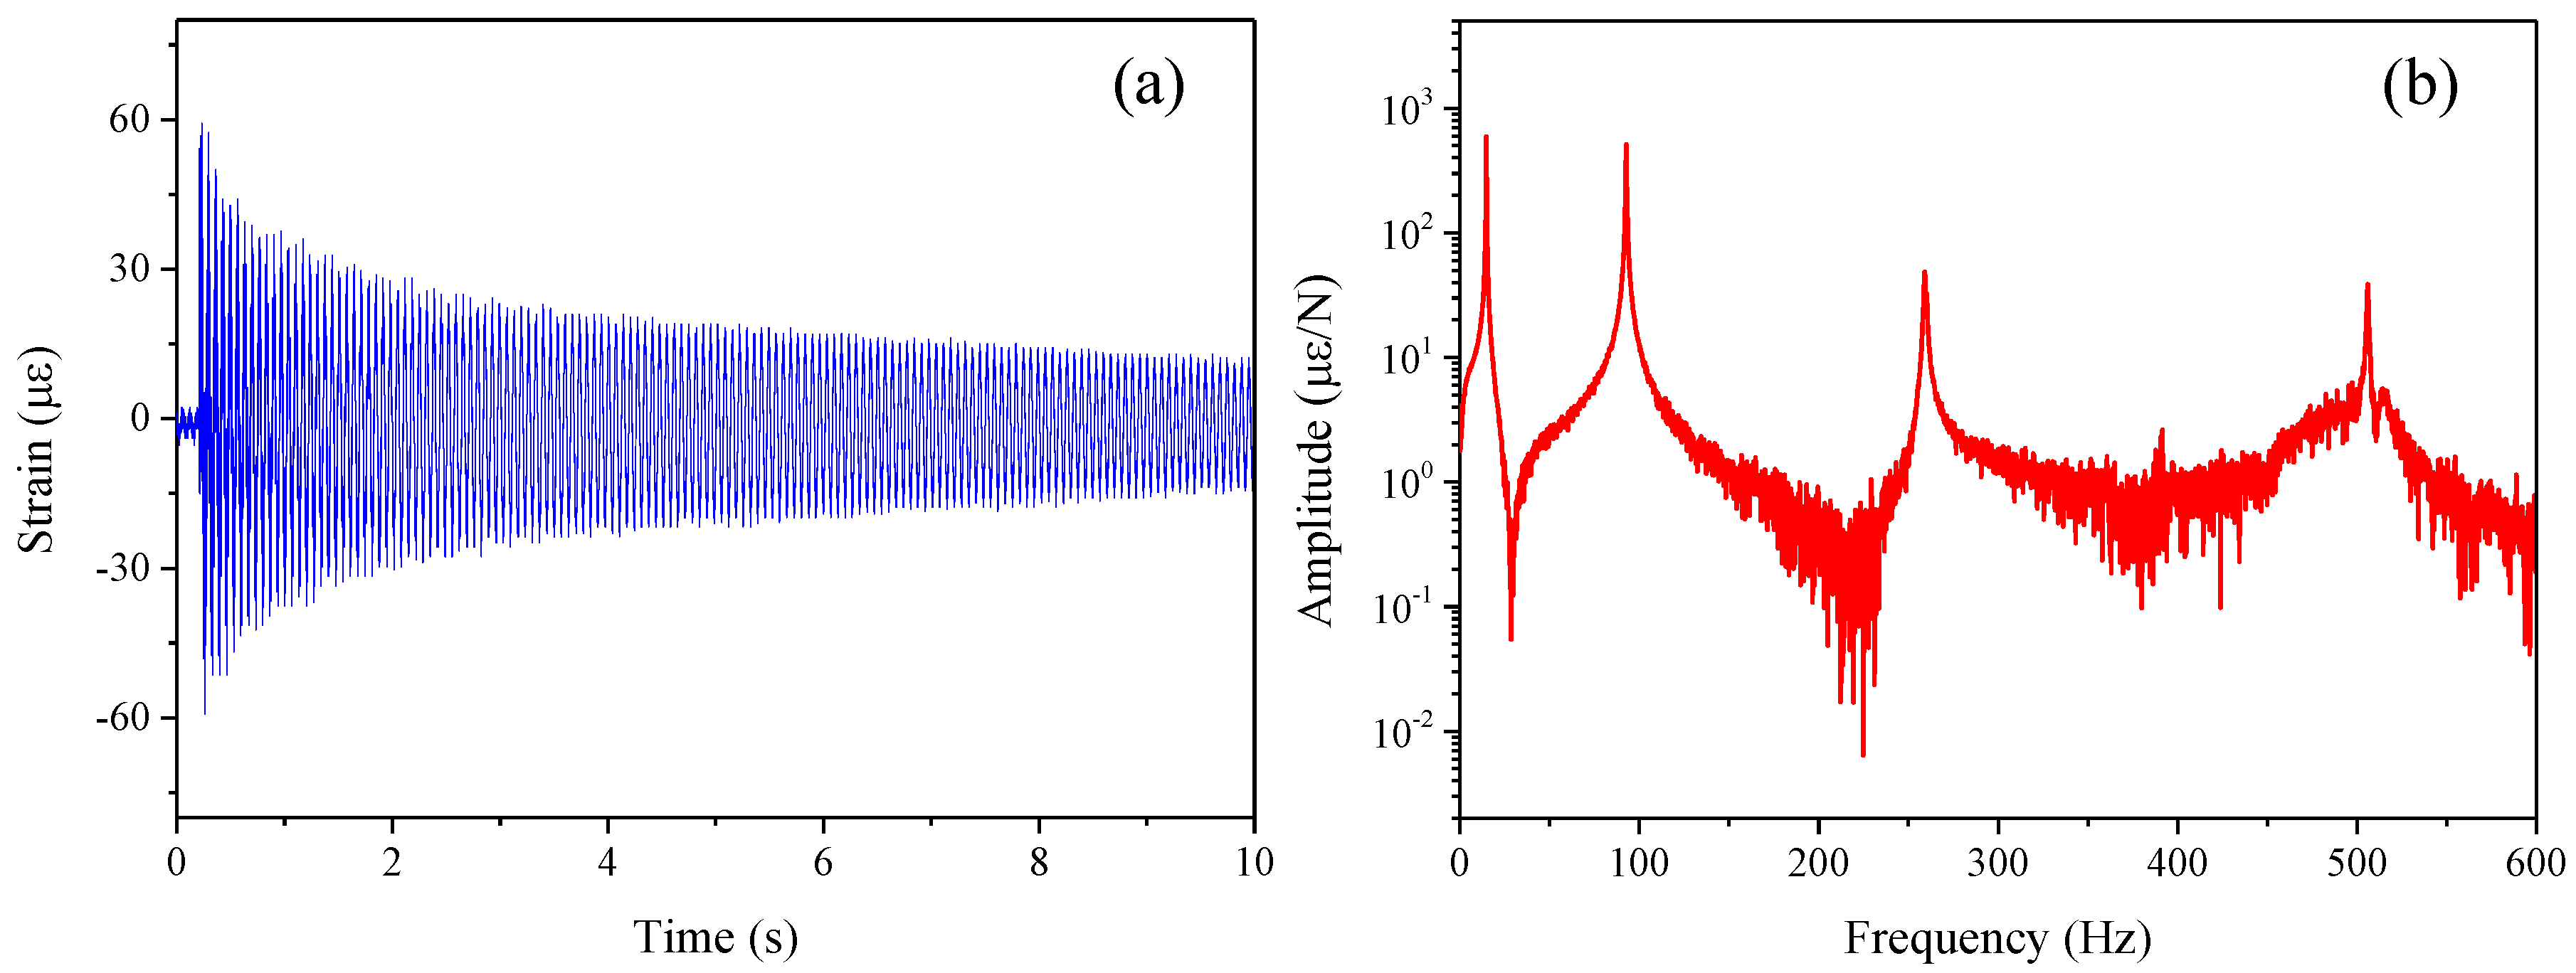
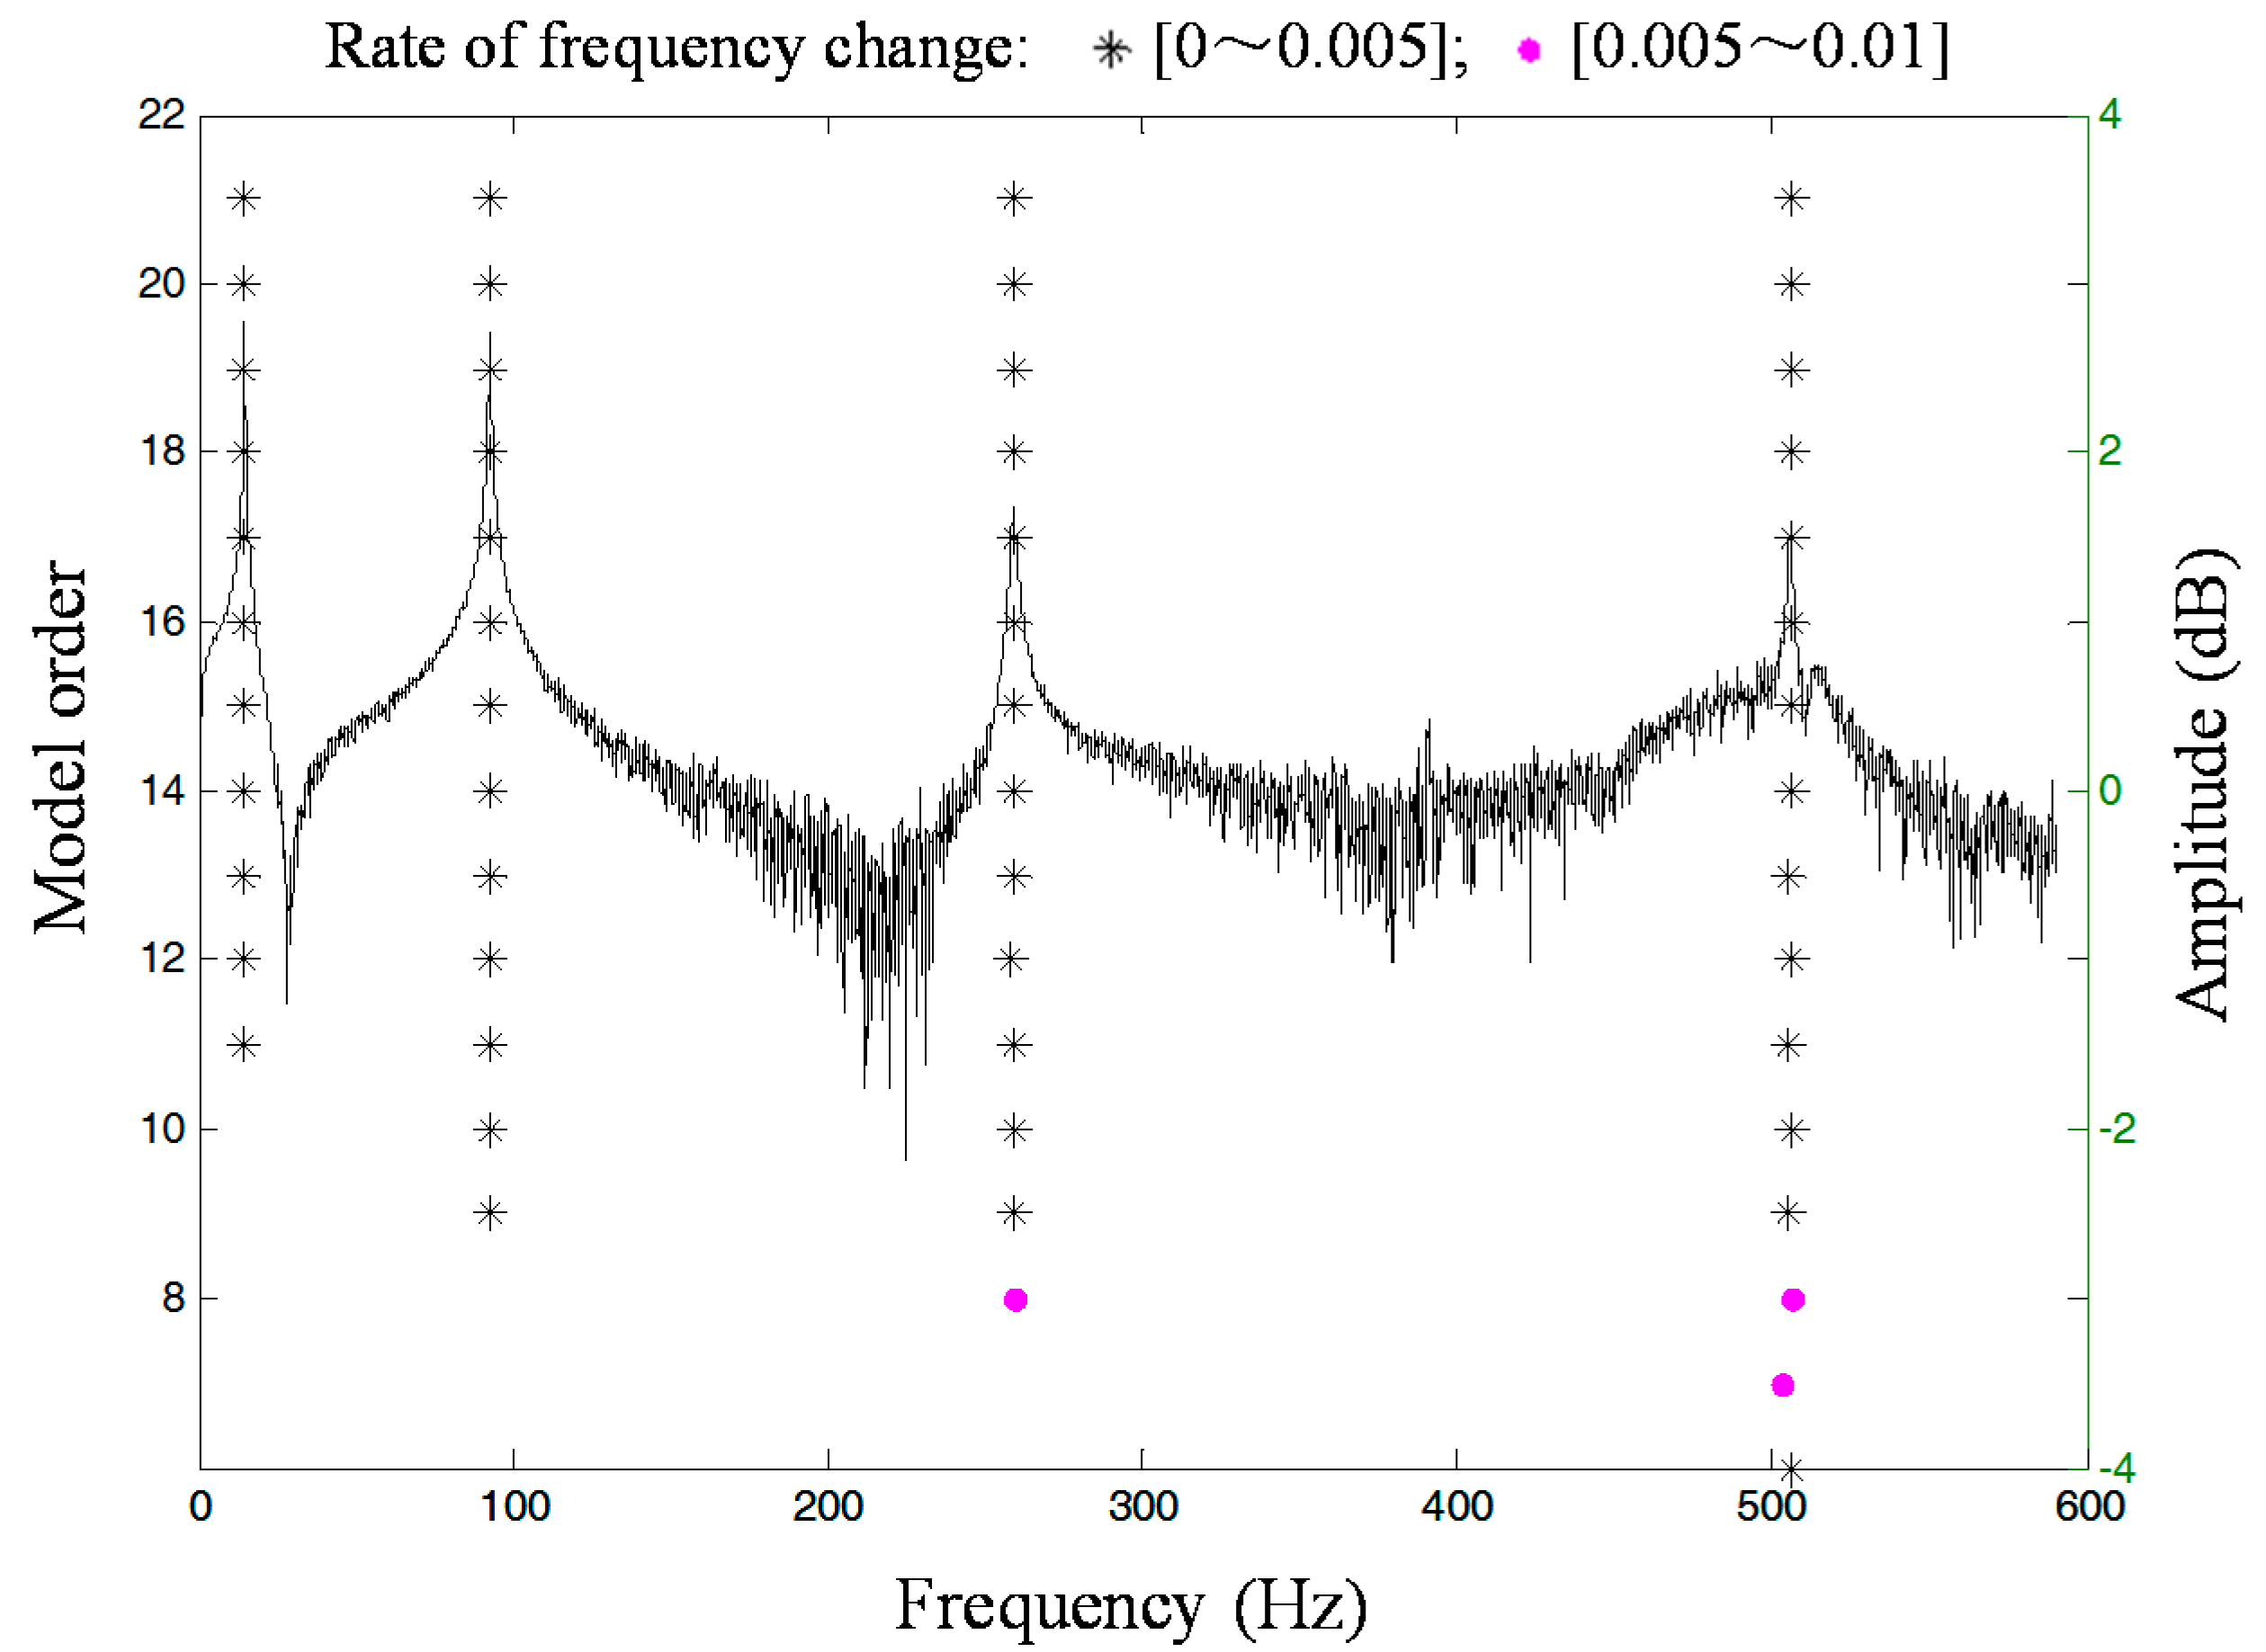
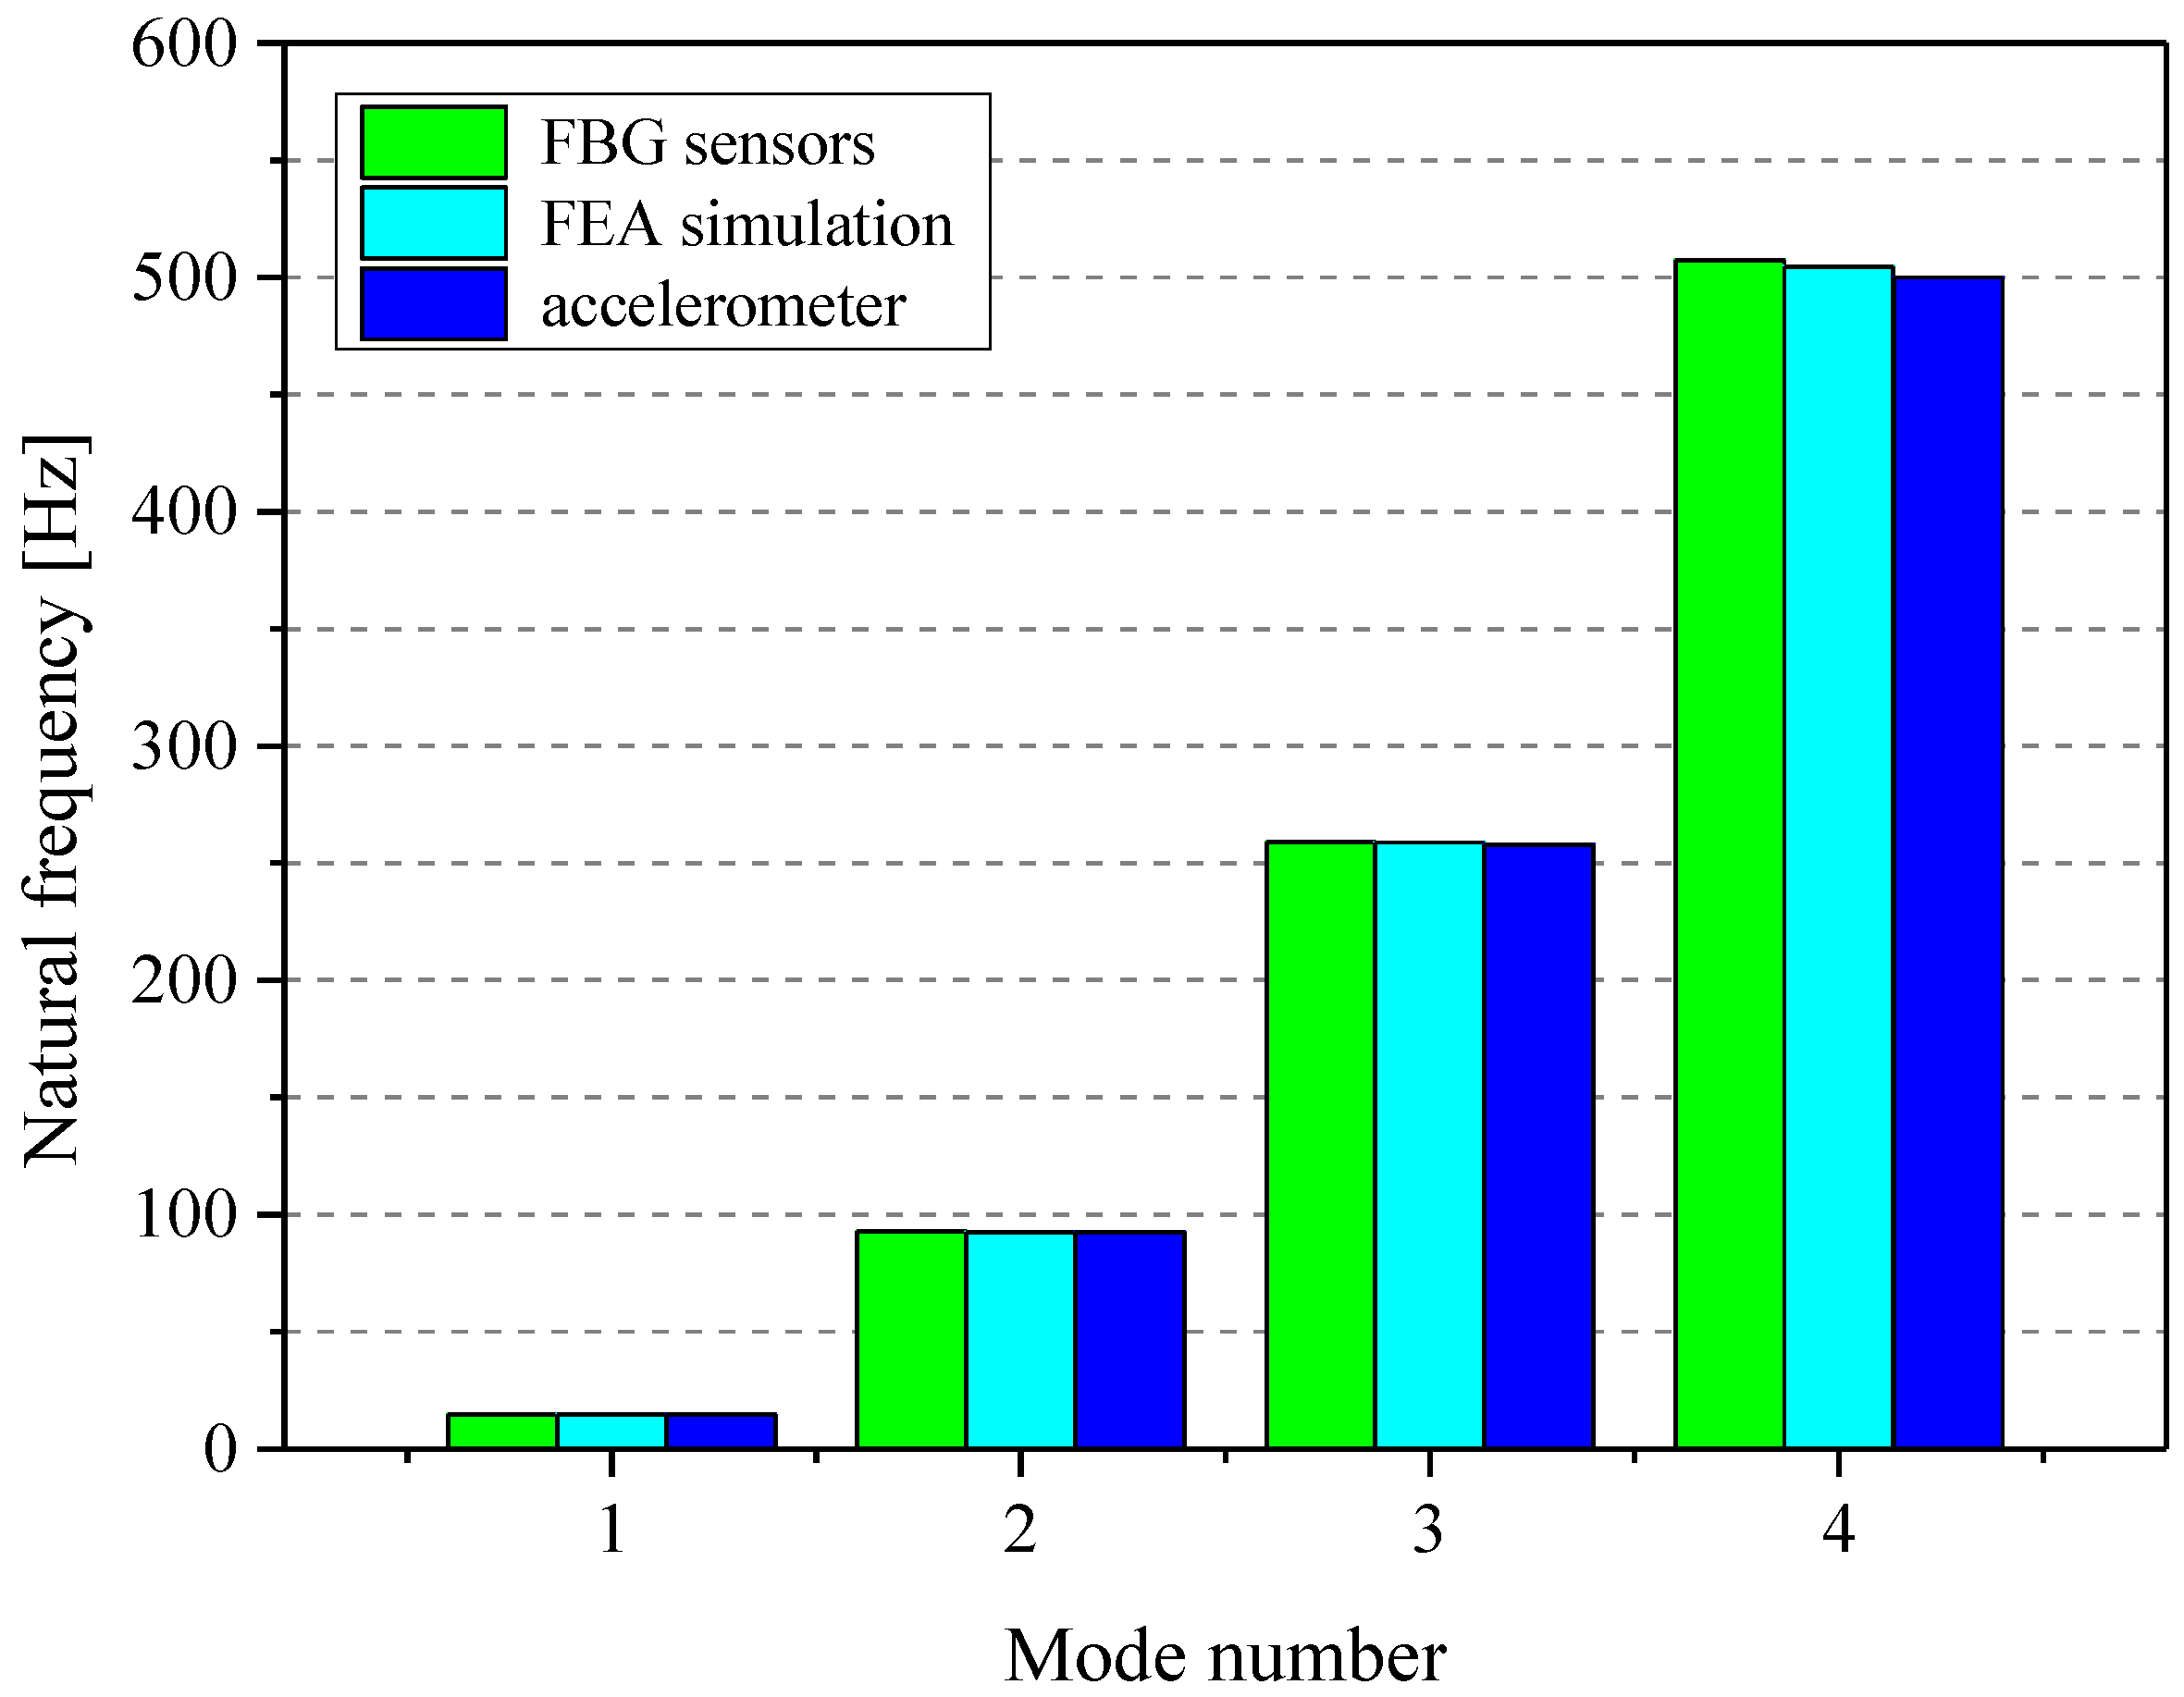
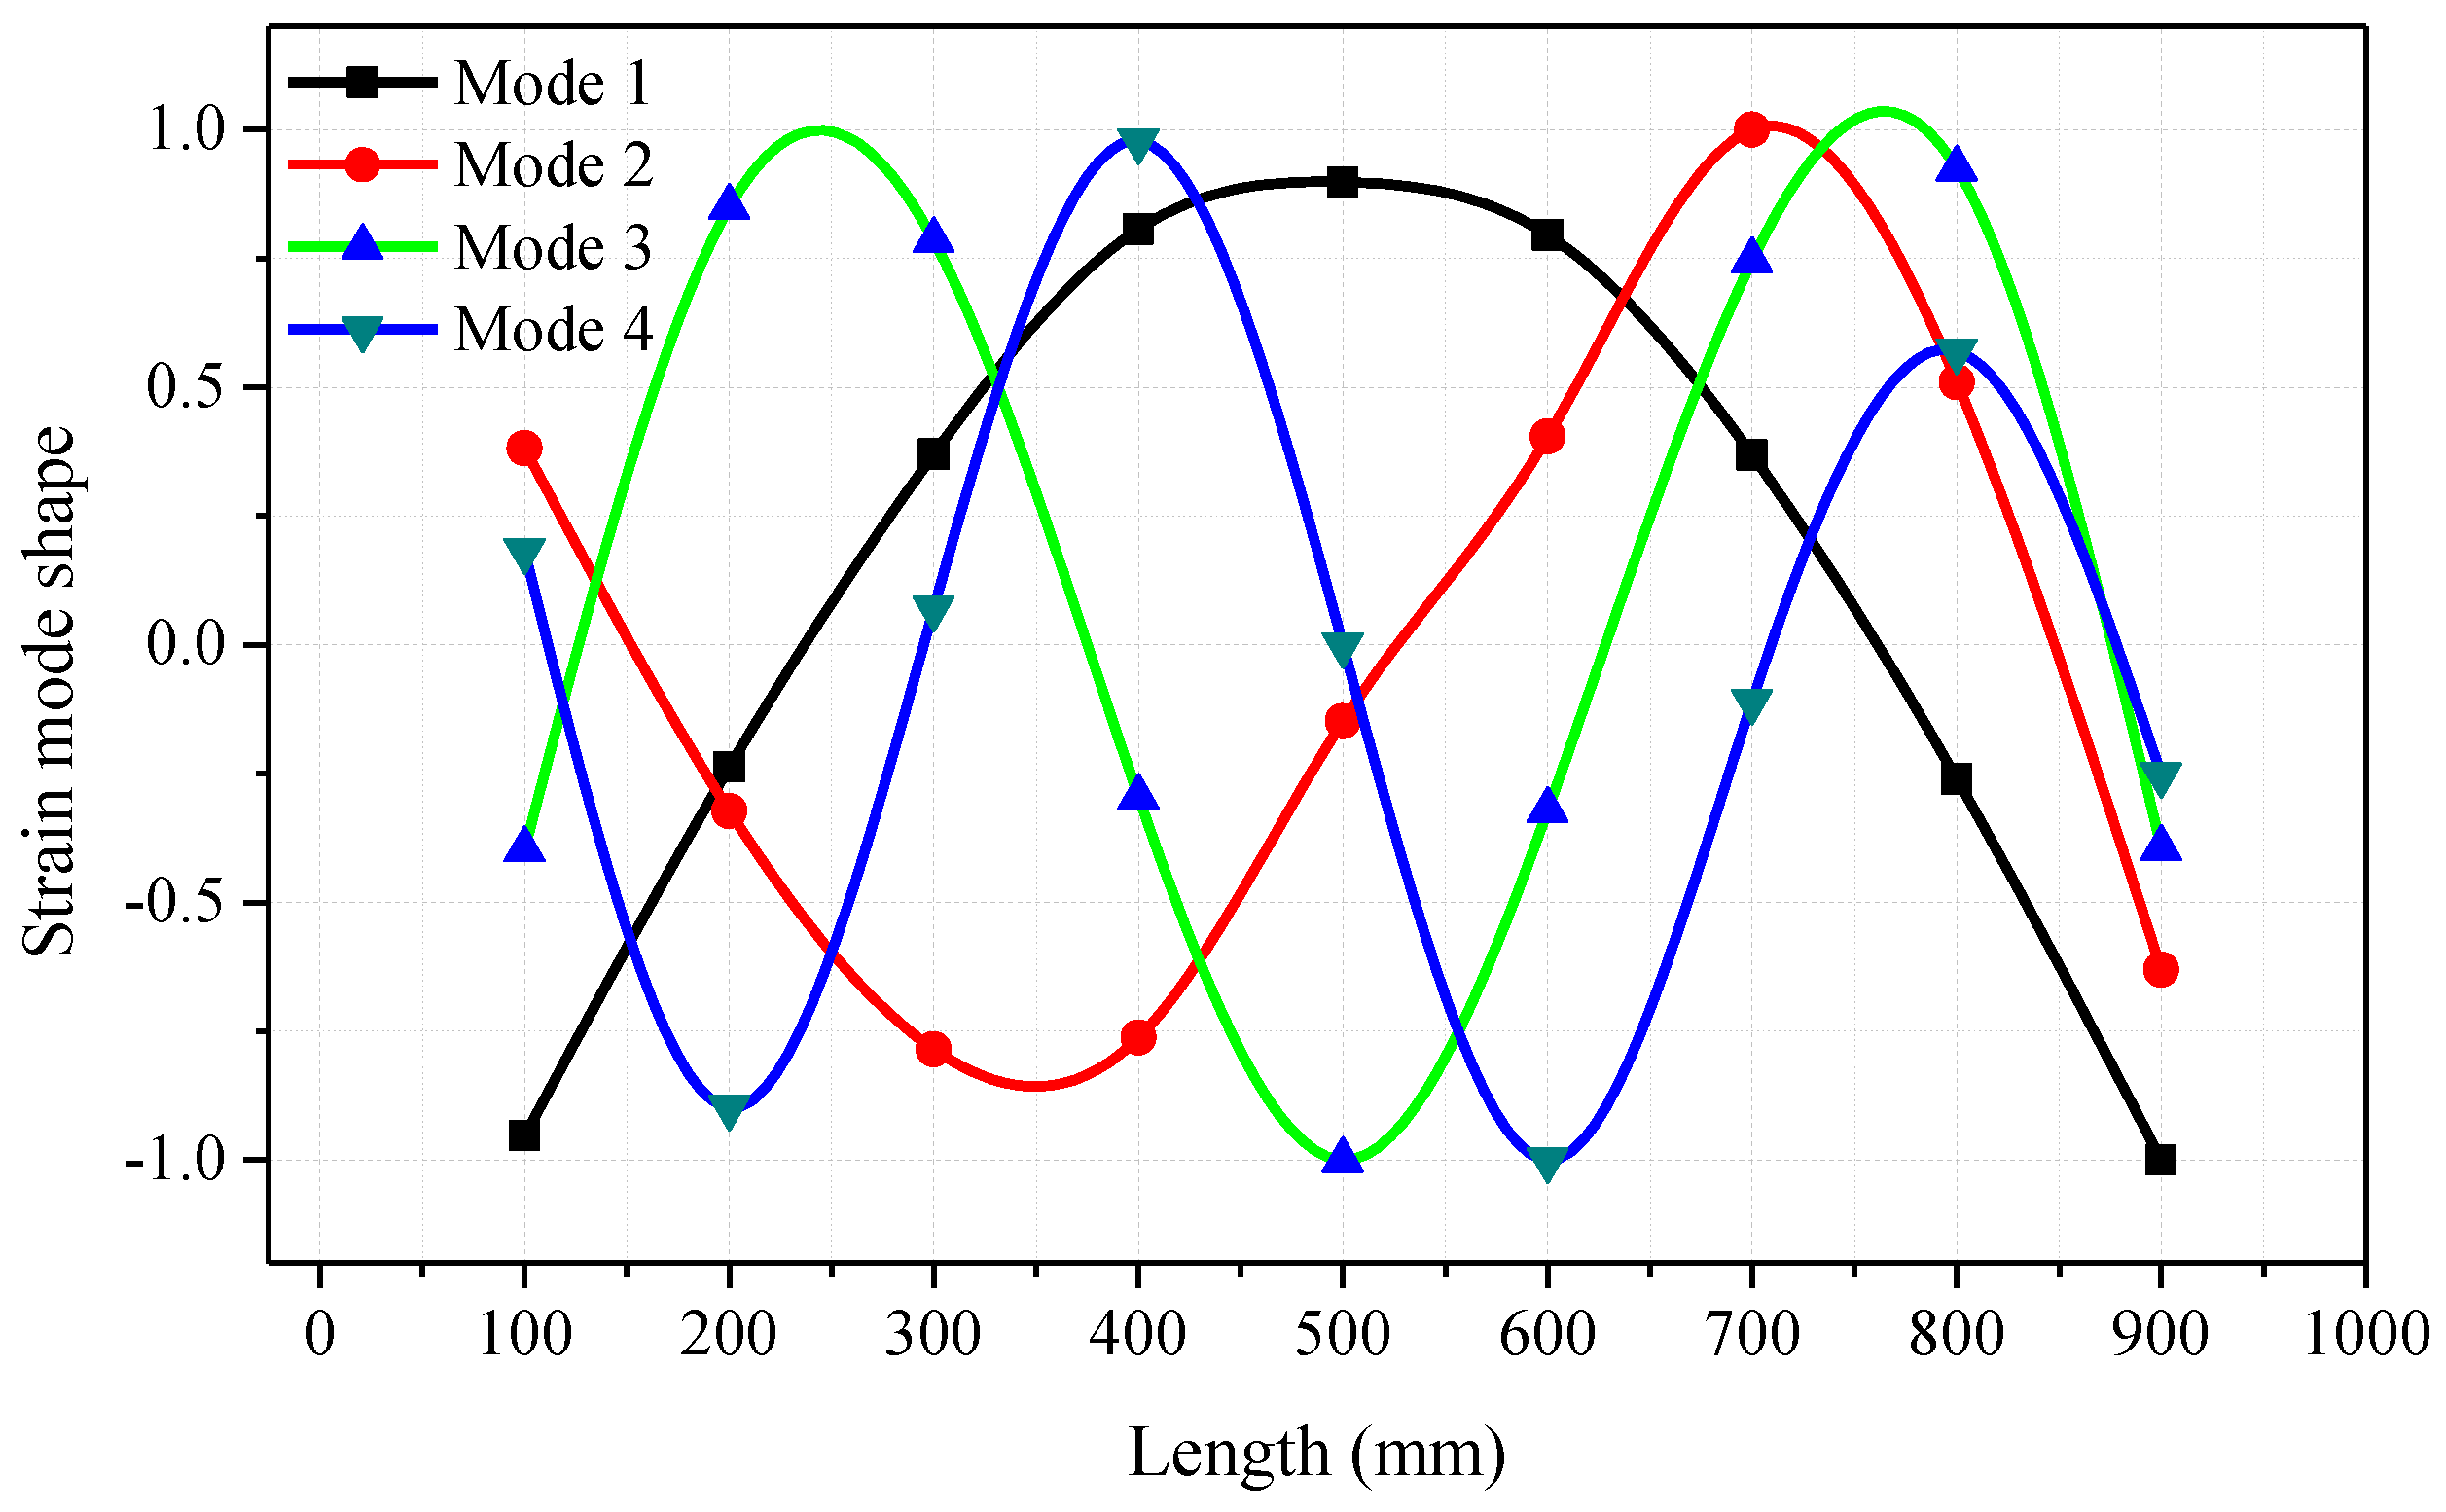
4. Results and Discussion
5. Application
6. Conclusions
Acknowledgments
Author Contributions
Conflicts of Interest
References
- Swamidas, A.; Chen, Y. Monitoring crack growth through change of modal parameters. J. Sound Vib. 1995, 186, 325–343. [Google Scholar] [CrossRef]
- Aenlle, M.; Skafte, A.; Fernández, P.; Brincker, R. Strain estimation in a glass beam using operational modal analysis. In Special Topics in Structural Dynamics, Volume 6; Allemang, R., De Clerck, J., Niezrecki, C., Wicks, A., Eds.; Springer: New York, NY, USA, 2013; pp. 375–382. [Google Scholar]
- Rovscek, D.; Slavic, J.; Boltezar, M. The use of strain sensors in an experimental modal analysis of small and light structures with free-free boundary conditions. J. Vib. Control 2012, 19, 1072–1079. [Google Scholar] [CrossRef]
- Huang, X.-F.; Liu, Y.; Luo, D.; Wang, G.-Q.; Ding, N.; Xu, J.-R.; Huang, X.-J. Wavelet analysis on vibration modal frequency measurement at a low level of strain of the turbine blade using FBG sensors. Meas. Sci. Technol. 2010, 21, 015305. [Google Scholar] [CrossRef]
- Huber, T.M.; Fatemi, M.; Kinnick, R.; Greenleaf, J. Noncontact modal analysis of a pipe organ reed using airborne ultrasound stimulated vibrometry. J. Acoust. Soc. Am. 2006, 119, 2476–2482. [Google Scholar] [CrossRef] [PubMed]
- Rovšček, D.; Slavič, J.; Boltežar, M. Operational mode-shape normalisation with a structural modification for small and light structures. Mech. Syst. Signal Process. 2014, 42, 1–13. [Google Scholar] [CrossRef]
- Cusano, A.; Cutolo, A.; Nasser, J.; Giordano, M.; Calabrò, A. Dynamic strain measurements by fibre Bragg grating sensor. Sens. Actuators A Phys. 2004, 110, 276–281. [Google Scholar] [CrossRef]
- Butz, R.C.; Dennison, C.R. In-Fiber Bragg Grating Impact Force Transducer for Studying Head-Helmet Mechanical Interaction in Head Impact. J. Lightwave Technol. 2015, 33, 2831–2838. [Google Scholar] [CrossRef]
- Mulle, M.; Moussawi, A.; Lubineau, G.; Durand, S.; Falandry, D.; Olivier, P. Response of fiber Bragg gratings bonded on a glass/epoxy laminate subjected to static loadings. Compos. Struct. 2015, 130, 75–84. [Google Scholar] [CrossRef]
- Panopoulou, A.; Loutas, T.; Roulias, D.; Fransen, S.; Kostopoulos, V. Dynamic fiber Bragg gratings based health monitoring system of composite aerospace structures. Acta Astronaut. 2011, 69, 445–457. [Google Scholar] [CrossRef]
- Frieden, J.; Cugnoni, J.; Botsis, J.; Gmür, T.; Ćorić, D. High-speed internal strain measurements in composite structures under dynamic load using embedded FBG sensors. Compos. Struct. 2010, 92, 1905–1912. [Google Scholar] [CrossRef]
- Lu, S.; Jiang, M.; Sui, Q.; Sai, Y.; Jia, L. Damage identification system of CFRP using fiber Bragg grating sensors. Compos. Struct. 2015, 125, 400–406. [Google Scholar] [CrossRef]
- Chen, J.T.; Zhou, Z.D.; Huang, J.; Chen, F.; Song, C.S.; Wei, Q. Frequency Measurement and Analysis on Liquid-Filled Pipe Based on Fiber Bragg Grating Sensor. In Advanced Materials Research; Trans Tech Publications: Zürich, Switzerland, 2015; pp. 161–167. [Google Scholar]
- Zhang, Y.; Yang, W. Bayesian strain modal analysis under ambient vibration and damage identification using distributed fiber Bragg grating sensors. Sens. Actuators A Phys. 2013, 201, 434–449. [Google Scholar] [CrossRef]
- Cusano, A.; Capoluongo, P.; Campopiano, S.; Cutolo, A.; Giordano, M.; Felli, F.; Paolozzi, A.; Caponero, M. Experimental modal analysis of an aircraft model wing by embedded fiber Bragg grating sensors. IEEE Sens. J. 2006, 6, 67–77. [Google Scholar] [CrossRef]
- Panopoulou, A.; Fransen, S.; Gomez-Molinero, V.; Kostopoulos, V. Experimental modal analysis and dynamic strain fiber Bragg gratings for structural health monitoring of composite antenna sub-reflector. CEAS Space J. 2013, 5, 57–73. [Google Scholar] [CrossRef]
- Dos Santos, F.; Peeters, B.; Gielen, L.; Desmet, W.; Góes, L. The Use of Fiber Bragg Grating Sensors for Strain Modal Analysis. In Topics in Modal Analysis, Volume 10; Mains, M., Ed.; Springer: Cham, Switzerland, 2015; pp. 93–101. [Google Scholar]
- Wada, D.; Igawa, H.; Kasai, T. Vibration monitoring of a helicopter blade model using the optical fiber distributed strain sensing technique. Appl. Opt. 2016, 55, 6953–6959. [Google Scholar] [CrossRef] [PubMed]
- Wang, Q.; Huang, J.; Liu, Q.; Zhou, Z. Dynamic strain measurement of hydraulic system pipeline using fibre Bragg grating sensors. Adv. Mech. Eng. 2016, 8. [Google Scholar] [CrossRef]
- Yam, L.Y.; Leung, T.P.; Li, D.B.; Xue, K.Z. Theoretical and experimental study of modal strain analysis. J. Sound Vib. 1996, 191, 251–260. [Google Scholar] [CrossRef]
- Kranjc, T.; Slavi, J.; Boltezar, M. A comparison of strain and classic experimental modal analysis. J. Vib. Control 2014. [Google Scholar] [CrossRef]
- Kang, L.-H.; Kim, D.-K.; Han, J.-H. Estimation of dynamic structural displacements using fiber Bragg grating strain sensors. J. Sound Vib. 2007, 305, 534–542. [Google Scholar] [CrossRef]
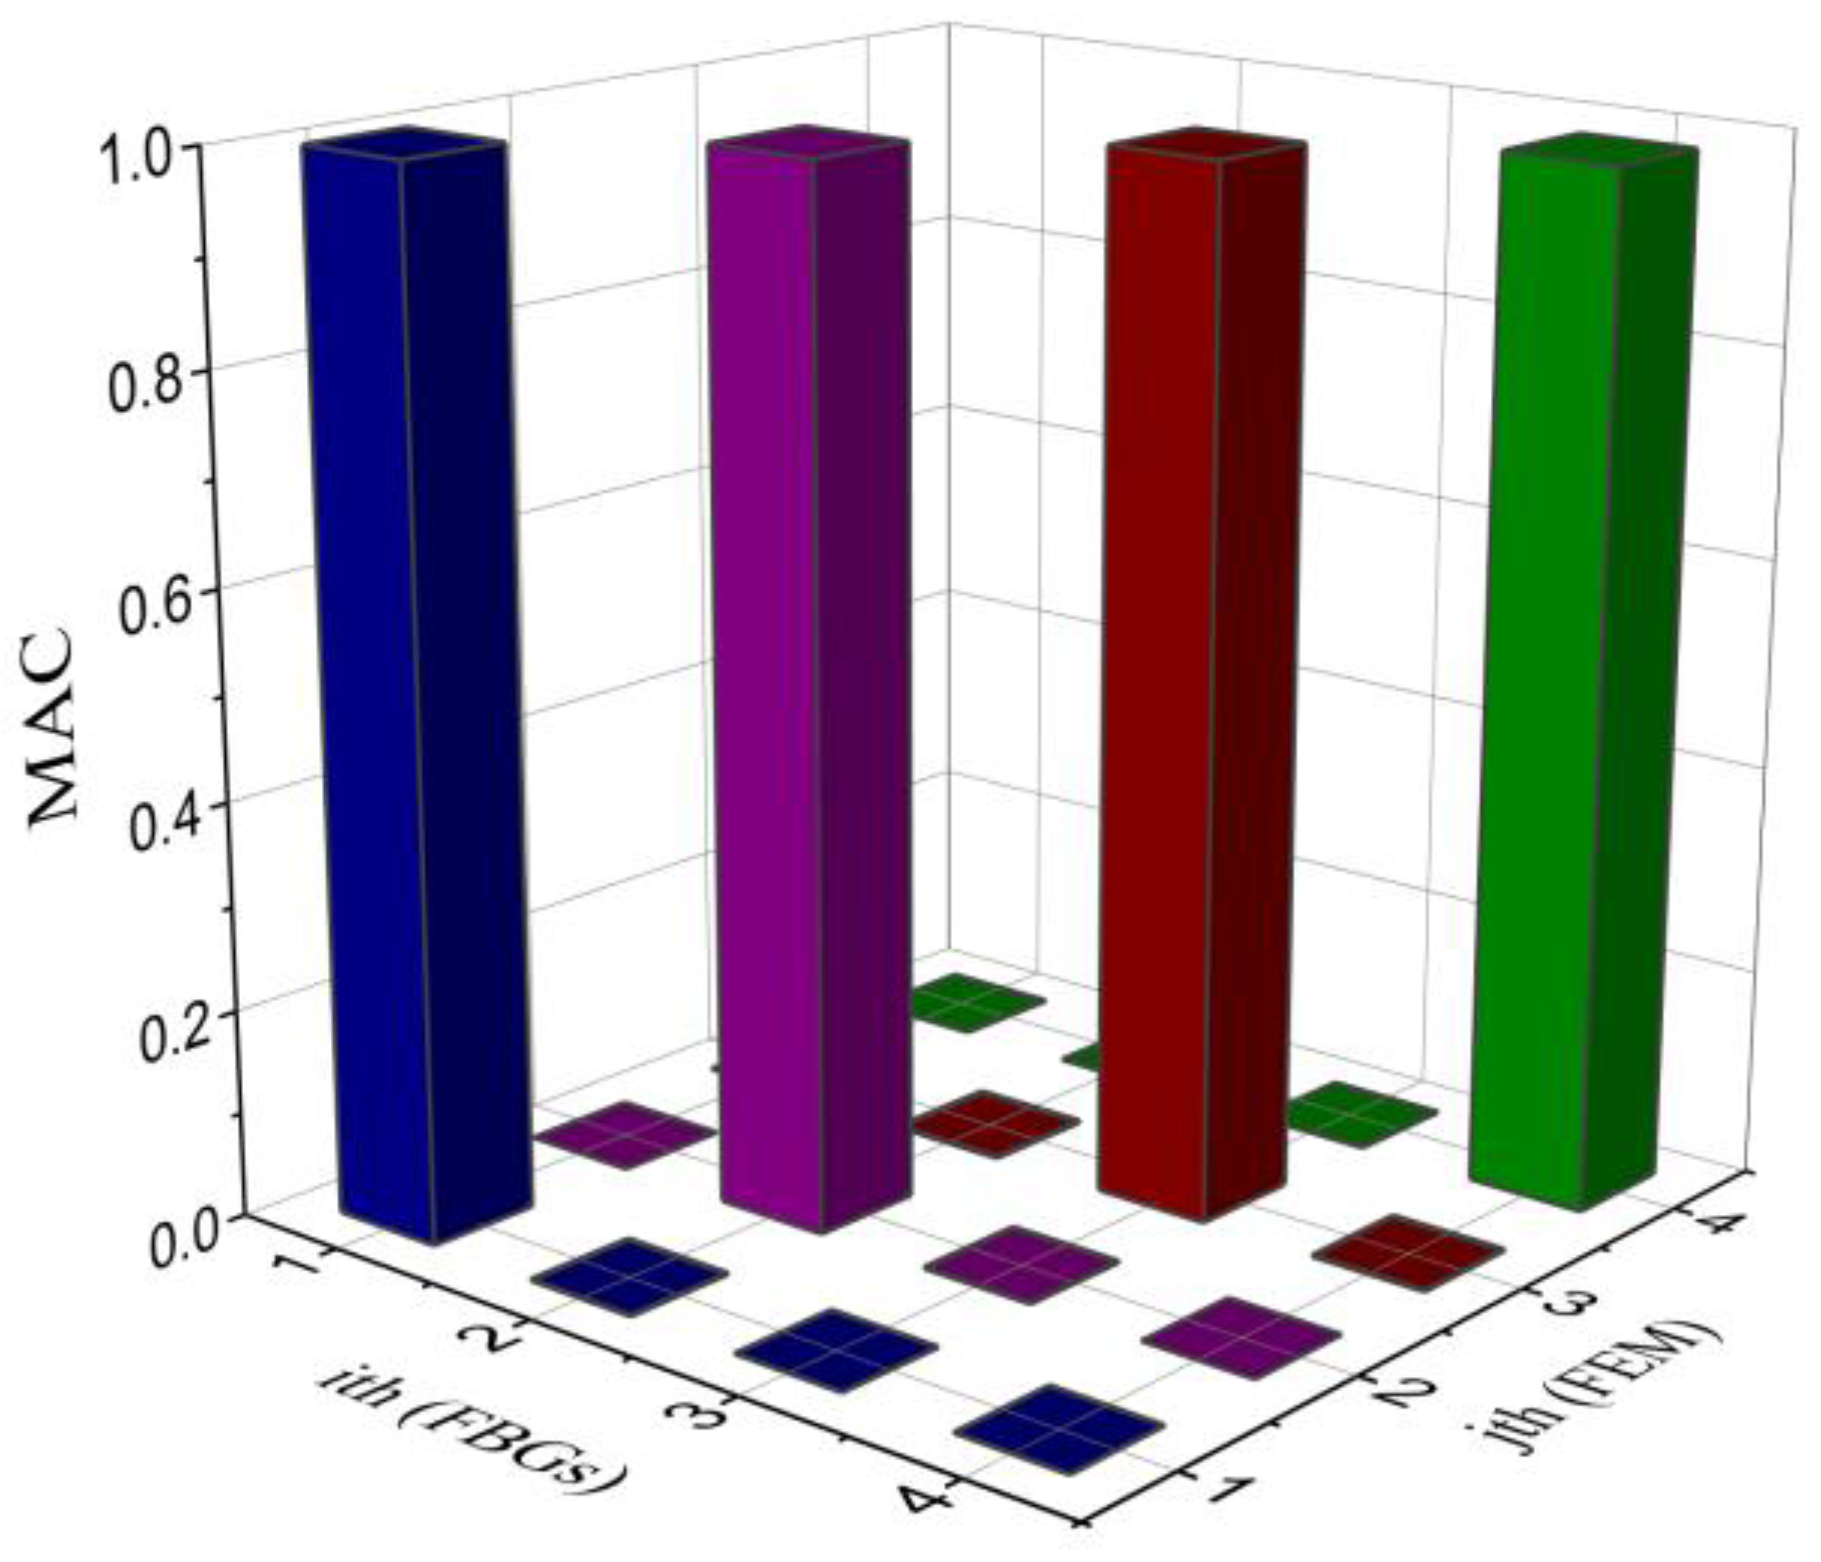
- Pastor, M.; Binda, M.; Harčarik, T. Modal Assurance Criterion. Procedia Eng. 2012, 48, 543–548. [Google Scholar] [CrossRef]


| Sensor Number | Wavelength (nm) | Distance from Fixed End (mm) |
|---|---|---|
| FBG1 | 1295.388 | 35 |
| FBG2 | 1290.417 | 125 |
| FBG3 | 1288.557 | 215 |
| FBG4 | 1309.855 | 305 |
| FBG5 | 1304.282 | 395 |
| FBG6 | 1298.596 | 485 |
| FBG7 | 1309.965 | 575 |
| FBG8 | 1288.398 | 665 |
| FBG9 | 1290.245 | 755 |
| FBG10 | 1304.615 | 845 |
| FBG11 | 1298.676 | 935 |
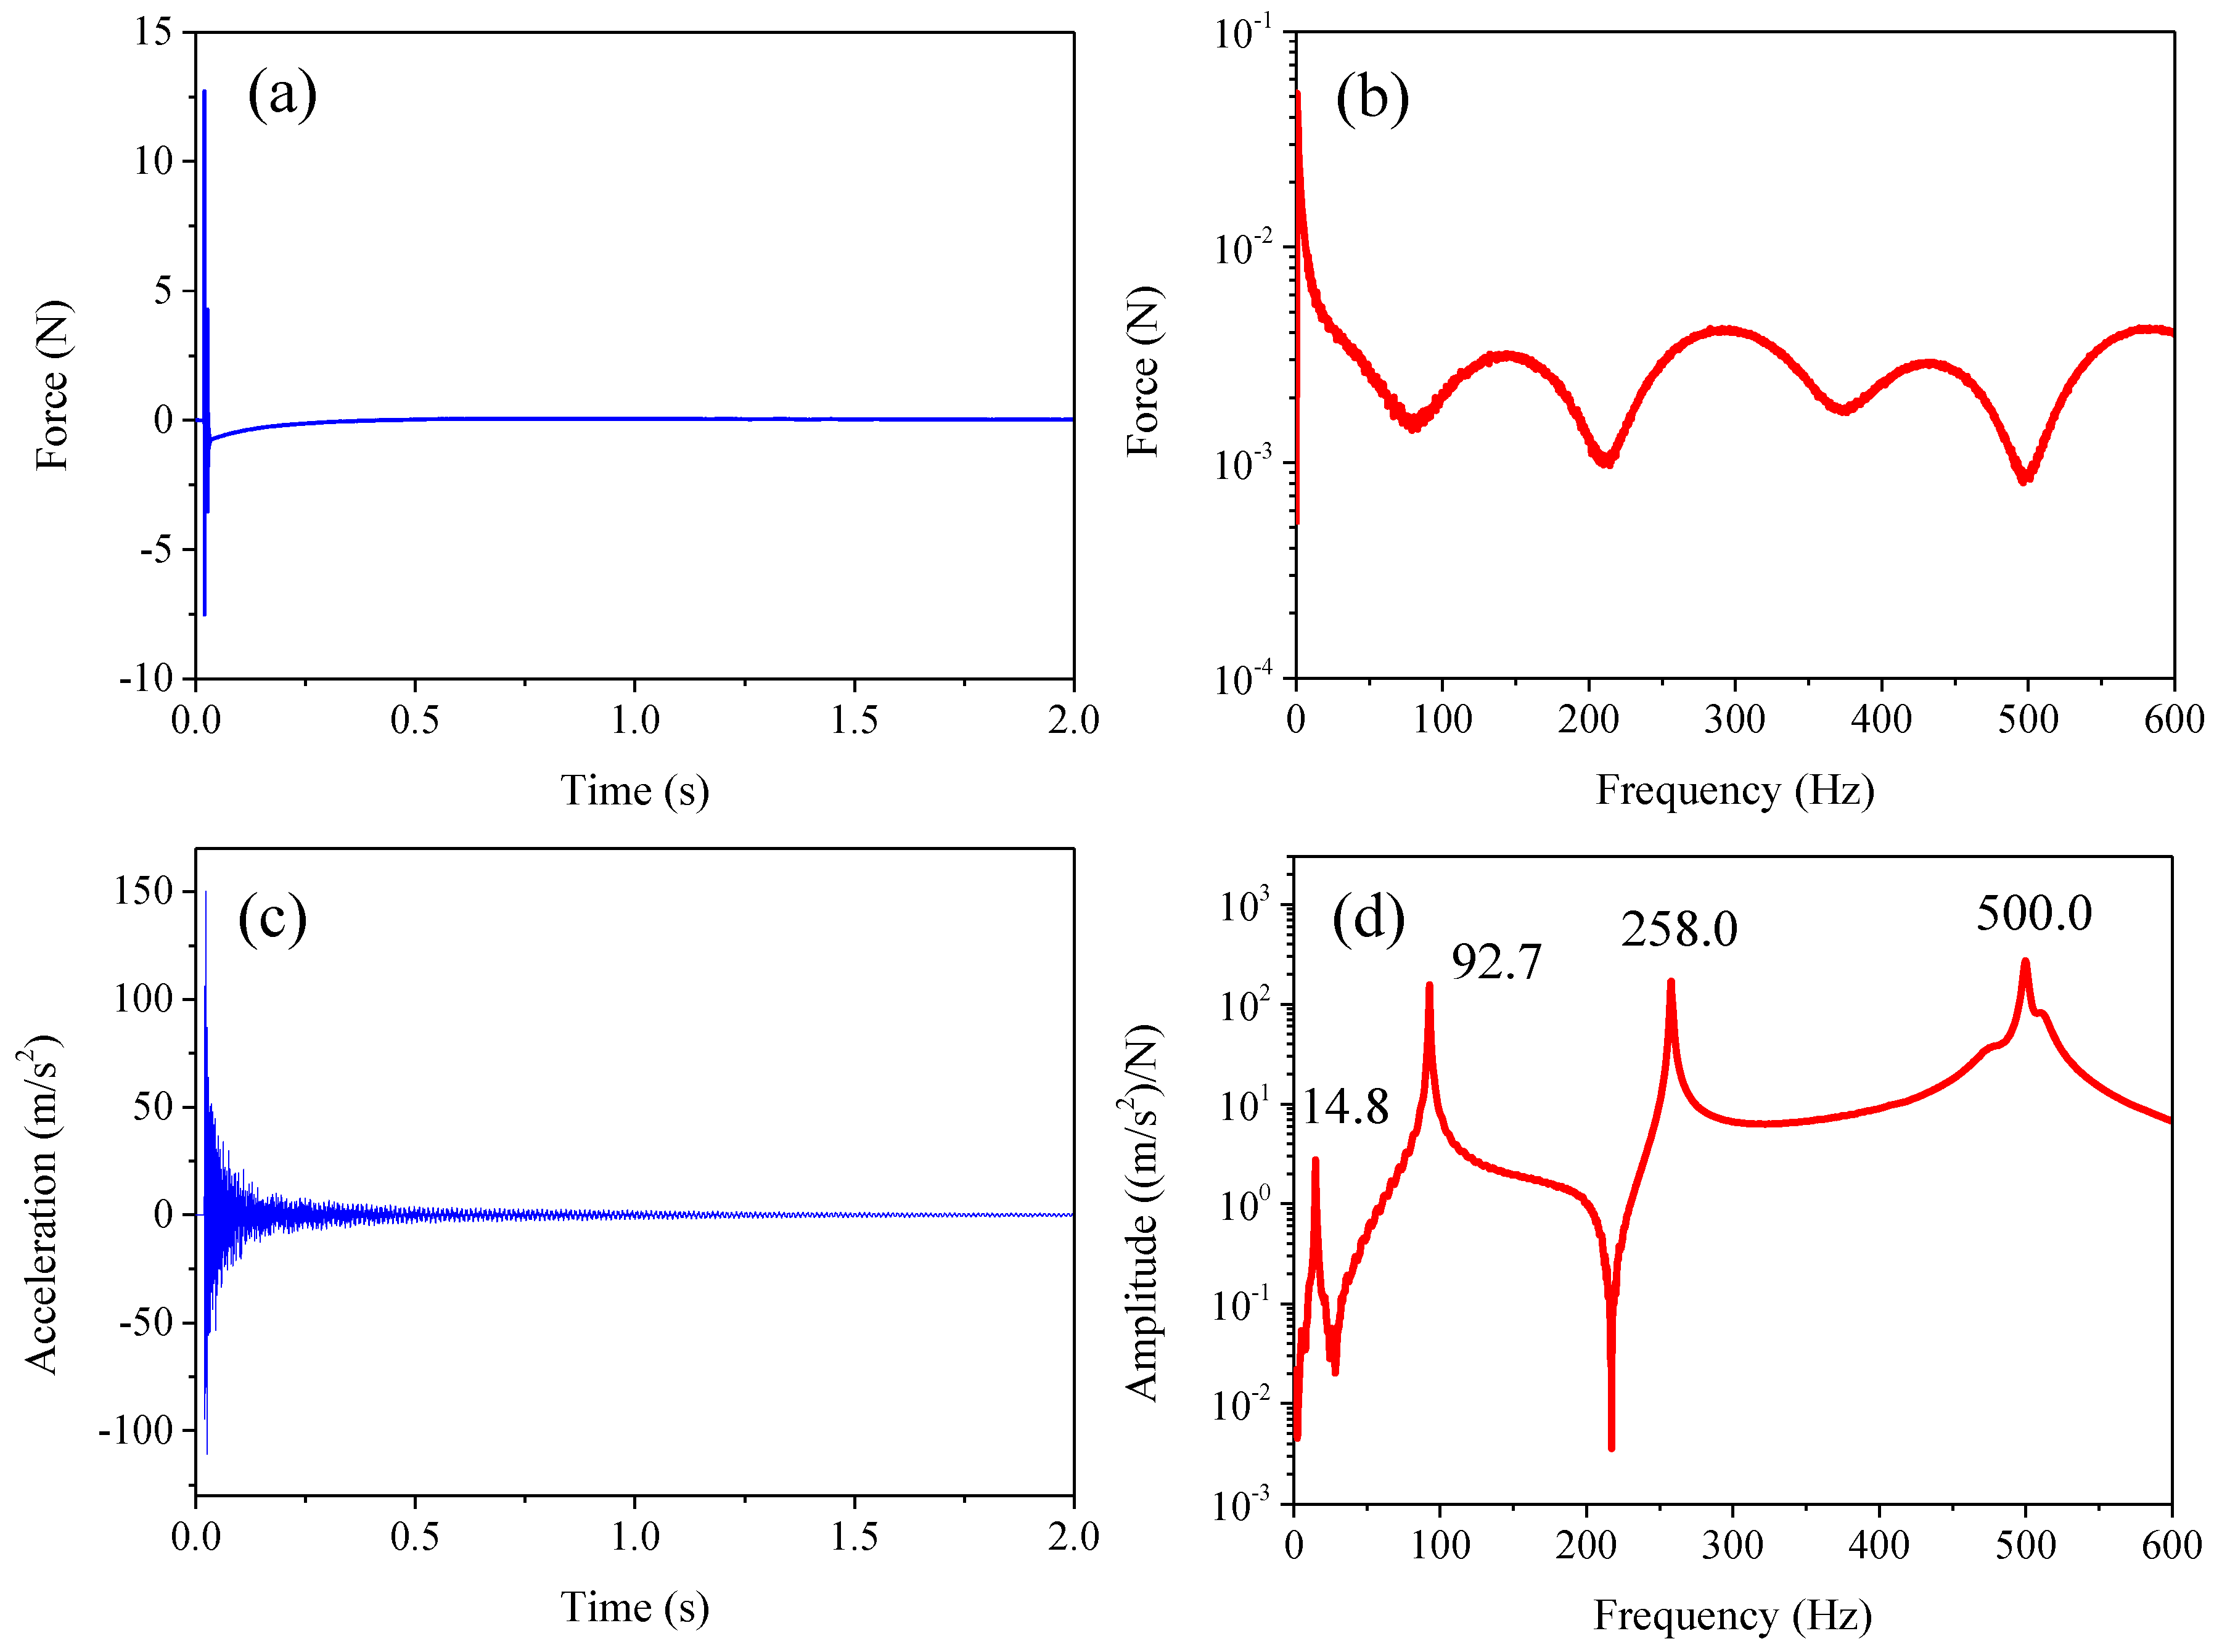
| Mode Number | Natural Frequency (Hz) | Damping Ratio (%) |
|---|---|---|
| 1 | 14.8 | 0.471 |
| 2 | 92.8 | 0.204 |
| 3 | 259.0 | 0.195 |
| 4 | 507.3 | 0.221 |
| Mode Number | Natural Frequency (Hz) | Damping Ratio (%) |
|---|---|---|
| 1 | 74.6 | 0.665 |
| 2 | 209.8 | 0.305 |
| 3 | 410.4 | 0.145 |
| 4 | 670.6 | 0.195 |
© 2016 by the authors; licensee MDPI, Basel, Switzerland. This article is an open access article distributed under the terms and conditions of the Creative Commons Attribution (CC-BY) license (http://creativecommons.org/licenses/by/4.0/).
Share and Cite
Huang, J.; Zhou, Z.; Zhang, L.; Chen, J.; Ji, C.; Pham, D.T. Strain Modal Analysis of Small and Light Pipes Using Distributed Fibre Bragg Grating Sensors. Sensors 2016, 16, 1583. https://doi.org/10.3390/s16101583
Huang J, Zhou Z, Zhang L, Chen J, Ji C, Pham DT. Strain Modal Analysis of Small and Light Pipes Using Distributed Fibre Bragg Grating Sensors. Sensors. 2016; 16(10):1583. https://doi.org/10.3390/s16101583
Chicago/Turabian StyleHuang, Jun, Zude Zhou, Lin Zhang, Juntao Chen, Chunqian Ji, and Duc Truong Pham. 2016. "Strain Modal Analysis of Small and Light Pipes Using Distributed Fibre Bragg Grating Sensors" Sensors 16, no. 10: 1583. https://doi.org/10.3390/s16101583
APA StyleHuang, J., Zhou, Z., Zhang, L., Chen, J., Ji, C., & Pham, D. T. (2016). Strain Modal Analysis of Small and Light Pipes Using Distributed Fibre Bragg Grating Sensors. Sensors, 16(10), 1583. https://doi.org/10.3390/s16101583